Article

Coordination Compounds of Nickel(II) with 3,5–Dibromo–Salicylaldehyde: Structure and Interaction with Biomolecules

by
Georgios I. Psarras
,
Ariadni Zianna
,
Antonios G. Hatzidimitriou
and
George Psomas
*
Department of General and Inorganic Chemistry, Faculty of Chemistry, Aristotle University of Thessaloniki, GR-54124 Thessaloniki, Greece
*
Author to whom correspondence should be addressed.
Inorganics 2024, 12(5), 138; https://doi.org/10.3390/inorganics12050138
Submission received: 17 April 2024 / Revised: 2 May 2024 / Accepted: 7 May 2024 / Published: 10 May 2024
(This article belongs to the Special Issue Metal-Based Compounds: Relevance for the Biomedical Field)

Abstract

:
Three neutral nickel(II) complexes of 3,5–dibromo–salicylaldehyde (3,5–diBr–saloH) were synthesized in the presence or absence of 1,10–phenanthroline (phen) or its derivative 2,9–dimethyl–1,10–phenanthroline (neoc) as co–ligands, namely [Ni(3,5–diBr–salo)2(neoc)] (complex 1), [Ni(3,5–diBr–salo)2(phen)] (complex 2) and [Ni(3,5–diBr–salo)2(H2O)2] (complex 3), and were characterized by various techniques. The crystal structure of [Ni(3,5–diBr–salo)2(neoc)] was determined by single-crystal X-ray crystallography. According to employed studying techniques, the complexes interact tightly with calf-thymus DNA by an intercalative fashion. Furthermore, compounds 1–3 bind tightly and reversibly to human and bovine serum albumin.

Graphical Abstract

1. Introduction

In medicinal chemistry, the quest for novel drugs is directed towards the synthesis and evaluation of either novel organic compounds that will operate as potential drugs or novel metal-based compounds incorporating (potentially) biologically active compounds as ligands [1,2]. An interesting group of bioactive molecules are the derivatives of salicylaldehyde. Salicylaldehyde or 2–hydroxy–benzaldehyde (saloH) is an organic compound found in the defensive secretion of some leaf beetle species [3]. Salicylaldehyde-based compounds are derivatives of saloH formed either by reactions through the carbonyl group leading to novel classes of compounds bearing the salicylaldehyde scaffold, such as Schiff bases [4,5,6,7], hydrazides [8,9], hydrazones [10,11,12,13], or thiosemicarbazones [14,15,16], or by the insertion of diverse substituents on one or more positions of the aromatic leading to substituted salicylaldehydes.
Halogens, nitro, alkyl, and alkoxy groups are the most common substituents (X) on the aromatic ring of salicylaldehydes leading to the formation of mono-substituted (X–saloH) or di-substituted salicylaldehydes (diX–saloH). Such modifications on the aromatic ring may alter the biological effect of the compounds [17,18]. In particular, the insertion of halogen substituents is important and may lead to ameliorated biological properties against bacteria and yeasts. It should be noted that halogen-containing compounds are almost 50% of the most active drugs [19] contributing to better membrane permeability [20]. 3,5–dibromosalicylaldehyde (3,5–diBr–saloH, Figure 1) is a dibromo-substituted salicylaldehyde which has been reported to inhibit the inositol-requiring enzyme 1, which may be related to the treatment of ischemic stroke [21,22].
Substituted salicylaldehydes can act as mono-, bi-, or even tri-dentate ligands when coordinating with metal ions and contribute to a wide spectrum of biological activity including DNA-interaction, albumin-binding, anticancer, antimicrobial, and antioxidant activity [19,23,24,25,26,27]. In the literature, the structures of diverse metal complexes with 3,5–dibromo–salicylaldehyde as ligand have been reported, including a series of mononuclear zinc(II) [28] and copper(II) [29] complexes and a tetranuclear nickel(II) complex [30]. In addition, a mononuclear palladium(II) complex with 3,5–dibromo–salicylaldehyde was also evaluated for its biological activity [31].
Nickel is an element involved in life evolution before the accumulation of oxygen [32]. However, the biological relevance of nickel is still significant [33,34], although nickel is deemed as dangerous for the health of nickel metallurgy workers [34,35,36,37] and responsible for diverse contact allergies related with nickel-coated jewelries and other routine objects [34,38]. Urease is an enzyme involved in the biological cycle of urea and is considered the most important nickel-bearing enzyme [33,34,39]. Nickel is also present in the active center of other metalloenzymes [32,33,34,40]. In modern bioinorganic chemistry, a significant number of nickel-based bioactive compounds have been reported [41,42] including examples presenting significant in vitro anticancer [43,44,45], antiepileptic [46], antifungal [47], anti–inflammatory [48], antimicrobial [49,50], and antioxidant [51,52,53,54] activity. In particular, nickel(II) complexes with substituted salicylaldehydes have recently gained an increasing interest regarding structural characterization and biological profile. More specifically, a plethora of mononuclear nickel(II) complexes with a series of substituted salicylaldehydes, such as the mono-substituted ones 5–chloro–salicylaldehyde, 5–bromo–salicylaldehyde, 5–fluoro–salicylaldehyde, 3–methoxy–salicylaldehyde, 5–methyl–salicylaldehyde, and 5–nitro–salicylaldehyde, and the di-substituted derivative 3,5–dichloro–salicylaldehyde, have been reported in the literature, and their interaction with biomacromolecules and antibacterial activity has been evaluated [55,56,57]. Furthermore, heterocubane-like nickel(II) complexes of dihalogen-substituted salicylaldehydes (i.e., 3,5–dichloro–salicylaldehyde, 3,5–iodo–salicylaldehyde, 3,5–dibromo–salicylaldehyde, and 3–bromo–5–chloro–salicylaldehyde) bearing the formula [Ni4(diX–salo)43–OMe)4(MeOH)4] have been recently reported by M. Aryaeifar et al. [30].
As a continuation of our research concerning metal complexes of substituted salicylaldehydes, three novel neutral mononuclear Ni(II) complexes of 3,5–diBr–saloH in the presence or absence of the N,N′–donors 2,9–dimethyl–1,10–phenanthroline (neocuproine, neoc) and 1,10–phenanthroline (phen) (Figure 1), formulated as [Ni(3,5–diBr–salo)2(neoc)] (complex 1), [Ni(3,5–diBr–salo)2(phen)] (complex 2) and [Ni(3,5–diBr–salo)2(H2O)2] (complex 3), were synthesized. The characterization of complexes 1–3 was afforded by physicochemical and spectroscopic (FT-–IR and UV–vis) techniques. In addition, the molecular structure of [Ni(3,5–diBr–salo)2(neoc)] was determined by single-crystal X-ray crystallography. The interaction of compounds 1–3 with calf-thymus (CT) DNA was evaluated by DNA viscosity measurements and UV–vis spectroscopy titration studies, and through the ability to replace ethidium bromide (EB) in the EB–DNA adduct. The affinity of the compounds for bovine serum albumin (BSA) and human serum albumin (HSA) was monitored by fluorescence emission spectroscopy, and the corresponding binding constants were calculated.

2. Results

2.1. Synthesis and Characterization

Complexes 1–3 were efficiently synthesized in methanol through the aerobic reaction of NiCl2·6H2O with the sodium salt of 3,5–dibromo–salicylaldehyde (generated in situ by the addition of CH3ONa) in the presence or absence of the N,N′–donors. In all cases, a 1:2 Ni2+:(3,5–diBr–salo) ratio was employed, while for complexes 1 and 2, the corresponding N,N′–donor (neoc, phen) was added in a 1:2:1 Ni2+:(3,5–diBr–salo):(N,N′–donor) ratio (Figure 2). The characterization of the resulting complexes 1–3 was achieved through physicochemical and spectroscopic techniques (FT-IR and UV–vis), and, especially for complex 1, by single-crystal X-ray crystallography.
According to the molar conductivity values of the complexes in 1 mM of DMSO solution found in the range 10–15 mho∙cm2∙mol−1, complexes 1–3 are neutral in nature [58], possessing a 1:2:1 Ni(II):(3,5–diBr–salo):(N,N′–donor) composition (complexes 1 and 2) or a 1:2 Ni(II):(3,5–diBr–salo) composition (complex 3). Room-temperature (RT) magnetic measurements performed for complexes 1–3 derived μeff values in the range 2.90–3.00 BM, which were slightly higher than the RT spin-only values (=2.83 BM) and confirmed the mononuclear nature of the complexes in solid state [33]. These data were also confirmed by elemental analyses data and were in good agreement with the suggested molecular formulas.
The FT-IR spectra (Figure S1) confirmed the deprotonation and the coordination mode of 3,5–dibromo–salicylaldehyde, as well as the presence of the N,N′–donor co-ligands in the complexes (complexes 1 and 2). In the IR spectrum of free 3,5–diBr–saloH, the sharp bands located at ~3200 cm−1 and ~1400 cm−1 are assigned to the vibrations of the phenolic –OH. The first band disappears in the spectra of the complexes, indicating the deprotonation of the salicylaldehyde, while the second one is shifted towards 1315–1340 cm−1, implying the coordination through the phenolic oxygen (C–O→Ni). The band at 1679 cm−1 attributed to the ν(C=O) in the free 3,5–diBr–saloH [28,29] is shifted to lower wavenumbers (1622–1647 cm−1), revealing its coordination with the metal through the carbonyl oxygen [59]. For complexes 1 and 2, the band attributed to the characteristic out-of-plane ρ(C–H) vibrations of the N,N′–donor ligand is observed at 726 cm−1 and 732 cm−1, respectively [59].
The electronic spectra of complexes 1–3 were recorded both in solid state (in the form of nujol mull) and in DMSO solution (and over time intervals spanning up to three days) in order to evaluate their stability in solution and during time (Figures S2 and S3). For the solution investigations, the complexes were dissolved either in DMSO or a DMSO:buffer (150 mM of NaCl and 15 mM of trisodium citrate, pH = 7) mixture. In the visible region of the spectra of complexes 1–3 in DMSO, three bands attributed to d–d transitions were located at 1025–1040 nm (ε = 5–10 M−1cm−1), 630–670 nm (ε = 25–70 M−1cm−1), and 420–422 nm (ε = 1260–1300 M−1cm−1) and may be assigned to 3A2g3T2g, 3A2g3T1g(F) and 3A2g3T1g(P) transitions, respectively [33]. These three d–d bands are characteristic for octahedral nickel(II) complexes [33]. The values of 10Dq and the Racah B parameters were also determined. The existence of these bands attributed to d–d transitions as well as the values of the ratio 10Dq/B (which were calculated in the range 14.0–15.5) are characteristic for distorted octahedral Ni2+ complexes [33,57,60].
The overall behavior of complexes 1–3 in solution (the similarity with electronic spectra in solid state and the non-electrolytic nature according to the molar conductivity measurements) serves also as evidence of their stability in solution.

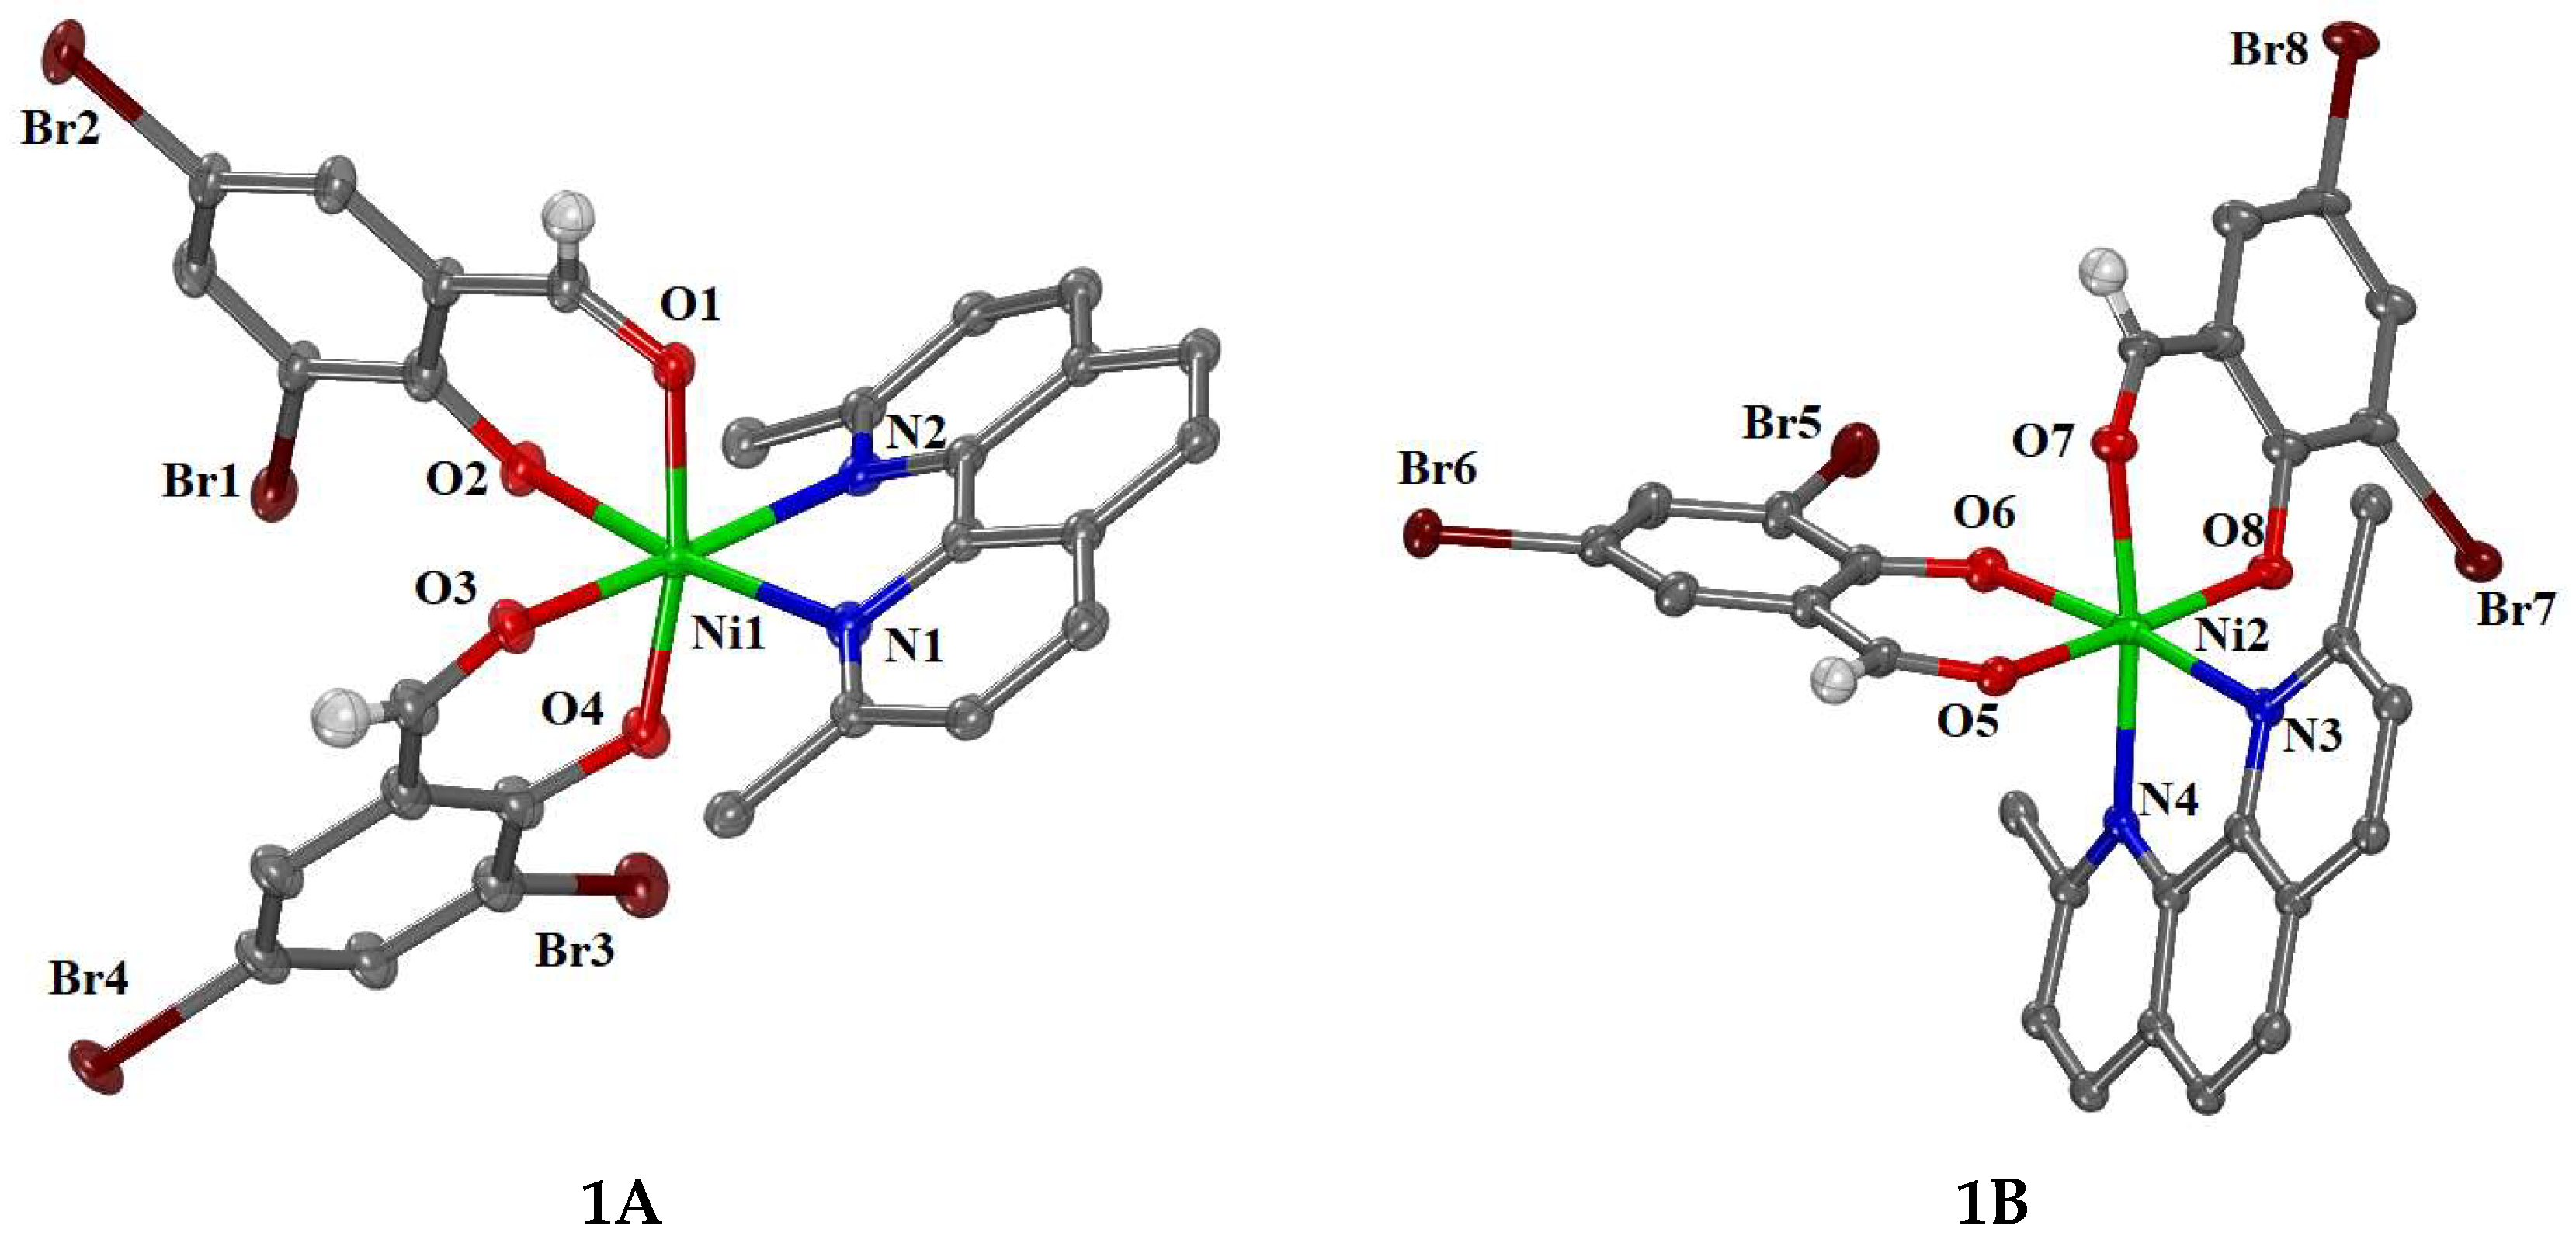
2.2. Structure of the Complexes

Among the complexes under study, single-crystals were obtained only for [Ni(3,5–diBr–salo)2(neoc)] (complex 1), and the molecular structure was determined by single-crystal X-ray crystallography. The experimental X-ray crystallography details for this compound are summarized in Table 1. Complex 1 crystallized in the monoclinic crystal system and P21/c space group. The molecular structure of the complex is depicted in Figure 3, and selected bond lengths and angles are summarized in Table 2.
The asymmetric unit of complex 1 contains two crystallographically independent complex molecules notated as A and B, i.e., 1A and 1B, respectively. In both complexes, the 3,5–diBr–salo ligands are deprotonated and coordinate bidentately to Ni(II) ions through the phenolato oxygens (O2 and O4 in 1A; O6 and O8 in 1B) and the aldehyde (O1 and O3 in 1A; O5 and O7 in 1B) oxygen atoms forming six-membered chelate rings (the chelate Ophenolato–Ni–Oaldehydo angles are in the range 86.99(16)–89.41(17)°).
The Ni(II) ions are six-coordinate with a NiN2O4 chromophore and a distorted octahedral geometry. Four of the six vertices of the octahedron are occupied by the oxygen atoms of the 3,5–diBr–salo ligands and the remaining two sites by the nitrogen atoms of the neoc ligand. In both complexes, the Ni–Ophenolato (1.953(4)–2.037(4) Å) are the shortest and the Ni–Nneoc (2.103(5)–2.160(5) Å) are the longest bond lengths in the coordination sphere. In both complexes (1A and 1B), the corresponding oxygen atoms are lying at cis positions to each other (Ophenolato–Ni–Ophenolato = 85.41(18)–86.70(16)°; Oaldehydo–Ni–Oaldehydo = 85.80(18)–94.37(17)°).
Such cis arrangement of the phenolato and aldehyde oxygen atoms around the metal ion is the least often found in the crystal structures of complexes bearing the formula [M(X–salo)2(N,N′–donor)] reported so far. In addition to complex 1, this arrangement has been observed in the structures of [Zn(3,5–diCl–salo)2(bipyam)] (3,5–diCl–saloH = 3,5–dichloro–salicylaldehyde; bipyam = 2,2′–bipyridylamine) [27], [Mn(5–NO2–salo)2(phen)], and [Mn(5–NO2–salo)2(bipy)] (5–NO2–saloH = 5–nitro–salicylaldehyde; bipy = 2,2′–bipyridine) [61]. The most often case is the arrangement of the phenolato oxygen atoms in trans positions, as found in a series of Zn(II) [26,28,62], Cd(II) [63,64], and Co(II) [65,66,67,68] mononuclear complexes. Quite often found is the trans arrangement of the aldehyde oxygens, as reported in a series of Zn(II) [62], Mn(II) [24,61], Cd(II) [64], and Co(II) [68] complexes. It should also be noted that complex 1 is the first neutral Ni(II) complex bearing X–salo and N,N′–donor ligands that is structurally characterized by X-ray crystallography; till now, the reported crystal structures refer to cationic Ni(II) complexes of the general formula [Ni(X–salo)(N,N′–donor)2]+ [55,56,57].
From the experimental data collected from elemental analysis, RT magnetic and ΛM measurements, infrared and electronic spectroscopies, and from a comparison with similar reported crystal structures, the structures for complexes 2 and 3 may be proposed (Figure 2). In both compounds, the deprotonated 3,5–diBr–salo ligands are coordinated to Ni(II) ions in a bidentate mode through the aldehydo and phenolato oxygen atoms. In complex 2, a NiN2O4 coordination sphere is expected around Ni(II) formed by two bidentate 3,5–diBr–salo ligands and a bidentate phen ligand leading to a structure (Figure 3) similar to that of complex 1 and other reported complexes with formula [M(X–salo)2(N,N′–donor)] [24,26,27,28,61,62]. On the other hand, complex 3 is expected to have a NiO6 coordination sphere originated from the coordination of two bidentate 3,5–diBr–salo and two methanol ligands and a structure (Figure 2) similar to those reported for complexes [Ni(3,5–diCl–salo)2(H2O)2] [57], [Ni(5–Cl–salo)2(CH3OH)2] (5–Cl–saloH = 5–chloro–salicylaldehyde), and [Ni(5–Br–salo)2(CH3OH)2] (5–Br–saloH = 5–bromo–salicylaldehyde) [56].

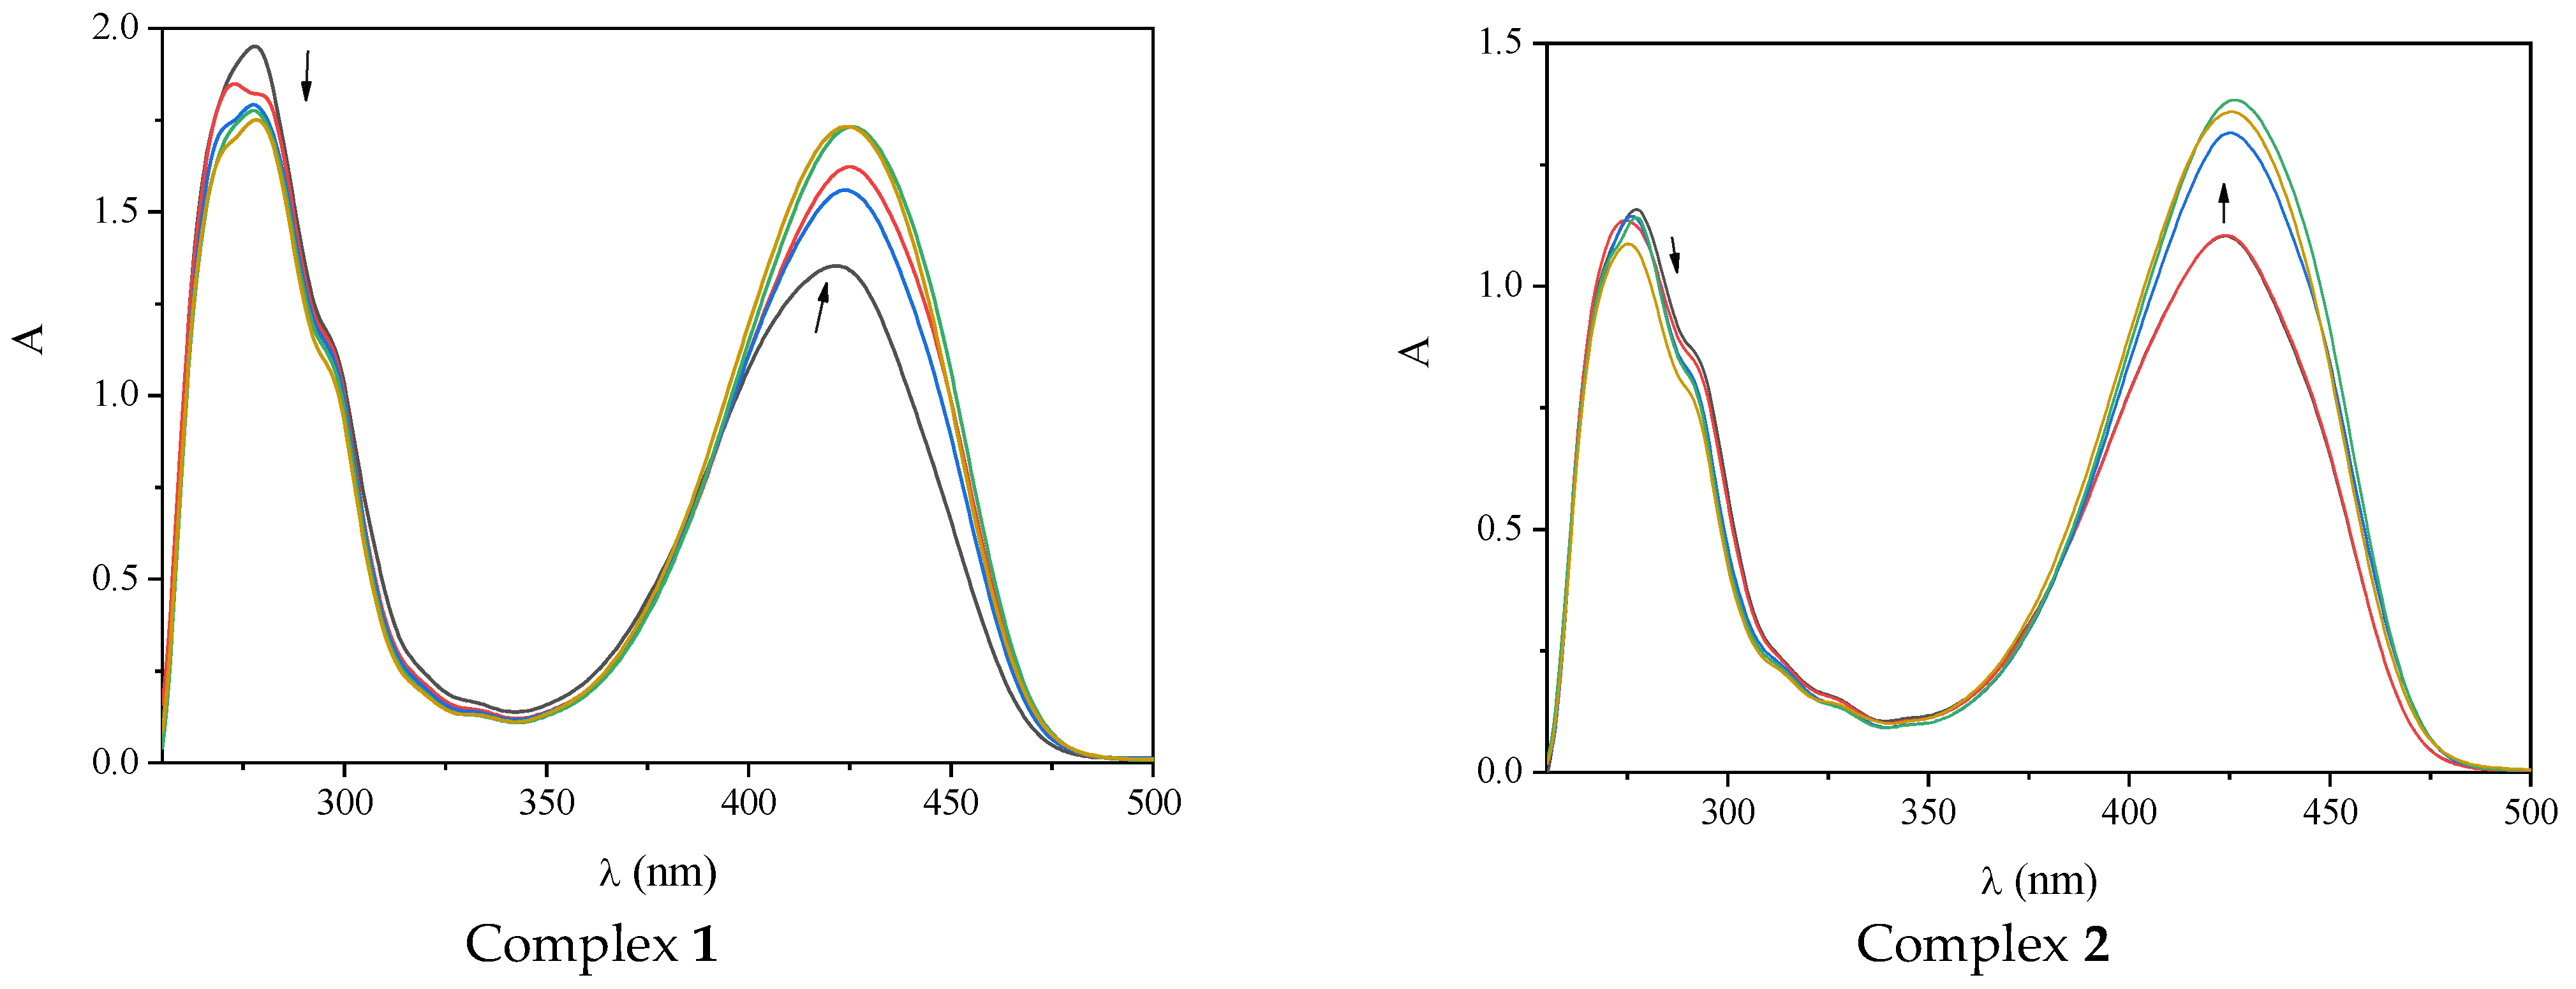
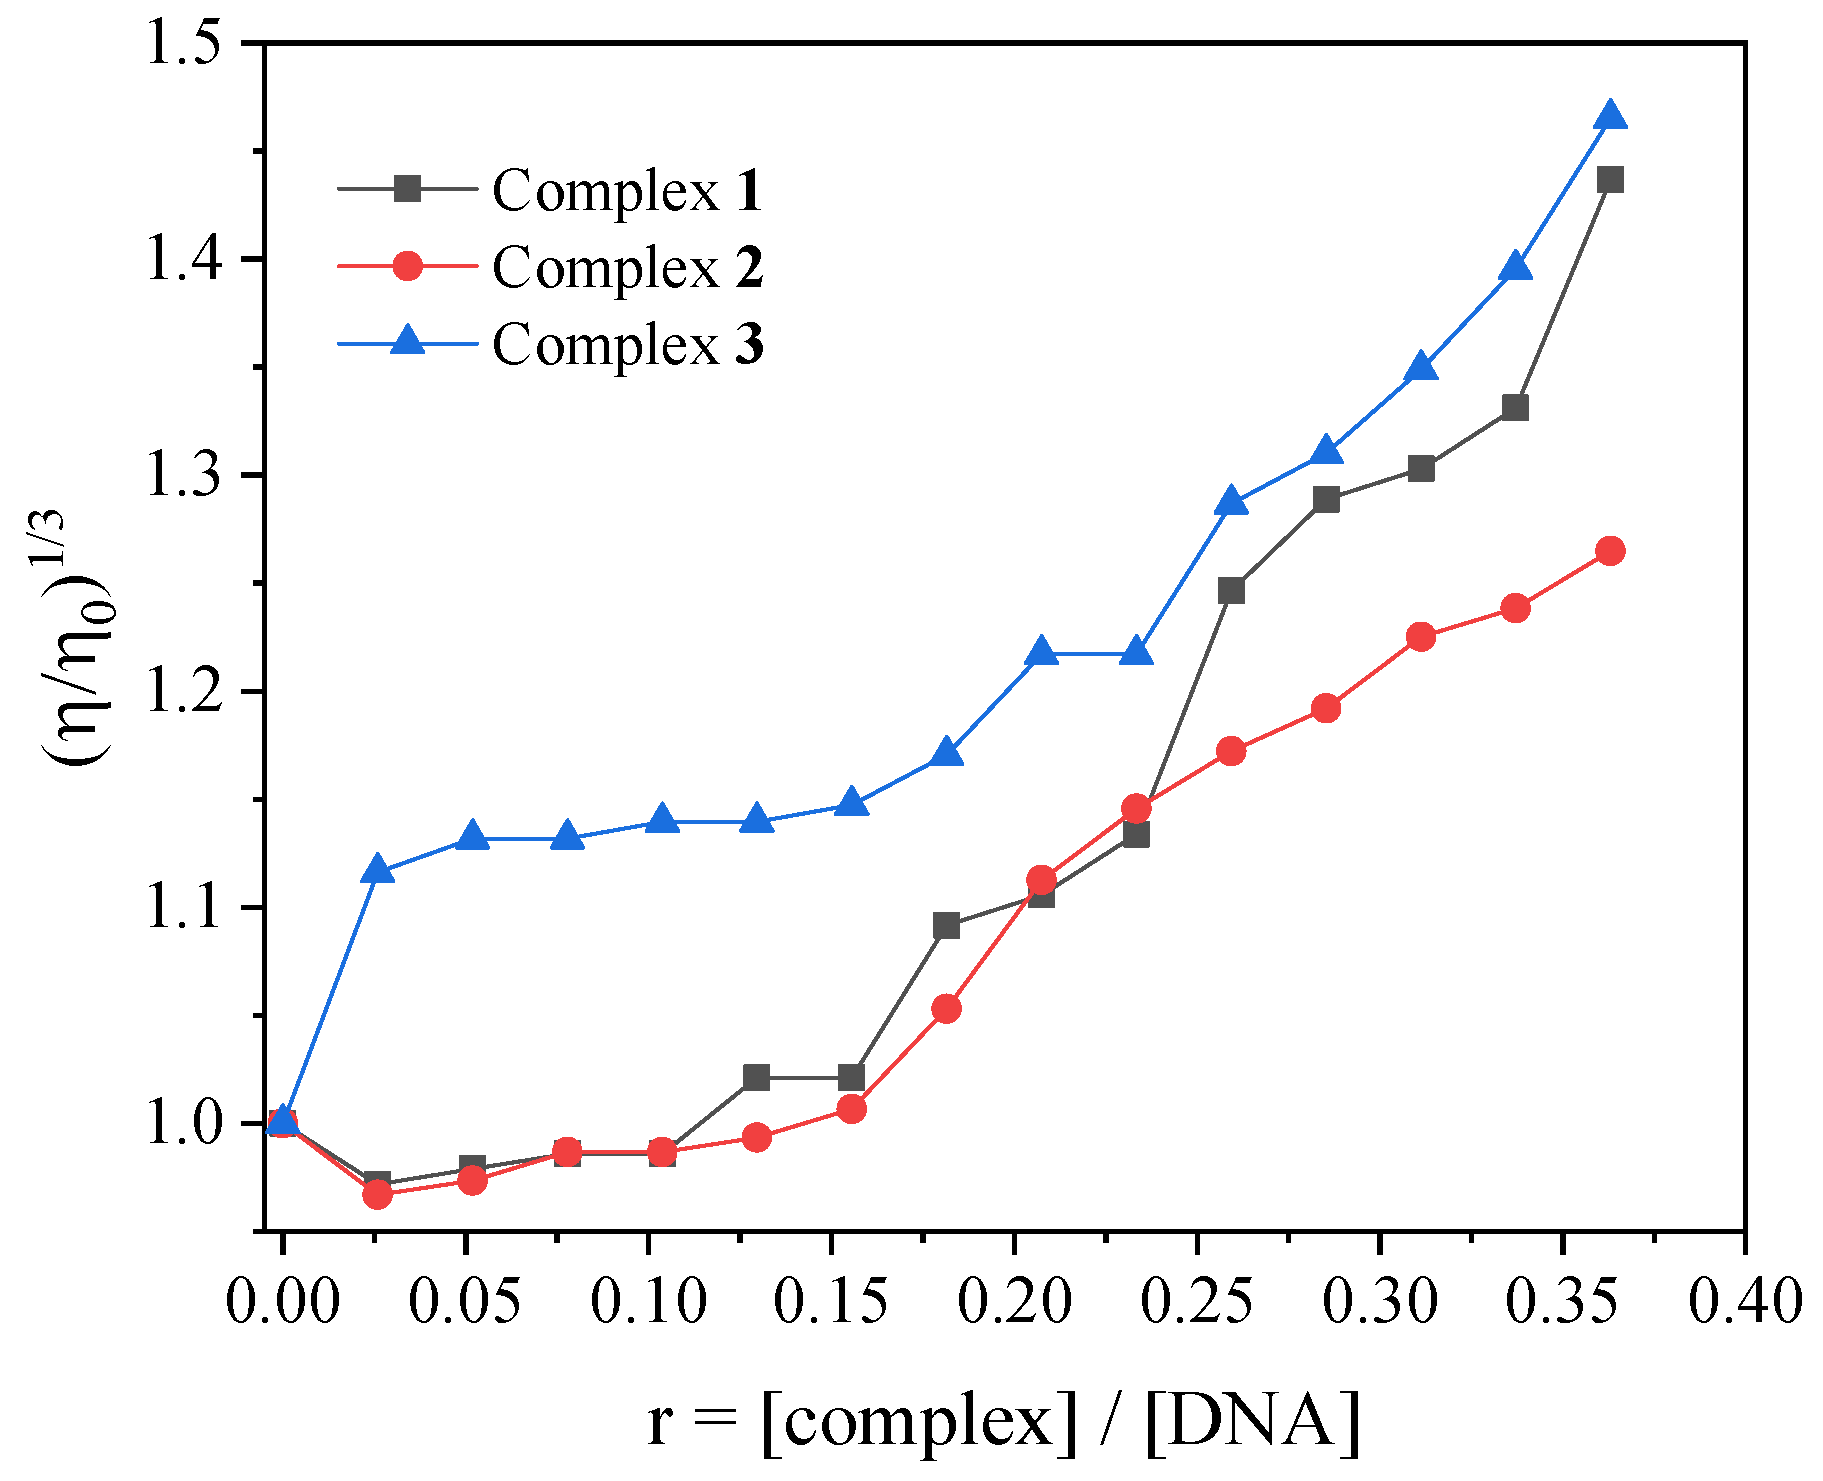
2.3. Interaction of the Complexes with CT DNA

Coordination compounds can interact with linear DNA through either covalent (base-binding) or noncovalent mechanisms (intercalation, electrostatic interactions, groove-binding) or may induce cleavage in the DNA helix [69]. The interaction between complexes 1–3 and CT DNA was explored by UV–vis spectroscopy and viscosity measurements, and via their ability to displace EB for EB–DNA adduct, which was monitored by fluorescence emission spectroscopy.
UV–vis spectroscopy is used preliminarily to obtain information regarding the DNA-interaction of the complexes and to determine the corresponding DNA-binding constant (Kb). In the UV–vis spectra of complexes 1–3, two main bands were located in the regions 277–278 nm and 422–425 nm. Upon addition of a CT DNA solution, these two bands exhibited a hypochromism and a hyperchromism, respectively, accompanied by a slight red shift in most cases (Figure 4, Table 3). These spectral changes are indicative of interaction between the complexes and CT DNA, although drawing a definitive conclusion for the type of this interaction is not feasible. Consequently, additional experiments, such as viscosity and EB-displacement studies, were undertaken to shed light on the DNA interaction mode of the complexes [70,71].
The DNA-binding constants of complexes 1–3 (Kb) were calculated with the Wolfe–Shimer equation (Equation (S1)) [72] and the corresponding plots of [DNA]/(εA–εf) vs. [DNA] (Figure S4). The calculated Kb values indicate a strong binding affinity of the complexes to DNA and are higher than that of the known intercalator EB (Kb = 1.23 × 10⁵ M−1) [73], showing that complexes 1–3 may be tighter DNA-binders than EB. The DNA-binding constants of complexes 1–3 are in the range 2.83(±0.70) × 105–4.22(±0.86) × 105 M−1 and are of the same magnitude with those calculated for a series of coordination compounds bearing substituted salicylaldehydes as ligands [24,25,26,27,28,57,61,62,63,64,74].
The DNA-interaction mode of the complexes was also evaluated by viscosity measurements. When a compound intercalates into the double DNA-helix, the nitrogen DNA-base pairs are separated, leading to an increase in DNA-length and, consequently, an increase in the DNA-viscosity. On the other hand, a compound interacting externally with DNA may cause DNA bending, leading to a slight decrease in DNA-length and, consequently, a slight decrease in DNA-viscosity. When a compound induces cleavage of a DNA-helix, much shorter fragments will be produced, resulting in a significant decrease in DNA-viscosity [75].
In the present case, the viscosity changes in a CT DNA solution (0.1 mM) were recorded in the presence of increasing amounts of complexes 1–3 (Figure 5). For complexes 1 and 2, the initial incremental addition (up to r~0.12) resulted in a slight decrease in DNA-viscosity, thus suggesting an external approach to DNA. Further addition of the complexes (r = 0.15–0.36) resulted in an increase in the relative DNA-viscosity. For complex 3, the increase in DNA-viscosity was quicker and more pronounced than the other two complexes. The overall behavior of complexes 1–3 suggests that intercalation is their most probable mode of interaction with CT DNA [75].
Ethidium bromide has the ability to fluoresce, especially when it intercalates in between a double DNA-helix via its planar phenanthridine ring. Given the known interaction mode of EB with DNA, EB is often used as a reference compound to study the interaction of potentially intercalating compounds [76]. The formed EB–DNA adduct presents a strong emission band at 594 nm, when excited at 540 nm. With the addition of a competitor of EB, this fluorescence emission intensity is quenched, assuming that the added compound does not fluoresce under similar conditions and may imply the displacement of EB by the added compound [76].
Solutions of complexes 1–3 were added incrementally in a pretreated solution containing the EB–CT DNA adduct (20 μM of EB, 26 μM of CT DNA), and the fluorescence emission spectra were recorded for each addition (Figure 6A). For all complexes, a quenching of the initial EB–DNA emission band at 594 nm was observed (up to 58.7% of the initial fluorescence was observed for complex 3, Figure 6B, Table 4) and was obviously assigned to the displacement of the EB from the preformed EB–DNA adduct by the complex under study.
The Stern–Volmer constant (KSV) and the quenching constant (Kq) of complexes 1–3 were calculated with the Stern–Volmer equations (Equations (S2) and (S3)) and the corresponding Stern–Volmer plots (Figure S5). The complexes present relatively high KSV values which reveal their potency to displace EB from the EB–DNA adduct in order to bind tightly to DNA. The Kq values were calculated with Equation (S3) [76] using the value of 23 ns as the fluorescence lifetime of EB–DNA (τ0) [77] and are within the range reported for other metal complexes containing X–salo as ligands [24,25,26,27,28,57,61,62,63,64,74]. All complexes exhibited quenching constants higher than the value of 1010 M−1s−1, implying the presence of a static quenching mechanism for their interaction with the EB–DNA adduct, which indicates the formation of a new adduct between DNA and the complexes under study, and confirms indirectly intercalation as the most possible mode of interaction.

2.4. Interaction of the Complexes with Albumins

Serum albumins (SAs) play a crucial role, being the major proteins in the bloodstream of mammals. Their main function is to act as carriers for drugs and metal ions, facilitating their transport to different biological targets (cells and tissues). HSA is characterized by a solitary tryptophan at position 214. In comparison, BSA is extensively examined due to its structural resemblance to HSA and features two tryptophan residues, Trp–134 and Trp–212 [78,79]. BSA and HSA are quite similar, as their tryptophan residues are responsible for the appearance of an intense fluorescence emission band at λmax = 343 nm and λmax = 340 nm, respectively, when excited at 295 nm. The decrease in the intensity of this emission band when interacting with another compound indicates changes in their secondary structure, which is due to the binding of the compound [76].
The fluorescence emission spectra of albumins (3 μM) in buffer solution were recorded in the presence of incremental amounts of complexes 1–3 (Figure 7A,C). Upon addition of complexes 1–3, a significant decrease in the intensity of the bands was observed, which was more pronounced for BSA (Figure 7B,D), and indicates the interaction between BSA and HSA with the complexes [80]. For the quantitative studies, the spectra of free complexes 1–3 were recorded under the same conditions and were subtracted from the overall spectra. In addition, the inner-filter effect was evaluated with Equation (S4) [81], and it was found negligible to affect the measurements.
The interaction of complexes 1–3 with both albumins was further assessed with Stern–Volmer and Scatchard equations and plots (Figures S6–S9) in order to calculate the SA-quenching constants (Kq) and SA-binding constants (K), respectively. The values of Kq were calculated with the Stern–Volmer equation (Equations (S2) and (S3)) and plots (Figures S6 and S7) with τ0 = 10−8 s [76] as the fluorescence lifetime of tryptophan in SAs and are summarized in Table 5. The Kq values for both albumins are much higher than the value of 1010 M−1s−1, indicating the existence of a static quenching mechanism [76], which confirms subsequently the interaction between the albumins and the complexes [80].
The values of K were calculated with the Scatchard equation (Equation (S5)) [82] and plots (Figures S8 and S9), revealing tight binding of complexes 1–3 with both albumins. The calculated Kq and K values of complexes 1–3 for both albumins (Table 5) are comparable with those reported for metal(II) complexes with substituted salicylaldehydes as ligands [23,24,25,26,27,28,29,57,61,74,83]. In addition, the binding of the complexes to the albumins may be considered tight and reversible, when the albumin-binding constants are compared with the average value (K ~1015 M−1) of the binding constants of avidin with various compounds; this is the known borderline value for noncovalent interactions [84].

3. Materials and Methods

3.1. Materials–Instrumentation—Physical Measurements

All chemicals (3,5–diBr–saloH, phen, neoc, NiCl2·6H2O, CH3ONa, sodium citrate, NaCl, CT DNA, EB, BSA, and HSA) were used as purchased (reagent grade) from Sigma-Aldrich Co., St. Louis, MI, USA, and all solvents were purchased from ChemLab, Washington, DC, USA. The DNA stock solution was prepared by dilution of CT DNA to a buffer solution (containing 150 mM of NaCl and 15 mM of sodium citrate at pH 7.0) followed by stirring at 4 °C, and it was kept at 4 °C for no longer than two weeks. The stock solution of CT DNA gave a ratio of UV absorbance at 260 and 280 nm (A260/A280) in the range of 1.85–1.90, indicating that DNA was sufficiently free of protein contamination [85]. The DNA concentration was determined by the UV absorbance at 260 nm after 1:20 dilution using ε = 6600 M−1cm−1 [86].
FT-infrared (FT-IR) spectra were recorded in the range (400–4000 cm−1) on a PerkinElmer (Waltham, MA, USA) FT-IR Spectrum BX spectrometer with samples prepared as KBr pellets (abbreviations used: vs = very strong; s = strong; sm = strong-to-medium; m = medium). The UV–vis spectra were recorded in the range of 200–1100 nm on a dual-beam spectrophotometer Hitachi U–2001 (abbreviation used: sh = shoulder). The spectra were recorded in DMSO solutions using quartz cells with an optical path of 1 cm sealed tightly with Teflon caps. The fluorescence emission spectra were recorded in solution on a Hitachi F–7000 fluorescence spectrophotometer. C, H, and N elemental analyses were performed on a PerkinElmer 240B elemental analyzer. The molar conductivity measurements were carried out on 1 mM of DMSO solution of the complexes with a Crison Basic 30 conductometer. RT magnetic measurements were carried out on a magnetic susceptibility balance of Johnson Matthey Chemicals Limited by the Faraday method (the μeff values were calculated via the equation: μ e f f = 2.83 χ M c o r r × T , where χ M c o r r is the corrected magnetic susceptibility of the compound. The viscosity experiments were carried out using an ALPHA L Fungilab rotational viscometer equipped with an 18-mL LCP spindle.

3.2. Synthesis of the Complexes

All complexes were prepared at room temperature according to the following procedure: CH3ONa (0.5 mmol, 27 mg) was added into a methanolic solution (10 mL) of 3,5–diBr–saloH (0.5 mmol, 70 mg) under stirring for 30 min in order to deprotonate 3,5–dibromo–salicylaldehyde. Afterwards, the resultant solution was added dropwise to a methanolic solution of NiCl2.6H2O (0.25 mmol, 59 mg). For complexes 1 and 2, a methanolic solution of the corresponding N,N′–donor (0.25 mmol) was added simultaneously to the reaction solution. The final solution was stirred for additional 45 min and was left to evaporate slowly. The formation of the desired product was observed after a few days.
[Ni(3,5–diBr–salo)2(neoc)] (complex 1): For the synthesis of complex 1, neoc (0.25 mmol, 52 mg) was used as the N,N′–donor. After ten days, green single-crystals of [Ni(3,5–Br–salo)2(neoc)] suitable for X-ray structural determination were collected. Yield 80 mg, 40%. Anal. calcd. for C28H18NiBr4N2O4 (MW = 824.79): C 40.77, H 2.20, N 3.40; found: C 40.52, H 2.31, N 3.23%. FT-IR (KBr disk), νmax/cm−1: ν(C=O)aldehydo, 1641 (s); ν(C–O)phenolato, 1340 (sm); ρ(C–H)neoc, 726 (m). UV–vis: solid, λ/nm: 625, 415; in DMSO, λ/nm (ε/M−1 cm−1): 1025 (sh) (10), 630 (70), 420 (1600), 298 (sh) (5700); 10Dq = 9756 cm−1, B = 694 cm−1, 10Dq/B = 14.0. Complex 1 is soluble in DMF and DMSO. ΛM = 12 S·cm2·mol−1, 1 mM in DMSO. μeff at RT = 2.95 BM.
[Ni(3,5–diBr–salo)2(phen)] (complex 2): For the synthesis of complex 2, phen (0.25 mmol, 45 mg) was used as the N,N′–donor. After a few days, green product of [Ni(3,5–Br–salo)2(phen)] (100 mg, 50%) was collected. Anal. calcd. for C26H14NiBr4N2O4 (MW = 796.75): C 39.19, H 1.77, N 3.52; found: C 39.37, H 1.61, N 3.29%. FT-IR (KBr disk), νmax/cm−1: ν(C=O)aldehydo, 1622 (s); ν(C–O)phenolato, 1327 (sm); ρ(C–H)phen, 732 (m). UV–vis: solid, λ/nm: 645, 425; in DMSO, λ/nm (ε/M−1 cm−1): 1025 (sh) (5), 665 (50), 422 (1300), 296 (sh) (5800); 10Dq = 9756 cm−1, B = 631 cm−1, 10Dq/B = 15.5. Complex 2 is soluble in DMF and DMSO. ΛM = 15 S·cm2·mol−1, 1 mM in DMSO. μeff at RT = 2.98 BM.
[Ni(3,5–diBr–salo)2(CH3OH)2] (complex 3): Complex 3 was prepared in the absence of a N,N′–donor. After a few days, light-green product of [Ni(3,5–Br–salo)2(MeOH)2], (95 mg, 55%) was collected by filtration. Anal. calcd. for C16H14Br4NiO6 (MW = 680.63): C 28.23, H 2.07; found: C 27.95, H 2.25%. FT-IR (KBr disk), νmax/cm−1: ν(C=O)aldehydo, 1647 (vs); ν(C–O)phenolato, 1315 (s). UV–vis: solid, λ/nm: 655, 415; in DMSO, λ/nm (ε/M−1 cm−1): 1040 (sh) (5), 670 (25), 421 (1260), 302 (sh) (6500); 10Dq = 9615 cm−1, B = 655 cm−1, 10Dq/B = 14.7. Complex 3 is soluble in DMSO, DMF, and MeOH. ΛM = 10 S·cm2·mol−1, 1 mM in DMSO. μeff at RT = 3.00 BM.

3.3. Single-Crystal X-ray Crystallography

A crystal of complex 1 suitable for X-ray structural determination was mounted at RT on a Bruker Kappa APEX2 diffractometer equipped with a Triumph monochromator using Mo Kα (λ = 0.71073 Å, source operating at 50 kV and 30 mA) radiation. Unit cell dimensions were determined and refined by using the angular settings of at least 168 high-intensity reflections (>10σ(I)) in the range 10° < 2θ < 20°. Intensity data were recorded using φ and ω scans. All crystals presented no decay during the data collection. The frames collected for each crystal were integrated with the Bruker SAINT Software package (Version 2) using a narrow-frame algorithm [87]. Data were corrected for absorption using the numerical method (SADABS) based on crystal dimensions [88]. All structures were solved using SUPERFLIP [89] incorporated in Crystals. Data refinement (full-matrix least-squares methods on F2) and all subsequent calculations were conducted using the Crystals version 14.61 build 6720 program package [90]. All non-hydrogen non-disordered atoms were refined anisotropically. Hydrogen atoms were located from difference Fourier maps and refined at idealized positions riding on the parent atoms with isotropic displacement parameters Uiso(H) = 1.2Ueq(C) at distances C–H 0.95 Å.
Crystallographic data for complex 1 are presented in Table 1. Further details on the crystallographic studies as well as atomic displacement parameters are given as Supporting Information in the form of cif files. CCDC deposition number 2346279 contains the supplementary crystallographic data for this paper. These data can be obtained free of charge via www.ccdc.cam.ac.uk/conts/retrieving.html (or from the Cambridge Crystallographic Data Centre, 12 Union Road, Cambridge CB21EZ, UK; fax: (+44) 1223–336–033; or [email protected]).

3.4. Study of the Biological Profile of the Complexes

The in vitro evaluation of the biological activity of the complexes, i.e., interaction with CT DNA and albumins, was conducted following the dissolution of the complexes in DMSO (1 mM) due to their limited solubility in water. The experiments were carried out in the presence of aqueous buffer solutions, ensuring that the ratio of DMSO in the final solution did not exceed 5% (v/v). Control experiments were implemented to evaluate the impact of DMSO on the data. Minimal-to-no alterations were observed in the spectra of albumins or CT DNA, and appropriate adjustments were made as necessary. The interaction of the compounds with CT DNA was examined thoroughly by DNA-viscosity measurements, UV–vis spectroscopy titrations, and through competitive studies with EB by fluorescence emission spectroscopy. The albumin-binding was studied through tryptophan fluorescence quenching experiments. All the experimental protocols and the equations employed for these studies are described in the Supplementary File (Sections S1 and S2).

4. Conclusions

Three nickel(II) complexes with 3,5–dibromo–salicylaldehyde (3,5–diBr–saloH) were synthesized, in the presence or absence of two phenanthroline derivatives, i.e., 1,10–phenanthroline (phen) and 2,9–dimethyl–1,10–phenanthroline (neoc). The 3,5–diBr–salo ligands are bound to the nickel(II) ion bidentately through the deprotonated phenolato and the carbonyl oxygen atoms. The nickel(II) ions are six-coordinated with a distorted octahedral geometry.
The complexes interact with linear calf-thymus DNA via intercalation and bind tightly and reversibly to human and serum albumins, as revealed by the corresponding binding constants determined. The presence of a N,N′–donor co-ligand (neoc in complex 1 and phen in complex 2) resulted in higher DNA-binding constants when compared with complex 3 (absence of N,N′–donor co-ligand), while the opposite tendency was found for the albumin-binding constants where complex 3 presented the highest constants.
In total, complexes 1–3 showed promising features regarding the interaction with biomolecules, thus constituting the trigger for further bioactivity studies in future projects.

Supplementary Materials

The following supporting information can be downloaded at: https://www.mdpi.com/article/10.3390/inorganics12050138/s1, Cif file for compound 1; checkcif file for compound 1; Supplementary file containing: S1. Protocols for interaction studies with CT DNA; S2. Protocols for interaction studies with serum albumins; Figure S1: IR spectra of complexes 1–3; Figure S2: UV–vis spectra of complexes 1–3 in DMSO solution; Figure S3. UV–vis spectra of complexes 1–3 in solid state; Figure S4: Plot of [DNA]/(εAF) vs. [DNA] for complexes 1–3; Figure S5: Stern–Volmer quenching plot of EB–DNA fluorescence for complexes 1–3; Figure S6: Stern–Volmer quenching plot of BSA fluorescence for complexes 1–3; Figure S7: Stern–Volmer quenching plot of HSA fluorescence for complexes 1–3; Figure S8: Scatchard plot of BSA of complexes 1–3; Figure S9: Scatchard plot of HSA of complexes 1–3 [72,76,77,81,82].

Author Contributions

Conceptualization, G.I.P., A.Z. and G.P.; methodology, G.I.P., A.Z. and G.P.; formal analysis, G.I.P., A.Z., A.G.H. and G.P.; investigation, G.I.P., A.Z. and A.G.H.; resources, A.G.H. and G.P.; data curation, G.I.P., A.Z., A.G.H. and G.P.; writing—original draft preparation, G.I.P., A.Z., A.G.H. and G.P.; writing—review and editing, G.P.; supervision, G.P.; project administration, G.P.; funding acquisition, G.P. All authors have read and agreed to the published version of the manuscript.

Funding

This research received no external funding.

Data Availability Statement

Data are contained within the article and Supplementary Materials.

Conflicts of Interest

The authors declare no conflicts of interest.

Abbreviations

3,5–diBr–saloH = 3,5–dibromo–salicylaldehyde; 3,5–diCl–saloH = 3,5–dichloro–salicylaldehyde; 5–Br–saloH = 5–bromo–salicylaldehyde; 5–Cl–saloH = 5–chloro–salicylaldehyde; 5–NO2–saloH = 5–nitro–salicylaldehyde; bipy = 2,2′–bipyridine; bipyam = 2,2′–bipyridylamine; BSA = bovine serum albumin; CT = calf thymus; EB = ethidium bromide, 3,8–diamino–5–ethyl–6–phenyl–phenanthridinium bromide; HSA = human serum albumin; K = SA-binding constant; Kb = DNA-binding constant; Kq = quenching constant; KSV = Stern–Volmer constant; neoc = 2,9–dimethyl–1,10–phenanthroline, neocuproine; phen = 1,10–phenanthroline; r = [compound]/[DNA] ratio or [compound]/[albumin] ratio; RT = room -temperature; SA = serum albumin; saloH = salicylaldehyde; X–saloH = substituted salicylaldehyde.

References

  1. Claudel, M.; Schwarte, J.V.; Fromm, K.M. New Antimicrobial Strategies Based on Metal Complexes. Chemistry 2020, 2, 849–899. [Google Scholar] [CrossRef]
  2. Gasser, G. Metal Complexes and Medicine: A Successful Combination. Chimia 2015, 69, 442–446. [Google Scholar] [CrossRef] [PubMed]
  3. Pauls, G.; Becker, T.; Rahfeld, P.; Gretscher, R.R.; Paetz, C.; Pasteels, J.; von Reuss, S.H.; Burse, A.; Boland, W. Two Defensive Lines in Juvenile Leaf Beetles; Esters of 3-Nitropropionic Acid in the Hemolymph and Aposematic Warning. J. Chem. Ecol. 2016, 42, 240–248. [Google Scholar] [CrossRef] [PubMed]
  4. Kumar, S.; Devi, J.; Dubey, A.; Kumar, D.; Jindal, D.K.; Asija, S.; Sharma, A. Co(II), Ni(II), Cu(II) and Zn(II) Complexes of Schiff Base Ligands: Synthesis, Characterization, DFT, in Vitro Antimicrobial Activity and Molecular Docking Studies. Res. Chem. Intermed. 2023, 49, 939–965. [Google Scholar] [CrossRef]
  5. Kargar, H.; Ardakani, A.A.; Tahir, M.N.; Ashfaq, M.; Munawar, K.S. Synthesis, Spectral Characterization, Crystal Structure Determination and Antimicrobial Activity of Ni(II), Cu(II) and Zn(II) Complexes with the Schiff Base Ligand Derived from 3,5-Dibromosalicylaldehyde. J. Mol. Struct. 2021, 1229, 129842. [Google Scholar] [CrossRef]
  6. Ghasemi, L.; Abedi, A.; Abbasi, A.; Kucerakova, M.; Dusek, M.; Behzad, M. Subtle Structural Variations in New Mixed-Ligand Cu(II) Complexes with NN’O Type Unsymmetrical Schiff Bases: Molecular Docking against SARS-CoV-2 and Its Omicron Variant Main Proteases. Inorg. Chem. Commun. 2024, 159, 111795. [Google Scholar] [CrossRef]
  7. Zianna, A.; Geromichalos, G.D.; Pekou, A.; Hatzidimitriou, A.G.; Coutouli-Argyropoulou, E.; Lalia-Kantouri, M.; Pantazaki, A.A.; Psomas, G. A Palladium(II) Complex with the Schiff Base 4-Chloro-2-(N-Ethyliminomethyl)-Phenol: Synthesis, Structural Characterization, and in Vitro and in Silico Biological Activity Studies. J. Inorg. Biochem. 2019, 199, 110792. [Google Scholar] [CrossRef] [PubMed]
  8. Kargar, H.; Centore, R.; Fallah-Mehrjardi, M.; Santagata, E.; Munawar, K.S. Dihalosalicylaldehyde Based Molybdenum(VI) Complexes: Synthesis, Spectral Characterization, Crystal Structures, and Catalytic Activities for the Selective Oxidation of Benzylic Alcohols. Inorg. Chim. Acta 2024, 566, 122015. [Google Scholar] [CrossRef]
  9. Karmakar, M.; Kumar, P.; Jiyaur Rahaman, S.; Chattopadhyay, S. An Overview on the Synthesis, Structure, and Application of Vanadyl Complexes with Hydrazonic Acid Ligands Based on Salicylaldehyde or Its Derivatives. Inorg. Chim. Acta 2024, 565, 121969. [Google Scholar] [CrossRef]
  10. Zhuo, S.; Wu, W.; Liu, Y.; Zou, L.; Wu, Y.; Botha, L.; Kumar, A.; Afzal, M.; Alarifi, A. 3,5-Dibromosalicylaldehyde Nicotinoylhydrazone and 4,4′-Bipyridine Appended New Zn(II) Coordination Polymer: Secnidazole Sensing and Rhodamine B Photocatalytic Degradation Properties. J. Mol. Struct. 2022, 1264, 133304. [Google Scholar] [CrossRef]
  11. Gui, M.; Wu, W.; Liu, Y.; Wu, Y.; Singh, S.; Kumar, A.; Afzal, M.; Alarifi, A.; Shi, C. Sensing and Photocatalytic Properties of a New 1D Zn(II)-Based Coordination Polymer Derived from the 3,5-Dibromosalicylaldehyde Nicotinoylhydrazone Ligand. Polyhedron 2022, 222, 115900. [Google Scholar] [CrossRef]
  12. Rani, M.; Devi, J.; Kumar, B.; Arora, T.; Taxak, B. Tridentate Xanthene-Based Hydrazone Ligands and Their Mononuclear Transition Metal Complexes: Synthesis, Anti-Malarial, Antimicrobial and Molecular Docking Studies. Res. Chem. Intermed. 2024, 50, 1409–1434. [Google Scholar] [CrossRef]
  13. Zahirović, A.; Hadžalić, S.; Višnjevac, A.; Fočak, M.; Tüzün, B.; Žilić, D.; Roca, S.; Jurec, J.; Topčagić, A.; Osmanković, I. Vanadium(IV) Complexes of Salicylaldehyde-Based Furoic Acid Hydrazones: Synthesis, BSA Binding and in Vivo Antidiabetic Potential. J. Inorg. Biochem. 2023, 244, 112232. [Google Scholar] [CrossRef]
  14. Adhikari, H.S.; Garai, A.; Khanal, C.; Yadav, P.N. Synthesis and Comprehensive Characterization with Anticancer Activity Assessment of Salicylaldehyde and 2-Acetylphenol Based Chitosan Thiosemicarbazones and Their Copper(II) Complexes. Carbohydr. Polym. Technol. Appl. 2024, 7, 100469. [Google Scholar] [CrossRef]
  15. Scaccaglia, M.; Pinelli, S.; Manini, L.; Ghezzi, B.; Nicastro, M.; Heinrich, J.; Kulak, N.; Mozzoni, P.; Pelosi, G.; Bisceglie, F. Gold(III) Complexes with Thiosemicarbazone Ligands: Insights into Their Cytotoxic Effects on Lung Cancer Cells. J. Inorg. Biochem. 2024, 251, 112438. [Google Scholar] [CrossRef]
  16. Andriichuk, Y.M.; Lyapunov, A.Y.; Hotynchan, A.H.; Savchenko, D.V.; Karavan, V.V.; Turash, M.M.; Khalavka, Y.B. Synergetic Radical-Scavenging Effect in the Complex of Copper(II) with the Thiosemicarbazone of Salicylaldehyde. J. Coord. Chem. 2023, 76, 1763–1775. [Google Scholar] [CrossRef]
  17. Elo, H.; Kuure, M.; Pelttari, E. Correlation of the Antimicrobial Activity of Salicylaldehydes with Broadening of the NMR Signal of the Hydroxyl Proton. Possible Involvement of Proton Exchange Processes in the Antimicrobial Activity. Eur. J. Med. Chem. 2015, 92, 750–753. [Google Scholar] [CrossRef] [PubMed]
  18. Pelttari, E.; Lehtinen, M.; Elo, H. Substituted Salicylaldehydes as Potential Antimicrobial Drugs: Minimal Inhibitory and Microbicidal Concentrations. Z. Naturforsch.—Sect. C J. Biosci. 2011, 66, 571–580. [Google Scholar] [CrossRef]
  19. Kordestani, N.; Rudbari, H.A.; Fernandes, A.R.; Raposo, L.R.; Baptista, P.V.; Ferreira, D.; Bruno, G.; Bella, G.; Scopelliti, R.; Braun, J.D.; et al. Antiproliferative Activities of Diimine-Based Mixed Ligand Copper(II) Complexes. ACS Comb. Sci. 2020, 22, 89–99. [Google Scholar] [CrossRef] [PubMed]
  20. Varadwaj, P.R.; Varadwaj, A.; Marques, H.M. Halogen Bonding: A Halogen-Centered Noncovalent Interaction Yet to Be Understood. Inorganics 2019, 7, 40. [Google Scholar] [CrossRef]
  21. Feng, D.; Wang, B.; Wang, L.; Abraham, N.; Tao, K.; Huang, L.; Shi, W.; Dong, Y.; Qu, Y. Pre-Ischemia Melatonin Treatment Alleviated Acute Neuronal Injury after Ischemic Stroke by Inhibiting Endoplasmic Reticulum Stress-Dependent Autophagy via PERK and IRE1 Signalings. J. Pineal Res. 2017, 62, e12395. [Google Scholar] [CrossRef]
  22. Thapa, K.; Khan, H.; Singh, T.G.; Kaur, A. Traumatic Brain Injury: Mechanistic Insight on Pathophysiology and Potential Therapeutic Targets. J. Mol. Neurosci. 2021, 71, 1725–1742. [Google Scholar] [CrossRef] [PubMed]
  23. Vitomirov, T.; Dimiza, F.; Matić, I.Z.; Stanojković, T.; Pirković, A.; Živković, L.; Spremo-Potparević, B.; Novaković, I.; Anđelković, K.; Milčić, M.; et al. Copper(II) Complexes with 4-(Diethylamino)Salicylaldehyde and α-Diimines: Anticancer, Antioxidant, Antigenotoxic Effects and Interaction with DNA and Albumins. J. Inorg. Biochem. 2022, 235, 111942. [Google Scholar] [CrossRef]
  24. Ntanatsidis, S.; Perontsis, S.; Konstantopoulou, S.; Kalogiannis, S.; Hatzidimitriou, A.G.; Papadopoulos, A.N.; Psomas, G. Manganese(II) Complexes of Substituted Salicylaldehydes and α-Diimines: Synthesis, Characterization and Biological Activity. J. Inorg. Biochem. 2022, 227, 111693. [Google Scholar] [CrossRef]
  25. Papadopoulos, Z.; Doulopoulou, E.; Zianna, A.; Hatzidimitriou, A.G.; Psomas, G. Copper(II) Complexes of 5–Fluoro–Salicylaldehyde: Synthesis, Characterization, Antioxidant Properties, Interaction with DNA and Serum Albumins. Molecules 2022, 27, 8929. [Google Scholar] [CrossRef]
  26. Zianna, A.; Vradi, E.; Hatzidimitriou, A.G.; Kalogiannis, S.; Psomas, G. Zinc(II) Complexes of 3-Bromo-5-Chloro-Salicylaldehyde: Characterization and Biological Activity. Dalton Trans. 2022, 51, 17629–17641. [Google Scholar] [CrossRef]
  27. Zianna, A.; Geromichalos, G.; Psoma, E.; Kalogiannis, S.; Hatzidimitriou, A.G.; Psomas, G. Structure and in Vitro and in Silico Biological Activity of Zinc(II) Complexes with 3,5–Dichloro–Salicylaldehyde. J. Inorg. Biochem. 2022, 229, 111727. [Google Scholar] [CrossRef]
  28. Zianna, A.; Geromichalou, E.; Geromichalos, G.; Fiotaki, A.M.; Hatzidimitriou, A.G.; Kalogiannis, S.; Psomas, G. Zinc(II) Complexes of 3,5–Dibromo–Salicylaldehyde and α–Diimines: Synthesis, Characterization and in Vitro and in Silico Biological Profile. J. Inorg. Biochem. 2022, 226, 111659. [Google Scholar] [CrossRef]
  29. Christidou, A.; Zavalani, K.; Hatzidimitriou, A.G.; Psomas, G. Copper(II) Complexes with 3,5–Dihalogeno–Salicylaldehydes: Synthesis, Structure and Interaction with DNA and Albumins. J. Inorg. Biochem. 2023, 238, 112049. [Google Scholar] [CrossRef] [PubMed]
  30. Aryaeifar, M.; Rudbari, H.A.; Moreno-Pineda, E.; Cuevas-Vicario, J.V.; Paul, S.; Schulze, M.; Wernsdorfer, W.; Lloret, F.; Moini, N.; Blacque, O. Synthesis, Characterization and Magnetic Properties of Halogenated Tetranuclear Cubane-like Nickel(II) Complexes. New J. Chem. 2024, 48, 3603–3613. [Google Scholar] [CrossRef]
  31. Zianna, A.; Geromichalos, G.; Fiotaki, A.M.; Hatzidimitriou, A.G.; Kalogiannis, S.; Psomas, G. Palladium(II) Complexes of Substituted Salicylaldehydes: Synthesis, Characterization and Investigation of Their Biological Profile. Pharmaceuticals 2022, 15, 886. [Google Scholar] [CrossRef]
  32. Fontecilla-Camps, J.C. Nickel and the Origin and Early Evolution of Life. Metallomics 2022, 14, 16. [Google Scholar] [CrossRef]
  33. Meyer, F.; Kozlowski, H. Nickel. Compr. Coord. Chem. II 2004, 6, 247–554. [Google Scholar] [CrossRef]
  34. Kumar, S.; Trivedi, A.V. A Review on Role of Nickel in the Biological System. Int. J. Curr. Microbiol. Appl. Sci. 2016, 5, 719–727. [Google Scholar] [CrossRef]
  35. Prueitt, R.L.; Li, W.; Chang, Y.C.; Boffetta, P.; Goodman, J.E. Systematic Review of the Potential Respiratory Carcinogenicity of Metallic Nickel in Humans. Crit. Rev. Toxicol. 2020, 50, 605–639. [Google Scholar] [CrossRef]
  36. Buttice, C. Nickel. In The SAGE Encyclopedia of Cancer and Society; Colditz, G.A., Ed.; SAGE Publications: Thousand Oaks, CA, USA, 2015; Volume 2, pp. 828–831. [Google Scholar]
  37. Zhao, J.; Shi, X.; Castranova, V.; Ding, M. Occupational Toxicology of Nickel and Nickel Compounds. J. Environ. Pathol. Toxicol. Oncol. 2009, 28, 177–208. [Google Scholar] [CrossRef]
  38. Barceloux, D.G. Nickel. J. Toxicol. Clin. Toxicol. 1999, 37, 239–258. [Google Scholar] [CrossRef]
  39. Dixon, N.E.; Gazzola, C.; Blakeley, R.L.; Zerner, B. Jack Bean Urease (EC 3.5.1.5). A Metalloenzyme. A Simple Biological Role for Nickel? J. Am. Chem. Soc. 1975, 97, 4131–4133. [Google Scholar] [CrossRef]
  40. Company, A.; McDonald, A.R. Bio-Relevant Chemistry of Nickel. In Comprehensive Coordination Chemistry III; Constable Edwin, C., Parkin, G., Que, L., Jr., Eds.; Elsevier: Hoboken, NJ, USA, 2021; Volume 8, pp. 846–877. ISBN 9780081026885. [Google Scholar]
  41. Glazer, E.C.; Casini, A. Metals in Medicine. Eur. J. Inorg. Chem. 2022, 2022, e202101093. [Google Scholar] [CrossRef]
  42. Orvig, C.; Abrams, M.J. Medicinal Inorganic Chemistry: Introduction. Chem. Rev. 1999, 99, 2202–2203. [Google Scholar] [CrossRef]
  43. Bisceglie, F.; Pinelli, S.; Alinovi, R.; Goldoni, M.; Mutti, A.; Camerini, A.; Piola, L.; Tarasconi, P.; Pelosi, G. Cinnamaldehyde and Cuminaldehyde Thiosemicarbazones and Their Copper(II) and Nickel(II) Complexes: A Study to Understand Their Biological Activity. J. Inorg. Biochem. 2014, 140, 111–125. [Google Scholar] [CrossRef] [PubMed]
  44. Betanzos-Lara, S.; Gómez-Ruiz, C.; Barrón-Sosa, L.R.; Gracia-Mora, I.; Flores-Álamo, M.; Barba-Behrens, N. Cytotoxic Copper(II), Cobalt(II), Zinc(II), and Nickel(II) Coordination Compounds of Clotrimazole. J. Inorg. Biochem. 2012, 114, 82–93. [Google Scholar] [CrossRef] [PubMed]
  45. Haribabu, J.; Jeyalakshmi, K.; Arun, Y.; Bhuvanesh, N.S.P.; Perumal, P.T.; Karvembu, R. Synthesis, DNA/Protein Binding, Molecular Docking, DNA Cleavage and in Vitro Anticancer Activity of Nickel(II) Bis(Thiosemicarbazone) Complexes. RSC Adv. 2015, 5, 46031–46049. [Google Scholar] [CrossRef]
  46. Kisa, D.; Korkmaz, N.; Taslimi, P.; Tuzun, B.; Tekin, Ş.; Karadag, A.; Sen, F. Bioactivity and Molecular Docking Studies of Some Nickel Complexes: New Analogues for the Treatment of Alzheimer, Glaucoma and Epileptic Diseases. Bioorg Chem. 2020, 101, 104066. [Google Scholar] [CrossRef] [PubMed]
  47. Alomar, K.; Landreau, A.; Allain, M.; Bouet, G.; Larcher, G. Synthesis, Structure and Antifungal Activity of Thiophene-2,3- Dicarboxaldehyde Bis(Thiosemicarbazone) and Nickel(II), Copper(II) and Cadmium(II) Complexes: Unsymmetrical Coordination Mode of Nickel Complex. J. Inorg. Biochem. 2013, 126, 76–83. [Google Scholar] [CrossRef] [PubMed]
  48. Shawish, H.B.; Wong, W.Y.; Wong, Y.L.; Loh, S.W.; Looi, C.Y.; Hassandarvish, P.; Phan, A.Y.L.; Wong, W.F.; Wang, H.; Paterson, I.C.; et al. Nickel(II) Complex of Polyhydroxybenzaldehyde N4-Thiosemicarbazone Exhibits Anti-Inflammatory Activity by Inhibiting NF-ΚB Transactivation. PLoS ONE 2014, 9, e100933. [Google Scholar] [CrossRef] [PubMed]
  49. Skyrianou, K.C.; Efthimiadou, E.K.; Psycharis, V.; Terzis, A.; Kessissoglou, D.P.; Psomas, G. Nickel-Quinolones Interaction. Part 1Nickel(II) Complexes with the Antibacterial Drug Sparfloxacin: Structure and Biological Properties. J. Inorg. Biochem. 2009, 103, 1617–1625. [Google Scholar] [CrossRef]
  50. Xu, B.B.; Pei, X.S.; Guan, Q.Y.; Shi, X.; Zhao, G.L. Synthesis, Crystal Structure, and Biological Activity of a Nickel(II) Complex Constructed by 2-Phenyl-4-Selenazole Carboxylic Acid and 1,10-Phenanthroline. J. Coord. Chem. 2013, 66, 2605–2614. [Google Scholar] [CrossRef]
  51. Totta, X.; Papadopoulou, A.A.; Hatzidimitriou, A.G.; Papadopoulos, A.; Psomas, G. Synthesis, Structure and Biological Activity of Nickel(II) Complexes with Mefenamato and Nitrogen-Donor Ligands. J. Inorg. Biochem. 2015, 145, 79–93. [Google Scholar] [CrossRef]
  52. Perontsis, S.; Hatzidimitriou, A.G.; Papadopoulos, A.N.; Psomas, G. Nickel-Diflunisal Complexes: Synthesis, Characterization, in Vitro Antioxidant Activity and Interaction with DNA and Albumins. J. Inorg. Biochem. 2016, 162, 9–21. [Google Scholar] [CrossRef]
  53. Lazou, M.; Hatzidimitriou, A.G.; Papadopoulos, A.N.; Psomas, G. Transition Metal(II) Complexes with the Non–Steroidal Anti–Inflammatory Drug Oxaprozin: Characterization and Biological Profile. J. Inorg. Biochem. 2023, 243, 112196. [Google Scholar] [CrossRef]
  54. Barmpa, A.; Geromichalos, G.D.; Hatzidimitriou, A.G.; Psomas, G. Nickel(II)–Meclofenamate Complexes: Structure, in Vitro and in Silico DNA– and Albumin–Binding Studies, Antioxidant and Anticholinergic Activity. J. Inorg. Biochem. 2021, 222, 111507. [Google Scholar] [CrossRef] [PubMed]
  55. Zianna, A.; Psomas, G.; Hatzidimitriou, A.; Lalia-Kantouri, M. Ni(II) Complexes with 2,2-Dipyridylamine and Salicylaldehydes: Synthesis, Crystal Structure and Interaction with Calf-Thymus DNA and Albumins. J. Inorg. Biochem. 2016, 163, 131–142. [Google Scholar] [CrossRef]
  56. Zianna, A.; Psomas, G.; Hatzidimitriou, A.; Lalia-Kantouri, M. Synthesis, Structural, Thermal Characterization and Interaction with Calf-Thymus DNA and Albumins of Cationic Ni(II) Complexes with 2,2′-Dipyridylamine and Salicylaldehydes. Polyhedron 2017, 124, 104–116. [Google Scholar] [CrossRef]
  57. Gkritzali, M.; Georgila, M.; Hatzidimitriou, A.G.; Kalogiannis, S.; Psomas, G. Neutral and Cationic Nickel(II) Complexes with Substituted Salicylaldehydes: Characterization, Antibacterial Activity, and Interaction with Biomacromolecules. J. Inorg. Biochem. 2023, 247, 112339. [Google Scholar] [CrossRef] [PubMed]
  58. Geary, W.J. The Use of Conductivity Measurements in Organic Solvents for the Characterisation of Coordination Compounds. Coord. Chem. Rev. 1971, 7, 81–122. [Google Scholar] [CrossRef]
  59. Nakamoto, K. Infrared and Raman Spectra of Inorganic and Coordination Compounds: Part B: Applications in Coordination, Organometallic, and Bioinorganic Chemistry; John Wiley and Sons: Hoboken, NJ, USA, 2008; ISBN 9780471744931. [Google Scholar]
  60. Totta, X.; Hatzidimitriou, A.G.; Papadopoulos, A.N.; Psomas, G. Nickel(II)-Naproxen Mixed-Ligand Complexes: Synthesis, Structure, Antioxidant Activity and Interaction with Albumins and Calf-Thymus DNA. New J. Chem. 2017, 41, 4478–4492. [Google Scholar] [CrossRef]
  61. Stamou, P.; Hatzidimitriou, A.G.; Psomas, G. Manganese(II) Complexes with 5–Nitro–2–Hydroxy–Benzaldehyde or Substituted 2–Hydroxy–Phenones: Structure and Interaction with Bovine Serum Albumin and Calf–Thymus DNA. J. Inorg. Biochem. 2022, 235, 111923. [Google Scholar] [CrossRef] [PubMed]
  62. Zianna, A.; Psomas, G.; Hatzidimitriou, A.; Coutouli-Argyropoulou, E.; Lalia-Kantouri, M. Zinc Complexes of Salicylaldehydes: Synthesis, Characterization and DNA-Binding Properties. J. Inorg. Biochem. 2013, 127, 116–126. [Google Scholar] [CrossRef]
  63. Zianna, A.; Ristović, M.Š.; Psomas, G.; Hatzidimitriou, A.; Coutouli-Argyropoulou, E.; Lalia-Kantouri, M. Cadmium(II) Complexes of 5-Bromo-Salicylaldehyde and α-Diimines: Synthesis, Structure and Interaction with Calf-Thymus DNA and Albumins. Polyhedron 2016, 107, 136–147. [Google Scholar] [CrossRef]
  64. Zianna, A.; Sumar Ristovic, M.; Psomas, G.; Hatzidimitriou, A.; Coutouli-Argyropoulou, E.; Lalia-Kantouri, M. Cadmium(II) Complexes of 5-Nitro-Salicylaldehyde and α-Diimines: Synthesis, Structure and Interaction with Calf-Thymus DNA. J. Coord. Chem. 2015, 68, 4444–4463. [Google Scholar] [CrossRef]
  65. Papadopoulos, C.D.; Lalia-Kantouri, M.; Jaud, J.; Hatzidimitriou, A.G. Substitution Effect on New Co(II) Addition Compounds with Salicylaldehydes and the Nitrogenous Bases Phen or Neoc: Crystal and Molecular Structures of [CoII(5-NO2-Salicylaldehyde)2(Phen)], [CoII(5-CH3-Salicylaldehyde)2(Neoc)] and [CoII(5-Cl-Salicylaldehyde)2(Neoc)]. Inorg. Chim. Acta 2007, 360, 3581–3589. [Google Scholar] [CrossRef]
  66. Papadopoulos, C.D.; Hatzidimitriou, A.G.; Voutsas, G.P.; Lalia-Kantouri, M. Synthesis and Characterization of New Addition Compounds of Bis(Substituted-Salicylaldehydo)Cobalt(II) with 2,2′-Bipyridine (Bipy). Crystal and Molecular Structures of [CoII(3-Methoxy-Salicylaldehyde)2(Bipy)]·CH3OH (1) and [CoII(Bipy)3]Br2·0.5(5-Chloro-SalicylaldehydeH)·1.5CH3OH (5). Polyhedron 2007, 26, 1077–1086. [Google Scholar] [CrossRef]
  67. Lalia-Kantouri, M.; Gdaniec, M.; Czapik, A.; Chrissafis, K.; Ferenc, W.; Sarzynski, J.; Papadopoulos, C.D. Thermoanalytical, Magnetic and Structural Study of Co(II) Complexes with Substituted Salicylaldehydes and Neocuproine. J. Therm. Anal. Calorim. 2012, 109, 131–139. [Google Scholar] [CrossRef]
  68. Papadopoulos, C.; Cristóvão, B.; Ferenc, W.; Hatzidimitriou, A.; Ciprioti, S.V.; Risoluti, R.; Lalia-Kantouri, M. Thermoanalytical, Magnetic and Structural Investigation of Neutral Co(II) Complexes with 2,2′-Dipyridylamine and Salicylaldehydes. J. Therm. Anal. Calorim. 2016, 123, 717–729. [Google Scholar] [CrossRef]
  69. Pages, B.J.; Ang, D.L.; Wright, E.P.; Aldrich-Wright, J.R. Metal Complex Interactions with DNA. Dalton Trans. 2015, 44, 3505–3526. [Google Scholar] [CrossRef] [PubMed]
  70. Duchackova, L.; Steinmetz, V.; Lemaire, J.; Roithova, J. Comparison of 2,2′-Bipyridine and 2,2′-Bipyridyl-N,N′-Dioxide as Ligands in Zinc Complexes. Inorg. Chem. 2010, 49, 8897–8903. [Google Scholar] [CrossRef] [PubMed]
  71. Wilson, W.D.; Paul, A. Reversible Small Molecule–Nucleic Acid Interactions. In Nucleic Acids in Chemistry and Biology; Blackburn, G.M., Egli, M., Gait, M.J., Watts, J.K., Eds.; The Royal Society of Chemistry: London, UK, 2022; pp. 477–521. [Google Scholar]
  72. Wolfe, A.; Shimer, G.H.; Meehan, T. Polycyclic Aromatic Hydrocarbons Physically Intercalate into Duplex Regions of Denatured DNA. Biochemistry 1987, 26, 6392–6396. [Google Scholar] [CrossRef] [PubMed]
  73. Dimitrakopoulou, A.; Dendrinou-Samara, C.; Pantazaki, A.A.; Alexiou, M.; Nordlander, E.; Kessissoglou, D.P. Synthesis, Structure and Interactions with DNA of Novel Tetranuclear, [Mn4(II/II/II/IV)] Mixed Valence Complexes. J. Inorg. Biochem. 2008, 102, 618–628. [Google Scholar] [CrossRef]
  74. Gkisiou, C.; Malis, G.; Hatzidimitriou, A.G.; Psomas, G. Erbium(III) Coordination Compounds with Substituted Salicylaldehydes: Characterization and Biological Profile. J. Inorg. Biochem. 2023, 242, 112161. [Google Scholar] [CrossRef]
  75. Garcia-Gimenez, J.L.; Gonzalez-Alvarez, M.; Liu-Gonzalez, M.; Macías, B.; Borras, J.; Alzuet, G. Toward the Development of Metal-Based Synthetic Nucleases: DNA Binding and Oxidative DNA Cleavage of a Mixed Copper(II) Complex with N-(9H-Purin-6-yl)Benzenesulfonamide and 1,10-Phenantroline. Antitumor Activity in Human Caco-2 Cells and Jurkat T Lymphocytes. Evaluation of P53 and Bcl-2 Proteins in the Apoptotic Mechanism. J. Inorg. Biochem. 2009, 103, 923–934. [Google Scholar] [CrossRef] [PubMed]
  76. Lakowicz, J.R. Principles of Fluorescence Spectroscopy; Springer: Berlin/Heidelberg, Germany, 2006; ISBN 0387312781. [Google Scholar]
  77. Heller, D.P.; Greenstock, C.L. Fluorescence Lifetime Analysis of DNA Intercalated Ethidium Bromide and Quenching by Free Dye. Biophys. Chem. 1994, 50, 305–312. [Google Scholar] [CrossRef] [PubMed]
  78. He, X.M.; Carter, D.C. Atomic Structure and Chemistry of Human Serum Albumin. Nature 1992, 358, 209–215. [Google Scholar] [CrossRef] [PubMed]
  79. Olson, R.E.; Christ, D.D. Chapter 33. Plasma Protein Binding of Drugs. Annu. Rep. Med. Chem. 1996, 31, 327–336. [Google Scholar] [CrossRef]
  80. Zhao, G.; Lin, H.; Zhu, S.; Sun, H.; Chen, Y. Dinuclear Palladium(II) Complexes Containing Two Monofunctional [Pd(En)(Pyridine)Cl]+ Units Bridged by Se or S. Synthesis, Characterization, Cytotoxicity and Kinetic Studies of DNA-Binding. J. Inorg. Biochem. 1998, 70, 219–226. [Google Scholar] [CrossRef] [PubMed]
  81. Stella, L.; Capodilupo, A.L.; Bietti, M. A Reassessment of the Association between Azulene and [60]Fullerene. Possible Pitfalls in the Determination of Binding Constants through Fluorescence Spectroscopy. Chem. Commun. 2008, 4744–4746. [Google Scholar] [CrossRef] [PubMed]
  82. Wu, S.S.; Yuan, W.B.; Wang, H.Y.; Zhang, Q.; Liu, M.; Yu, K.B. Synthesis, Crystal Structure and Interaction with DNA and HSA of (N,N′-Dibenzylethane-1,2-Diamine) Transition Metal Complexes. J. Inorg. Biochem. 2008, 102, 2026–2034. [Google Scholar] [CrossRef] [PubMed]
  83. Selaković, S.; Rodić, M.V.; Novaković, I.; Matić, I.Z.; Stanojković, T.; Pirković, A.; Živković, L.; Spremo-Potparević, B.; Milčić, M.; Medaković, V.; et al. Cu(II) Complexes with a Salicylaldehyde Derivative and α-Diimines as Co-Ligands: Synthesis, Characterization, Biological Activity. Experimental and Theoretical Approach. Dalton Trans. 2024, 53, 2770–2788. [Google Scholar] [CrossRef] [PubMed]
  84. Laitinen, O.H.; Hytönen, V.P.; Nordlund, H.R.; Kulomaa, M.S. Genetically Engineered Avidins and Streptavidins. Cell. Mol. Life Sci. 2006, 63, 2992–3017. [Google Scholar] [CrossRef]
  85. Marmur, J. A Procedure for the Isolation of Deoxyribonucleic Acid from Micro-Organisms. J. Mol. Biol. 1961, 3, 208–218. [Google Scholar] [CrossRef]
  86. Reichmann, M.E.; Rice, S.A.; Thomas, C.A.; Doty, P. A Further Examination of the Molecular Weight and Size of Desoxypentose Nucleic Acid. J. Am. Chem. Soc. 1954, 76, 3047–3053. [Google Scholar] [CrossRef]
  87. Bruker Analytical X-ray Systems, Inc. Apex2, Version 2 User Manual, M86–E01078; Bruker Analytical X-ray Systems, Inc.: Billerica, MA, USA, 2006. [Google Scholar]
  88. Siemens Industrial Automation, Inc. SADABS: Area–Detector Absorption Correction; Siemens Industrial Automation, Inc.: Madison, WI, USA, 1996. [Google Scholar]
  89. Palatinus, L.; Chapuis, G. SUPERFLIP—A Computer Program for the Solution of Crystal Structures by Charge Flipping in Arbitrary Dimensions. J. Appl. Crystallogr. 2007, 40, 786–790. [Google Scholar] [CrossRef]
  90. Betteridge, P.W.; Carruthers, J.R.; Cooper, R.I.; Prout, K.; Watkin, D.J. CRYSTALS Version 12: Software for Guided Crystal Structure Analysis. J. Appl. Crystallogr. 2003, 36, 1487. [Google Scholar] [CrossRef]
Figure 1. Syntax formula of (A) 3,5–dibromo–salicylaldehyde (3,5–diBr–saloH), (B) 2,9–dimethyl–1,10–phenanthroline (neoc), and (C) 1,10–phenanthroline (phen).
Inorganics 12 00138 g001
Figure 2. Synthetic routine and proposed structures for complexes 1–3.
Inorganics 12 00138 g002
Figure 3. Molecular structure of [Ni(3,5–diBr–salo)2(neoc)] (complex 1). Aromatic hydrogen and methyl hydrogen atoms have been omitted for clarity.
Inorganics 12 00138 g003
Figure 4. UV–vis spectra of a DMSO solution of [Ni(3,5–diBr–salo)2(neoc)] (complex 1) and [Ni(3,5–diBr–salo)2(phen)] (complex 2) (1 × 10⁻⁴ M) in the presence of increasing amounts of CT DNA. The arrows show the changes upon increasing amounts of CT DNA.
Inorganics 12 00138 g004
Figure 5. Relative viscosity (η/η0)1/3 of CT DNA (0.1 mM) in buffer solution (150 mM of NaCl and 15 mM of trisodium citrate at pH 7.0) in the presence of complexes 1–3 at increasing amounts (r = [complex]/[DNA]).
Inorganics 12 00138 g005
Figure 6. (A) Fluorescence emission spectra (λexcitation = 540 nm) for EB–DNA adduct ([EB] = 20 µM, [DNA] = 26 µM) in buffer solution (150 mM of NaCl and 15 mM of trisodium citrate at pH = 7.0) in the presence of increasing amounts of [Ni(3,5–diBr–salo)2(H2O)2] (complex 3). (B) Plot of relative EB–DNA fluorescence emission intensity at λemission = 594 nm (I/Io, %) vs. r (r = [complex]/[DNA]) in the presence of complexes 1–3 (up to 45.2% of the initial EB–DNA fluorescence for [Ni(3,5–diBr–salo)2(neoc)] (complex 1), 48.2% for [Ni(3,5–diBr–salo)2(phen)] (complex 2), and 41.3% for [Ni(3,5–diBr–salo)2(H2O)2] (complex 3)).
Inorganics 12 00138 g006
Figure 7. (A) Fluorescence emission spectra (λexcitation = 295 nm) of BSA (3 µM) in buffer solution (150 mM of NaCl and 15 mM of trisodium citrate at pH = 7.0) in the absence and presence of increasing amounts of [Ni(3,5–diBr–salo)2(neoc)] (complex 1). (B) Plot of relative BSA-fluorescence emission intensity at λem,max = 345 nm (I/Io, %) vs. r (r = [complex]/[BSA]) for complexes 1–3 (up to 14.4% of the initial BSA fluorescence for [Ni(3,5–diBr–salo)2(neoc)] (complex 1), 10.3% for [Ni(3,5–diBr–salo)2(phen)] (complex 2), and 16.0% for [Ni(3,5–diBr–salo)2(H2O)2] (complex 3)). (C) Fluorescence emission spectra (λexcitation = 295 nm) of HSA (3 µM) in buffer solution (150 mM of NaCl and 15 mM of trisodium citrate at pH = 7.0) in the absence and presence of increasing amounts of [Ni(3,5–diBr–salo)2(H2O)2] (complex 3). (D) Plot of relative HSA-fluorescence emission intensity at λem,max = 340 nm (I/Io,%) vs. r (r = [complex]/[HSA]) for complexes 1–3 (up to 31.0% of the initial HSA fluorescence for [Ni(3,5–diBr–salo)2(neoc)] (complex 1), 20.9% for [Ni(3,5–diBr–salo)2(phen)] (complex 2), and 26.2% for [Ni(3,5–diBr–salo)2(H2O)2] (complex 3)).
Inorganics 12 00138 g007
Table 1. Experimental X-ray crystallography details for [Ni(3,5–diBr–salo)2(neoc)] (complex 1).
Complex 1
Crystal data
Chemical formulaC28H18Br4N2NiO4
Mr824.79
Crystal systemMonoclinic
Space groupP21/c
Temperature (K)295
a (Å)16.604 (8)
b (Å)24.002 (13)
c (Å)14.571 (8)
β (°)103.381 (12)
V3)5649 (5)
Z8
Radiation typeMo Kα
µ (mm−1)6.38
Crystal size (mm)0.15 × 0.12 × 0.11
Data collection
DiffractometerBruker Kappa Apex2
Absorption correctionNumerical Analytical Absorption (De Meulenaer and Tompa, 1965)
Tmin, Tmax0.46, 0.50
No. of measured reflections58,802
No. of independent reflections10,738
No. of observed [I > 2.0σ(I)] reflections7018
Rint0.042
(sin θ/λ)max−1)0.613
Refinement
R[F2 > 2σ(F2)]0.038
wR(F2)0.085
S1.00
No. of reflections7018
No. of parameters703
H-atom treatmentH-atom parameters constrained
Δρmax, Δρmin (e Å−3)0.49, −0.98
Table 2. Selected bond lengths (Å) and bond angles (°) for [Ni(3,5–diBr–salo)2(neoc)] (complex 1).
1A 1B
BondLength (Å)BondLength (Å)
Ni1—O12.106(4)Ni2—O52.092(4)
Ni1—O22.018(4)Ni2—O62.033(4)
Ni1—O32.097(5)Ni2—O72.060(4)
Ni1—O41.953(4)Ni2—O82.037(4)
Ni1—N12.115(5)Ni2—N32.134(5)
Ni1—N22.160(5)Ni2—N42.103(5)
BondsAngle (°)BondsAngle (°)
O1—Ni1—O286.99(16)O5—Ni2—O689.41(17)
O1—Ni1—O4170.44(17)O5—Ni2—O8173.40(18)
O2—Ni1—N1173.05(19)O6—Ni2—N3172.78(17)
O3—Ni1—O487.93(19)O7—Ni2—O888.58(17)
O3—Ni1—N2172.04(17)O7—Ni2—N4171.09(17)
N1—Ni1—N278.3(2)N3—Ni2—N478.54(19)
Table 3. UV–vis spectroscopic features of the interaction of 3,5–diΒr–saloH and complexes 1–3 with CT DNA. UV band (λmax, nm) (percentage of the observed hyper-/hypo-chromism (ΔA/A0, %), red/blue shift (Δλ, nm)) and DNA-binding constants (Kb, in M−1).
Compoundλmax (nm) ((ΔA/Aο, %) a (Δλ, nm) b)Kb (M−1)
3,5–diΒr–saloH [28]337 (<–50 c, elim d), 427(>+50 c, 0)3.71(±0.14) × 105
Complex 1277 (–10, +1); 422 (+35, +3)4.22(±0.86) × 105
Complex 2277 (–8, 0); 425(+25, +4)3.26(±0.75) × 105
Complex 3278(–6, 0); 422 (+30, +3)2.83(±0.70) × 105
a “+” denotes hyperchromism; “–” denotes hypochromism. b “+” denotes red shift; “–” denotes blue shift. c “>+50” denotes intense hyperchromism; “<–50” denotes intense hypochromism. d “elim” denotes elimination of the band.
Table 4. Percentage of EB–DNA fluorescence quenching (ΔI/Io, %) and the Stern–Volmer (KSV, in M−1) and EB–DNA quenching constants (Kq, in M−1s−1) for 3,5–diΒr–saloH and complexes 1–3.
CompoundΔΙ/Ι0(%)Κsv (M−1)Kq (M−1s−1)
3,5–diΒr–saloH [28]46.63.95(±0.10) × 1041.72(±0.04) × 1012
Complex 154.84.11(±0.11) × 1041.78(±0.05) × 1012
Complex 251.88.56(±0.15) × 1043.72(±0.06) × 1012
Complex 358.75.33(±0.09) × 1042.32(±0.04) × 1012
Table 5. Albumin-quenching constants (Kq, in M−1s−1) and albumin-binding constants (K, in M−1) for 3,5–diΒr–saloH and complexes 1–3.
CompoundKq(BSA) (M−1s−1)Κ(BSA) (M−1)Kq(HSA) (M−1s−1)Κ(HSA) (M−1)
3,5–diΒr–saloH [28]1.63(±0.02) × 10145.76(±0.30) × 1065.08(±0.15) × 10131.55(±0.10) × 106
Complex 11.20(±0.10) × 10131.01(±0.10) × 1058.72(±0.21) × 10122.23(±0.21) × 104
Complex 23.43(±0.70) × 10138.21(±0.70) × 1041.62(±0.15) × 10132.50(±0.15) × 104
Complex 38.97(±0.50) × 10121.89(±0.50) × 1056.00(±0.23) × 10129.13(±0.23) × 104
Disclaimer/Publisher’s Note: The statements, opinions and data contained in all publications are solely those of the individual author(s) and contributor(s) and not of MDPI and/or the editor(s). MDPI and/or the editor(s) disclaim responsibility for any injury to people or property resulting from any ideas, methods, instructions or products referred to in the content.

