
The Surface Temperature of Water in Polish and Belarusian Lakes during the Period of Climate Change


1
Faculty of Earth Sciences, Nicolaus Copernicus University, 87-100 Toruń, Poland
2
Laboratory of Lake Research, Belarusian State University, 220030 Minsk, Belarus
*
Author to whom correspondence should be addressed.
Limnol. Rev. 2022, 22(1), 13-22; https://doi.org/10.3390/limnolrev22010005
Submission received: 11 April 2023
/
Accepted: 19 April 2023
/
Published: 23 April 2023
Abstract
:The paper presented the results of surface water temperature measurements from 17 lakes located in northern Poland and Belarus over the period of 50 years (1971–2020). Using the Excel computer program, Corel Quattro Pro 8, and graphic Draw 9, annual and monthly averages, extreme values, and annual and monthly trends were calculated and presented. These were supplemented by the monthly average air temperatures for 13 weather stations. The research showed that the temperature in all lakes was characterized by a positive trend at the level of 0.044 °C year−1. The largest lake was characteristic for the Chervonoe Lake—0.066 °C year−1—and the smallest 0.029 °C year−1 for the deep Lake Hańcza. In the course of the average monthly surface water temperatures, a positive trend was also observed, ranging from 0.015 °C year−1 in January to 0.069 °C year−1 in May. These values correlated with the average air temperatures in the winter months (December–March) and with the winter NAO index (DJFM).
1. Introduction
The temperature of surface water in lakes is one of the basic abiotic features of the lake ecosystem, determining the dynamics and rate of metabolism in water bodies, and determines the intensity of mixing of water masses. It is also an important parameter in shaping the trophy of individual reservoirs [1]. It also becomes the most sensitive element, susceptible to any changes in the natural environment, especially climatic conditions, both seasonally and in the long term. The surface layer of water in lakes, including, as it is commonly accepted, a layer up to a depth of 1–2 m. It is a boundary layer, through which the exchange of energy and mass occurs between the lake and its surroundings, the solar radiation absorption zone, the water circulation zone, the layer in which the mechanisms shaping the thermal structures waters are of fundamental importance for the heat balance, and the hydrological regime, the layer in which the course of both short-term and long-term changes are characterized by the greatest variability and differentiation [2,3].
The long-term results of surface water temperature measurements were used to distinguish periods in the annual cycle. The dates of the formation and disappearance of the ice cover, the permanent transition of the surface water temperature by the value of 4 and 15 °C, both in spring and autumn, and the dates of the minimum and maximum water temperatures were taken into account [2,4,5].
The differences in the water temperature in the surface layer (1–2 m thick) between the littoral (shore) and deep-water parts of the lake, carried out on lakes of various shapes and degrees of formation of individual elements of the lake basin, showed that the greatest differences between the coastal and deep (profundal) parts occurred during the spring warming up of the water, and they rarely exceeded 3–4 °C, most often oscillating within the range of 1.5–2.5 °C [6].
The aim of ths study is to present changes in the course of the surface water temperature in selected lakes in Poland and Belarus and their spatial differentiations in the period of 1971–2020 during the period of climate change.
2. Materials and Methods
Out of the 17 analyzed lakes covered by surface water temperature measurements, 2 were located in the Greater Poland–Kuyavian Lakeland (Gopło, Sławskie), 5 lakes in the Pomeranian Lakeland (Charzykowskie, Gardno, Lubie, Łebsko, Raduńskie Górne), 5 in the Masurian Lakeland (Jeziorak, Mikołajskie, Nidzkie, Hańcza, Studzieniczne), 3 in the Belarusian Lake District (Narocz, Drywiaty, Łukomskoe), and 2 in the Polesie area (Wygonoszczanskoe, Czerwonoe) (Figure 1). All of the lakes, except those located in Polesie, were of a post-glacial origin. Their location was marked by Lake Lubie in the west (15.9° E) and in the east by Lake Lukomskoe (29.1° E), while they were marked in the north by Lake Drywiaty (55.6° N) and in the south by Lake Czerwonoe (52.4° N). The distance between the positions of the extreme lakes from west to east was approx. 1130 km (13.2°).
The largest lakes were Naroch (7960 ha) and Łebsko (7020 ha), while the smallest lakes were Studzieniczne (244.0 ha) and Hańcza (291.5 ha). In terms of depth, the deepest were Lake Hańcza (106.1 m) and Lubie (46.2 m), and the shallowest were Vygonoshchanskoe (2.3 m) and Chervonoe (2.6 m). The analyzed lakes were also clearly diversified in terms of their capacity. The largest capacities were Lake Naroch (710.4 hm3) and Lake Lukomskoe (249.0 hm3), and the smallest were lake Studzieniczne (22.07 hm3) and Lake Chervonoe (27.35 hm3). The remaining morphometric data are presented in Table 1.
The analysis of the surface water temperature for 17 lakes was presented on the basis of daily temperature measurements from the Institute of Meteorology and Water Management in Warsaw and the Hydrometeorological Service of the Republic of Belarus in Minsk taken at a depth of 0.4 m in the coastal zone at 7:00 (6:00 GMT) in the 50 years 1971–2020 [7]. On this basis, decade averages, monthly averages, and annual averages in the aforementioned multiannual period were calculated. These data were also the basis for determining the extreme values, determining the tendency of changes and decade-long increases and decreases in surface water temperature.
The calculated parameters of water and air temperature in lakes were presented on the basis of the Excel and Corel Quattro Pro 8 computer programs, while the graphic processing was presented using the Corel Draw 9 program.

| No | Lake | Geographic Location (°) | Area (ha) | Volume (hm3) | Depth (m) | Average Width (m) | ||
|---|---|---|---|---|---|---|---|---|
| Maximum | Mean | Latitude | Longitude | |||||
| 1 | Lubie | 52.5 | 15.9 | 1487.5 | 169.88 | 46.2 | 11.6 | 1040 |
| 2 | Sławskie | 51.9 | 16.0 | 822.5 | 42.66 | 12.3 | 5.2 | 898 |
| 3 | Gardno | 54.7 | 17.1 | 2337.5 | 30.95 | 2.6 | 1.3 | 3682 |
| 4 | Łebsko | 54.7 | 17.4 | 7020.0 | 117.52 | 6.3 | 1.6 | 4366 |
| 5 | Charzykowskie | 53.8 | 17.5 | 1336.0 | 134.53 | 30.5 | 9.8 | 1360 |
| 6 | Raduńskie Górne | 54.2 | 18.0 | 362.5 | 60.16 | 43.0 | 15.5 | 521 |
| 7 | Gopło | 52.6 | 18.4 | 2121.5 | 78.5 | 16.6 | 3.6 | 295 |
| 8 | Jeziorak | 53.7 | 19.6 | 3152.5 | 141.59 | 12.9 | 4.1 | 1172 |
| 9 | Mikołajskie | 53.8 | 21.6 | 424.0 | 55.74 | 25.9 | 11.2 | 866 |
| 10 | Nidzkie | 53.6 | 21.6 | 1750.0 | 113.87 | 23.7 | 6.2 | 790 |
| 11 | Hańcza | 54.3 | 22.8 | 291.5 | 120.36 | 106.1 | 38.7 | 688 |
| 12 | Studzieniczne | 53.9 | 23.1 | 244.0 | 22.07 | 30.5 | 8.7 | 730 |
| 13 | Vygonoshchanskoe | 52.7 | 26.0 | 2600.0 | 32.1 | 2.3 | 1.2 | 3710 |
| 14 | Naroch | 54.9 | 26.8 | 7960.0 | 710.4 | 24.8 | 8.9 | 6200 |
| 15 | Driviaty | 55.6 | 27.0 | 3614.0 | 223.52 | 12.0 | 6.1 | 3570 |
| 16 | Chervonoe | 52.4 | 28.0 | 4032.0 | 27.35 | 2.9 | 0.7 | 3500 |
| 17 | Lukomskoe | 54.7 | 29.1 | 3771.0 | 249.0 | 11.5 | 6.6 | 3500 |
3. Results
The analyzed area, where the analyzed lakes were located, was characterized by transitional climate features; they were more oceanic in the western part to more continental in its eastern part, which was expressed by a distinct distinctiveness of climatic conditions. This character was presented for the monthly and annual mean air temperatures and their amplitudes in the years 1971–2020 (Table 2).
The average annual air temperature west of the Vistula River was over 8.2 °C and 7.1 °C in the Masurian Lake District, clearly decreasing in the northern part of the Belarusian Lake District to 6.0 °C (Lyntupy). Only in the area of Polesie was it about 7.3 °C. The differentiation was even clearer for the average monthly temperatures. In the winter months (December, January, February), the area east of the Vistula River, when the temperature was clearly negative, to the west of this river, it rarely dropped below 0 °C. In the area of the Belarusian Lake District, it dropped below 4.3 °C, reaching −6.2 °C at the Liepel station in January. This spatial variation in air temperature was emphasized by the mean annual amplitudes. East of the Vistula River, the amplitude was always higher than 22.4 °C, exceeding 24.0 °C at some stations. On the other hand, at the checkpoints in the Belarusian Lake District, it reached an average of 23 °C (Table 2). Thus, the areas located to the east of the meridian of 23° E were characterized by a much greater degree of continentalism.
The spatial thermal system over the discussed area also emphasized the course of ice phenomena on the lakes. It also determined the influence of air temperature on the course of the surface water temperature, especially in the winter months (December–March). Preliminary information about the occurrence of the ice cover in the analyzed area indicated a significant diversity of its dates. In all the lakes analyzed in this study, in the years 1971–2020, the dates of its appearance were more and more late, with the trend of 0.26–0.39 days year−1. The beginning of the appearance of the ice cover on the lakes was slightly diversified and was recorded from December 14 on the lakes in the Belarusian Lake District to 28 December in the lake districts in Poland. In turn, the dates of its disappearance were from 8 March in the lakes west of the Vistula River, to 17 March east of it and 22 March in the Belarusian Lake District. Their dates were characterized by earlier decay dates, with a negative trend of 0.5–0.6 days year−1. This spatial differentiation was emphasized by the time of its occurrence, which ranged from 61 days in the lakes west of the Vistula River and 75 days in the Masurian Lake District to 108 days in the lakes located in the Belarusian Lake District.
The mean annual surface water temperatures in the analyzed multi-year period 1971–2020 were clearly differentiated and ranged from 8.6 °C for Lake Hańcza to 11.0 °C for lakes: Sławskie and Gopło (Table 3). Towards the east it decreased to below 9.0 °C in the lakes in the Belarusian Lake District.
In particular years of the analyzed multi-year period, the highest values were characteristic for the years 1990, 2002, and 2007, and 2007 was the warmest year. In all of the lakes, the mean annual water temperature was below 9.5 °C.
In the course of the monthly mean surface water temperatures, the highest values were recorded most often in July and less frequently in August. They ranged from 18.4 °C in Lake Gardno to 21.8 °C in Lake Chervonoe (Table 3). The highest values of the average monthly surface temperature of water on lakes in Poland occurred in July 1994, when the monthly average exceeded 24 °C (Jeziorak 25.2 °C, Gopło 24.3 °C and Sławskie 24.1 °C). Generally, the highest values of the surface water temperature in the summer, with few exceptions, were found in the shallowest lakes located in the Greater Poland Lakeland. On the other hand, for decade intervals (10 days), the highest average temperatures in the analyzed 50-year period occurred in the first decade of August (average for Polish lakes was 20.6 °C, while the lowest was in the third decade of January (1.28 °C) and the first decade of February (1.31 °C).
Two directions of the energy flow in the annual heat exchange cycle between the lake and the atmosphere. The first one was directed to the lake and was related to the absorption of heat by the surface layer of water. The heating of this layer in the lakes of the Polish Lowlands usually took place from the second decade of February and lasted until the second decade of August. The second period, on the other hand, concerned the emission of heat and was directed at the atmosphere. It usually fell from the second decade of August and lasted until the second decade of February. Both periods were separated by the moment of equilibrium in the heat exchange, dates of occurrence, and length, of which, in particular, the years are clearly different. The duration of these periods is well illustrated by the average dates of selected temperatures in the annual course [10].
The different course of surface water temperature between the lakes was obtained by analyzing the average dates of specific water temperatures (Table 4).
The absolutely highest surface water temperatures in the analyzed lakes were recorded usually at the turn of July and August. The highest temperature 32.7 °C was measured on 15 July 2014 in the Chervonoe lake and 30.1 °C in the Lukomskoe lake, while the lowest was 0.0 °C many times in all analyzed lakes (Table 5) (Skowron 2008, State water cadaster 1971–2021).
It was unequivocally found that the course of the mean annual surface water temperatures in all lakes presented in this study was characterized by a positive trend at the level of 0.044 °C year−1. The largest lake was characteristic for Lake Chervonoe—0.066 °C year−1 and the smallest 0.029 °C year−1 for the deep Lake Hańcza. In the course of the monthly mean water temperatures, a positive trend was also noted on the level from 0.015 °C year−1 in January to 0.069 °C year−1 in May. Their extreme values ranged from −0.021 °C year−1 for Lake Gopło in December to 0.130 °C year−1 for Lake Chervonoe in May (Table 6).
4. Discussion
Already, the first results of water temperature measurements in lakes in Europe confirmed the increasing influence of zonal atmospheric circulation, especially since the beginning of the 1990s [11,12,13,14]. The intensity of the inflow of air masses to the areas of Western Europe, the Baltic Coast, and the East European Lowlands was determined by the activity of permanent atmospheric pressure systems—the Icelandic Lowlands and the Azores Highlands, expressed by the NAO (North Atlantic Oscillation) coefficient. Research has shown that the North Atlantic Oscillation had a large impact on the air temperature and the temperature of lake waters in Poland, especially in the winter [2,15,16,17].
The analysis of long-term changes in surface water temperature in many lakes in the northern hemisphere showed that a significant increase in both air temperature and surface water temperature in lakes was observed from the 1990s and the first 1920s [13,14,18,19,20,21,22]. In Poland, research in this area conducted in the years 1961–2020 on a dozen lakes also confirmed a similar trend [2,3,23].
The increase in air temperature caused significant changes in the functioning of the entire lake ecosystem, especially in the course of the surface water temperature in lakes and the thermal structure of the water (increase in the temperature of the epilimnion and its range, deepening the location of the thermocline, increasing temperature gradients in the thermocline) [2,22,24,25].
This tendency was confirmed by the increase in surface water temperature in many lakes located in the western part of Europe [14]. The author reported that Lake Windermere (England) increased by 1.4 °C in 1960–2000, and Lake Lough Feeagh (West Ireland) increased by 0.7 °C in 1960–1997. The average water temperature in Lake Zurich in Switzerland from 1950 to 1990 increased at a rate of 0.16 °C per decade and in Lake Constance by about 0.1 °C [12]. This trend was complemented by exceptionally high increases of 1.6 °C per decade in Lake Stensjön in Sweden [26]. Additionally, the surface water temperature in many lakes in Finland, Austria, and Switzerland during the summer increased by 0.38, 0.43, and 0.29 °C per decade, respectively [14,27]. These conclusions were confirmed by more detailed results of regional studies [28,29,30].
In the lakes of Latvia in 1946–2002, the long-term average annual surface water temperature showed a statistically significant positive trend of 0.4–0.8 °C [31]. This was confirmed by studies on large lakes in Estonia (Peipus and Võrtsjärv), where the temporal variability of climatic seasons in the years 1946–2000 was determined [19]. The most significant trend was obtained for winter (the ice cover period), which was shortened by 17 days. In Lake Ladoga, a positive trend was found at the level of 0.05–0.07 °C year−1 [13,32].
The results of the research carried out on Lithuanian lakes showed that the average annual surface water temperature in 1991–2000 was 0.6 °C higher than the average for the years 1981–1990 [20]. In turn, Kilkus and Valiuskevicius (2001) indicated that this increase in Lithuanian lakes began in the years 1981–1985 and continued to this day [33].
5. Conclusions
The results of the measurements of water temperature in lakes in Europe confirmed the growing importance of zonal atmospheric circulation, especially since the beginning of the 1970s [14,32]. This was confirmed by the relationship between air temperature in December–March and the winter NAO index (DJFM) (Figure 2).
The water temperature in lakes in northern Poland in the winter and spring seasons was clearly higher than the average in the positive NAO phase (DJFM) than in the negative phase. The spatial distribution of air temperature changes was different than that of water temperatures in lakes. The observed changes concerned not only the size of the differences in water and air temperature values but, mainly, their temporal and spatial variability. These differences resulted from the locations and morphometries of the lakes. An important parameter controlling the reaction of thermal features of lake waters to changes in air temperature was the average depth of the lakes. The lakes with the greatest average depths (over 15 m) were more “resistant” to air temperature changes, while shallower lakes with polymictic features were more sensitive [2,17].
It has been noted that the greatest increases in surface water temperature in lakes in the annual course occurred, on average, in the temperature range of 9.7–14.7 °C at the turn of April and May, while its greatest drops were, on average, in the range of 7.6–9.6 °C at the turn of October and November. The results of calculating temperature trends in the course of the decade averages were consistent with the average increases and decreases in water temperature in the decade intervals.
The observed increase in water temperature in lakes caused, among others, the intense North Atlantic Oscillation, which could lead to a gradual transformation of lake ecosystems. The transformation may affect both their physical and chemical processes and phenomena as well as the living conditions in the aquatic environment different from before. This could lead to changes in the biocenosis of the entire lake ecosystem [37,38].
In the context of the obtained results, the average temperatures in the surface layer of water and the dates of the occurrence of certain water temperatures justified the division of the annual course into four periods; winter with the phase of winter cooling and the phase of winter heating, spring with the early and late phase of spring heating, summer with the phase of summer heating and cooling, and autumn with the first and second phases of autumn cooling [2].
Author Contributions
Conceptualization, R.S.; methodology, R.S.; investigation, R.S. and N.S.; writing—original draft preparation, R.S.; writing—review and editing, N.S.; visualization, R.S. All authors have read and agreed to the published version of the manuscript.
Funding
This research received no external funding.
Institutional Review Board Statement
Not applicable.
Informed Consent Statement
Not applicable.
Data Availability Statement
Primary data from the territory of Belarus (the results of measurements on hydrological and meteorological stations in Belarus) are unavailable for downloading, in accordance with policies of the Hydrometeorological Service of the Republic of Belarus.
Conflicts of Interest
The authors declare no conflict of interest.
References
- Lampert, W.; Sommer, U. Ekologia Wód Śródlądowych (Ecology of Inland Waters); Wydaw. Nauk. PWN: Warszawa, Poland, 1996; 390p. (In Polish) [Google Scholar]
- Skowron, R. Zróżnicowanie i Zmienność Wybranych Elementów Reżimu Termicznego w Jeziorach na Niżu Polskim (The Differentiation and the Changeability of Chosen of Elements the Thermal Regime of Water in Lakes on Polish Lowland); Wydaw. UMK: Toruń, Poland, 2011; 345p. (In Polish) [Google Scholar]
- Sobolewski, W.; Borowiak, D.; Borowiak, M.; Skowron, R. Baza danych Jezior Polski i Jej Wykorzystanie w Badaniach Limnologicznych (Database of Polish Lakes and Its Use in Limnological Studies); Wydaw. Picador—UMCS: Lublin, Poland, 2014; 198p. (In Polish) [Google Scholar]
- Tikhomirov, A.I. Termika Krupnykh Ozer (Thermal Regime of Large Lakes); Izdat. Nauka: Leningrad, Russia, 1982; 208p. (In Russian) [Google Scholar]
- Skowron, R. Surface water thermal seasons in Polish lakes, their distribution and spatial differentiation. Limnol. Rev. 2001, 1, 251–263. [Google Scholar]
- Skowron, R. Roczny cykl temperatury wody powierzchniowej w jeziorach na Niżu Polskim i jego zmienność (Annual cycle of surface water temperature in the lakes in the Polish Lowland and its changeability). In Obieg Wody w Środowisku Naturalnym i Przekształconym (Water Circulation in Natural and Transformed Environment); Michalczyk, Z., Ed.; Badania Hydrograficzne w Poznaniu Środowiska: Lublin, Poland, 2007; Volume 8, pp. 452–461, (In Polish, English summary). [Google Scholar]
- Gosudarstvennyy Vodnyy Kadastr (State Water Cadaster). Ezhegodnye Dannye o Rezhime i Resursah Poverhnostnykh Vod. (Annual Data on the Regime and Resources of Inland Waters); State Water Cadaster: Minsk, Belarus, 1971–2021; Volume 3. (In Russian) [Google Scholar]
- Choiński, A. Limnologia Fizyczna Polski (Physical Limnology of Poland); Wydaw. UAM: Poznań, Poland, 2007; 548p. (In Polish) [Google Scholar]
- Vlasov, B.P.; Yakushko, O.F.; Gigevich, G.S.; Rachevskij, A.N.; Loginova, E.V. Oziora Belarusi: Spravochnik (Lakes of Belarus: Handbook); RUP Minsktipproekt: Minsk, Belarus, 2004; 284p. (In Russian) [Google Scholar]
- Efremova, T.; Palshin, N.; Belashev, B. Water temperature of different types of lakes in Karelia under changing climate based on data of instrumental measurements in 1953–2011. Water Resour. 2016, 43, 228–238. [Google Scholar] [CrossRef]
- Hurrell, J.W. Decadal trends in the North Atlantic Oscillation: Regional temperatures and precipitation. Science 1995, 269, 676–679. [Google Scholar] [CrossRef] [PubMed]
- Straile, D.; Livingstone, D.M.; Weyhenmeyer, G.A.; George, D.G. The response of freshwater ecosystems to climate variability associated with the North Atlantic Oscillation. In The North Atlantic Oscillation: Climatic Significance and Environmental Impact; Hurrell, J.W., Kushnir, Y., Ottersen, G., Visbeck, M., Visbeck, M.H., Eds.; American Geophysical Union: Washington, DC, USA, 2003; pp. 263–279. [Google Scholar]
- Naumenko, M.A.; Guzivaty, V.V.; Karetnikov, S.G. O klimticheskikh trendakh temperatury poverkhnsti vody Ladozhskogo ozera v bezledny period (Climatic trends of the water surface temperature in Lake Ladoga during ice-free periods). In Doklady Earth Sciences; Springer: Berlin/Heidelberg, Germany, 2006; Volume 408, pp. 1–4. (In Russian) [Google Scholar]
- Dokulil, M.T. Impact of climate warming on European inland waters. Inland Waters 2013, 4, 27–40. [Google Scholar] [CrossRef]
- Skowron, R. Thermal structure of water during the summer in the lakes in the Polish Lowlands as a result of their varied morphometry. Limnol. Rev. 2020, 20, 89–95. [Google Scholar] [CrossRef]
- Skowron, R. Ice phenomena in investigations of Polish lakes. Bull. Geogr. Phys. Geogr. Ser. 2021, 20, 15–29. [Google Scholar] [CrossRef]
- Wrzesiński, D.; Choiński, A.; Ptak, M. Effect of the North Atlantic Oscillation on the thermal characteristics of lakes in Poland. Acta Geophys. 2015, 63, 863–883. [Google Scholar] [CrossRef]
- Gronskaya, T.P.; Lemeshko, N.A.; Arvola, L.; Jarvinen, M. Lakes of European Russia and Finland as indicators of climate change. World Resour. Rev. 2002, 14, 189–203. [Google Scholar]
- Järvet, A. Influence of Hydrological Factors and Human Impact on the Ecological State of Shallow Lake Võrtsjärv in Estonia. Ph.D. Thesis, Tartu University Press, Tartu, Estonia, 2004; 119p. [Google Scholar]
- Pernaravičiūtė, B. The impact of climate change on thermal regime of Lithuanian lakes. Ekologija 2004, 2, 58–63. [Google Scholar]
- Nõges, T.; Tuvikene, L.; Nõges, P. Contemporary trends of temperature, nutrient loading, and water quality in large Lakes Peipsi and Võrtsjärv, Estonia. Aquat. Ecosyst. Health Manag. 2010, 13, 143–153. [Google Scholar] [CrossRef]
- Woolway, R.I.; Dokulil, M.T.; Marszelewski, W.; Schmid, M.; Bouffard, D.; Merchant, C.J. Warming of Central European lakes and their response to the 1980s climate regime shift. Clim. Change 2017, 142, 505–520. [Google Scholar] [CrossRef]
- Dąbrowski, M.; Marszelewski, W.; Skowron, R. The trends and dependencies between air and water temperatures in the lakes located in Northern Poland in the years 1961–2000. Hydrol. Earth Syst. Sci. 2004, 8, 79–87. [Google Scholar] [CrossRef]
- Kilkus, K. Dimiktinų Ežerų Terminės Struktūros (Thermal Structures of Dimictic Lakes); VU Leid.: Vilnius, Lithuania, 2000; 200p. (In Lithuanian) [Google Scholar]
- Choiński, A.; Ptak, M.; Strzelczak, A. Changeability of accumulated heat content in Alpine-type lakes. Pol. J. Environ. Stud. 2015, 24, 2363–2369. [Google Scholar] [CrossRef]
- Adrian, R.; O’Reilly, C.M.; Zagarese, H.; Baines, S.B.; Essen, D.O.; Keller, W.; Livingstone, D.M.; Sommaruga, R.; Strable, D.; Van Donk, E.; et al. Lakes as sentinels of climate change. Limnol. Oceanogr. 2009, 54 Pt 2, 2283–2297. [Google Scholar] [CrossRef] [PubMed]
- Arvola, L.; George, G.; Livingstone, D.M.; Järvinen, M.; Blenckner, T.; Dokulil, M.T.; Jennings, E.; Aonghusa, C.N.; Nõges, P.; Nõges, T.; et al. The impact of the changing climate on the thermal characteristics of lakes. In The Impact of Climate Change on European Lakes; George, D.G., Ed.; Aquatic Ecology Series 4; Springer: Dordrecht, The Netherlands, 2010; pp. 85–101. [Google Scholar]
- Lieberherr, G.; Wunderle, S. Lake Surface Water Temperature Derived from 35 Years of AVHRR Sensor Data for European Lakes. Remote Sens. 2018, 10, 990. [Google Scholar] [CrossRef]
- Livingstone, D.M.; Dokuli, M.T. Eighty years of spatially coherent Austrian lake surface temperatures and their relationship to regional air temperature and the North Atlantic Oscillation. Limnol. Oceanogr. 2001, 46, 1220–1227. [Google Scholar] [CrossRef]
- Sukhovilo, N.Y. Wliyanie mietieorologiczeskich i klimaticzeskich uslowiy na tiermodinamiczeskie processy w raznotipnych oziorach Bielarusi (Influence of meteorological and climatic conditions on thermodynamic processes in different types of Belarusian lakes). Acta Geogr. Sil. 2019, 13, 47–60, (In Russian, English summary). [Google Scholar]
- Apsīte, E.; Elferts, D.; Zubaničs, A.; Latkovska, I. Long-term changes in hydrological regime of the lakes in Latvia. Hydrol. Res. 2014, 45, 308–321. [Google Scholar] [CrossRef]
- Naumenko, M.A.; Guzivaty, V.V.; Karetnikov, S.G. Surface temperature climatic trends in Lake Ladoga: Do they exist during ice-free period? Limnol. Rev. 2008, 8, 103–108. [Google Scholar]
- Kilkus, K.; Valiuškevičius, G. Klimato svyravimų atspindţiai eţerų ir upių hidrologiniuose bei hidrofizikiniuose rodikliuose (Reflections of climate fluctuations in the hydrological and hydrophysical indicators of lakes and rivers). In Klimato Svyravimų Poveikis Fiziniams Geografiniams Procesams Lietuvoje (Impact of Climate Fluctuations on Physical Geographical Processes in Lithuania); Bukantis, A., Gulbinas, Z., Kazakevičius, S., Kilkus, K., Mikelinskienė, A., Morkūnaitė, R., Rimkus, E., Samuila, M., Stankūnavičius, G., Valiuškevičius, G., et al., Eds.; Geografijos Institutas, Vilniaus Universitetas: Vilnius, Lithuania, 2001; pp. 194–232. (In Lithuanian) [Google Scholar]
- Danilovish, I. Influence of climate warming on hydrological regime of lakes and reservoirs in Belarus. In Lakes and Artificial Water Reservoirs. Natural Processes and Socio-Economic Importance; Jankowski, A.T., Rzętała, M., Eds.; University of Silesia-Faculty of Earth Sciences, Polish Limnological Society: Sosnowiec, Poland, 2005; pp. 53–58. [Google Scholar]
- Skowron, R. Extreme thermal phenomena of surface water in the lakes of Northern Poland. Limnol. Rev. 2008, 9, 27–39. [Google Scholar]
- Skowron, R. Criteria of thermal classifications of lakes. Bull. Geography. Phys. Geogr. Ser. 2009, 93–108. [Google Scholar] [CrossRef]
- Schindler, D.W. The effects of climate warming on the properties of boreal lakes and streams at the Experimental Lakes Area, northwestern Ontario. Limnol. Oceanogr. 1996, 41, 1004–1017. [Google Scholar] [CrossRef]
- Blenckner, T. Climate Related Impacts on a Lake: From Physics to Biology. Ph.D. Thesis, Acta Universitatis Upsaliensis, Uppsala, Sweden, 2001; 37p. [Google Scholar]
Figure 1.
Location of lakes on which surface water temperature measurements in period 1971–2020 in Poland: (1—Lubie; 2—Sławskie; 3—Gardno; 4—Łebsko; 5—Charzykowskie; 6—Raduńskie Górne; 7—Gopło; 8—Jeziorak; 9—Mikołajskie; 10—Nidzkie; 11—Hańcza; 12—Studzieniczne) and Belarus: (13—Vygonoshchanskoe; 14—Naroch; 15—Driviaty; 16—Chervonoe; 17—Lukomskoe) and meteorological stations (black squares).
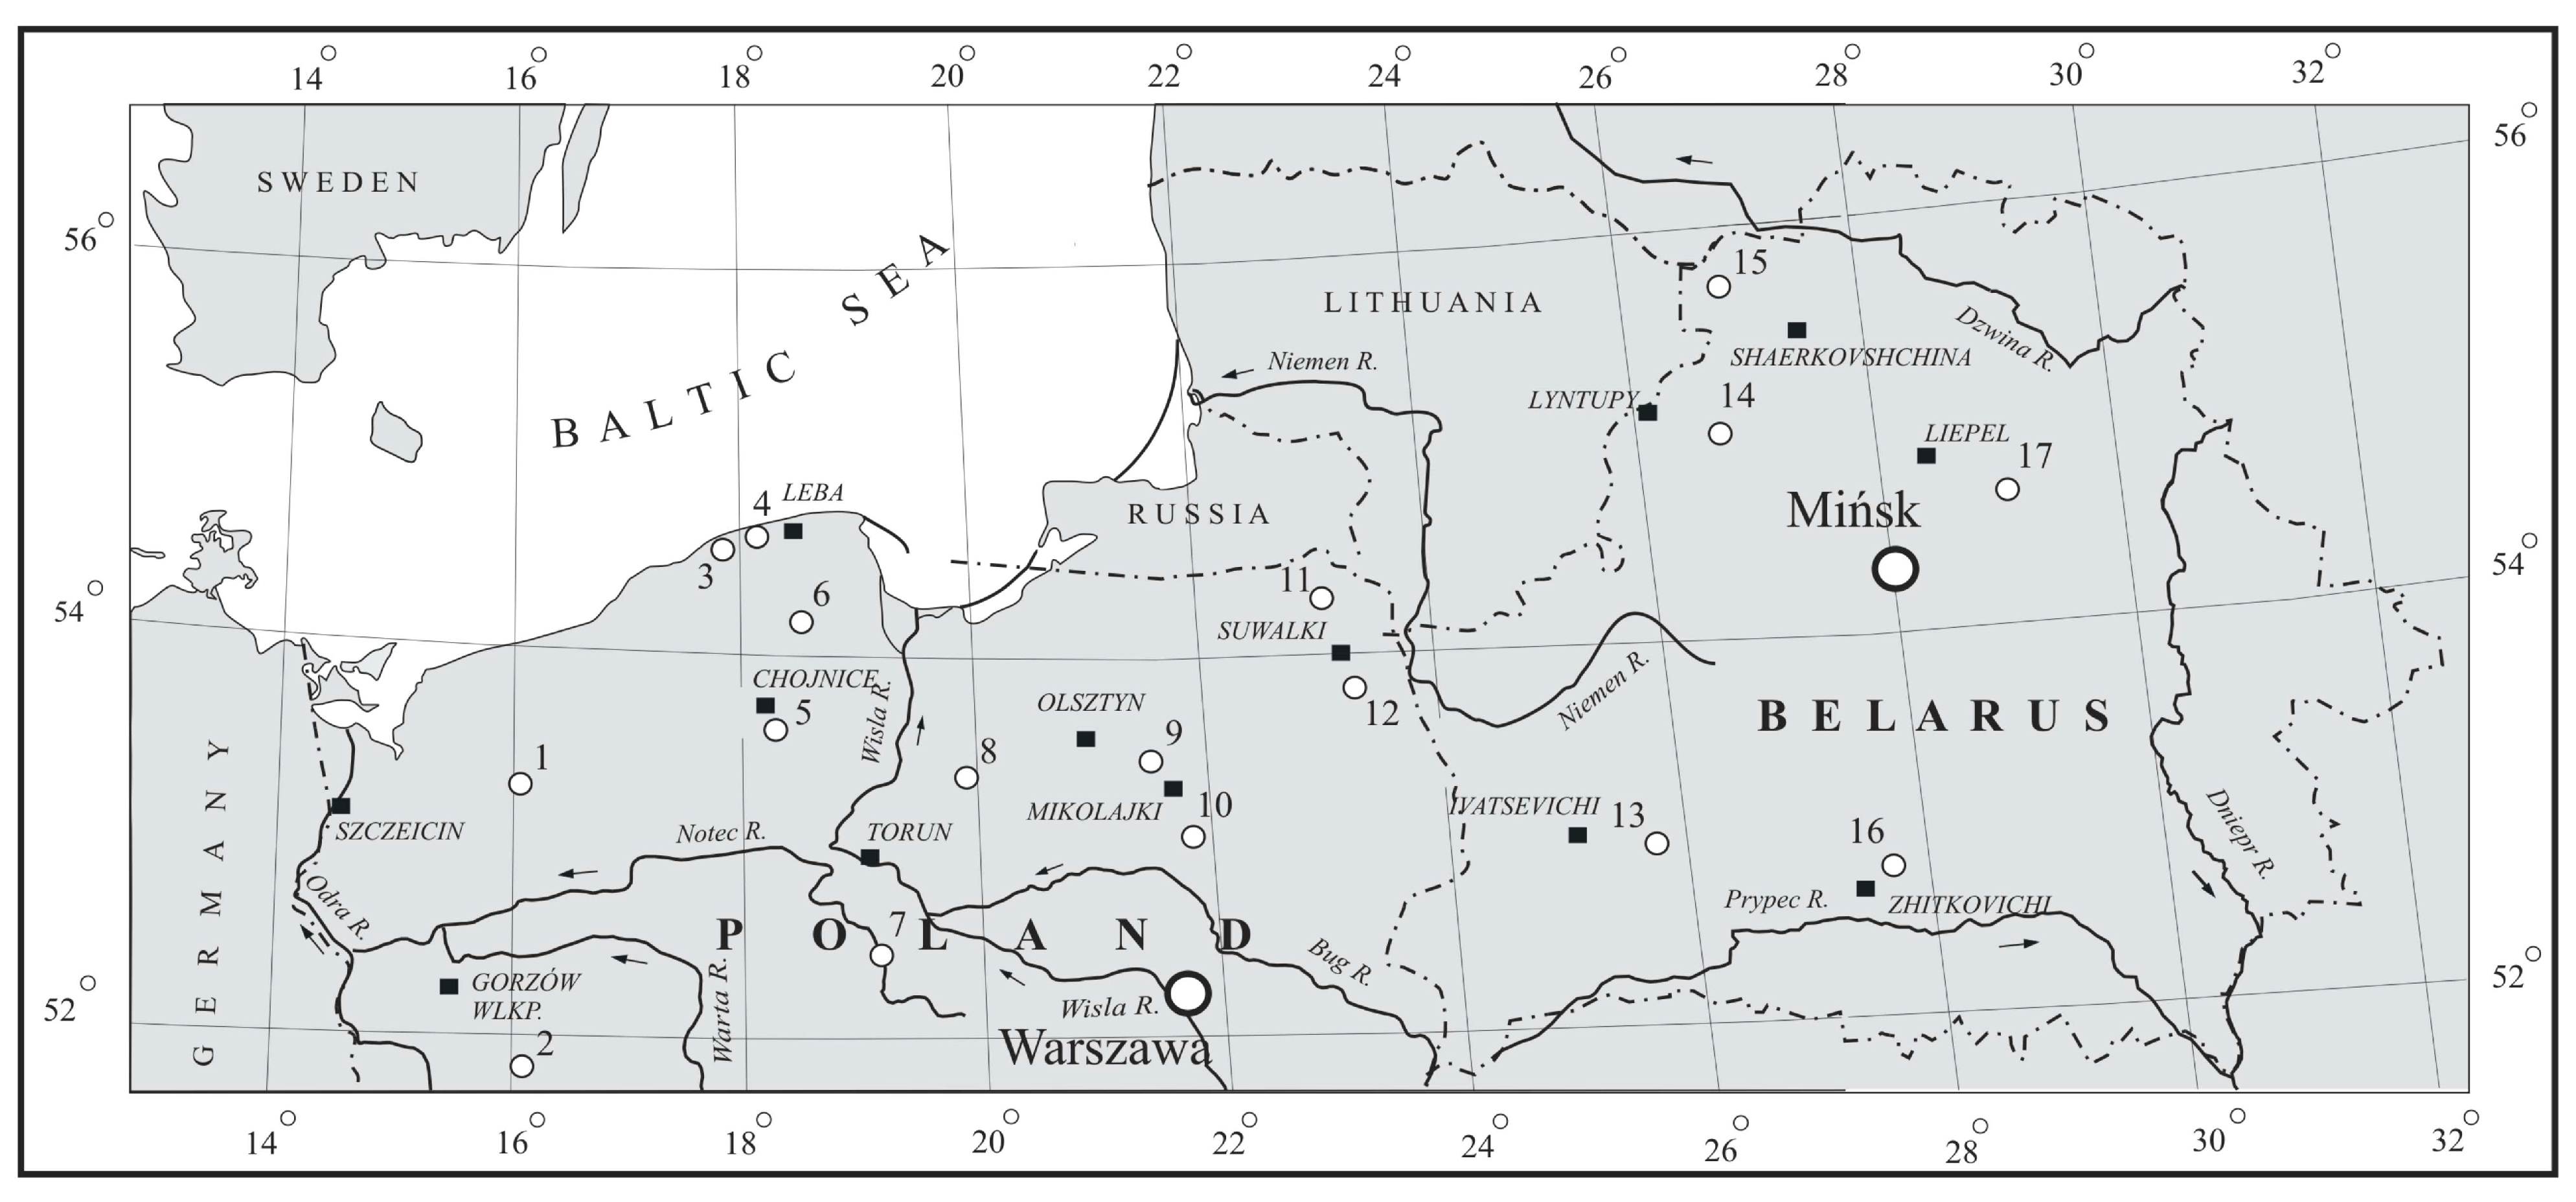
Figure 2.
The relationship between the average air temperature in December-March and the winter NAO index (DJFM) in the period 1971–2020 for the stations: (A)—Gorzów Wielkopolski; (B)—Olsztyn; (C)—Vitebsk.
Figure 2.
The relationship between the average air temperature in December-March and the winter NAO index (DJFM) in the period 1971–2020 for the stations: (A)—Gorzów Wielkopolski; (B)—Olsztyn; (C)—Vitebsk.
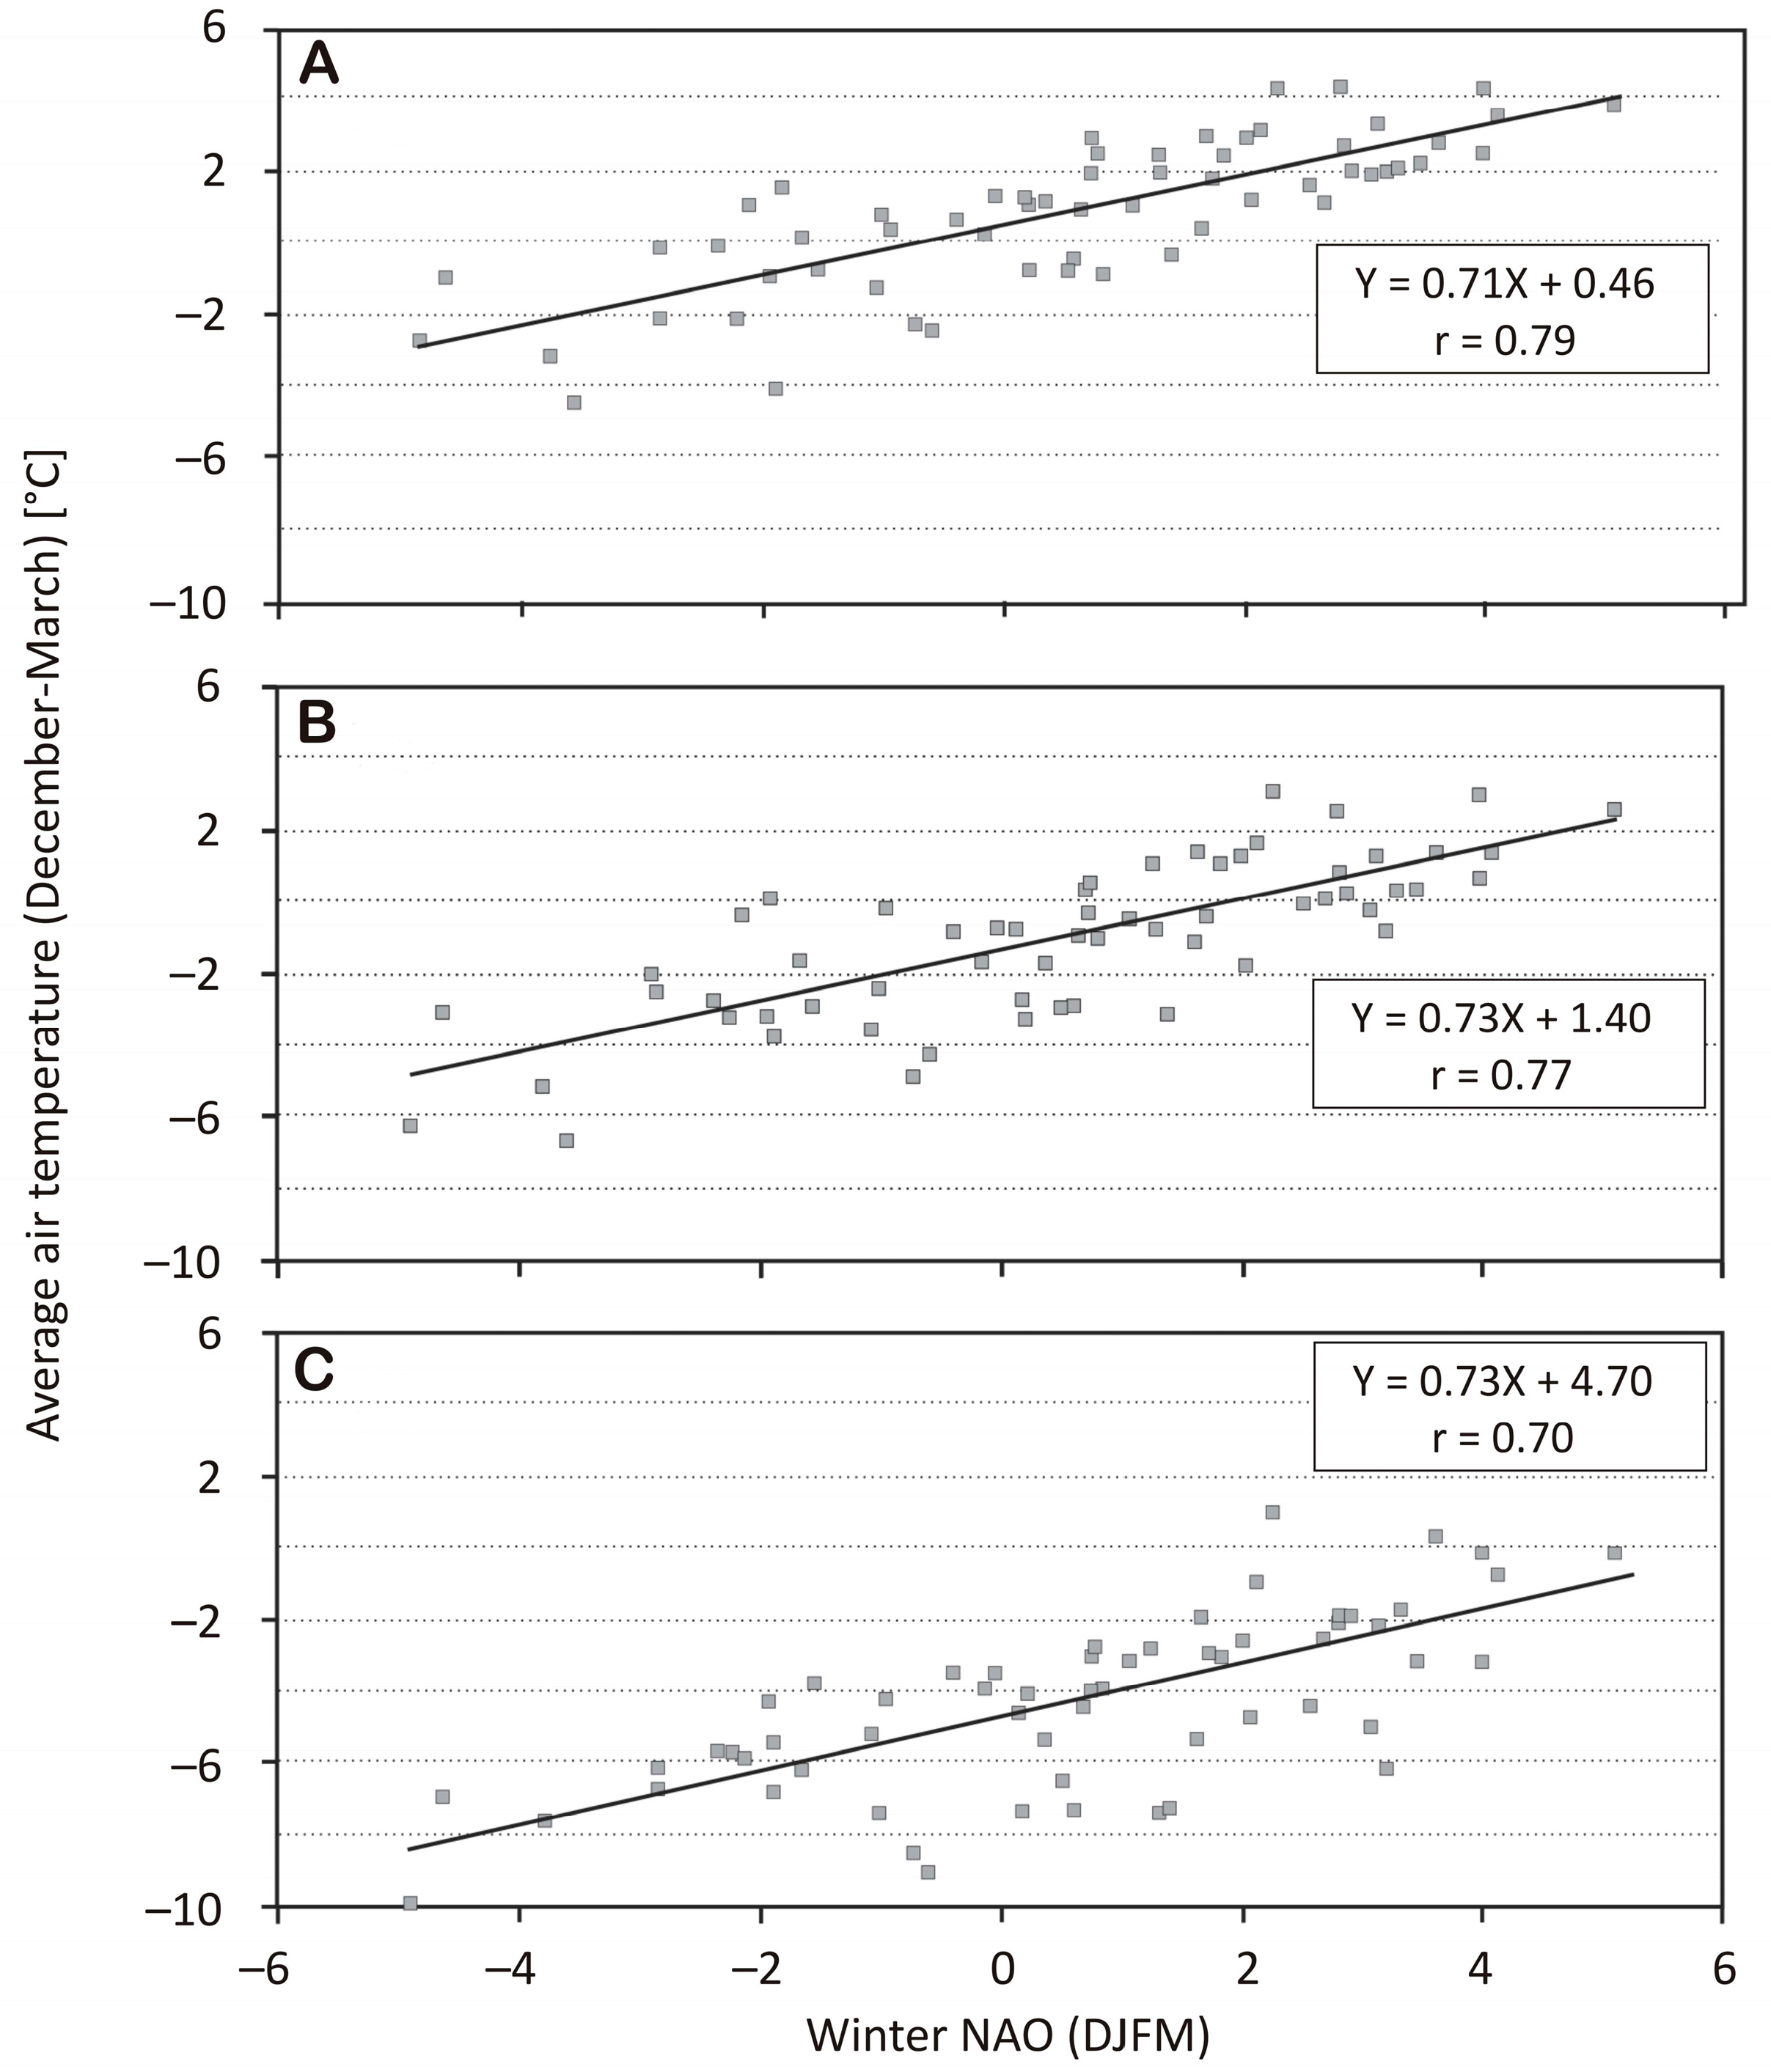
Table 2.
Average monthly and annual air temperatures and amplitude (Ampl.) at selected meteorological stations in Poland and Belarus in the period 1971–2020 (calculated on the basis of data from the Institute of Meteorology and Water Management in Poland and Republican Center for Hydrometeorology, Control of Radioactive Contamination and Environmental Monitoring).
| Station | Nov | Dec | Jan | Feb | Mar | Apr | May | Jun | Jul | Aug | Sep | Oct | Year | Ampl. |
|---|---|---|---|---|---|---|---|---|---|---|---|---|---|---|
| Szczecin | 4.5 | 1.2 | −0.4 | 0.4 | 3.5 | 8.2 | 13.1 | 16.4 | 18.2 | 17.7 | 13.8 | 9.2 | 8.8 | 20.6 |
| Gorzów Wielkopolski | 4.0 | 0.5 | −1.0 | 0.1 | 3.5 | 8.5 | 13.5 | 16.8 | 18.5 | 18.1 | 13.9 | 9.0 | 8.8 | 21.4 |
| Łeba | 4.6 | 1.2 | −0.6 | −0.1 | 2.2 | 6.1 | 10.7 | 14.5 | 16.9 | 16.9 | 13.5 | 9.2 | 7.9 | 19.0 |
| Chojnice | 3.0 | −0.6 | −2.4 | −1.5 | 1.7 | 7.0 | 12.2 | 15.4 | 17.2 | 16.8 | 12.7 | 7.9 | 7.4 | 21.5 |
| Toruń | 3.6 | −0.2 | −-2.0 | −1.0 | 2.6 | 7.9 | 13.4 | 16.7 | 18.5 | 17.9 | 13.4 | 8.5 | 8.3 | 22.7 |
| Olsztyn | 2.7 | −1.0 | −2.8 | −2.0 | 1.5 | 6.5 | 11.7 | 14.6 | 16.7 | 16.1 | 12.0 | 7.5 | 7.0 | 22.8 |
| Mikołajki | 3.0 | −1.2 | −3.4 | −-2.5 | 0.9 | 6.9 | 12.8 | 16.1 | 18.0 | 17.5 | 13.1 | 8.0 | 7.4 | 23.4 |
| Suwałki | 2.0 | −2.2 | −4.4 | −3.7 | 0.1 | 6.5 | 12.4 | 15.6 | 17.3 | 16.7 | 12.0 | 6.8 | 6.6 | 24.0 |
| Liepel | 0.6 | −3.7 | −6.2 | −5.5 | −1.0 | 6.3 | 12.9 | 16.3 | 17.9 | 16.7 | 11.6 | 5.9 | 6.1 | 24.1 |
| Lyntupy | 1.0 | −3.2 | −4.9 | −4.8 | −0.6 | 6.1 | 12.2 | 15.3 | 17.3 | 16.2 | 11.3 | 5.9 | 6.0 | 22.2 |
| Sharkovshchina | 1.2 | −2.7 | −4.1 | −4.0 | 0.1 | 7.1 | 12.8 | 16.2 | 18.5 | 17.2 | 12.1 | 6.2 | 6.8 | 22.7 |
| Ivatsevichi | 2.1 | −2.0 | −3.6 | −2.9 | 1.5 | 8.1 | 14.0 | 17.1 | 18.8 | 18.0 | 12.9 | 7.4 | 7.7 | 22.4 |
| Zhitkovichi | 1.9 | −2.5 | −4.9 | −3.8 | 0.8 | 8.1 | 14.1 | 17.3 | 18.8 | 17.8 | 12.7 | 7.1 | 7.3 | 23.7 |
Table 3.
Average monthly and annual surface water temperatures in selected lakes of Poland and Belarus in the period 1971–2020.
Table 3.
Average monthly and annual surface water temperatures in selected lakes of Poland and Belarus in the period 1971–2020.
| No | Lake | Nov | Dec | Jan | Feb | Mar | Apr | May | Jun | Jul | Aug | Sep | Oct | Year |
|---|---|---|---|---|---|---|---|---|---|---|---|---|---|---|
| 1 | Lubie | 6.05 | 2.66 | 1.42 | 1.47 | 2.94 | 6.71 | 12.87 | 17.62 | 19.79 | 19.63 | 15.54 | 10.80 | 9.79 |
| 2 | Sławskie | 6.46 | 2.81 | 1.76 | 2.07 | 4.15 | 8.90 | 15.22 | 19.43 | 21.16 | 21.19 | 17.23 | 12.06 | 11.04 |
| 3 | Gardno | 4.63 | 2.12 | 1.26 | 1.28 | 2.79 | 7.13 | 12.95 | 16.75 | 18.53 | 17.90 | 13.74 | 8.97 | 9.02 |
| 4 | Łebsko | 4.98 | 2.46 | 1.60 | 1.62 | 3.38 | 7.88 | 13.31 | 16.93 | 18.91 | 18.37 | 14.08 | 9.33 | 9.41 |
| 5 | Charzykowskie | 6.55 | 3.11 | 1.50 | 1.31 | 2.43 | 5.98 | 12.70 | 17.46 | 19.62 | 19.61 | 15.81 | 11.28 | 9.78 |
| 6 | Raduńskie Górne | 6.29 | 3.27 | 1.73 | 1.54 | 2.49 | 5.41 | 11.24 | 16.45 | 18.59 | 18.81 | 15.23 | 10.67 | 9.31 |
| 7 | Gopło | 7.04 | 3.93 | 2.46 | 2.56 | 4.35 | 8.24 | 14.49 | 19.01 | 20.64 | 20.41 | 16.63 | 12.10 | 11.04 |
| 8 | Jeziorak | 5.24 | 2.17 | 1.30 | 1.34 | 2.95 | 7.97 | 14.96 | 19.34 | 21.05 | 20.88 | 16.25 | 10.61 | 10.40 |
| 9 | Mikołajskie | 6.94 | 2.85 | 1.13 | 0.96 | 1.77 | 5.17 | 12.27 | 17.68 | 19.91 | 20.31 | 16.53 | 11.80 | 9.81 |
| 10 | Nidzkie | 5.44 | 1.88 | 0.90 | 0.94 | 2.38 | 7.08 | 14.13 | 18.67 | 20.58 | 20.51 | 16.25 | 10.82 | 9.97 |
| 11 | Hańcza | 4.75 | 2.35 | 1.13 | 0.89 | 1.48 | 3.73 | 9.76 | 16.91 | 19.32 | 19.28 | 14.70 | 9.47 | 8.65 |
| 12 | Studzieniczne | 5.40 | 2.14 | 1.23 | 1.20 | 1.95 | 5.84 | 13.72 | 18.58 | 20.44 | 20.32 | 15.87 | 10.45 | 9.76 |
| 13 | Wygonoszczanskoe | 2.74 | 0.62 | 0.19 | 0.20 | 1.20 | 7.71 | 14.65 | 18.61 | 20.00 | 19.16 | 13.85 | 8.36 | 8.99 |
| 14 | Narocz | 3.18 | 0.66 | 0.18 | 0.14 | 0.43 | 4.78 | 12.58 | 17.70 | 19.90 | 19.72 | 14.90 | 8.42 | 8.55 |
| 15 | Drywiaty | 2.72 | 0.62 | 0.20 | 0.15 | 0.71 | 5.02 | 12.24 | 17.83 | 19.93 | 19.27 | 14.62 | 8.12 | 8.45 |
| 16 | Chervonoe | 2.85 | 0.55 | 0.15 | 0.24 | 1.58 | 7.93 | 15.66 | 20.18 | 21.84 | 20.98 | 15.55 | 8.45 | 9.66 |
| 17 | Łukomskoe * | 4.26 | 1.32 | 0.32 | 0.33 | 1.46 | 6.51 | 13.88 | 19.06 | 21.35 | 20.85 | 16.12 | 10.27 | 9.49 |
*—Lake Lukomskoe is under the influence of a thermal power plant.
Table 4.
Average dates when the surface water temperature passed through selected limit values in lakes in Poland and Belarus in the period 1971–2020 (based on data from the Institute of Meteorology and Water Management, PIB, and the Hydrometeorological Service of the Republic of Belarus in Minsk).
Table 4.
Average dates when the surface water temperature passed through selected limit values in lakes in Poland and Belarus in the period 1971–2020 (based on data from the Institute of Meteorology and Water Management, PIB, and the Hydrometeorological Service of the Republic of Belarus in Minsk).
| No | Lake | Spring | Max | Autumn | ||||||||
|---|---|---|---|---|---|---|---|---|---|---|---|---|
| 2 °C | 4 °C | 10 °C | 15 °C | 20 °C | 20 °C | 15 °C | 10 °C | 4 °C | 2 °C | |||
| 1 | Lubie | 8 Mar | 25 Mar | 4 May | 27 May | 30 Jun | 27 Jul | 19 Aug | 20 Sep | 22 Oct | 2 Dec | 26 Dec |
| 2 | Sławskie | 22 Feb Feb | 12 Mar | 22 Apr | 14 May | 12 Jun | 24 Jul | 1 Sep | 29 Sep | 27 Oct | 3 Dec | 26 Dec |
| 3 | Gardno | 9 Mar | 23 Mar | 30 Apr | 30 May | 24 Jun | 25 Jul | 10 Aug | 7 Sep | 10 Oct | 20 Nov | 13 Dec |
| 4 | Łebsko | 1 Mar | 20 Mar | 27 Apr | 25 May | 19 Jun | 24 Jul | 15 Aug | 10 Sep | 13 Oct | 23 Nov | 19 Dec |
| 5 | Charzykowskie | 12 Mar | 1 Apr | 6 May | 29 May | 26 Jun | 30 Jul | 18 Aug | 20 Sep | 24 Oct | 9 Dec | 29 Dec |
| 6 | Raduńskie Górne | 8 Mar | 3 Apr | 12 May | 3 Jun | 3 Jul | 23 Jul | 12 Aug | 17 Sep | 21 Oct | 9 Dec | 4Jan |
| 7 | Gopło | 23 Feb | 10 Mar | 28 Apr | 20 May | 20 Jun | 14 Jul | 25 Aug | 28 Sep | 30 Oct | 14 Dec | 24 Dec |
| 8 | Jeziorak | 7 Mar | 24 Mar | 26 Apr | 16 May | 11 Jun | 27 Jul | 27 Aug | 22 Sep | 21 Oct | 25 Nov | 19 Dec |
| 9 | Mikołajskie | 18 Mar | 8 Apr | 8 May | 28 May | 19 Jun | 29 Jul | 25 Aug | 28 Sep | 28 Oct | 8 Dec | 25 Dec |
| 10 | Nidzkie | 13 Mar | 28 Mar | 29 Apr | 21 May | 16 Jun | 26 Jul | 26 Aug | 23 Sep | 21 Oct | 25 Nov | 14 Dec |
| 11 | Hańcza | 23 Mar | 19 Apr | 18 May | 4 Jun | 2 Jul | 1 Aug | 15 Aug | 14 Sep | 13 Oct | 23 Nov | 23 Dec |
| 12 | Studzieniczne | 15 Mar | 6 Apr | 3 May | 22 May | 15 Jun | 24 Jul | 23 Aug | 21 Sep | 19 Oct | 27 Nov | 15 Dec |
| 13 | Vygonoshchanskoe | – | 6 Apr | 28 Apr | – | – | 15 Jul | – | – | 11 Oct | 10 Nov | – |
| 14 | Naroch | – | 20 Apr | 11 May | – | – | 18 Jul | – | – | 11 Oct | 13 Nov | – |
| 15 | Driviaty | – | 15 Apr | 7 May | – | – | 16 Jul | – | – | 10 Oct | 09 Nov | – |
| 16 | Chervonoe | – | 4 Apr | 28 Apr | – | – | 20 Jul | – | – | 13 Oct | 11 Nov | – |
| 17 | Lukomskoe * | – | 5 Apr | 3 May | – | – | 17 Jul | – | – | 17 Oct | 19 Nov | – |
Explanations: *—Lake Lukomskoe is under the influence of a thermal power plant.
Table 5.
Extreme water temperature values in the analyzed lakes in the period 1971–2020 (based on the data obtained from the Institute of Meteorology and Water Management and the Hydrometeorological Service of the Republic of Belarus in Minsk).
Table 5.
Extreme water temperature values in the analyzed lakes in the period 1971–2020 (based on the data obtained from the Institute of Meteorology and Water Management and the Hydrometeorological Service of the Republic of Belarus in Minsk).
| No | Lake | Mean Annual | Extremal | |
|---|---|---|---|---|
| Maximal (Year) | Minimal (Year) | Maximal (Date) | ||
| 1 | Lubie | 11.74 (2016) | 7.93 (1980) | 26.9 (17 July 2010) |
| 2 | Sławskie | 12.35 (2014) | 9.47 (1980) | 27.8 (27 July 2007) |
| 3 | Gardno | 10.26 (2016) | 7.54 (1996) | 25.4 (15 July 1995) |
| 4 | Łebsko | 10.56 (2014) | 8.18 (1987) | 26.2 (30 July 1994) |
| 5 | Charzykowskie | 11.98 (2018) | 8.23 (1984) | 26.7 (4 August 2018) |
| 6 | Raduńskie Górne | 10.38 (2014) | 7.85 (1980) | 24.8 (12 July 2010) |
| 7 | Gopło | 13.05 (2009) | 9.25 (1974) | 27.8 (29 July 1994) |
| 8 | Jeziorak | 11.67 (2014) | 8.56 (1984) | 29.2 (16 August 1994) |
| 9 | Mikołajskie | 12.05 (2014) | 8.39 (1980) | 27.6 (1 August 1994) |
| 10 | Nidzkie | 11.85 (2018) | 8.06 (1980) | 27.6 (3 August 2018) |
| 11 | Hańcza | 9.66 (2010) | 7.18 (1977) | 26.4 (6 August 1994) |
| 12 | Studzieniczne | 11.83 (2014) | 8.17 (1980) | 27.4 (18 July 2010) |
| 13 | Vygonoshchanskoe | 10.50 (2019) | 7.27 (1993) | 28.5 (18 July 2010) |
| 14 | Naroch | 10.39 (2020) | 6.62 (1976) | 29.7 (16 August 2010) |
| 15 | Driviaty | 10.00(2019) | 6.88 (1977) | 28.8 (31 July 1994) |
| 16 | Chervonoe | 11.66 (2019) | 7.18 (1980) | 32.7 (15 July 2014) |
| 17 | Lukomskoe * | 11.03 (2010) | 7.83 (1980) | 30.1 (23 July 2010) |
Explanations: *—Lake Lukomskoe is under the influence of a thermal power plant.
Table 6.
Average monthly and annual trend in surface water temperatures in selected lakes of Poland and Belarus in the period 1971–2020 (based on IMiGW PIB and the Hydrometeorological Service of the Republic of Belarus in Minsk). Statistical significance <0.001 is shown in bold.
Table 6.
Average monthly and annual trend in surface water temperatures in selected lakes of Poland and Belarus in the period 1971–2020 (based on IMiGW PIB and the Hydrometeorological Service of the Republic of Belarus in Minsk). Statistical significance <0.001 is shown in bold.
| No | Lake | Nov | Dec | Jan | Feb | Mar | Apr | May | Jun | Jul | Aug | Sep | Oct | Year |
|---|---|---|---|---|---|---|---|---|---|---|---|---|---|---|
| 1 | Lubie | 0.064 | 0.051 | 0.033 | 0.030 | 0.050 | 0.074 | 0.088 | 0.083 | 0.067 | 0.065 | 0.070 | 0.062 | 0.061 |
| 2 | Sławskie | 0.054 | 0.037 | 0.023 | 0.028 | 0.032 | 0.054 | 0.056 | 0.056 | 0.055 | 0.056 | 0.051 | 0.046 | 0.045 |
| 3 | Gardno | 0.037 | 0.027 | 0.016 | 0.017 | 0.029 | 0.053 | 0.044 | 0.041 | 0.034 | 0.044 | 0.048 | 0.039 | 0.034 |
| 4 | Łebsko | 0.021 | 0.010 | 0.009 | 0.012 | 0.018 | 0.058 | 0.050 | 0.047 | 0.044 | 0.041 | 0.045 | 0.029 | 0.031 |
| 5 | Charzykowskie | 0.043 | 0.043 | 0.036 | 0.036 | 0.048 | 0.066 | 0.064 | 0.053 | 0.050 | 0.049 | 0.051 | 0.034 | 0.047 |
| 6 | Raduńskie Górne | 0.034 | 0.034 | 0.031 | 0.027 | 0.036 | 0.053 | 0.080 | 0.063 | 0.038 | 0.041 | 0.040 | 0.026 | 0.042 |
| 7 | Gopło | −0.020 | −0.021 | 0.020 | 0.039 | 0.065 | 0.095 | 0.108 | 0.067 | 0.042 | 0.055 | 0.036 | −0.007 | 0.044 |
| 8 | Jeziorak | 0.046 | 0.025 | 0.008 | 0.007 | 0.026 | 0.048 | 0.043 | 0.053 | 0.057 | 0.065 | 0.073 | 0.046 | 0.047 |
| 9 | Mikołajskie | 0.034 | 0.030 | 0.016 | 0.017 | 0.027 | 0.046 | 0.047 | 0.044 | 0.046 | 0.052 | 0.048 | 0.034 | 0.036 |
| 10 | Nidzkie | 0.043 | 0.024 | 0.011 | 0.013 | 0.027 | 0.059 | 0.051 | 0.055 | 0.053 | 0.063 | 0.051 | 0.038 | 0.039 |
| 11 | Hańcza | 0.015 | −0.010 | 0.003 | 0.011 | 0.026 | 0.048 | 0.073 | 0.074 | 0.038 | 0.043 | 0.026 | 0.035 | 0.029 |
| 12 | Studzieniczne | 0.041 | 0.032 | 0.015 | 0.016 | 0.028 | 0.059 | 0.052 | 0.049 | 0.046 | 0.052 | 0.053 | 0.043 | 0.039 |
| 13 | Vygonoshchanskoe | 0.054 | 0.015 | 0.006 | 0.009 | 0.060 | 0.097 | 0.078 | 0.079 | 0.091 | 0.082 | 0.054 | 0.034 | 0.051 |
| 14 | Naroch | 0.063 | 0.030 | 0.008 | 0.004 | 0.024 | 0.076 | 0.070 | 0.076 | 0.083 | 0.070 | 0.033 | 0.042 | 0.048 |
| 15 | Driviaty | 0.062 | 0.031 | 0.007 | 0.001 | 0.028 | 0.043 | 0.068 | 0.068 | 0.041 | 0.030 | 0.043 | 0.018 | 0.037 |
| 16 | Chervonoe | 0.057 | 0.025 | 0.005 | 0.013 | 0.075 | 0.102 | 0.130 | 0.110 | 0.109 | 0.084 | 0.039 | 0.042 | 0.066 |
| 17 | Lukomskoe * | 0.047 | 0.033 | 0.012 | 0.010 | 0.041 | 0.060 | 0.064 | 0.080 | 0.094 | 0.085 | 0.086 | 0.016 | 0.052 |
Explanations: *—Lake Lukomskoe is under the influence of a thermal power plant.
Disclaimer/Publisher’s Note: The statements, opinions and data contained in all publications are solely those of the individual author(s) and contributor(s) and not of MDPI and/or the editor(s). MDPI and/or the editor(s) disclaim responsibility for any injury to people or property resulting from any ideas, methods, instructions or products referred to in the content. |
© 2023 by the authors. Licensee MDPI, Basel, Switzerland. This article is an open access article distributed under the terms and conditions of the Creative Commons Attribution (CC BY) license (https://creativecommons.org/licenses/by/4.0/).
Share and Cite
MDPI and ACS Style
Skowron, R.; Sukhovilo, N. The Surface Temperature of Water in Polish and Belarusian Lakes during the Period of Climate Change. Limnol. Rev. 2022, 22, 13-22. https://doi.org/10.3390/limnolrev22010005
AMA Style
Skowron R, Sukhovilo N. The Surface Temperature of Water in Polish and Belarusian Lakes during the Period of Climate Change. Limnological Review. 2022; 22(1):13-22. https://doi.org/10.3390/limnolrev22010005
Chicago/Turabian StyleSkowron, Rajmund, and Nina Sukhovilo. 2022. "The Surface Temperature of Water in Polish and Belarusian Lakes during the Period of Climate Change" Limnological Review 22, no. 1: 13-22. https://doi.org/10.3390/limnolrev22010005