
Hedging Effectiveness of Commodity Futures Contracts to Minimize Price Risk: Empirical Evidence from the Italian Field Crop Sector


Department of Land, Environment Agriculture and Forestry, University of Padua, 35122 Padova, Italy
*
Author to whom correspondence should be addressed.
Risks 2021, 9(12), 213; https://doi.org/10.3390/risks9120213
Submission received: 27 October 2021
/
Revised: 15 November 2021
/
Accepted: 18 November 2021
/
Published: 1 December 2021
Abstract
:Over the last years, farmers have been increasingly exposed to income risk due to the volatility of the commodities prices. Among others, hedging in futures markets (i.e., financial markets) represents an available strategy for producers to cope with income risks at farm level. To better understand the advantages of such promising tools, this paper aims at analyzing the hedging effectiveness for soybean, corn and milling wheat producers in Italy. Following the literature, three different methodologies (i.e., naïve, OLS, GARCH) are applied for the estimation of the hedge portfolio, then compared to an unhedged portfolio for assessing the income risk reduction. Findings confirm the hedging effectiveness of futures contracts for all the considered commodities, showing also that this effect increases with longer hedge horizons, and also showing better performances for the European exchange market (i.e., Euronext), compared to the North American counterpart.

1. Introduction
Since the beginning of the twenty-first century, global and domestic food prices have shown periods of high instability, during which agricultural commodities more than doubled their prices (Santeramo et al. 2018; USDA 2021). This market instability has become an important issue in the international debate (e.g., for scholars and policymakers), given its increasing effect on farmers (EPRS 2016). Price uncertainty represents one of the main risks for farmers, due to the natural time lapse between production and marketing decisions (Moschini and Hennessy 2001). In recent decades the increased price volatility, also emphasized by the COVID-19 pandemic (Höhler and Lansink 2021), inflated the general level of uncertainty in both global and domestic spot markets, making income risk a common threat for farmers (Tangermann 2011; Baffes and Haniotis 2016). According to the economic theory, this increasing uncertainty should incentivize the latent demand for risk management tools among farmers (Coletta et al. 2018).
Against this background, the European Union (EU) historically supported farmers facing risks. In particular, the most recent reforms of the Common Agricultural Policy promoted the adoption of different risk management tools, i.e., insurance, mutual funds, and the Income Stabilization Tool (De Castro et al. 2012; Frascarelli et al. 2021; Trestini et al. 2017a, 2017b). In addition to these, financial derivatives (e.g., contracts traded in financial exchanges) represent alternative instruments for farmers seeking to protect their income (EPRS 2016). Hedging with futures contracts allows farmers, or their associations, to mitigate the risk of adverse price movements by seeking to achieve delivery prices in advance (Hull 2008). So, the use of futures contracts provides a way for farmers to reduce the volatility of selling prices (Zuppiroli and Revoredo-Giha 2016), thus minimizing price risk and stabilizing income. Nevertheless, the adoption of futures contracts by farmers is still limited in Europe (Michels et al. 2019).
Like in other EU Member states, farmers in Italy cannot benefit directly from a domestic derivatives exchange. So, they resort to foreign markets for hedging purposes, as the Chicago Board of Trade (CBOT) or Euronext. Due to the imperfect correlation characterizing financial derivatives (e.g., futures prices) and domestic markets (e.g., spot prices), the evaluation of the hedging effectiveness (HE) of such financial instruments is a relevant issue. So far, the literature on HE in Italy is limited, with some rare exceptions (see for instance Stefani and Tiberti 2016; Zuppiroli and Revoredo-Giha 2016). To the best of the authors’ knowledge, the research measuring the hedging effectiveness for different commodities, also comparing different markets, and considering different time horizons is scant. To contribute to the literature, this paper represents an empirical investigation aiming at understanding whether futures contracts provide a good hedge in the field crop sector in Italy. More specifically, it focuses on Italian farmers producing standardized and storable commodities, namely soybean, corn and milling wheat which show higher effectiveness in the North American markets (Yang and Awokuse 2003). The paper also compares the effectiveness of different hedging strategies, taking into consideration both CBOT and Euronext exchange markets.
2. Hedging with Futures Contracts
Price risk for farmers refers to their uncertainty about the expected value of returns from selling products on the market (i.e., agricultural commodities). This is mainly due to the global phenomenon of price volatility (Santeramo et al. 2018; Candila and Farace 2018). Managing income risk with futures contracts implies that a producer takes a position on a financial exchange market (e.g., CBOT or Euronext); therefore, he will have a portfolio of a combined long spot position and a short hedge position1. Assuming a reduction in sales prices, farmers will experience a lower income reduction by holding the opposite position in the futures market. Indeed, if the value of the hedger’s spot market position decreases, the value of the hedger’s return from the futures market will increase, and vice versa (Hull 2008). This hedging activity would be effective if futures and spot prices moved perfectly together, so that an increase in one euro in the spot market would imply an increase in one euro in the futures market. However, as confirmed by the literature (Trestini and Penone 2018), futures and spot prices in distant markets are not perfectly correlated. Therefore, focusing on a specific market is essential to test the amount of income reduction that hedging with futures prices grants there.
To date, a considerable amount of research focusing on derivatives’ hedging effectiveness exists, for both storable and non-storable commodities (for a detailed review, see Chen et al. 2003). Research on cereals and oilseeds has been mainly applied in the North American market, where the use of futures contracts for price risk management is common among farmers (Antón et al. 2012). For instance, HE was evaluated in Ontario, measured through the stability of the basis between futures and spot prices (Carter 1984); findings supported the effectiveness in the use of the CBOT derivatives exchange to hedge price risk for both barley and corn producers in Canada. The most widespread principles for testing the effectiveness of a hedge portfolio refer to the Modern Portfolio Theory (Markowitz 1952), where portfolios of different assets are combined and examined through their mean and variance. Indeed, expected value and variance define a hedge portfolio, being the factors that would help farmers to choose between them. However, by assuming that hedgers (i.e., farmers) are infinite risk averse, thus always preferring the certain choice (Giampietri et al. 2020), the minimization of the variance of the hedge portfolio is analogous to the maximization of the producer expected utility. Thus, the application of the minimum variance hedge ratio holds for farmers (Rao 2000; Lence 1995; Chen et al. 2003). Furthermore, considering the imperfect correlation between futures and spot prices, the exact share of futures contracts used to cover a spot position (i.e., the optimal hedging ratio—OHR) should be estimated to calculate the hedge portfolio that minimizes variance. To this purpose, Ederington (1979) applied OLS regression to calculate OHR. Although it has been largely applied in literature (Lien et al. 2002; Yang and Allen 2005), the OLS model may be outperformed by conditional volatility models, as demonstrated by Chang et al. (2010) within the energy markets, or by Brooks and Chong (2001) within the currency markets. Conditional volatility models can be successfully applied (e.g., Generalized Autoregressive Conditional Heteroskedasticity model—GARCH), as in previous applications to the US cereals’ production (Dahlgran 2005; Wilson et al. 2006; Bekkerman 2011).
Performing hedging on futures market implies strategies costs, including commissions paid to brokers for administrative costs and for operation and regulation of the futures exchange (Hull 2008). Moreover, costs of hedging change with respect to the complexity of the hedging strategy. Thus, these costs are not taken into consideration into this analysis due to the impracticability of applying them to the analysis. The literature identifies benefits for the hedging activities, however the magnitude of the OHR and their effectiveness vary among markets and commodities. Empirical evidence also show that the hedging horizon can affect HE, with multiple studies showing that longer time horizons result in a higher reduction in the portfolio variance (Bekkerman 2011; Conlon et al. 2016).
Previous studies applied different risk measures to the HE portfolio analysis. For instance, McKenzie and Singh (2011) applied additional risk reduction measures to analyze the effectiveness of hedging practices to limit price volatility: they evaluated the worst expected losses (i.e., Value at Risk—VaR) of an unhedged and hedged portfolio for two US wheat markets, finding considerable differences in price risk reduction between them. These reported differences strongly suggest the necessity to evaluate HE in different markets, thus encouraging this research focused on the Italian field crop sector.
3. Materials and Methods
This paper aims at answering to the empirical question of whether futures contracts provide a good hedge for farmers in the field crop sector in Italy. Consider a hedger with a long (short) position in the cash markets: it follows that he will take a short (long) position in the futures market to offset the risk of the spot position. Given that spot and futures prices are not perfectly correlated in Italy (Trestini and Penone 2018), the OHR (γ) for a specific objective function must be calculated. According to the minimum variance (MV) hedging approach proposed by Johnson (1960) and Stein (1976) and developed by Ederington (1979), we assume that hedgers aim at minimizing the variance of the overall portfolio.
3.1. Dataset and Hedging Horizon
The analyzed period runs from January 2007 to December 2020. The dataset consists of weekly spot prices and futures contracts’ prices for three major agricultural commodities, namely soybean, corn and milling wheat (hereafter wheat), which account for more than 60% of the Italian cereals and oilseed production. The Italian spot prices for soybean corn and wheat are weekly wholesale prices listed on the Bologna market2, which show a high connection with international futures prices (Esposti and Listorti 2013). Opposite, futures contracts’ prices are retrieved from two different international exchanges: the CBOT3 and the Euronext4. However, price data for soybean are retrieved only from the CBOT market, because futures contracts for this crop are not traded by the Euronext.
As suggested by Conlon et al. (2016), the effectiveness of hedging practices is deeply affected by the choice of a specific hedging (time) horizon. Indeed, essential features of financial data, such as volatility and correlations, show specific characteristics depending on the time interval used to measure price changes. With regards to the time horizon for returns, along with the hedge ratio for week-to-week (hereafter one week) changes, this research analyses changes in 4, 12, and 32 weeks. These intervals imply approximately one, three, and eight months, respectively. The literature on HE considers various time periods: for instance, some authors (Conlon et al. 2016) examined time horizons of one, three, and six months, while others (Revoredo-Giha and Zuppiroli 2013) refer to the sowing-harvesting interval. This study considers gradually increasing periods of time which, according to the authors, are well suited to farmers’ needs (i.e., long growing periods for producers in the field crop sector).
The daily returns of both the futures and the spot prices were calculated as the difference between the logarithms of two consecutive prices, that is , where Pt is the price at time t and n, which represents the number of weeks that we considered in our study as time horizon (i.e., one week, four weeks, 12 weeks, and 32 weeks). Thus, the dataset for each commodity consists of returns calculated:
within each week: ;
every four weeks: ;
every 12 weeks: ;
every 32 weeks: .
Problems related to data overlapping can emerge when calculating the hedge ratio for longer time horizons. Analysis of non-overlapping data would result in a highly inefficient OLS regression, with low number of observations and a reduction in the information which can be collected form the data. Non overlapping data usually are accompanied by problems of autocorrelation. By contrast, greater efficiency in the estimates will result in overlapping data since no information is left out from the estimation. Following Stefani and Tiberti (2016), we applied robust standard errors to OLS regression to overcome the overlapping data problems.
3.2. Determination of the Optimal Hedging Ratio
After obtaining the returns for both spot and futures prices, the returns of the overall portfolio (i.e., composed of the spot and futures positions) are calculated by applying the OHR. Several distinct empirical methods have been developed for OHR estimation, to evaluate whether the portfolio of combined spot and futures positions is effective in reducing income risk. To do this, this paper applies and compares three different methodologies.
The first one is a fully hedge portfolio (i.e., naïve methodology), where futures position is equal in magnitude but opposite in sign to spot position (Misund and Asche 2016; Butterworth and Holmes 2001). In the naïve approach, γ = 1, and the returns of the hedge portfolio (Rnaive) is given by:
where RS,t are the returns of the spot position and RF,t are the returns of the futures position.
However, given that futures and spot prices usually do not move perfectly together, the hedger selects γ ≠ 1 to improve the hedging effectiveness (Ederington 1979). Therefore, the second approach consists of applying OLS regression to construct the following ratio (γOLS): the amount of futures contract held against one unit of the underling commodity (See Appendix A for details). In line with this, Ederington (1979) obtained γOLS according to Equation (2):
where and are the covariances and variances of the futures and the spot returns. The returns of the hedge portfolio are derived by Equation (3):
where ROLS are the returns of the hedge portfolio calculated through OLS. However, as evidenced by Chen et al. (2003), the limitation of the OLS methodology lies in the assumption that the risk in spot and futures portfolio is constant over time.
Since the returns’ distribution changes over time, the OLS methodology may not precisely estimate the risk-minimizing portfolio. Following this, this paper applies a model which allows the risk to change over time. Literature shows that generalized autoregressive conditional heteroskedasticity models (GARCH) are empirically appropriate and comparable to OLS estimates. However, the risk reduction achieved over constant hedges may vary across markets and commodities (Lien et al. 2002), making the application of both OLS and GARCH meaningful (Chang et al. 2013). For the identification of γGARCH, the Bollerslev’s Constant Conditional Correlation (CCC—GARCH) model was applied (Bollerslev 1990) (See Appendix A for details). Hence, the resulting conditional variances and quasicovariances were used to calculate the OHR as follows:
where and are the time-varying covariances and variances of the futures and the spot returns conditional in the information set prior to time t. Therefore, we derive the return of the hedge portfolio according to Equation (5)
where RGARCH are the returns of the hedge portfolio calculated through GARCH.
Each of the calculated portfolio’s returns (naïve, OLS, and GARCH) is then compared with the return of an unhedged portfolio, consisting only in a spot position, to evaluate the income risk reduction granted by these three strategies.
3.3. Hedging Effectiveness
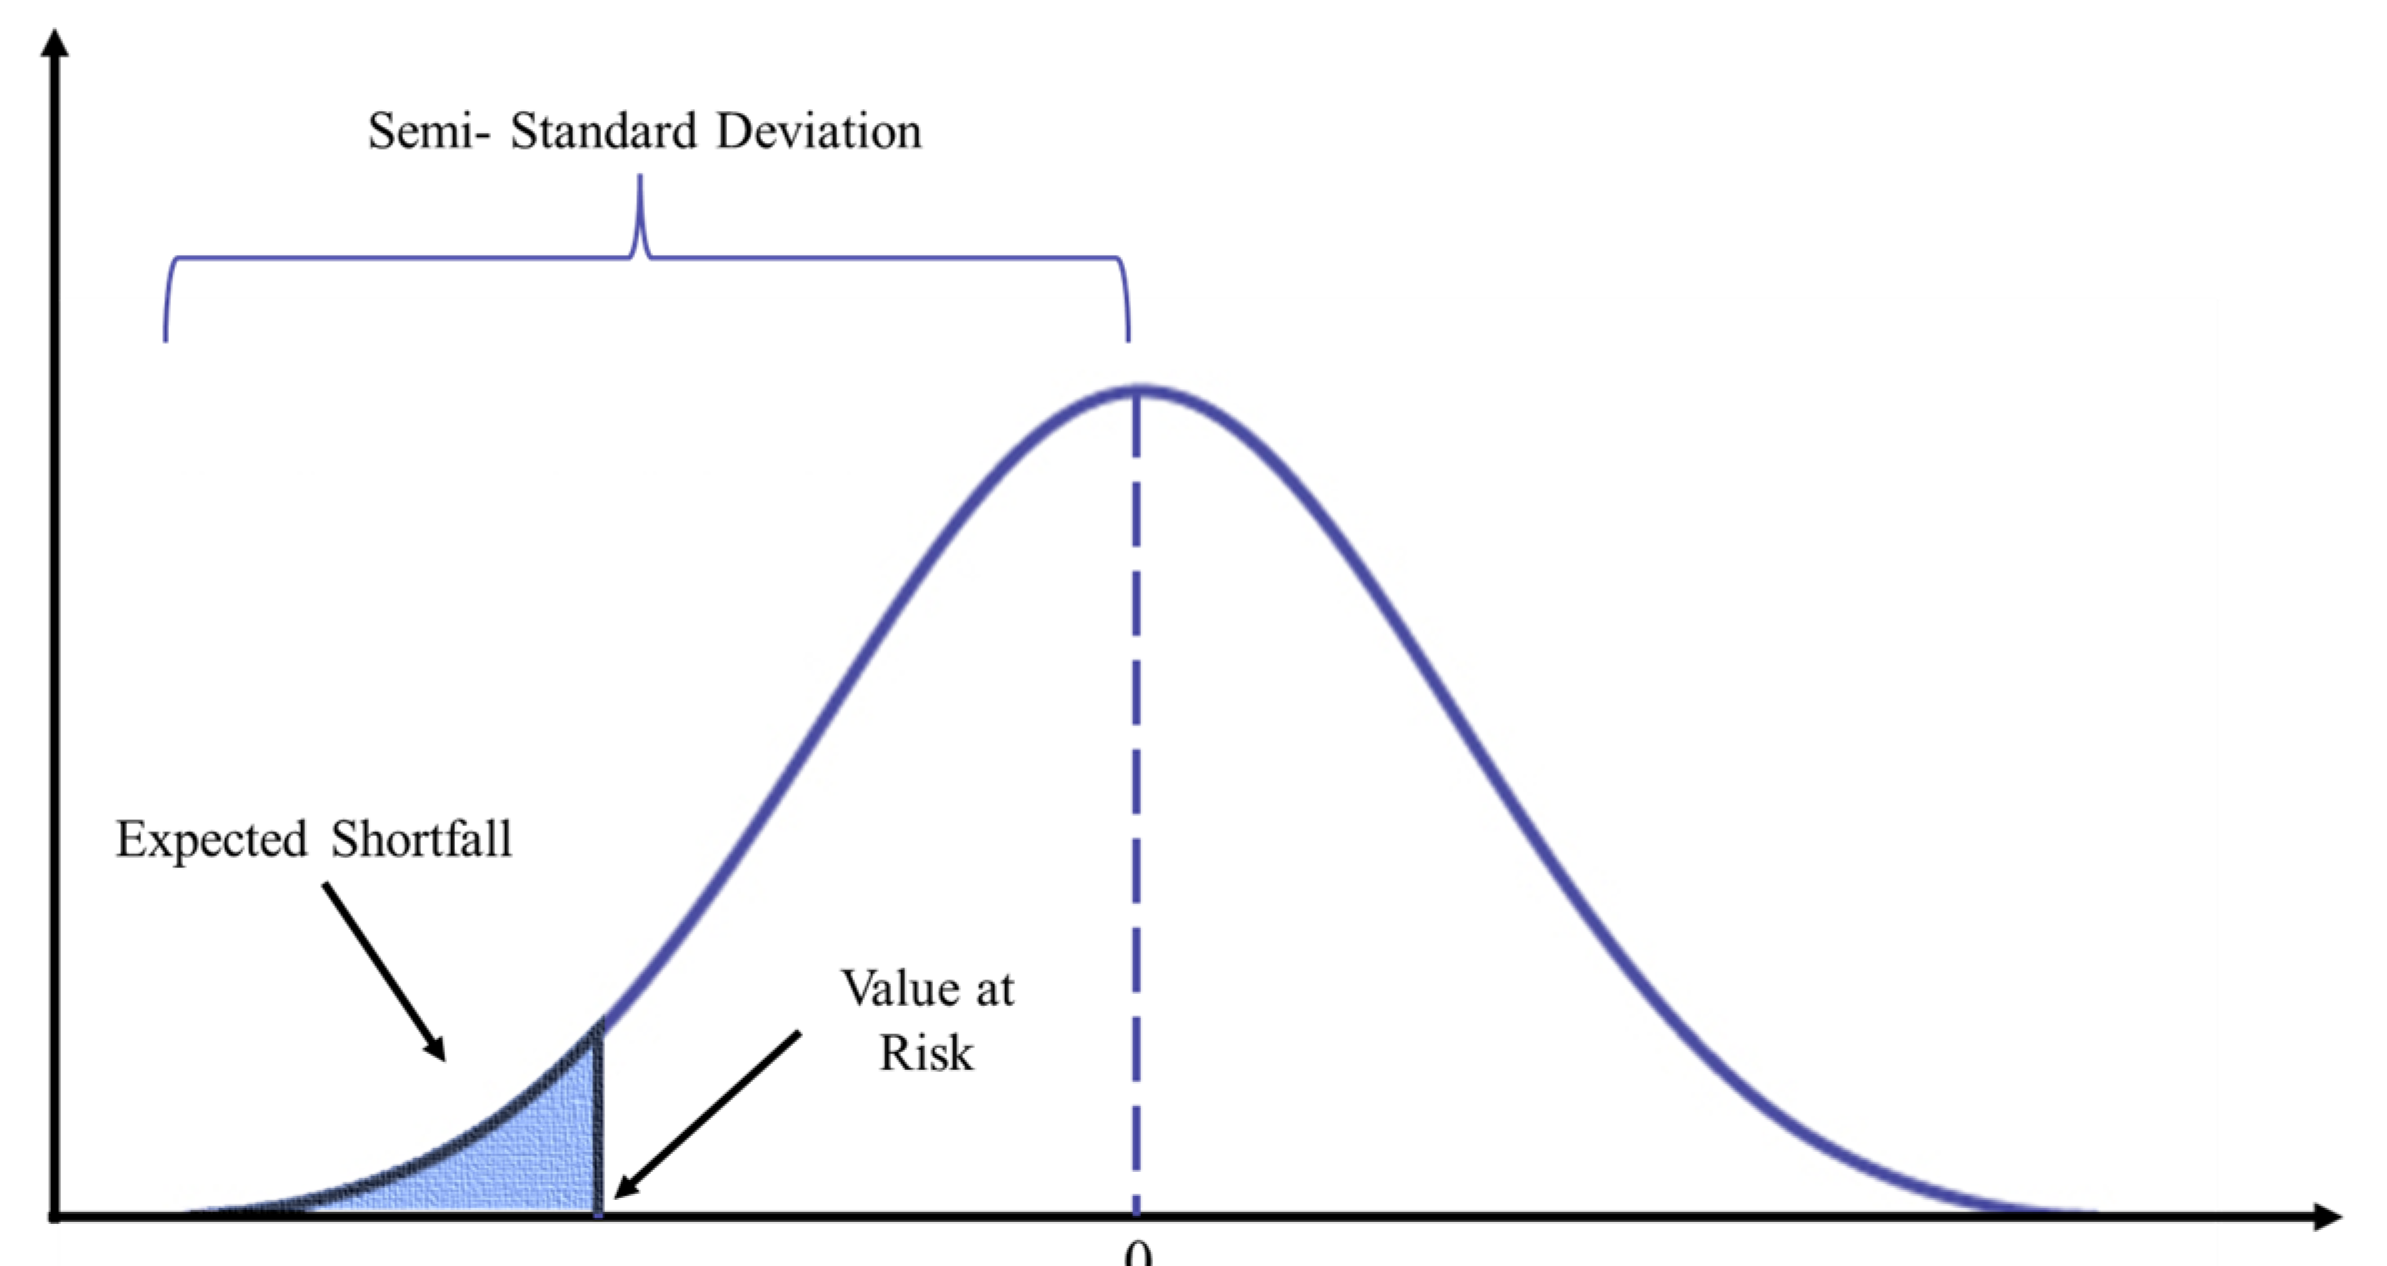
To measure the income risk reduction, for each series of calculated returns (naïve, OLS, and GARCH), this research applies a variety of different HE measures (Figure 1). The primary measure represents the reduction in the variance of the hedge position, compared to the unhedged position, according to Equation (6):
Moreover, the study proposes some other HE measures, specifically the Semi-Standard Deviation (SSD), the Value at Risk and the Expected Shortfall (ES) (Figure 1). Farmers are specifically threatened by income reduction, thus negative movement of prices. These risk measures focus on farmer’s downside risk exposure, describing the left-hand side of the probability density function of risks.
Firstly, to measure the dispersion of those observations that are lower than the expected value of the variables, SSD is computed according to Equation (7) (Zinnanti et al. 2019):
where X are the observed values of the hedge and unhedged portfolios.
Further, this analysis calculated the VaR which quantifies the extent of possible financial losses within a portfolio, offering insights on the worst potential loss over a given time interval, for a given confidence level (Jorion 2006). VaR is defined contingent on two arbitrarily chosen parameters, i.e., the horizon period of the portfolio and the confidence level, thus it is calculated as follows:
where the VaR for the confidence level α of the portfolio X is defined as the expected value of X minus the expected value of X at the confidence level α.
However, VaR only states the maximum loss if a tail event (i.e., exceeding confidence level α) does not occur, thus giving only an upper bound on the losses that occur with a given frequency (α). To improve the reading of our left tailed distribution events, we also calculated the expected shortfall (ES), that is defined as the expectation of all events less than VaR, as follows:
where ES for a certain confidence level α represents the expected value of all the intervals ( that are lower than the VarR (Dowd 2007).
4. Results and Discussion
Table 1 provides the descriptive statistics and the preliminary stationarity analysis for farmers portfolio returns. The stationarity tests (i.e., Augmented Dickey-Fuller test and Phillips-Perron test) confirm that the null hypothesis of a unit autoregressive root can be rejected for all the considered commodities and time horizons, so that all the considered returns are found to be stationary.
As a first step in the analysis of the HE of futures contracts for agricultural commodities, the amount of futures contracts that need to be shortened against the farmer’s natural long position in the cash market (OHR) needs to be evaluated. Table 2 reports the estimated OHR (γ). The naïve hedge ratio (γnaive = 1) means that one futures contract position is upheld for each spot position, thus it does not change over the time horizon. Conversely, OHR estimates from OLS (γOLS) and GARCH (γGARCH) show comparable results consistently changing with the hedge horizon. For all the considered commodities, the estimated OHR increases with longer time horizons, as reported by the literature (Chen et al. 2003; Juhl et al. 2012).
Among the selected commodities, the returns for soybean (i.e., Italian soybean spot prices and the CBOT futures prices) show the higher one-week OHR and a steady increase of the estimated parameter through the hedging horizon. All the considered estimates show a similar pattern, with the Italian spot-Euronext futures corn prices showing the highest OHR estimates at 32-weeks period. Indeed, for the aforementioned prices (soybean and corn), the longer the hedging horizon, the closer the OHR is to the naïve hedge ratio (i.e., HR = 1).
Compared with the results on the US commodity market, the estimated OHR is lower for all the considered commodities (Chen et al. 2003; Bekkerman 2011). However, since US farmers have access to a domestic derivatives exchange (i.e., CBOT), the existence of a stronger connection between futures and spot prices and thus a higher OHR is not surprising (Conforti 2004). As regards the wheat market, the OHR estimates are comparable to what shown by previous studies in Italy (Revoredo-Giha and Zuppiroli 2013; Stefani and Tiberti 2016).
Table 3 reports the income volatility reduction (%) (i.e., the variance of the portfolio) granted by the hedging activity for the data sample. Confirming the literature on the European durum wheat and the US corn sector, the effectiveness of the hedging activity in reducing income risk for farmers increases when the considered hedging horizon is extended (Zuppiroli and Revoredo-Giha 2016; Conlon et al. 2016).
First, by comparing the naïve hedging strategy with the strategies that consider the correlations among the set of prices (OLS and GARCH), it is possible to notice some differences. Indeed, the results from the naïve hedging strategy for a short hedge horizon increase the income risk for farmers (see negative values in Table 3). For example, the one-week hedge for soybean indicates that the variance of the naïve return portfolio increases by 20% with respect to the unhedged portfolio. Regarding all the selected commodities, the naïve HE for smaller time horizons results in an increase of the portfolio volatility.
Considering the correlation among set of prices is relevant to improve the hedging effectiveness of the farmers portfolio. In line with previous studies (Chang et al. 2013), the OLS and GARCH methodologies share similar results in terms of HE (i.e., amount of income variance reduction). Mixed literature results brought us to the analysis of both OLS and GARCH methods. In the hedging effectiveness analysis, the research shows that OLS performs better than GARCH in some cases, and vice versa (Lien et al. 2002). The results of our analysis confirmed that there is no clear cut among the two models in term of performance of the hedging activities.
Compared to soybean, both corn and wheat futures contracts with the shorter time horizon (one-week hedge) ensure a smaller reduction in the farmer’s portfolio volatility, for both Euronext and CBOT. As expected, HE (for both OLS and GARCH) increases with longer time horizons, for all the selected commodities.
Moreover, regarding all the considered hedge horizons, Italian farmers can better hedge their income risk by resorting to Euronext futures contracts, compared to CBOT. For instance, corn producers hedging with Euronext futures contracts (32-weeks hedge) can reduce their income risk (i.e., they reduce the returns variability) by 81% (OLS), compared to with CBOT futures contracts (35%). Similarly, for the wheat commodity a 32-weeks hedge with a CBOT futures contract can reduce income volatility by 59%, compared to Euronext (75%). These results confirm the evidence from Stefani and Tiberti (2016) on the better hedging performance of Euronext futures contracts, respect to CBOT, and highlight the advantages linked to long time horizons.
These results are encouraging for the developing of futures contracts in the European Union. Indeed, farmers facing income risks have been found to increase the use of contracts for managing price risks (Ricome and Reynaud 2021). Moreover, futures contracts’ efficiency within the EU can be helpful for the spread of different financial derivatives instruments (Harčariková 2018).
In the literature on risk management, hedging effectiveness has been commonly measured through the variance reduction of the hedge portfolio, and compared to the unhedged portfolio (Chen et al. 2003). However, also different risk indexes can be used. Indeed, variance analysis is a simplified measure of risk analysis, because it only measures the distribution width: the wider the distribution, the higher the income risk for farmers, given the broad range of potential outcomes. However, according to some authors (see for instance Monjardino et al. 2013) the analysis of variance reduction can only partly represent the actual income risk faced by farmers. Following this, this paper applies also different risk measures, namely SSD, VaR, and ES, according to Equations (7)–(9). These indexes examine the left side of the distribution, thus evaluating the reduction of unfavorable outcomes granted by hedging practices. As shown in Table 4, the different risk measures overall confirm the results of the variance reduction analysis. The naïve optimal hedging ratio brings worst results, while the OLS and GARCH estimation brings similar results. Moreover, for the all the considered measures of risks, it is confirmed that HE increases with longer hedges. The effectiveness of hedging in reducing the volatility of the left side of the distribution (SSD) confirms that hedging reduces the risk of negative outcomes. For example, corn farmers that hedge their income risk with Euronext futures contracts show an SSD reduction up to 87%. Similarly, focusing on the left tail of the distribution, both VaR and ES confirm HE for all the considered strategies calculated through OLS and GARCH. Thus, hedging with futures contracts not only reduces the variability of the return portfolio, but it also reduces the risk of high losses (i.e., left side of the return distribution) for soybean, corn, and wheat producers (Luo et al. 2017).
5. Conclusions
Nowadays, farmers’ income is increasingly at risk, and this is mainly due to the volatility of the commodities’ selling prices and to the reduction of EU direct support to farmers. This increased uncertainty has been exacerbated by COVID-19 pandemic, which has strongly influenced agricultural prices, being also expected to affect agricultural markets and farmer incomes over the next decade (Elleby et al. 2020; OECD 2020; Ezeaku et al. 2021).
Generally, price fluctuations have a detrimental impact on farmers’ incomes and thus to their viability in the long term. In the prospect of low prices, futures contracts represent instruments to tackle the price and income volatility for farmers, particularly providing the possibility to lock-in delivery prices in advance. Hedging strategies especially apply to farmers which do not participate in contact farming with production quality schemes, for which output prices may diverge from market prices.
The opening of a futures contract throughout a brokerage service to hedge harvesting prices will subsequently imply the closing of the contracts around contract expiration. Conversely to the outcome on the cash market, the derivatives exchange will have gain/loss in farmer money (Hull 2008). The effectiveness of these hedging practices for farmers depends on the connection that futures and spot markets exhibit.
Given the lack of a domestic derivatives exchange for Italian farmers, the current study provides interesting insights for European farmers, as it shows the effectiveness of hedging with futures contracts to reduce income risk. In particular, the analysis focused on soybean, corn and milling wheat prices, providing evidence on futures contracts’ hedging effectiveness for the mitigation of farmers’ income risk. The considered Italian spot prices are hedged against two futures markets, i.e., CBOT and Euronext. Moreover, three different methodologies are used to calculate the optimal number of futures contract that an Italian farmer must open to hedge his spot position: i.e., the naïve methods, in which the farmer is assumed to fully hedge his position, and the OLS and GARCH methodologies, which consider the relationship between spot and futures prices. Moreover, given the importance of the length of the hedge for the reduction of income volatility, four different hedging horizons (i.e., one week, four weeks, 12 weeks, and 32 weeks) are considered. Finally, the portfolio of a farmer which does not hedge its spot position is compared to a farmer’s portfolio composed by both spot and futures positions.
Findings confirm that hedging strategies can be useful for farmers involved in the field crop sector in Italy for the reduction of output price volatility. Our results show positive evidence for the OHR estimates, calculated throughout the OLS and GARCH methodologies, in ensuring HE for all the considered commodities. Contrariwise, the naïve hedging strategy for the calculation of the OHR subsequentially brings to an increase in the farmers portfolio volatility at low hedge horizons. This aligns with the part of the literature on hedging effectiveness according to which the best performance is obtained by models that take into consideration prices correlation (Conlon et al. 2016). Confirming literature, results on the effectiveness of hedging for different commodities show, transversely to all examined commodities, that the OHR increases with longer hedge horizons (Zuppiroli and Revoredo-Giha 2016). Among the analyzed commodities, results for corn and wheat producers confirm that the Euronext futures contracts grant a higher reduction of income volatility for farmers, resulting in the best hedging strategy, compared to CBOT. However, this latter shows a comparable HE for soybean, providing interesting insights for Italian farmers which cannot benefit from a European soybean futures contract. Finally, our results show how hedging strategies consistently reduce the negative outcome for farmers. Indeed, for all the considered commodities, the indexes chosen for the description of the left-hand side of the distribution and the worst-case scenarios (Dowd 2007) confirmed that hedging strategies reduce the probability of a negative income, compared to the unedged portfolio.
Regarding hedging practices, a common issue relates to the impact of transaction costs in the overall hedging profitability for farmers. However, given that data on these costs remain unavailable, the following analysis cannot take this aspect into account, representing a limit of the current study. Nevertheless, transaction costs are usually assumed to be fixed within a small-time frame, thus they may not impact on the hedging efficiency. For future research, the inclusion of the costs of hedging would improve the analysis of futures contracts’ HE in the agricultural sector.
To conclude, given that most European farmers continue to suffer a high-income volatility, further analysis could analyze HE at European level, to highlight potential analogies and differences among countries.
Author Contributions
Conceptualization, S.T.; methodology C.P. and S.T.; data curation C.P.; formal analysis C.P.; writing—original draft preparation C.P. and E.G., writing—review and editing C.P., E.G. and S.T.; supervision S.T. and E.G. All authors have read and agreed to the published version of the manuscript.
Funding
This research received no external funding.
Data Availability Statement
Publicly available datasets were analyzed in this study. Italian spot data can be found here: [https://www.agerborsamerci.it] (accessed on 17 November 2021). CBOT futures contracts data can be found here: [https://www.cmegroup.com/markets/agriculture.html] (accessed on 17 November 2021). Euronext futures contracts data can be found here: [https://www.euronext.com/en/for-investors/commodities] (accessed on 17 November 2021).
Conflicts of Interest
The authors declare no conflict of interest.
Appendix A. Models Specification
For the identification of γOLS, the OLS equation is constructed as follows:
In Equation (A1) rs,t are the return of the spot position at time t, rf,t are the return on the futures contract at period t, εt is the error term at time t, α is the constant included in the model, and β is defined as follows:
In Equation (A2) Cov(rs,t, rf,t) is defined as the covariance between the spot returns and the futures returns and Var(rf,t) is the variance of the futures returns. Thus, β = γOLS.
For the identification of γGARCH, it has been applied the Constant Conditional Correlation Generalized Autoregressive Conditional Heteroskedastic model of Bollerslev (1990), which can be written as:
where yt is a vector of dependent variables and xt is a vector of independent variables. is the Cholesky factor of the time-varying conditional covariance matrix Ht and vt is a vector of normal, independent, and identically distributed innovations. Dt is a diagonal matrix of conditional variances as in:
in which each evolves according to a univariate GARCH model of the form:
Finally, Rt is a matrix of time-invariant unconditional correlations of the standardized residuals
| 1 | A long position refers to a farmer that owns a commodity or a futures contract, a short position refers to a farmer that has to buy a commodity or a futures contract. |
| 2 | https://www.agerborsamerci.it (accessed on 17 November 2021). |
| 3 | https://www.cmegroup.com (accessed on 17 November 2021). |
| 4 | https://www.euronext.com (accessed on 17 November 2021). |
References
- Antón, Jesús, Shingo Kimura, Jussi Lankoski, and Andrea Cattaneo. 2012. A comparative study of risk management in agriculture under climate change. In OECD Food, Agriculture and Fisheries Working Papers. No. 58. Paris: OECD Publishing. [Google Scholar] [CrossRef]
- Baffes, John, and Tassos Haniotis. 2016. What explains agricultural price movements? Journal of Agricultural Economics 673: 706–21. [Google Scholar] [CrossRef]
- Bekkerman, Anton. 2011. Time-varying hedge ratios in linked agricultural markets. Agricultural Finance Review 71: 179–200. [Google Scholar] [CrossRef]
- Bollerslev, Tim. 1990. Modelling the coherence in short-run nominal exchange rates: A multivariate generalized ARCH model. The Review of Economics and Statistics 72: 498–505. [Google Scholar] [CrossRef]
- Bollerslev, Tim, Robert F. Engle, and Jeffrey M. Wooldridge. 1988. A capital asset pricing model with time-varying covariances. Journal of Political Economy 96: 116–31. [Google Scholar] [CrossRef]
- Brooks, Chris, and James Chong. 2001. The cross-currency hedging performance of implied versus statistical forecasting models. Journal of Futures Markets 21: 1043–69. [Google Scholar] [CrossRef] [Green Version]
- Butterworth, Darren, and Phil Holmes. 2001. The hedging effectiveness of stock index futures: Evidence for the FTSE-100 and FTSE-Mid250 indexes traded in the UK. Applied Financial Economics 11: 57–68. [Google Scholar] [CrossRef]
- Candila, Vincenzo, and Salvatore Farace. 2018. On the volatility spillover between agricultural commodities and Latin American stock markets. Risks 6: 116. [Google Scholar] [CrossRef] [Green Version]
- Carter, Colin A. 1984. An evaluation of pricing performance and hedging effectiveness of the barley futures market. Western Journal of Agricultural Economics 9: 1–13. [Google Scholar]
- Chang, Chiao-Yi, Jing-Yi Lai, and I-Yuan Chuang. 2010. Futures hedging effectiveness under the segmentation of bear/bull energy markets. Energy Economics 32: 442–49. [Google Scholar] [CrossRef]
- Chang, Chia-Lin, Lydia González-Serrano, and Juan-Angel Jimenez-Martin. 2013. Currency hedging strategies using dynamic multivariate GARCH. Mathematics and Computers in Simulation 94: 164–82. [Google Scholar] [CrossRef] [Green Version]
- Chen, Sheng-Syan, Cheng-Few Lee, and Keshab Shrestha. 2003. Futures hedge ratios: A review. The Quarterly Review of Economics and Finance 43: 433–65. [Google Scholar] [CrossRef]
- Coletta, Attilio, Elisa Giampietri, Fabio Gaetano Santeramo, Simone Severini, and Samuele Trestini. 2018. A preliminary test on risk and ambiguity attitudes, and time preferences in decisions under uncertainty: Towards a better explanation of participation in crop insurance schemes. Bio-Based and Applied Economics 7: 265–77. [Google Scholar]
- Conforti, Piero. 2004. Price transmission in selected agricultural markets. In FAO Commodity and Trade Policy Research Working Paper 7. Rome: FAO. [Google Scholar]
- Conlon, Thomas, John Cotter, and Ramazan Gençay. 2016. Commodity futures hedging, risk aversion and the hedging horizon. The European Journal of Finance 22: 1534–60. [Google Scholar] [CrossRef]
- Dahlgran, Roger A. 2005. Transaction frequency and hedging in commodity processing. Journal of Agricultural and Resource Economics 30: 411–30. [Google Scholar]
- De Castro, Paolo, Jorgelina Di Pasquale, and Felice Adinolfi. 2012. Quale ruolo per la politica agricola europea in un’era d’instabilità dei mercati? Economia Agro-Alimentare 14: 235–48. [Google Scholar] [CrossRef]
- Dickey, David A., and Wayne A. Fuller. 1979. Distribution of the estimators for autoregressive time series with a unit root. Journal of the American Statistical Association 74: 427–31. [Google Scholar] [CrossRef]
- Dowd, Kevin. 2007. Measuring Market Risk, 2nd ed. Chichester: John Wiley and Sons. [Google Scholar]
- Ederington, Louis H. 1979. The hedging performance of the new futures markets. Journal of Finance 34: 157–70. [Google Scholar] [CrossRef]
- Elleby, Christian, Ignacio Pérez Domínguez, Marcel Adenauer, and Giampiero Genovese. 2020. Impacts of the COVID-19 pandemic on the global agricultural markets. Environmental and Resource Economics. 76: 1067–79. [Google Scholar] [CrossRef]
- European Parliament Research Service’s Briefing (EPRS). 2016. Price Volatility in Agricultural Markets Risk Management and Other Tools. Available online: http://www.europarl.europa.eu/RegData/etudes/BRIE/2016/586609/EPRS_BRI(2016)586609_EN.pdf (accessed on 17 November 2021).
- Esposti, Roberto, and Giulia Listorti. 2013. Agricultural price transmission across space and commodities during price bubbles. Agricultural Economics 44: 125–39. [Google Scholar] [CrossRef] [Green Version]
- Ezeaku, Hillary C., Simplice A. Asongu, and Joseph Nnanna. 2021. Volatility of international commodity prices in times of COVID-19: Effects of oil supply and global demand shocks. The Extractive Industries and Society 8: 257–70. [Google Scholar] [CrossRef]
- Frascarelli, Angelo, Simone Del Sarto, and Giada Mastandrea. 2021. A New Tool for Covering Risk in Agriculture: The Revenue Insurance Policy. Risks 9: 131. [Google Scholar] [CrossRef]
- Giampietri, Elisa, Xiaohua Yu, and Samuele Trestini. 2020. The role of trust and perceived barriers on farmer’s intention to adopt risk management tools. Bio-Based and Applied Economics Journal 9: 1–24. [Google Scholar] [CrossRef]
- Harčariková, Monika. 2018. Managing price risk in the corn market using option strategies. Acta Universitatis Agriculturae et Silviculturae Mendelianae Brunensis 66: 767–79. [Google Scholar] [CrossRef] [Green Version]
- Höhler, Julia, and Alfons O. Lansink. 2021. Measuring the impact of COVID-19 on stock prices and profits in the food supply chain. Agribusiness 37: 171–86. [Google Scholar] [CrossRef] [PubMed]
- Hull, John C. 2008. Options, Futures, and Other Derivatives, 7th ed. Hoboken: Pearson Prentice Hall. [Google Scholar]
- Johnson, Leland L. 1960. The theory of hedging and speculation in commodity futures. Review of Economic Studies 27: 139–51. [Google Scholar] [CrossRef]
- Jorion, Philippe. 2006. Value at Risk: The New Benchmark for Managing Financial Risk, 3rd ed. New York: McGraw-Hill. [Google Scholar]
- Juhl, Ted, Ira G. Kawaller, and Paul D. Koch. 2012. The effect of the hedge horizon on optimal hedge size and effectiveness when prices are cointegrated. Journal of Futures Markets 32: 837–76. [Google Scholar] [CrossRef]
- Lence, Sergio H. 1995. The economic value of minimum-variance hedges. American Journal of Agricultural Economics 77: 353–64. [Google Scholar] [CrossRef]
- Lien, Donald, Y. K. Tse, and Albert Tsui. 2002. Evaluating the hedging performance of the constant-correlation GARCH model. Applied Financial Economics 12: 791–98. [Google Scholar] [CrossRef]
- Luo, Qunying, Karl Behrendt, and Michael Bange. 2017. Economics and risk of adaptation options in the Australian cotton industry. Agricultural Systems 150: 46–53. [Google Scholar] [CrossRef]
- Markowitz, Harry M. 1952. Portfolio Selection: Efficient Diversification of Investment. Cowles Foundation Monograph #16. New York: Wiley. [Google Scholar]
- McKenzie, Andrew M., and Navinderpal Singh. 2011. Hedging effectiveness around US Department of Agriculture crop reports. Journal of Agricultural and Applied Economics 43: 1–18. [Google Scholar] [CrossRef] [Green Version]
- Michels, Marius, Johannes Möllmann, and Oliver Musshoff. 2019. Understanding the intention to use commodity futures contracts. Agricultural Finance Review 79: 582–97. [Google Scholar] [CrossRef]
- Misund, Bård, and Frank Asche. 2016. Hedging efficiency of Atlantic salmon futures. Aquaculture Economics & Management 20: 368–81. [Google Scholar] [CrossRef] [Green Version]
- Monjardino, Marta, Therese M. McBeath, Lisa E. Brennan, and Rick S. Llewellyn. 2013. Are farmers in low rainfall cropping regions under-fertilising with nitrogen? A risk analysis. Agricultural Systems 116: 37–51. [Google Scholar] [CrossRef]
- Moschini, Giancarlo, and David A. Hennessy. 2001. Uncertainty, risk aversion, and risk management for agricultural producers. Handbook of Agricultural Economics 1: 87–153. [Google Scholar] [CrossRef]
- OECD. 2020. OECD Policy Responses to Coronavirus (COVID-19) The Impact of COVID-19 on Agricultural Markets and GHG Emissions. Available online: https://www.oecd.org/coronavirus/policy-responses/the-impact-of-covid-19-on-agricultural-markets-and-ghg-emissions-57e5eb53/ (accessed on 17 November 2021).
- Phillips, Peter C. B., and Pierre Perron. 1988. Testing for a unit root in time series regression. Biometrika 75: 335–46. [Google Scholar] [CrossRef]
- Rao, Vadhindran K. 2000. Preference-free optimal hedging using futures. Economics Letters 66: 223–28. [Google Scholar] [CrossRef]
- Revoredo-Giha, Cesar, and Marco Zuppiroli. 2013. Commodity futures markets: Are they an effective price risk management tool for the European wheat supply chain? Bio-Based and Applied Economics 2: 237–55. [Google Scholar] [CrossRef]
- Ricome, Aymeric, and Arnaud Reynaud. 2021. Marketing contract choices in agriculture: The role of price expectation and price risk management. Agricultural Economics. [Google Scholar] [CrossRef]
- Santeramo, Fabio G., Emilia Lamonaca, Francesco Contò, Gianluca Nardone, and Antonio Stasi. 2018. Drivers of grain price volatility: A cursory critical review. Agricultural Economics 64: 347–56. [Google Scholar] [CrossRef]
- Stefani, Gianluca, and Marco Tiberti. 2016. Multiperiod optimal hedging ratios: Methodological aspects and application to a wheat market. European Review of Agricultural Economics 43: 503–31. [Google Scholar] [CrossRef] [Green Version]
- Stein, Jerome L. 1976. The simultaneous determination of spot and futures prices. In The Economics of Futures Trading. London: Palgrave Macmillan, pp. 124–30. [Google Scholar] [CrossRef]
- Tangermann, Stefan. 2011. Policy Solutions to Agricultural Market Volatility: A Synthesis. Issue Paper No. 33. Geneva: International Centre for Trade and Sustainable Development, pp. 1–13. [Google Scholar]
- Trestini, Samuele, and Carlotta Penone. 2018. Transmission of futures prices to the Italian spot market: Are there opportunities to hedge corn price risk? Economia Agro-Alimentare 20: 193–204. [Google Scholar] [CrossRef]
- Trestini, Samuele, Elisa Giampietri, and Vasco Boatto. 2017a. Toward the implementation of the Income Stabilization Tool: An analysis of factors affecting the probability of farm income losses in Italy. New Medit 16: 24–30. [Google Scholar]
- Trestini, Samuele, Eugenio Pomarici, and Elisa Giampietri. 2017b. Around the economic sustainability of Italian viticulture: Do farm strategies tackle income risks? Calitatea 18: 461–67. [Google Scholar]
- United State Department of Agriculture (USDA). 2021. World Agricultural Supply and Demand Estimates (WASDE). World Agricultural Outlook Board (WAOB). June. Available online: https://usda.library.cornell.edu/concern/publications/3t945q76s?locale=en (accessed on 17 November 2021).
- Wilson, William W., William E. Nganje, and Robert Wagner. 2006. Hedging strategies for grain processors. Canadian Journal of Agricultural Economics/Revue Canadienne D’agroeconomie 54: 311–26. [Google Scholar] [CrossRef]
- Yang, Wenling, and David E. Allen. 2005. Multivariate GARCH hedge ratios and hedging effectiveness in Australian futures markets. Accounting Finance 45: 301–21. [Google Scholar] [CrossRef]
- Yang, Jian, and Titus O. Awokuse. 2003. Asset storability and hedging effectiveness in commodity futures markets. Applied Economics Letters 10: 487–91. [Google Scholar] [CrossRef]
- Zinnanti, Cinzia, Emanuele Schimmenti, Valeria Borsellino, Giulio Paolini, and Simone Severini. 2019. Economic performance and risk of farming systems specialized in perennial crops: An analysis of Italian hazelnut production. Agricultural Systems 17: 102645. [Google Scholar] [CrossRef]
- Zuppiroli, Marco, and Cesar Revoredo-Giha. 2016. Hedging effectiveness of European wheat futures markets: An application of multivariate GARCH models. International Journal of Applied Management Science 8: 132–48. [Google Scholar] [CrossRef]
Figure 1.
Probability density function of risks and measures of hedging effectiveness.

Table 1.
Returns descriptive statistics and stationarity tests.
| Time Horizon (n. of Weeks) | N. of Obs. | Mean | St. Dev. | Min | Max | ADF t-Stat | PP t-Stat | ||
|---|---|---|---|---|---|---|---|---|---|
| Italian spot | Soybean | 1 | 750 | 0.11 | 2.06 | −9.84 | 8.23 | −12.66 *** | −22.27 *** |
| 4 | 747 | 0.45 | 5.02 | −18.41 | 17.14 | −7.32 *** | −9.09 *** | ||
| 12 | 739 | 1.28 | 9.86 | −35.31 | 25.11 | −5.95 *** | −22.27 *** | ||
| 32 | 719 | 2.72 | 16.51 | −44.02 | 48.95 | −3.65 *** | −29.50 *** | ||
| Corn | 1 | 750 | 0.06 | 2.40 | −19.01 | 23.52 | −15.92 *** | −21.25 *** | |
| 4 | 747 | 0.24 | 5.87 | −27.52 | 26.44 | −10.29 *** | −9.01 *** | ||
| 12 | 739 | 0.59 | 11.57 | −50.94 | 38.26 | −5.63 *** | −4.80 *** | ||
| 32 | 719 | 1.00 | 19.65 | −60.50 | 44.58 | −3.19 * | −2.56 | ||
| Wheat | 1 | 750 | 0.04 | 1.53 | −8.61 | 12.40 | −9.26 *** | −19.96 *** | |
| 4 | 747 | 0.16 | 4.19 | −16.54 | 21.01 | −6.66 *** | −7.73 *** | ||
| 12 | 739 | 0.46 | 9.16 | −32.40 | 39.02 | −6.11 *** | −4.37 *** | ||
| 32 | 719 | 0.93 | 17.81 | −40.86 | 60.09 | −4.20 *** | −2.58 | ||
| CBOT | Soybean | 1 | 750 | 0.12 | 2.82 | −14.68 | 8.71 | −17.08 *** | −22.76 *** |
| 4 | 747 | 0.47 | 6.47 | −22.97 | 21.00 | −13.40 *** | −10.53 *** | ||
| 12 | 739 | 1.27 | 11.28 | −33.33 | 28.92 | −6.54 *** | −5.77 *** | ||
| 32 | 719 | 2.84 | 17.19 | −39.96 | 49.51 | −3.81 ** | −3.37 * | ||
| Corn | 1 | 750 | 0.09 | 3.42 | −21.72 | 12.90 | −17.83 *** | −22.63 *** | |
| 4 | 747 | 0.35 | 7.84 | −28.31 | 31.48 | −8.00 *** | −10.08 *** | ||
| 12 | 739 | 0.80 | 13.64 | −40.40 | 38.37 | −5.81 *** | −5.40 *** | ||
| 32 | 719 | 1.85 | 22.48 | −58.40 | 62.67 | −3.19 * | −2.91 | ||
| Wheat | 1 | 750 | 0.06 | 3.61 | −12.67 | 16.04 | −17.59 *** | −22.68 *** | |
| 4 | 747 | 0.27 | 8.19 | −30.00 | 35.96 | −8.32 *** | −10.28 *** | ||
| 12 | 739 | 0.72 | 13.30 | −45.99 | 44.79 | −7.06 *** | −6.13 *** | ||
| 32 | 719 | 1.48 | 20.73 | −65.11 | 61.88 | −4.46 *** | −4.10 *** | ||
| Euronext | Corn | 1 | 750 | 0.06 | 2.58 | −24.86 | 11.96 | −17.52 *** | −21.99 *** |
| 4 | 747 | 0.22 | 6.02 | −29.18 | 19.34 | −11.78 *** | −9.90 *** | ||
| 12 | 739 | 0.57 | 11.15 | −44.40 | 30.42 | −5.57 *** | −5.15 *** | ||
| 32 | 719 | 0.88 | 18.57 | −53.89 | 47.39 | −3.40 ** | −3.24 * | ||
| Wheat | 1 | 750 | 0.05 | 2.81 | −13.98 | 17.50 | −17.12 *** | −20.83 *** | |
| 4 | 747 | 0.21 | 6.85 | −26.71 | 33.40 | −7.38 *** | −9.32 *** | ||
| 12 | 739 | 0.63 | 12.68 | −43.56 | 56.67 | −6.39 *** | −5.48 *** | ||
| 32 | 719 | 1.32 | 22.42 | −68.81 | 72.90 | −3.72 ** | −3.27 * |
Note: the table reports different descriptive statistics for the analyzed series. ADF t-statistics stands for the Augmented Dickey-Fuller test for the presence of a unit root (Dickey and Fuller 1979). PP t-statistics stands for the Phillips-Perron test for the presence of a unit root (Phillips and Perron 1988). ***, ** and * indicate the level of significance at the 1%, 5% and 10% level, respectively.
Table 2.
Estimates of the Optimal Hedging Ratio for all the considered commodities.
| Time Horizon (n. of Weeks) | γOLS | γGARCH | ||
|---|---|---|---|---|
| Italian spot-CBOT | Soybean | 1 | 0.449 | 0.461 |
| 4 | 0.565 | 0.586 | ||
| 12 | 0.710 | 0.730 | ||
| 32 | 0.864 | 0.809 | ||
| Corn | 1 | 0.140 | 0.130 | |
| 4 | 0.294 | 0.327 | ||
| 12 | 0.438 | 0.454 | ||
| 32 | 0.524 | 0.668 | ||
| Wheat | 1 | 0.093 | 0.094 | |
| 4 | 0.238 | 0.225 | ||
| 12 | 0.420 | 0.253[A] | ||
| 32 | 0.660 | 0.678 | ||
| Italian spot-Euronext | Corn | 1 | 0.304 | 0.263 |
| 4 | 0.652 | 0.651 | ||
| 12 | 0.866 | 0.809 | ||
| 32 | 0.952 | 0.966 | ||
| Wheat | 1 | 0.185 | 0.189 | |
| 4 | 0.370 | 0.361 | ||
| 12 | 0.540 | 0.565 | ||
| 32 | 0.689 | 0.706 |
Note: the table reports the optimal hedging ratio calculated according to Equation (2) (γOLS) and to Equation (4) (γGARCH) (the naïve optimal hedging ratio is not reported as γ is always equal to 1). [A] The optimal hedging ratio was calculated according to DVECH model by Bollerslev et al. (1988), due to the lack of convergence of the CCC-GARCH model for this set of futures and spot prices.
Table 3.
Estimates of the Hedging Effectiveness through variance reduction, for all the considered commodities.
Table 3.
Estimates of the Hedging Effectiveness through variance reduction, for all the considered commodities.
| Time Horizon (n. of Weeks) | Variance | ||||
|---|---|---|---|---|---|
| γnaive | γOLS | γGARCH | |||
| Italian spot-CBOT | Soybean | 1 | −0.207 | 0.377 | 0.377 |
| 4 | 0.217 | 0.531 | 0.531 | ||
| 12 | 0.549 | 0.660 | 0.659 | ||
| 32 | 0.788 | 0.808 | 0.805 | ||
| Corn | 1 | −1.464 | 0.038 | 0.038 | |
| 4 | −0.761 | 0.145 | 0.143 | ||
| 12 | −0.178 | 0.264 | 0.264 | ||
| 32 | 0.051 | 0.353 | 0.324 | ||
| Wheat | 1 | −4.492 | 0.049 | 0.049 | |
| 4 | −1.998 | 0.218 | 0.217 | ||
| 12 | −0.334 | 0.372 | 0.314 | ||
| 32 | 0.433 | 0.591 | 0.590 | ||
| Italian spot-Euronext | Corn | 1 | −0.456 | 0.105 | 0.103 |
| 4 | 0.310 | 0.440 | 0.440 | ||
| 12 | 0.678 | 0.695 | 0.692 | ||
| 32 | 0.805 | 0.808 | 0.808 | ||
| Wheat | 1 | −2.097 | 0.116 | 0.116 | |
| 4 | −0.700 | 0.367 | 0.366 | ||
| 12 | 0.155 | 0.561 | 0.559 | ||
| 32 | 0.597 | 0.752 | 0.752 | ||
Note: the table reports the amount of the hedged portfolio variance reduction (hedging effectiveness) with respect to an unhedged portfolio. Increases in the hedge portfolio variance are depicted by negative numbers, while decreases by positive ones. Hedging effectiveness values are produced through the three different methodologies used for calculating the optimal hedging ratio, that are the naïve, OLS and GARCH.
Table 4.
Estimates of the Hedging Effectiveness through risk indexes, for all the considered commodities.
Table 4.
Estimates of the Hedging Effectiveness through risk indexes, for all the considered commodities.
| Time Horizon (n. of Weeks) | SSD | VaR | ES | ||||||||
|---|---|---|---|---|---|---|---|---|---|---|---|
| γnaive | γOLS | γGARCH | γnaive | γOLS | γGARCH | γnaive | γOLS | γGARCH | |||
| Italian spot-CBOT | Soybean | 1 | 0.219 | 0.415 | 0.419 | −0.043 | 0.247 | 0.242 | 0.013 | 0.209 | 0.210 |
| 4 | 0.339 | 0.536 | 0.537 | 0.231 | 0.370 | 0.377 | 0.148 | 0.303 | 0.306 | ||
| 12 | 0.472 | 0.547 | 0.545 | 0.147 | 0.321 | 0.296 | 0.254 | 0.324 | 0.322 | ||
| 32 | 0.688 | 0.722 | 0.726 | 0.431 | 0.517 | 0.541 | 0.483 | 0.510 | 0.514 | ||
| Corn | 1 | −0.565 | 0.190 | 0.192 | −0.970 | 0.046 | 0.047 | −0.499 | 0.027 | 0.026 | |
| 4 | −0.404 | 0.077 | 0.071 | −0.292 | 0.127 | 0.139 | −0.219 | 0.077 | 0.079 | ||
| 12 | 0.374 | 0.345 | 0.354 | −0.057 | 0.192 | 0.171 | 0.148 | 0.149 | 0.151 | ||
| 32 | 0.209 | 0.302 | 0.321 | −0.116 | 0.044 | 0.004 | 0.089 | 0.185 | 0.204 | ||
| Wheat | 1 | −2.001 | 0.403 | 0.404 | −2.072 | 0.013 | 0.013 | −1.385 | 0.034 | 0.034 | |
| 4 | −1.820 | 0.334 | 0.327 | −0.952 | 0.073 | 0.067 | −0.832 | 0.108 | 0.105 | ||
| 12 | −0.550 | 0.364 | 0.306 | −0.315 | 0.217 | 0.175 | −0.256 | 0.196 | 0.149 | ||
| 32 | 0.274 | 0.529 | 0.528 | 0.072 | 0.267 | 0.261 | 0.167 | 0.332 | 0.329 | ||
| Italian spot-Euronext | Corn | 1 | −0.039 | 0.213 | 0.216 | −0.255 | 0.096 | 0.089 | −0.132 | 0.068 | 0.062 |
| 4 | 0.334 | 0.372 | 0.372 | 0.188 | 0.287 | 0.287 | 0.179 | 0.243 | 0.243 | ||
| 12 | 0.803 | 0.782 | 0.765 | 0.444 | 0.432 | 0.412 | 0.525 | 0.505 | 0.488 | ||
| 32 | 0.878 | 0.871 | 0.874 | 0.567 | 0.555 | 0.554 | 0.644 | 0.632 | 0.636 | ||
| Wheat | 1 | −0.335 | 0.527 | 0.528 | −1.258 | 0.088 | 0.081 | −0.686 | 0.095 | 0.096 | |
| 4 | −0.010 | 0.622 | 0.620 | −0.426 | 0.159 | 0.160 | −0.323 | 0.204 | 0.203 | ||
| 12 | 0.334 | 0.620 | 0.619 | −0.105 | 0.263 | 0.241 | 0.007 | 0.272 | 0.270 | ||
| 32 | 0.490 | 0.590 | 0.590 | 0.238 | 0.391 | 0.381 | 0.283 | 0.409 | 0.409 | ||
Note: the table reports the hedging effectiveness measured according to Equation (6), with different indexes as the Semi-Standard Deviation (SSD), the Value at Risk (VaR) and the Expected Shortfall (ES).
Publisher’s Note: MDPI stays neutral with regard to jurisdictional claims in published maps and institutional affiliations. |
© 2021 by the authors. Licensee MDPI, Basel, Switzerland. This article is an open access article distributed under the terms and conditions of the Creative Commons Attribution (CC BY) license (https://creativecommons.org/licenses/by/4.0/).
Share and Cite
MDPI and ACS Style
Penone, C.; Giampietri, E.; Trestini, S. Hedging Effectiveness of Commodity Futures Contracts to Minimize Price Risk: Empirical Evidence from the Italian Field Crop Sector. Risks 2021, 9, 213. https://doi.org/10.3390/risks9120213
AMA Style
Penone C, Giampietri E, Trestini S. Hedging Effectiveness of Commodity Futures Contracts to Minimize Price Risk: Empirical Evidence from the Italian Field Crop Sector. Risks. 2021; 9(12):213. https://doi.org/10.3390/risks9120213
Chicago/Turabian StylePenone, Carlotta, Elisa Giampietri, and Samuele Trestini. 2021. "Hedging Effectiveness of Commodity Futures Contracts to Minimize Price Risk: Empirical Evidence from the Italian Field Crop Sector" Risks 9, no. 12: 213. https://doi.org/10.3390/risks9120213
Note that from the first issue of 2016, this journal uses article numbers instead of page numbers. See further details here.