Price Discovery and Market Reflexivity in Agricultural Futures Contracts with Different Maturities


Department of Agricultural Economics, Humboldt-Universität zu Berlin, 10099 Berlin, Germany
*
Author to whom correspondence should be addressed.
Risks 2020, 8(3), 75; https://doi.org/10.3390/risks8030075
Submission received: 12 May 2020
/
Revised: 2 July 2020
/
Accepted: 8 July 2020
/
Published: 11 July 2020
(This article belongs to the Special Issue Risks: Feature Papers 2020)
Abstract
:The purpose of this paper is to analyze market reflexivity in agricultural futures contracts with different maturities. To this end, we apply a four-dimensional Hawkes model to storable and non-storable agricultural commodities. We find market reflexivity for both storable and non-storable commodities. Reflexivity accounts for about 50 to 70% of the total trading activity. Differences between nearby and deferred contracts are less pronounced for non-storable than for storable commodities. We conclude that the co-existence of exogenous and endogenous price dynamics does not change qualitative characteristics of the price discovery process that have been observed earlier without the consideration of market reflexivity.
JEL code:
G14; C491. Introduction
Prices of commodity futures contracts with different maturities are linked through the forward curve. Understanding of the shape and the characteristics of the term structure is of utmost importance for storage decisions, hedging and roll-over strategies as well as calendar spread trading. Several strands of literature address this topic. The theoretical underpinning of the forward curve goes back to Working’s (1949) theory of storage that establishes an equilibrium relation between nearby and distant futures contracts and explains storage under backwardation by the concept of convenience yield (Brennan 1958). In contrast, Keynes’ theory of normal backwardation decomposes a futures price into an expected future spot price and an expected risk premium that risk-averse hedgers grant to speculators (Fama and French 1987). The statistical modelling of the forward curve has benefitted from Nelson and Siegel’s (1987) proposal to describe the term structure parsimoniously in terms of level, slope and curvature. A dynamic version of this model has been introduced by Diebold and Li (2006). Applications to commodity futures can be found in Karstanje et al. (2017). An alternative method uses a set of state variables (factors), particularly spot price, convenience yield, and interest rate, to derive the forward curve under no-arbitrage conditions (Gibson and Schwartz 1990; Schwartz 1997). Applications of this approach to agricultural futures include Geman and Nguyen (2005) and Sorensen (2002), among others.
With the rise of the modern market microstructure, interest has shifted from the estimation of equilibrium relations towards the understanding of price discovery, i.e., the question of how new information is absorbed in asset prices and how this information is transferred along the forward curve. Since there is no explicit market microstructure theory designed for commodity futures with different maturities, most studies in this area are non-structural and try to identify empirical patterns in data. Mallory et al. (2015) use contemporaneous and time-lagged correlations of nearby and deferred futures contracts for corn to investigate the speed at which liquidity providers revise their beliefs in response to the occurrence of an information event. They find that the correlation of price revisions disappears even for short time lags and conclude that new information to the market is immediately transmitted across all contract maturities. Hu et al. (2017) pursue a similar objective, but instead of simple correlations, they apply co-integration techniques to explore price discovery among nearby and deferred futures contracts of corn and live cattle. They report a larger share of price discovery in nearer to maturity contracts. The dominance of nearer contracts, however, is less pronounced for live cattle than for corn, which is explained by differences in the storability of these commodities. Recently, Volkenand et al. (2019) investigate the duration dependence among agricultural futures with different maturities, exploiting the fact that the time between market events (transactions or price changes) carries information (Easley and O’Hara 1992). They apply an autoregressive conditional duration (ACD) model to price durations for corn, wheat, live cattle, and lean hog. The authors report linkages between nearby and deferred futures contracts. They conclude that information is quickly processed along the forward curve.
The aforementioned studies rest on a traditional view of the price discovery mechanism according to which price revisions are driven by the arrival of exogenous information. This view has been challenged by the concept of market reflexivity (Soros 1987) which assumes that trading activity is also endogenously driven by positive feedback mechanisms. Sources of potential endogeneity encompass informational cascades leading to herding, as well as speculation based on technical analysis (e.g., momentum trading) and algorithmic trading (Filimonov et al. 2014). Furthermore, hedging strategies combined with portfolio execution rules can lead to self-excitement of price moves (Kyle and Obizhaeva 2019). While this co-existence of exogenous and endogenous price dynamics contradicts the efficient market hypothesis (Fama 1970), it can be helpful to understand puzzling phenomena on financial markets, such as “flash crashes” or excess volatility (Hardiman et al. 2013). The concept of market reflexivity has originally been introduced in a narrative, non-technical manner, but since then it experienced an underpinning by statistical methods that allow one to disentangle exogenous and endogenous sources of market activities and thus measure the degree of market reflexivity. More specifically, self-exiting Hawkes processes have been proposed as a device to quantify reflexivity (e.g., Filimonov and Sornette 2012). Bacry et al. (2016), for example, find that less than 5% of the price changes in the DAX (German stock index) and BUND (German Bond) futures markets are driven by external sources. In the context of commodity futures markets, Filimonov et al. (2014) find that reflexivity has increased since the mid-2000s to 70%. They trace this back to the increase in automated trading in the course of the transition to an electronic trading environment. In fact, automated trading generated about 40% of the total futures volume traded in the grain and oilseed markets between 2012 and 2014 (Haynes and Roberts 2015).
Despite the increasing interest in market reflexivity as an alternative to the prevalent tenet of market efficiency and rational expectations, there exists no empirical study applying this concept to the forward curve of commodities. Against this backdrop, our objective is to examine price discovery in nearby and deferred agricultural futures contracts while explicitly taking into account potential market reflexivity. We apply a four-dimensional Hawkes model to storable and non-storable agricultural commodities. The Hawkes model allows us to divide the intensity of the trading activity in a futures contract with a certain maturity into three parts: a reaction on external sources like new information, market reflexivity, and reactions on trading activity in contracts of different maturities. Using this approach, we review previous findings regarding price discovery in nearby and deferred futures contracts. In particular, we examine whether nearby contracts dominate deferred contracts in price discovery while accounting for potential market reflexivity (e.g., Gray and Rutledge 1971). We also explore whether price discovery and potential market reflexivity differ between storable and non-storable commodities. In line with Hu et al. (2017), we expect that dominance of nearby contracts in price discovery is more pronounced for storable commodities. Moreover, we conjecture that commodities with a high share of automated trading, such as grains and oilseeds, show a higher level of endogeneity. Since market microstructure theory emphasizes the importance of the direction of the transactions in the price discovery process (cf. Glosten and Milgrom 1985), we differentiate between buyer- and seller-initiated transactions in our analyses.
2. Methodology
The price discovery process has been mainly examined using two measures: The Hasbrouck information share (Hasbrouck 1995) and the Harris–McInish–Wood component share (Harris et al. 2002). Both measures are derived from a reduced form vector error correction model that is estimated based on equidistant time intervals. However, Easley and O’Hara (1992) show that liquidity providers also consider the time between market events within the price setting process. Since the timing of transactions and the frequency in which they occur have information value of their own, fixed-interval aggregation schemes lead to a loss of information (cf. Bauwens and Hautsch 2007). Taking into account the irregular occurrence of transactions requires one to consider the data as a point process. The simplest type of point process is the homogeneous Poisson process. Since the homogeneous Poisson process assumes independently distributed events, it is not suited to describe well-known structures such as correlations and clustering of transactions. The ACD model (Engle and Russell 1998), in contrast, accounts for correlation structures in the data and can be used to model the time between transactions. However, in a multivariate framework, the asynchronous arrival of transactions renders the application of the ACD model difficult and dynamic intensity models are preferable. In autoregressive conditional intensity (ACI) models (Russell 1999), the intensity is directly modeled in terms of an autoregressive process. On the other hand, Hawkes processes (Hawkes 1971) describe the intensity in terms of an additive structure and can be regarded as clusters of Poisson processes. According to this view, all events belong to one of two classes—immigrants and descendants. The exogenous immigrants can trigger clusters of descendants, each of whom in turn can trigger own descendants. In this branching process, the so-called branching ratio is defined as the average number of daughter events per mother event. Hautsch (2004), Bowsher (2007), and Large (2007) confirm that Hawkes processes model the dynamics in financial point processes remarkably well. Since the linear structure of the Hawkes model allows one to separate external influences on the process from internal feedback mechanisms, it is well suited to examine price discovery and potential market reflexivity. Technically speaking, Hawkes processes refer to a class of models for stochastic self-exciting and mutually exciting point processes (Hawkes 1971). These can be regarded as non-homogeneous Poisson processes whose intensity depends on both time and the history of the process. The intensity function of a Hawkes process is defined as:
where is the number of dimensions in the process. The non-negative parameter is the baseline intensity and commonly assumed to be constant. The baseline intensity describes the arrival rate of events triggered by external sources. In our analysis, we use to examine how futures contracts of different maturities react to new information. The non-negative kernel function, , describes the arrival rate of events that are triggered by previous events within the process. Various kernel functions can be found in the literature. The most widely used are power-law and exponential parameterizations of the kernel function. In our analysis, we follow Bacry et al. (2017) and choose the following exponential parametrization of the kernel functions:
where and . In this parametrization, describes the degree of influence of past points on the intensity process and determines the time decay of the influence of past points on the intensity process. From the chosen parametrization, it follows
where is a matrix of kernel norms. Each matrix element describes the total impact that events of the type defined by a column of the matrix has on events of the type defined by a row of the matrix. According to the population representation of a Hawkes process (Hawkes and Oakes 1974), the process is considered stable if < 1. For a stable Hawkes process, a kernel norm stands for the average number of events of type that is directly triggered by a past event of the same type . In our analysis, we use to measure market reflexivity in futures contracts with different maturities. On the other hand, a kernel norm with stands for the average number of events of type that is directly triggered by an event of a different type . We use to measure price discovery between futures contracts with different maturities. Furthermore, following Bacry et al. (2016), the ratio between the baseline intensity and the average intensity describes an exogeneity ratio, i.e., the ratio between the number of events that is triggered by external sources and the total number of events of type :
where the average intensities can be derived by
with as the identity matrix.
Various methods to estimate Hawkes processes have been proposed in the literature. Estimation procedures include maximum likelihood estimation (Ogata 1998) and the resolution of a Wiener–Hopf system (Bacry et al. 2016). In our analysis, we follow Bacry et al. (2017) and estimate the Hawkes process with least-squares. To assess the goodness-of-fit of the estimated Hawkes model, we carry out a residual analysis according to Ogata (1989). Ogata’s residual analysis of point process data is based on the random time change theorem by Meyer (1971). The random time change theorem states that a point process is transformed into a homogeneous Poisson process by its compensator . The compensator is determined by the Doob–Meyer decomposition of a point process and is described by the following monotonically increasing function:
In accordance with Ogata (1989), we use the compensator with the conditional intensity of the estimated Hawkes model to transform the observed data and regard the resulting process as a residual process. In line with the random time change theorem, if the residual process behaves like a homogeneous Poisson process, then the conditional intensity of the estimated Hawkes model is a good approximation to the true intensity of the observed point process. To check whether the residual process behaves similar to a homogeneous Poisson process, we apply Kolmogorov–Smirnov and Ljung–Box tests. On the one hand, the Kolmogorov–Smirnov test examines the null hypothesis that the distribution of the residuals is a homogeneous Poisson distribution. On the other hand, the Ljung–Box test examines the null hypothesis that the residuals are independently distributed. If the null hypothesis of both the Kolmogorov–Smirnov test and the Ljung–Box test cannot be rejected at the 5% significance level, we conclude that the estimated Hawkes process is a good approximation of the observed point process.
3. Empirical Application
3.1. Data
Empirical analyses of market reflexivity can be conducted for different time horizons. Long term analyses are useful if the development of endogeneity and its determinants over time are of interest. Long-term reflexivity is expected to be caused mainly by herding. In this paper, however, we focus on the analysis of short-term reflexivity. Short-term reflexivity is expected to be caused by algorithmic trading (Filimonov et al. 2014) that is supposed to distort the price discovery process in electronic commodity futures markets (cf. Tang and Xiong 2012; Bicchetti and Maystre 2013). For our analysis we utilize the Chicago Mercantile Exchange (CME) Group’s best-bid–best-offer (BBO) futures data. We focus on corn, wheat, live cattle and lean hog. These commodities represent the most actively traded storable and non-storable agricultural futures contracts, respectively. The analysis is based on futures contracts of the first two maturities, i.e., the nearest (front contract) and the next to nearest (back contract).1 We confine our analysis to the daytime trading session because the trading activity is much higher compared to the evening trading session. At the beginning of the daytime trading session, orders that have accumulated in the previous night are processed (cf. Gurgul and Syrek 2017), which can lead to a distorted picture of the price discovery process. Therefore, we exclude the first hour of the daytime trading session. Furthermore, to ensure stationarity of the parameters of the estimated Hawkes process, we follow Filimonov et al. (2014) and base our estimations on intervals of 10 min. Intervals of 10 min are considered to contain a sufficient number of events for reliable estimation. It can be assumed that in short intervals of 10 min, market reflexivity is not caused by behavioral mechanisms, such as herding, but instead is mainly caused by automated trading. The observation period covers all trading days in March 2016, which corresponds to 528 intervals of 10 min. March has been chosen as the observation period, because we want to exclude a rollover of contracts and the effect of a new harvest. On the other hand, we are interested in the effect of a release of three public reports on the short-term reflexivity: a World Agricultural Supply and Demand Estimates (WASDE) report on world agricultural supply and demand estimations, the United States Department of Agriculture (USDA) report on prospective plantings, and a National Agricultural Statistics Service (NASS) report on grain stocks. BBO data contain top-of-book quotes, transactions, and corresponding time stamps with a resolution of one second. In line with the above-mentioned market microstructure models, we regard the trading activity as the starting point of the price formation process and base our analyses on transactions. However, many transactions share the same time stamp. Therefore, to take all transactions into account, we follow Wang et al. (2016) and simulate sub-second time stamps. In addition, BBO data do not include the direction of transactions. Therefore, to distinguish between buyer- and seller-initiated transactions, we apply the trade classification algorithm proposed by Lee and Ready (1991). To summarize, we analyze a four-dimensional point process whose dimensions are buyer- and seller-initiated transactions in a futures front and back contract for corn, wheat, live cattle and lean hog.
3.2. Descriptive Statistics
Table 1 contains descriptive statistics for the considered commodities. The total number of buyer- and seller-initiated transactions is considerably higher in the front contract than in the back contract for corn and wheat. In contrast, the total number of transactions is similar in the front and back contract for live cattle and lean hog. The number of seller-initiated transactions is higher than the number of buyer-initiated transactions in both the front and back contract for corn. In contrast, the number of seller-initiated transactions is lower than the number of buyer-initiated transactions in both the front and back contract for live cattle. The coefficients of variation show that the number of transactions varies more widely over the intervals for storable than for non-storable commodities.
The trading volume is much higher for storable than for non-storable commodities. Moreover, the trading volume is significantly higher in the front contract than in the back contract for corn and for wheat. In contrast, the trading volume is similar in both the front and back contract for live cattle and lean hog. Furthermore, the imbalance between the buy-and-sell volume is larger for corn and wheat than for live cattle and lean hog. A high coefficient of variation indicates that the trading volume varies considerably over the intervals. The coefficient of variation is highest for corn.
To avoid bid–ask bounce effects, our descriptive statistics are based on mid-quotes rather than transaction prices. The mid-quotes are higher in the back contract than in the front contract for corn, wheat, and lean hog. This points to a normal forward curve during the observation period. In contrast, mid-quotes are higher in the front contract than in the back contract for live cattle. This points to an inverted forward curve during the observation period. The standard deviation of the mid-quotes is higher for storable than for non-storable commodities. However, low coefficients of variation for all commodities indicate that prices exhibit little volatility during the observation period.
3.3. Results
Table 2 shows the estimated baseline intensities , the derived average intensities , and exogeneity ratios . All figures for , and are mean values over 528 intervals of 10 min. As a robustness check, we conducted additional calculations with a different time interval length (30 min) for corn and lean hog (see Table A1 and Table A2, Figure A1 in the Appendix A). The qualitative findings are similar and, thus, we focus on the discussion of the results of the 10-min intervals in what follows.
The baseline intensity is by far the highest for the front contract of corn. This means that in absolute terms, the number of transactions that is triggered by external sources is highest for the front contract of corn. In addition, is of similar size for buyer- and seller-initiated transactions in a contract of a certain maturity for all commodities. It is striking that is noticeably larger in the front contract than in the back contract for corn and wheat. In contrast, is of similar size in the front contract and back contract for live cattle and lean hog. This suggests that price discovery takes place in the front contract for storable commodities, but not for non-storable commodities. These estimation results for the baseline intensity are therefore in line with Working (1949) and Gray and Rutledge (1971). Compared to the baseline intensity, the derived average intensity is higher for all examined contracts. Similar to the baseline intensity, is considerably larger in the front contract than in the back contract for corn and wheat. In contrast, is of similar size in the front and back contract for live cattle and lean hog. The derived exogeneity ratio is higher for non-storable than for storable commodities. About 75% (65%) of all observed transactions in the lean hog (corn) futures are triggered by external sources. The results also find that is of similar size for buyer- and seller-initiated transactions in a commodity futures contract of a certain maturity. Moreover, is slightly higher in the back contract than in the front contract for all commodities. Apparently, the derived exogeneity ratio is considerably higher for the examined agricultural futures contracts than for the DAX and BUND futures contracts examined by Bacry et al. (2016). Moreover, the derived exogeneity ratios are higher than the corresponding figures in Filimonov et al. (2014).
Figure 1 presents the estimated matrices of kernel norms . Each kernel norm describes the total impact that transactions of a certain contract type have on transactions of the same or on other contracts. Figure 1 has to be interpreted column-wise. A darker background color of a kernel norm illustrates a larger impact than a lighter color. A kernel norm on the diagonals of the matrices describes the impact that transactions of a certain type have on transactions of the same type. A kernel norm on the off-diagonals of the matrices describes the impact that transactions of a certain type have on transactions of a different type. In general, the kernel norm values are higher for storable than for non-storable commodities. According to the population representation of the Hawkes process, each buyer-initiated (seller-initiated) transaction directly triggers 0.3102 buyer-initiated transactions (0.3147 seller-initiated) on average in the front contract for corn. The respective values for other commodities are slightly smaller. Apparently, the kernel norm values on the diagonals of the matrix are considerably higher compared to those on the off-diagonals for all commodities. This indicates that a substantial part of the observed transactions is endogenously driven and points to the presence of market reflexivity for all commodities. In addition, the kernel norm values on the diagonals of the matrix are higher in the front contract than in the back contract for corn and wheat. In contrast, the kernel norm values on the diagonals are of similar size in the front and back contract for live cattle and lean hog. As expected, the estimation results for the matrices of kernel norms show that differences between front and back contracts are less pronounced for non-storable than for storable commodities.
The kernel norms on the off-diagonals show that in the cases of corn and wheat, the impact of front contracts on back contracts is larger than vice versa. This relationship, however, is not prevalent for live cattle and lean hog. Thus, our results are in line with Hu et al. (2017), who show that nearby futures contracts dominate deferred futures contracts in price discovery for storable commodities, but not for non-storable commodities. No differences can be identified between buyer- and seller-initiated transactions.
Table 3 contains the results of the residual analyses of the estimated Hawkes processes. For more than about 80% of the 10-min intervals, the Kolmogorov–Smirnov test does not reject the null hypothesis that the distribution of the residuals is homogeneous Poisson at the 5% significance level for the considered commodities. Except for the front contracts of corn and wheat, for more than approximately 90% of the 10-min intervals, the Ljung–Box test does not reject the null hypothesis that the residuals are independently distributed at the 5% significance level. We can therefore conclude that the estimated Hawkes process with the chosen parameterization of the kernel function is a good approximation of the observed point process.
Figure 2 displays the evolution of the average intensity over the whole observation period. The figure is based on daily mean values of the average intensity. In general, the evolution of for the front contract is similar to the evolution of for the back contract for all commodities. In particular, is higher for the front contract than for the back contract throughout the whole observation period for corn and wheat. In contrast, for live cattle and lean hog, is higher for the front contract than for the back contract in the first half of the observation period only. In addition, the evolution of the average intensity of buyer-initiated transactions is similar to the evolution of the average intensity of seller-initiated transactions in a contract of a certain maturity for all commodities.
In general, the average intensity shows a relatively constant progression for all commodities; however, increases around certain days where public information became available. For instance, the average intensity increases for all commodities on 9 March 2016 when the USDA released its monthly WASDE report (USDA 2016b). Furthermore, increases for live cattle on 22 March 2016 following a USDA cattle on feed report (USDA 2016c). Most notably, increases considerably towards the end of the observation period for corn and wheat on 31 March 2016. On this day (11:00 a.m.), the USDA reported an unexpected increase in the corn acreage (USDA 2016a). On the same day, the USDA published its quarterly grain stocks reports (USDA 2016d). This may explain why the increase in average intensities is rather pronounced at that time. Overall, Figure 2 documents that the publication of USDA reports affects not only volatility and trading volume, but also the intensity of trading activity.
Figure 3 depicts the evolution of the baseline intensity on 31 March 2016 for corn. The figure is based on 24 intervals of 10 min. The baseline intensity increases considerably at the time of the publication of the USDA report for transactions in both the front and back contract. Moreover, the evolution of for seller-initiated transactions is similar to the evolution of for buyer-initiated transactions at the time of the publication of the USDA report for the front contract. In contrast, for the back contract, the evolution of for seller-initiated transactions differs from the evolution of for buyer-initiated transactions at the time of the publication of the USDA report.
The evolution of the baseline intensity for corn on 31 March 2016 suggests that new information is quickly incorporated into market prices through trading activity. Moreover, it is becoming clearer that new information does not only affect nearby futures contracts, but also affects deferred futures contracts.
Figure 4 presents the estimated matrix of kernel norms for corn on 31 March 2016. The figures are mean values over 24 intervals of 10 min.
Compared to the whole observation period, the kernel norm values on the diagonal of the matrix are considerably higher for corn on 31 March 2016. This indicates an increase in market reflexivity on the publication day of the USDA report. Moreover, compared to the whole observation period, the kernel norm values on the off-diagonal of the matrix are higher for the back contract for corn on 31 March 2016. This indicates an increase in the impact that transactions in the back contract have on transactions in both the front and back contract on the publication day of the USDA report.
To gain an overall picture of the price formation process in agricultural futures contracts with different maturities, Figure 5 illustrates the composition of the estimated intensity of the trading activity in both the front and back contract exemplarily for corn and live cattle. The figure is based on mean values of 528 intervals of 10 min. It shows the relative contribution of the estimated baseline intensity and the kernel norms and to the total intensity .
The relative contribution of the baseline intensity to the total intensity is largest for the front contract of corn. It amounts to approximately 30%. This means that external sources, such as new information, account for approximately 30% of the total intensity of both buyer-initiated and seller-initiated transactions for the front contract of corn. Moreover, the relative contribution of is noticeably larger in the front contract than in the back contract for corn. In contrast, the relative contribution of is of similar size in the front and back contract for live cattle. Therefore, in line with Working (1949) and Gray and Rutledge (1971), the composition of the estimated intensity suggests that nearby futures contracts dominate deferred futures contracts in price discovery for storable commodities, but not for non-storable commodities.
Compared to the relative contribution of , the relative contribution of the kernel norms to the total intensity is considerably larger. More specifically, the relative contribution of to the total intensity is largest for the back contract of corn. It amounts to roughly 70%, which means that market reflexivity accounts for about 70% of the total intensity of both buyer-initiated and seller-initiated transactions for the back contract of corn. Moreover, the relative contribution of is clearly larger in the back contract than in the front contract for corn. In contrast, the relative contribution of is of similar size in the front and back contract for live cattle.
As expected, the composition of the estimated intensity shows that differences between front and back contracts in the degree of market reflexivity are less pronounced for live cattle than for corn. Compared to the relative contribution of , the relative contribution of the kernel norms to the total intensity is considerably smaller. More specifically, the relative contribution of to the total intensity is higher for live cattle than for corn. It is shown that buyer-initiated transactions in the back contract account for almost 20% of the total intensity of buyer-initiated transactions in the front contract for live cattle. On the other hand, buyer-initiated transactions in the back contract account for approximately 10% of the total intensity of buyer-initiated transactions in the front contract for corn. Therefore, in line with Kendall (1982), the composition of the estimated intensity suggests that interdependencies of current and subsequent supply might link futures contracts of different maturities to non-storable commodities.
4. Conclusions
This paper is the first to examine price discovery in nearby and deferred agricultural commodities futures contracts while explicitly considering potential market reflexivity. For this purpose, we apply a four-dimensional Hawkes model with an exponential parametrization of the kernel functions to storable and non-storable agricultural commodities. We find market reflexivity for both storable and non-storable commodities. Reflexivity accounts for about 50 to 70% of the total trading activity, irrespective of whether transactions have been buyer- or seller-initiated. Storable commodities show a higher level of reflexivity than non-storable commodities and differences between nearby and deferred contracts are less pronounced for non-storable commodities than for storable ones. We conjecture that the degree of reflexivity is related to the trading intensity and the amount of automated trading. Endogeneity results from backward-looking trading strategies, which exploit information from previous trading activities. Most likely, this source of endogeneity is more prevalent in liquid markets than in thin markets. Storable commodities are more frequently traded compared with non-storable commodities, but this holds only for the front contract (c.f. Table 1). Moreover, grains show a higher share of automated trading than livestock contracts (e.g., Haynes and Roberts 2015; Couleau et al. 2019). It appears that these differences are reflected in the endogeneity of the price formation process.
What are the implications of these findings for the price discovery process in agricultural commodity futures? The presence of market reflexivity seems to contradict the efficient market hypothesis, and Filimonov et al. (2014) argue that reflexivity is likely to result in a less efficient price discovery process. Though our analysis does not allow an evaluation of the presence of reflexivity, we can at least compare our results with previous empirical findings on price discovery in agricultural commodity futures markets and screen them for irregularities. Regarding the relation between nearby and deferred futures contracts, our results are in line with Mallory et al. (2015), who find that new information to the market is immediately transmitted across all contract maturities. Moreover, we can replicate the finding of Hu et al. (2017) that nearby contracts are dominant in price discovery for storable commodities, but not for non-storable commodities. Finally, we observe an increased baseline intensity at the time of a USDA publication, suggesting that external information is quickly incorporated into market prices through trading activity despite the presence of market reflexivity. From these findings, we conclude that the co-existence of exogenous and endogenous price dynamics does not change qualitative characteristics of the price discovery process that have been observed earlier without the consideration of market reflexivity.
Some aspects could be incorporated in further empirical analyses to obtain a clearer picture about price discovery in agricultural commodity futures in the presence of market reflexivity. The empirical basis could be broadened by including additional commodities. Moreover, price discovery and market reflexivity should be examined over a longer observation period covering, for example, markets in normal backwardation and in contango. From a methodological point of view, the Hawkes model can be extended and amended in several ways. Covariates such as order imbalances between buyer- and seller-initiated transactions can be included into the intensity function. Other parameterizations of the kernel function such as power-law parameterizations or other estimation methods such as non-parametric estimation techniques can be applied to check the robustness of the results. Finally, methods allowing the assessment of the direct impact of market reflexivity on the price formation process need to be explored.
Author Contributions
Conceptualization, S.V., G.F. and M.O.; data curation, S.V. and G.F.; formal analysis, S.V.; methodology, S.V. and G.F.; software, S.V.; supervision, M.O.; validation, S.V. and G.F.; visualization, S.V. and G.F.; writing—original draft, S.V., G.F. and M.O.; writing—review and editing, S.V., G.F. and M.O. All authors have read and agreed to the published version of the manuscript.
Funding
This research received no external funding.
Acknowledgments
We thank three anonymous reviewers for helpful comments and suggestions.
Conflicts of Interest
The authors declare no conflict of interest.
Appendix A

Table A1.
Estimated baseline intensities, average intensities, and exogeneity ratios (corn, lean hog) for a 30-min interval.
Table A1.
Estimated baseline intensities, average intensities, and exogeneity ratios (corn, lean hog) for a 30-min interval.
| Contract | Front | Back | Front | Back | ||||
|---|---|---|---|---|---|---|---|---|
| Transaction | Buy | Sell | Buy | Sell | Buy | Sell | Buy | Sell |
| Commodity | Corn (30-min interval) | Lean Hog (30-min interval) | ||||||
| Baseline intensity | 0.164 | 0.163 | 0.054 | 0.056 | 0.052 | 0.058 | 0.054 | 0.052 |
| Average intensity | 0.303 | 0.312 | 0.089 | 0.093 | 0.087 | 0.091 | 0.087 | 0.082 |
| Exogeneity ratio | 0.567 | 0.565 | 0.643 | 0.638 | 0.669 | 0.681 | 0.683 | 0.697 |
Table A2.
Residual analyses (corn, lean hog) for a 30-min interval.
| Contract | Front | Back | Front | Back | ||||
|---|---|---|---|---|---|---|---|---|
| Transaction | Buy | Sell | Buy | Sell | Buy | Sell | Buy | Sell |
| Commodity | Corn (30-min interval) | Lean Hog (30-min interval) | ||||||
| Kolmogorov–Smirnov | 0.460 | 0.465 | 0.758 | 0.757 | 0.830 | 0.800 | 0.794 | 0.790 |
| Ljung–Box | 0.373 | 0.374 | 0.791 | 0.770 | 0.807 | 0.785 | 0.829 | 0.860 |
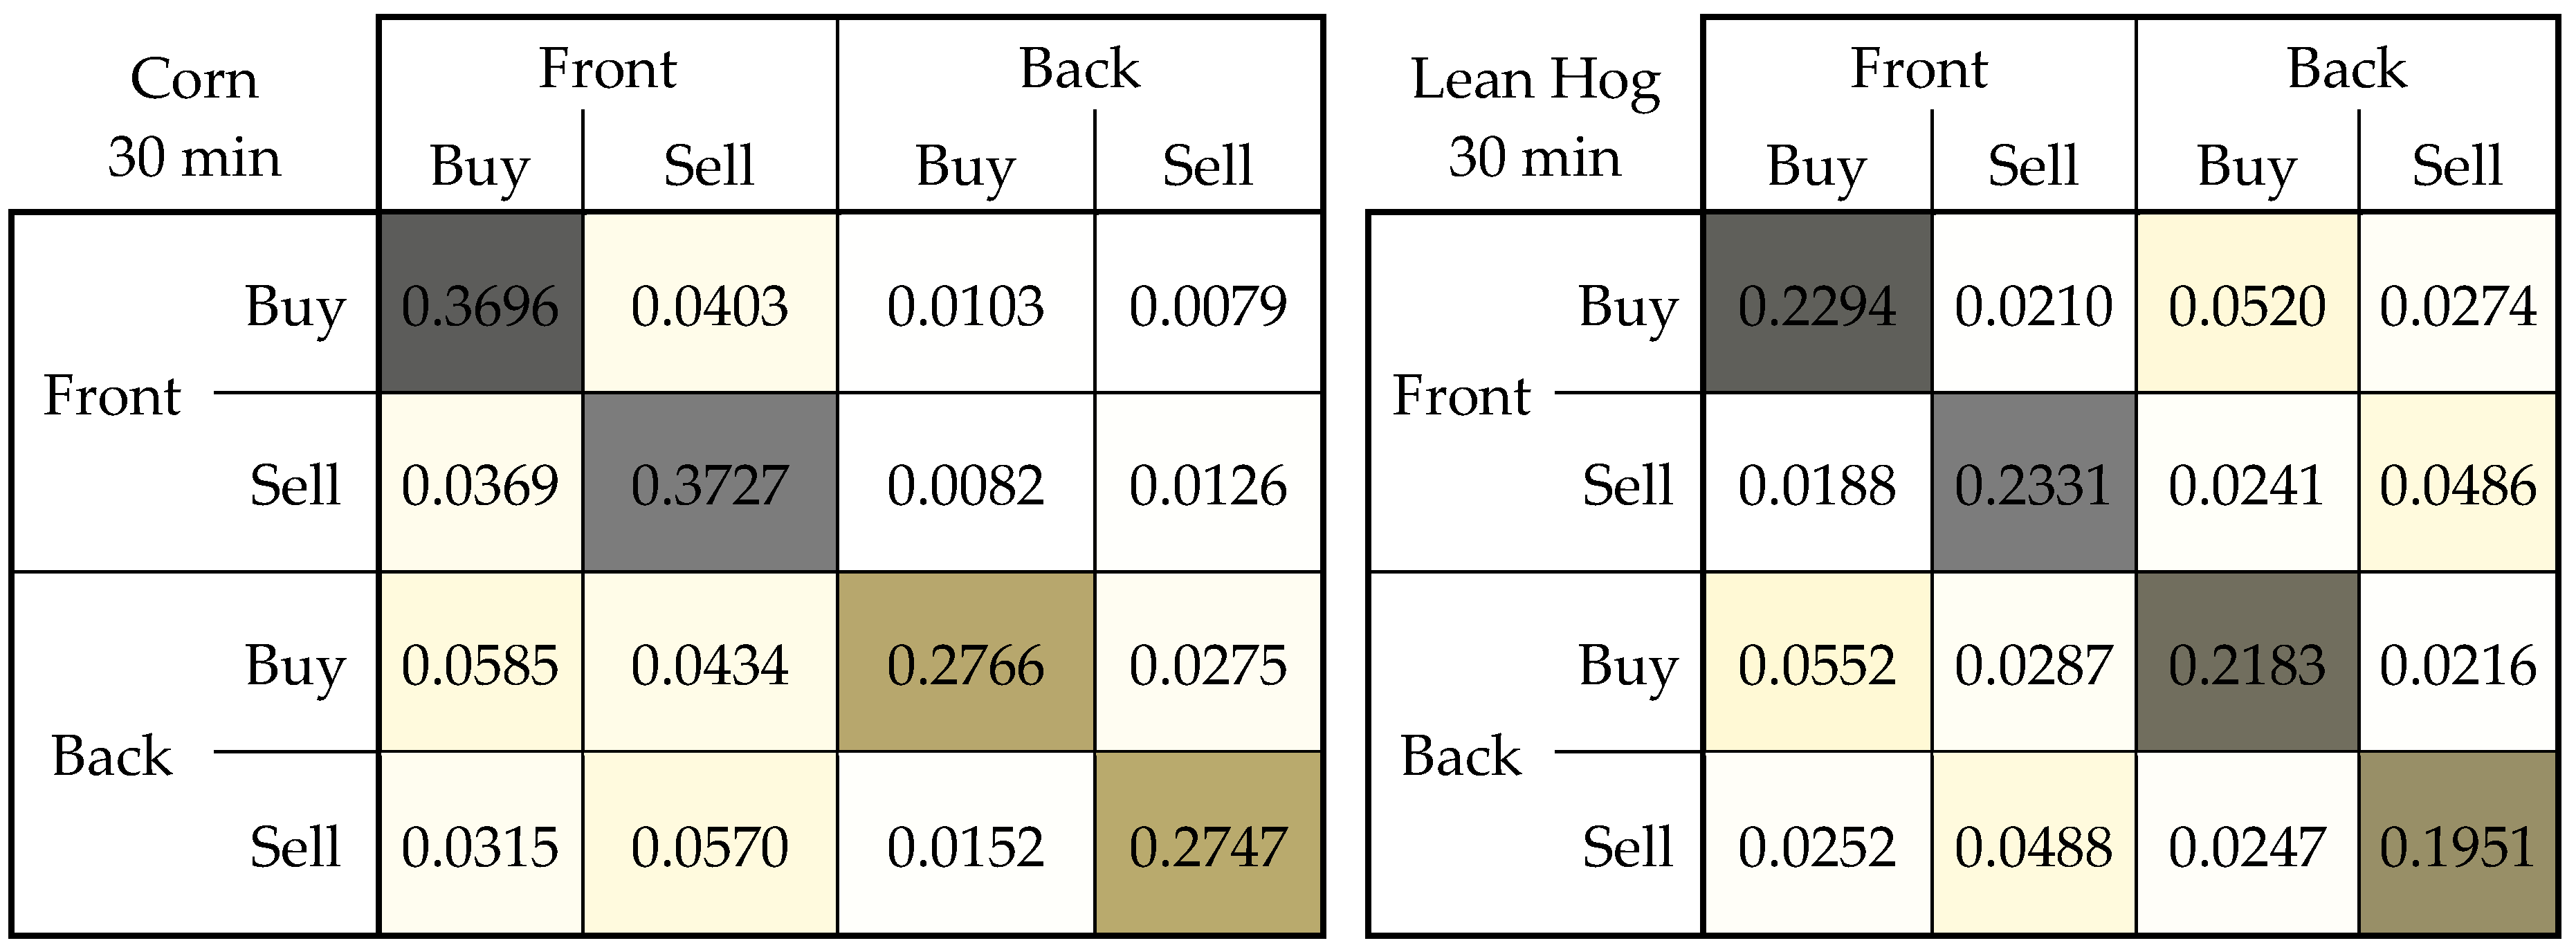
Figure A1.
Estimated matrices of kernel norms (corn, lean hogs) for a 30-min interval.
| 1 | An inclusion of further contracts with longer maturities would be desirable to obtain a clearer picture of price discovery along the entire term structure curve. However, this comes at the cost of increasing the dimension of the Hawkes model. Moreover, the number of transactions becomes rather small for futures contracts with longer maturity, which renders the estimation unreliable. |
References
- Bacry, Emmanuel, Martin Bompaire, Stéphane Gaıffas, and Soren Poulsen. 2017. Tick: A Python library for statistical learning, with a particular emphasis on time-dependent modeling. arXiv arXiv:1707.03003. [Google Scholar]
- Bacry, Emmanuel, Thibault Jaisson, and Jean–François Muzy. 2016. Estimation of slowly decreasing Hawkes kernels: Aplication to high-frequency order book dynamics. Quantitative Finance 16: 1179–201. [Google Scholar] [CrossRef]
- Bauwens, Luc, and Nikolaus Hautsch. 2007. Modelling Financial High Frequency Data Using Point Processes. SFB 649 Discussion Paper 2007-066. Available online: http://sfb649.wiwi.hu-berlin.de/papers/pdf/SFB649DP2007-066.pdf (accessed on 29 October 2018).
- Bicchetti, David, and Nicolas Maystre. 2013. The synchronized and long-lasting structural change on commodity markets: Evidence from high frequency data. Algorithmic Finance 2: 233–39. [Google Scholar] [CrossRef] [Green Version]
- Bowsher, Clive G. 2007. Modelling Security Markets in Continuous Time: Intensity-based, Multivariate Point Process Models. Journal of Econometrics 141: 876–912. [Google Scholar] [CrossRef] [Green Version]
- Couleau, Anabelle, Teresa Serra, and Philip Garcia. 2019. Microstructure noise and realized variance in the live cattle futures market. American Journal of Agricultural Economics 101: 563–78. [Google Scholar] [CrossRef] [Green Version]
- Brennan, M. J. 1958. The supply of storage. American Economic Review 48: 50–72. [Google Scholar]
- Diebold, Francis X., and Canlin Li. 2006. Forecasting the term structure of government bond yields. Journal of Econometrics 130: 337–64. [Google Scholar] [CrossRef] [Green Version]
- Easley, David, and Maureen O’Hara. 1992. Time and the process of security price adjustment. Journal of Finance 47: 577–604. [Google Scholar] [CrossRef]
- Engle, Robert F., and Jeffrey R. Russell. 1998. Autoregressive conditional duration: A new model for irregularly spaced transaction data. Econometrica 66: 1127–62. [Google Scholar] [CrossRef]
- Fama, Eugene F. 1970. Efficient capital markets: A review of theory and empirical work. The Journal of Finance 25: 383–417. [Google Scholar] [CrossRef]
- Fama, Eugene F., and Kenneth R. French. 1987. Commodity Futures Prices: Some Evidence on Forecast Power, Premiums, and the Theory of Storage. The Journal of Business 60: 55–73. [Google Scholar] [CrossRef]
- Filimonov, Vladimir, and Didier Sornette. 2012. Quantifying reflexivity in financial markets: Toward a prediction of flash crashes. Physical Review E 85: 056108. [Google Scholar] [CrossRef] [Green Version]
- Filimonov, Vladimir, David Bicchetti, Nicolas Maystre, and Didier Sornette. 2014. Quantification of the high level of endogeneity and of structural regime shifts in commodity markets. Journal of International Money and Finance 42: 174–92. [Google Scholar] [CrossRef] [Green Version]
- Geman, Helyette, and Vu-Nhat Nguyen. 2005. Soybean Inventory and Forward Curve Dynamics. Management Science 51: 1076–91. [Google Scholar] [CrossRef] [Green Version]
- Gibson, Rajna, and Eduardo S. Schwartz. 1990. Stochastic Convenience Yield and the Pricing of Oil Contingent Claims. Journal of Finance 45: 959–76. [Google Scholar] [CrossRef]
- Glosten, Lawrence R., and Paul R. Milgrom. 1985. Bid, Ask, and Transaction Prices in a Specialist Market with Heterogeneously Informed Agents. Journal of Financial Economics 14: 71–100. [Google Scholar] [CrossRef] [Green Version]
- Gray, Roger W., and David J. S. Rutledge. 1971. The economics of commodity futures markets: A survey. Review of Marketing and Agricultural Economics 39: 57–108. [Google Scholar]
- Gurgul, Henryk, and Robert Syrek. 2017. Trading volume and volatility patterns across selected Central European stock markets from microstructural perspective. Managerial Economics 18: 87. [Google Scholar] [CrossRef] [Green Version]
- Hardiman, Stephen J., Nicolas Bercot, and Jean-Philippe Bouchard. 2013. Critical reflexivity in financial markets: A Hawkes process analysis. The European Physical Journal B 86: 442. [Google Scholar] [CrossRef] [Green Version]
- Harris, Frederick H. deB., Thomas H. McInish, and Robert A. Wood. 2002. Security price adjustment across exchanges: An investigation of common factor components for Dow stocks. Journal of Financial Markets 5: 277–308. [Google Scholar] [CrossRef]
- Hasbrouck, Joel. 1995. One Security, Many Markets: Determining the Contributions to Price Discovery. The Journal of Finance 50: 1175–95. [Google Scholar] [CrossRef]
- Hautsch, Nikolaus. 2004. Modelling Irregularly Spaced Financial Data. Berlin: Springer. [Google Scholar]
- Hawkes, Alan G. 1971. Point spectra of some mutually-exciting point processes. Journal of the Royal Statistical Society 33: 438–43. [Google Scholar] [CrossRef]
- Hawkes, Alan G., and David Oakes. 1974. A cluster process representation of a self-exciting process. Journal of Applied Probability 11: 493–503. [Google Scholar] [CrossRef]
- Haynes, Richard, and John S. Roberts. 2015. Automated Trading in Futures Markets. CFTC White Paper. Available online: https://www.cftc.gov/sites/default/files/idc/groups/public/@economicanalysis/documents/file/oce_automatedtrading.pdf (accessed on 25 October 2019).
- Hu, Zhepeng, Mindy Mallory, Teresa Serra, and Philip Garcia. 2017. Measuring Price Discovery between Nearby and Deferred Contracts in Storable and Non-Storable Commodity Futures Markets. arXiv arXiv:1711.03506. [Google Scholar]
- Karstanje, Dennis, Michel van der Wel, and Dick J. C. van Dijk. 2017. Common Factors in Commodity Futures Curves. SSRN Working Paper. [Google Scholar] [CrossRef] [Green Version]
- Kendall, David Laurence. 1982. Intertemporal Price Relationships in Noninventory Futures Markets. Ph.D. thesis, North Carolina State University, Raleigh, NC, USA. [Google Scholar]
- Kyle, Albert S., and Anna Obizhaev. 2019. Large Bets and Stock Market Crashes. Working Paper. Available online: https://ssrn.com/abstract=2023776 (accessed on 25 October 2019).
- Large, Jeremy. 2007. Measuring the Resiliency of an Electronic Limit Order Book. Journal of Financial Markets 10: 1–25. [Google Scholar] [CrossRef] [Green Version]
- Lee, Charles M. C., and Mark J. Ready. 1991. Inferring trade direction from intraday data. The Journal of Finance 46: 733–46. [Google Scholar] [CrossRef]
- Mallory, Mindy, Philip Garcia, and Teresa Serra. 2015. Nearby and Deferred Quotes: What They Tell Us about Linkages and Adjustments to Information. Proceedings of the NCCC-134 Conference on Applied Commodity Price Analysis, Forecasting, and Market Risk Management. Available online: http://www.farmdoc.illinois.edu/nccc134/conf_2015/pdf/Mallory_Garcia_Serra_NCCC_134_2015.pdf (accessed on 25 October 2019).
- Meyer, Paul-André. 1971. Démonstration simplifiée d’un théorème Knight. Lecture Notes in Mathematics 191: 191–95. [Google Scholar]
- Nelson, Charles R., and Andrew F. Siegel. 1987. Parsimonious modeling of yield curve. Journal of Business 60: 473–89. [Google Scholar] [CrossRef]
- Ogata, Yosihiko. 1989. Statistical Models for Earthquake Occurrences and Residual Analysis for Point Processes. Journal of the American Statistical Association 83: 9–27. [Google Scholar] [CrossRef]
- Ogata, Yosihiko. 1998. Space-time point-process models for earthquake occurrences. Annals of the Institute of Statistical Mathematics 50: 379–402. [Google Scholar] [CrossRef]
- Russell, Jeffrey R. 1999. Econometric Modeling of Multivariate Irregularly-Spaced High-Frequency Data. Working Paper, University of Chicago. Available online: http://citeseerx.ist.psu.edu/viewdoc/download?doi=10.1.1.202.486&rep=rep1&type=pdf (accessed on 5 November 2018).
- Schwartz, Eduardo S. 1997. The Stochastic Behavior of Commodity Prices: Implications for Valuation and Hedging. The Journal of Finance 52: 923–73. [Google Scholar] [CrossRef]
- Sorensen, Carsten. 2002. Modeling seasonality in agricultural commodity futures. The Journal of Futures Markets 22: 393–426. [Google Scholar] [CrossRef]
- Soros, George. 1987. The Alchemy of Finance: Reading the Mind of the Market. New York: John Wiley & Sons. [Google Scholar]
- Tang, Ke, and Wei Xiong. 2012. Index investment and the financialization of commodities. Financial Analysts Journal 68: 54–74. [Google Scholar] [CrossRef]
- USDA. 2016a. Prospective Plantings (March 2016). United States Department of Agriculture, National Agricultural Statistics Service. Available online: https://downloads.usda.library.cornell.edu/usda-esmis/files/x633f100h/9c67wq58w/rx913s37m/ProsPlan-03-31-2016.pdf (accessed on 25 October 2019).
- USDA. 2016b. United States Department of Agriculture, National Agricultural Statistics Service. Available online: https://downloads.usda.library.cornell.edu/usda-esmis/files/3t945q76s/zs25x8827/d504rk71k/wasde-03-09-2016.pdf (accessed on 25 October 2019).
- USDA. 2016c. United States Department of Agriculture, National Agricultural Statistics Service. Available online: https://downloads.usda.library.cornell.edu/usda-esmis/files/m326m174z/8623j006q/q524jq148/CattOnFe-03-18-2016.pdf (accessed on 25 October 2019).
- USDA. 2016d. United States Department of Agriculture, National Agricultural Statistics Service. Available online: https://downloads.usda.library.cornell.edu/usda-esmis/files/xg94hp534/08612q46m/fj236409h/GraiStoc-03-31-2016.pdf (accessed on 25 October 2019).
- Volkenand, Steffen, Günther Filler, Marlene Kionka, and Martin Odening. 2019. Duration dependence among agricultural futures with different maturities. Applied Economics Letters. [Google Scholar] [CrossRef]
- Wang, Xiaoyang, Philip Garcia, and Scott H. Irwin. 2016. Are agricultural futures getting noisier? The impact of high frequency quoting in the corn market. Working paper, University of Illinois, Urbana-Champaign. Available online: https://legacy.farmdoc.illinois.edu/irwin/research/Wang_Garcia_Irwin_Oct%202016.pdf (accessed on 25 October 2019).
- Working, Hoolbrock. 1949. The theory of price of storage. The American Economic Review 39: 1254–62. [Google Scholar]
Figure 1.
Estimated matrices of kernel norms.

Figure 2.
Evolution of average intensities (y-axis) in both buy and sell transactions for corn, wheat, live cattle, and lean hog in March 2016.
Figure 2.
Evolution of average intensities (y-axis) in both buy and sell transactions for corn, wheat, live cattle, and lean hog in March 2016.
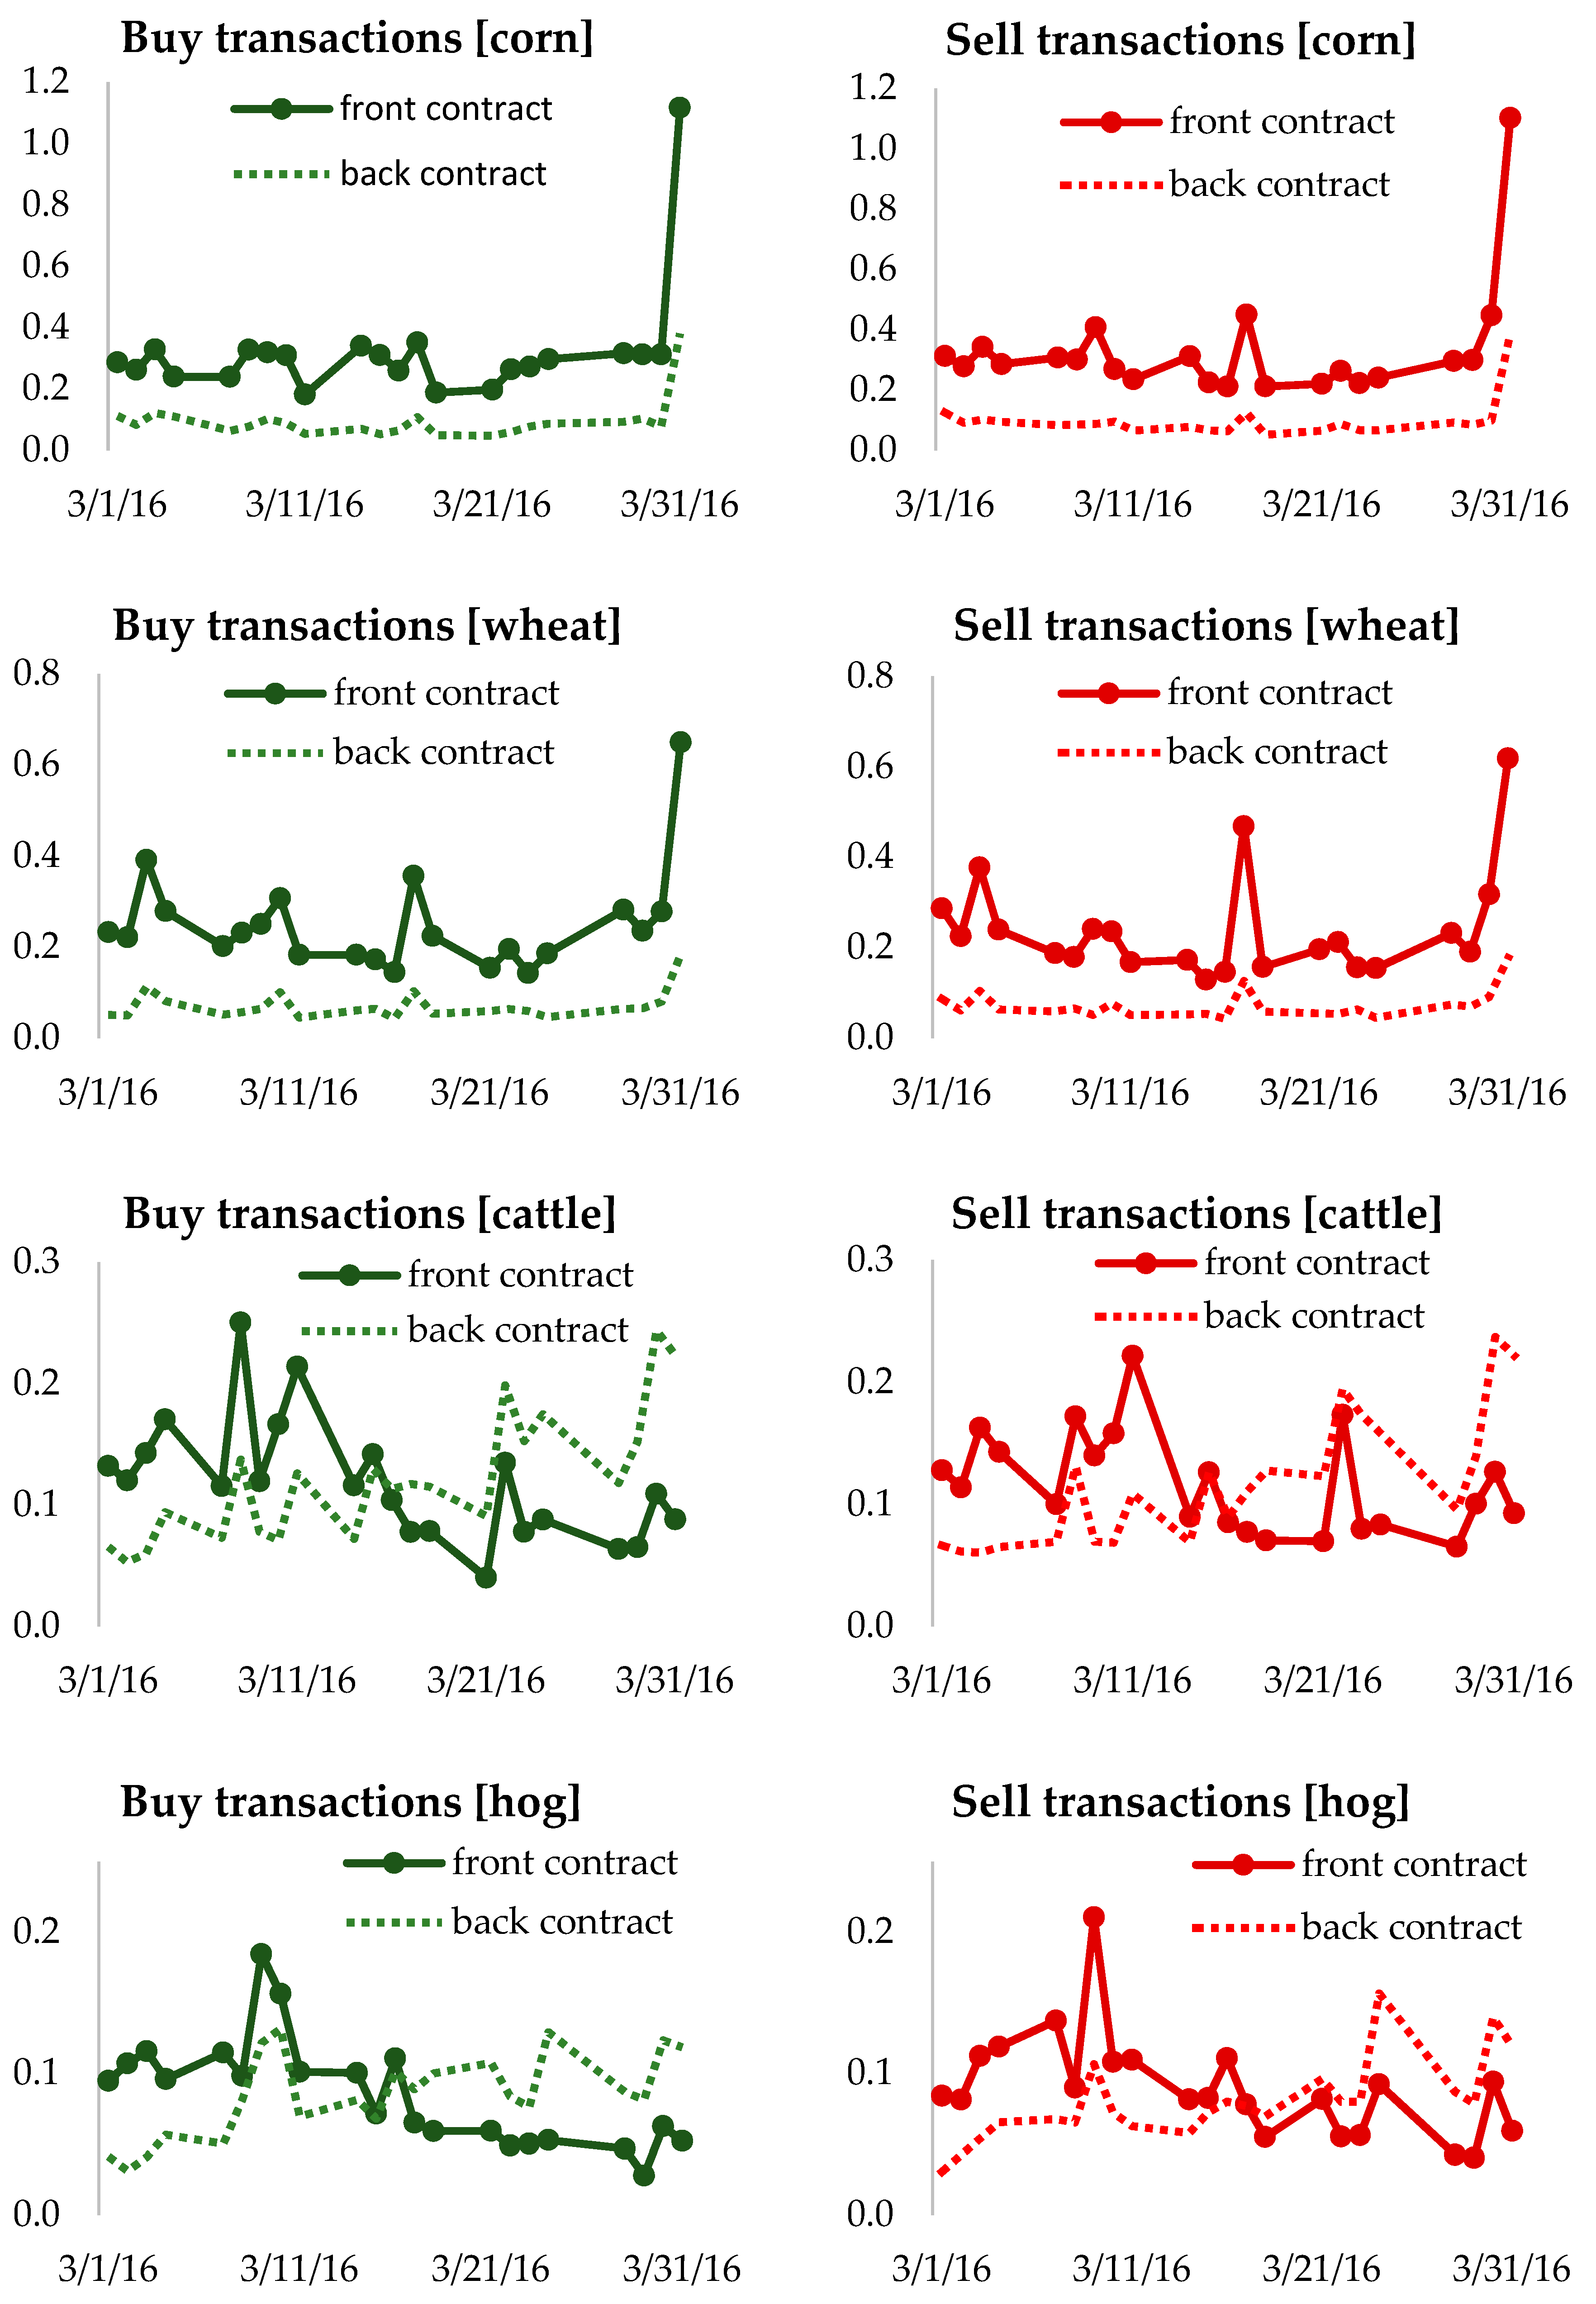
Figure 3.
Evolution of the baseline intensity (y-axis) for corn on 31 March 2016.

Figure 4.
Estimated matrix of kernel norms for corn on 31 March 2016.
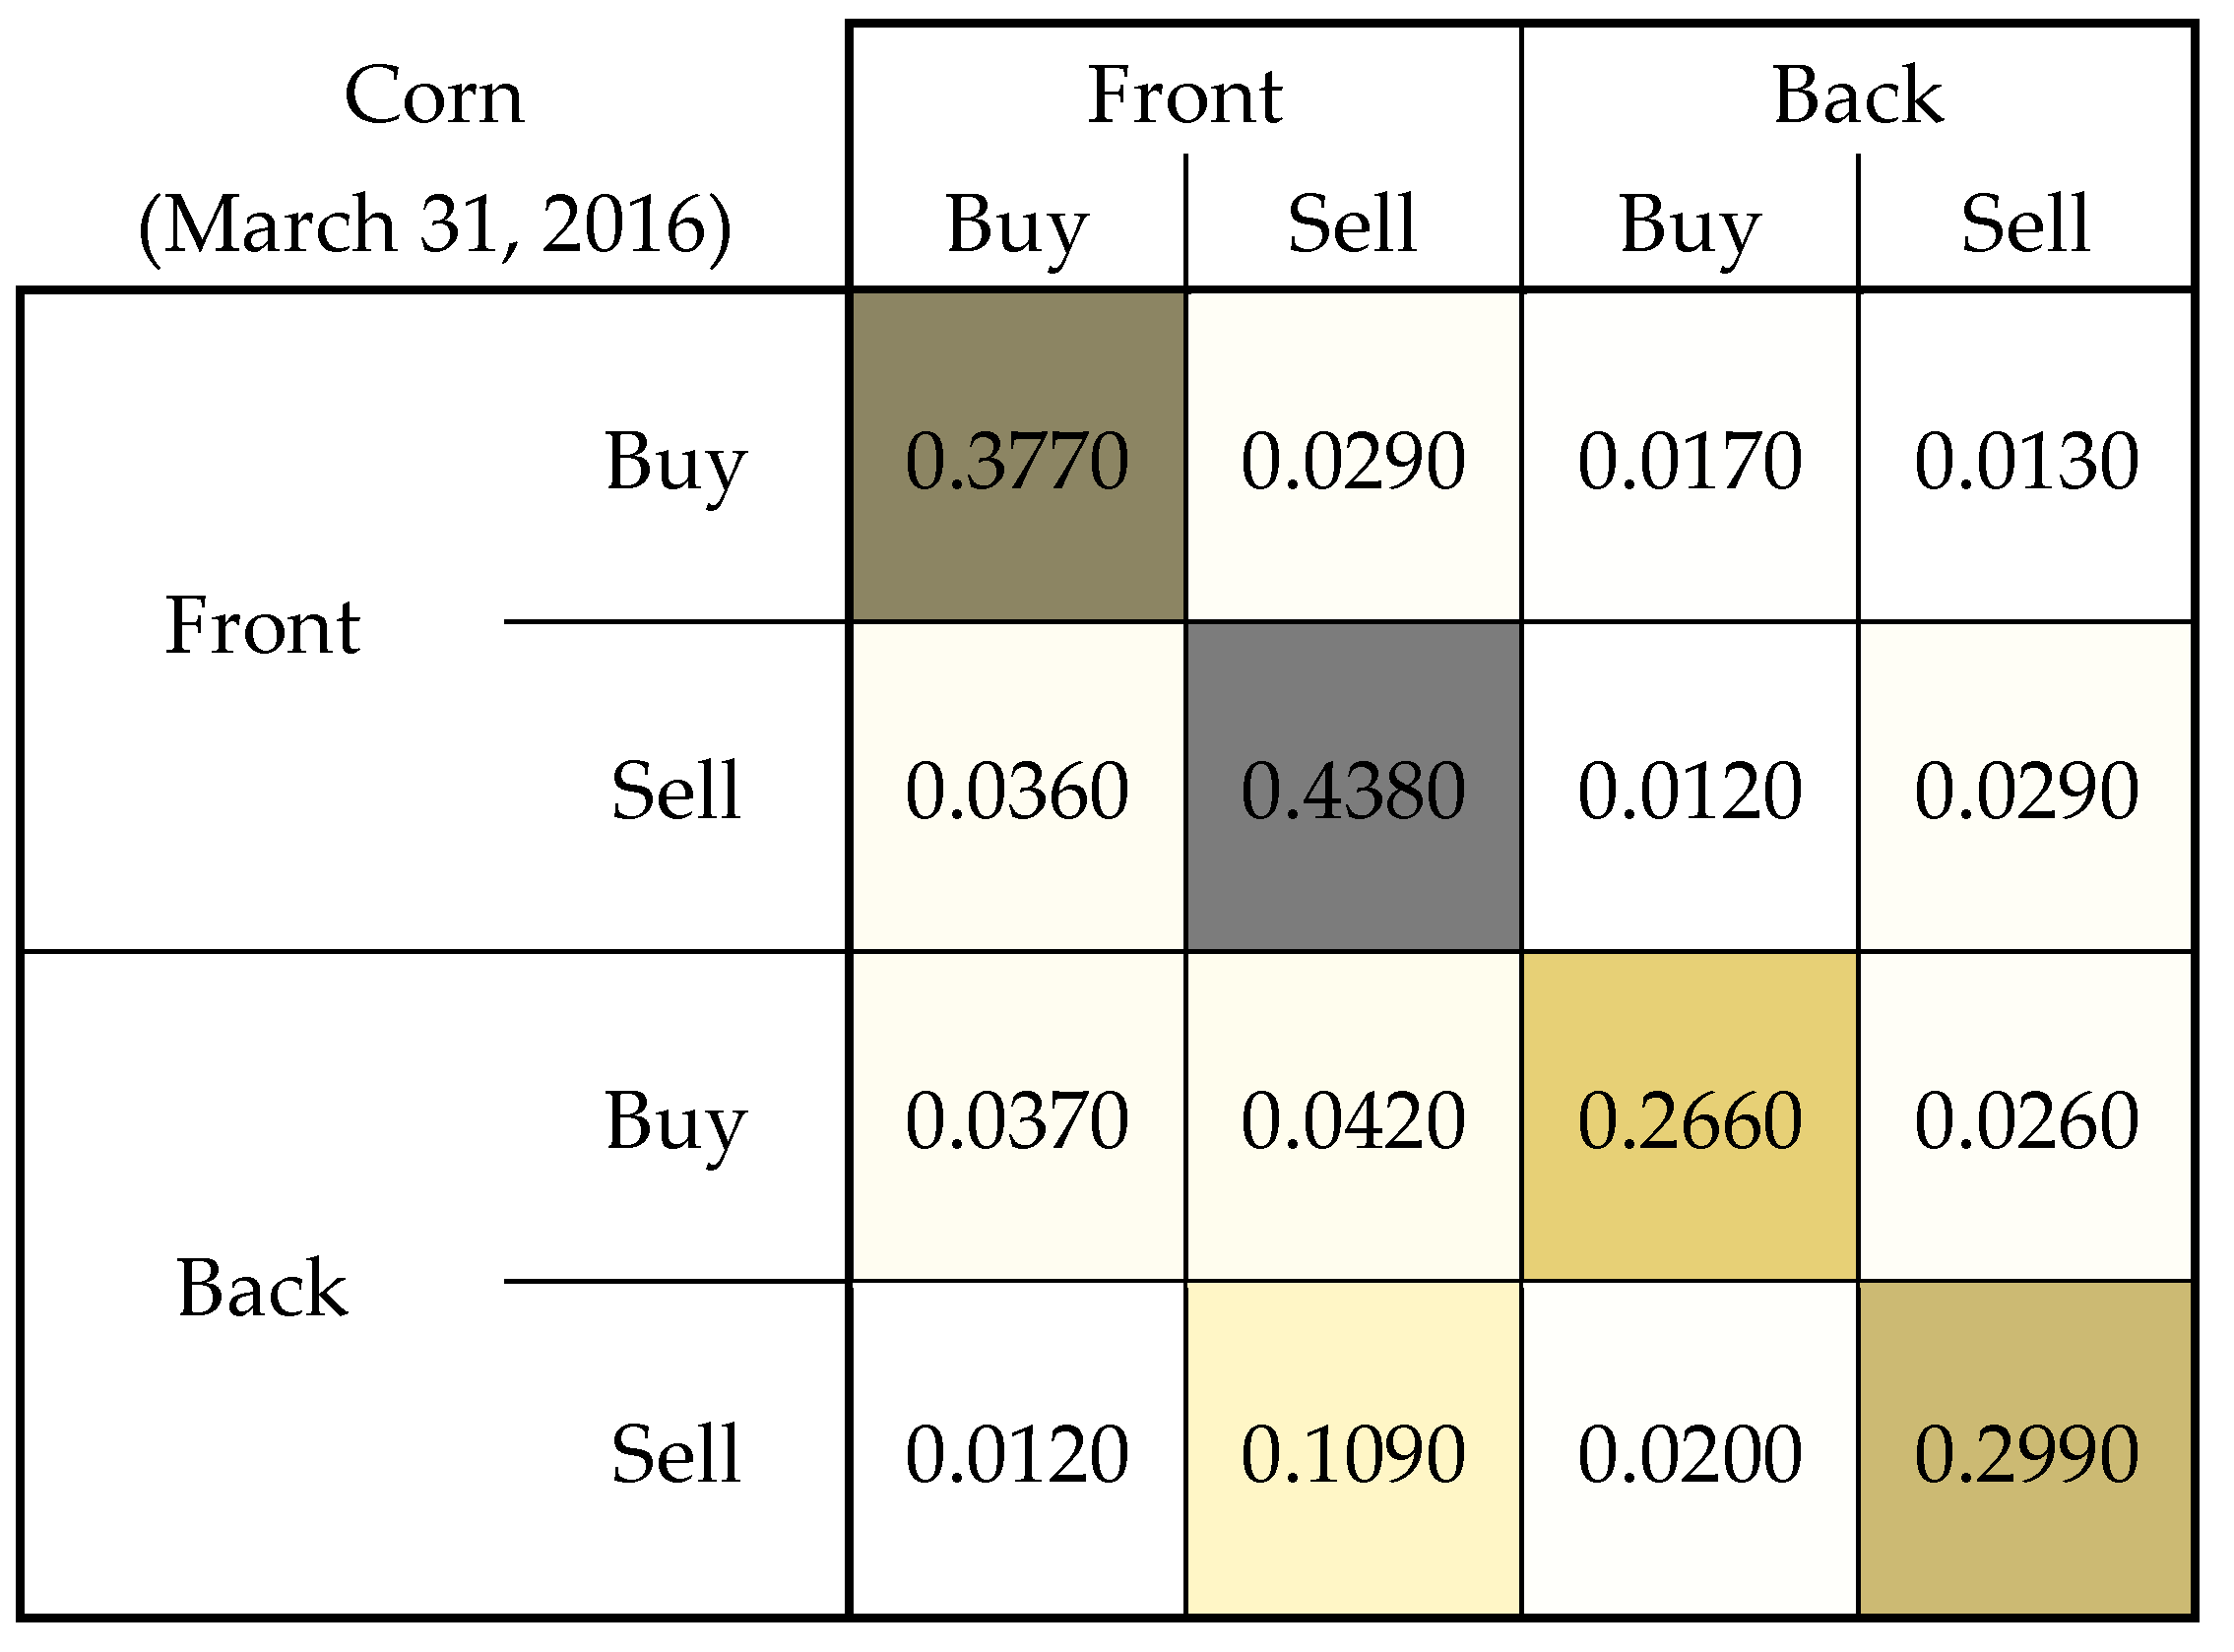
Figure 5.
Composition of the estimated intensity for corn and live cattle.
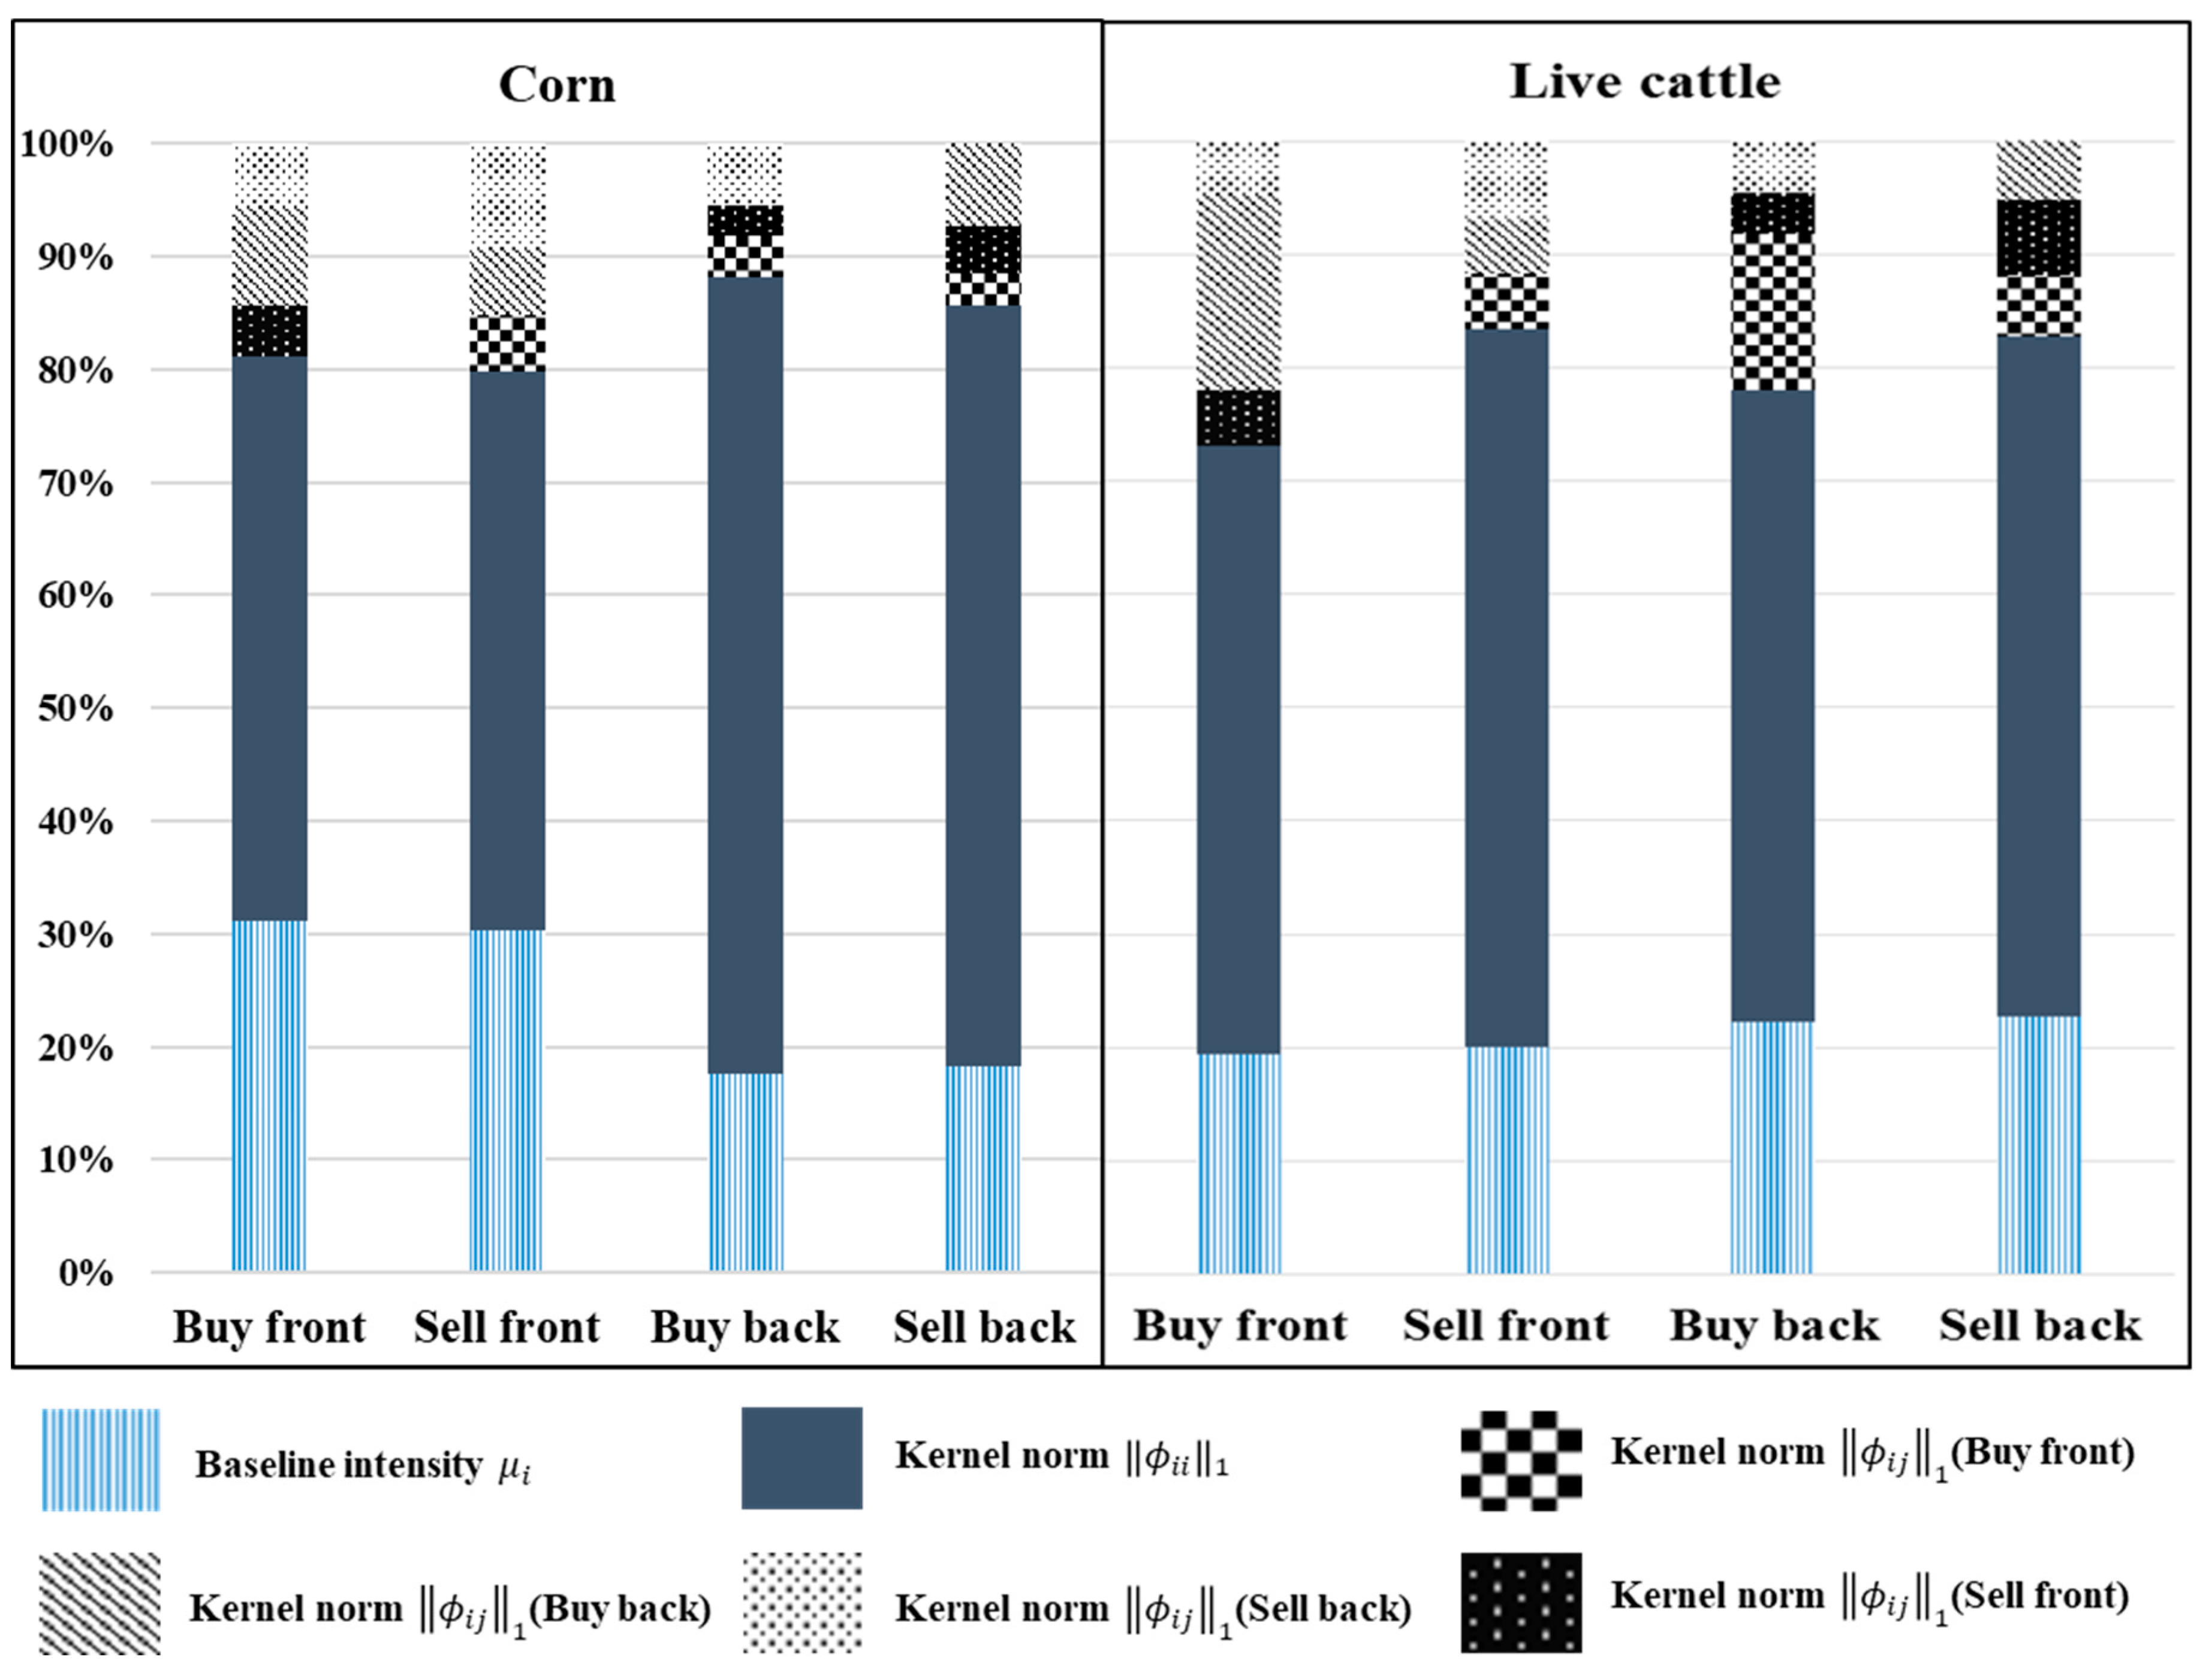
Table 1.
Descriptive statistics.
| Variable | Commodity | Corn | Wheat | ||||||
| Contract | Front | Back | Front | Back | |||||
| Type | Buy | Sell | Buy | Sell | Buy | Sell | Buy | Sell | |
| Number of Transactions | Total | 102,778 | 105,822 | 30,607 | 31,762 | 80,038 | 77,586 | 22,873 | 23,273 |
| Min. | 14 | 34 | 1 | 4 | 12 | 11 | 1 | 1 | |
| Mean | 194.655 | 200.420 | 58.078 | 60.155 | 145.524 | 141.065 | 41.815 | 42.469 | |
| Max. | 2127 | 2519 | 946 | 889 | 1237 | 1392 | 349 | 277 | |
| Std Dev | 177.603 | 191.665 | 67.799 | 66.629 | 129.876 | 127.539 | 37.675 | 36.888 | |
| CV | 1.096 | 1.046 | 0.857 | 0.903 | 1.120 | 1.106 | 1.110 | 1.151 | |
| Volume (number of contracts) | Min. | 149 | 110 | 4 | 12 | 50 | 84 | 8 | 4 |
| Mean | 1991 | 2083 | 402 | 434 | 781 | 763 | 180 | 175 | |
| Max. | 22,131 | 29,561 | 5926 | 7546 | 6771 | 6,206 | 2127 | 1468 | |
| Std Dev | 2009 | 2467 | 516 | 596 | 775 | 714 | 197 | 174 | |
| CV | 1.009 | 1.185 | 1.284 | 1.372 | 0.993 | 0.937 | 1.099 | 0.995 | |
| Mid-quotes (cents per bushel) | Min. | 348 | 352 | 446 | 453 | ||||
| Mean | 364 | 369 | 466 | 472 | |||||
| Max. | 373 | 377 | 479 | 486 | |||||
| Std Dev | 5.683 | 5.594 | 8.199 | 8.341 | |||||
| CV | 0.016 | 0.015 | 0.018 | 0.018 | |||||
| Variable | Commodity | Live Cattle | Lean Hog | ||||||
| Contract | Front | Back | Front | Back | |||||
| Type | Buy | Sell | Buy | Sell | Buy | Sell | Buy | Sell | |
| Number of Transactions | Total | 35,801 | 35,474 | 36,426 | 35,025 | 25,077 | 26,892 | 25,160 | 23,845 |
| Min. | 1 | 1 | 1 | 1 | 1 | 1 | 1 | 1 | |
| Mean | 70.061 | 69.285 | 71.424 | 68.811 | 49.364 | 52.833 | 49.237 | 46.755 | |
| Max. | 426 | 373 | 532 | 584 | 371 | 371 | 261 | 328 | |
| Std Dev | 52.744 | 50.727 | 52.819 | 54.116 | 44.705 | 43.991 | 36.408 | 34.376 | |
| CV | 1.328 | 1.366 | 1.352 | 1.272 | 1.104 | 1.201 | 1.352 | 1.360 | |
| Volume (number of contracts) | Min. | 2 | 2 | 2 | 2 | 0 | 0 | 0 | 0 |
| Mean | 248 | 249 | 237 | 232 | 171 | 179 | 152 | 142 | |
| Max. | 2532 | 1512 | 1962 | 2416 | 1586 | 1661 | 106 | 1343 | |
| Std Dev | 225 | 210 | 209 | 214 | 181 | 179 | 135 | 128 | |
| CV | 0.905 | 0.842 | 0.882 | 0.922 | 1.058 | 1.003 | 0.883 | 0.898 | |
| Mid-quotes (cents per pound) | Min. | 131 | 123 | 68 | 80 | ||||
| Mean | 137 | 127 | 70 | 82 | |||||
| Max. | 142 | 131 | 73 | 84 | |||||
| Std Dev | 2.553 | 2.131 | 0.937 | 1.040 | |||||
| CV | 0.019 | 0.017 | 0.013 | 0.013 | |||||
Table 2.
Estimated baseline intensities, average intensities, and exogeneity ratios.
| Contract | Front | Back | Front | Back | ||||
|---|---|---|---|---|---|---|---|---|
| Transaction | Buy | Sell | Buy | Sell | Buy | Sell | Buy | Sell |
| Commodity | Corn | Wheat | ||||||
| Baseline intensity | 0.194 | 0.193 | 0.061 | 0.062 | 0.15 | 0.149 | 0.046 | 0.048 |
| Average intensity | 0.327 | 0.337 | 0.097 | 0.101 | 0.25 | 0.241 | 0.071 | 0.072 |
| Exogeneity ratio | 0.636 | 0.629 | 0.663 | 0.67 | 0.654 | 0.657 | 0.704 | 0.726 |
| Commodity | Live cattle | Lean Hog | ||||||
| Baseline intensity | 0.077 | 0.078 | 0.083 | 0.081 | 0.058 | 0.063 | 0.061 | 0.059 |
| Average intensity | 0.119 | 0.117 | 0.121 | 0.117 | 0.085 | 0.09 | 0.085 | 0.08 |
| Exogeneity ratio | 0.701 | 0.699 | 0.714 | 0.733 | 0.743 | 0.741 | 0.76 | 0.772 |
| Commodity | Corn | Wheat | ||||||
| Baseline intensity | 0.194 | 0.193 | 0.061 | 0.062 | 0.150 | 0.149 | 0.046 | 0.048 |
| Average intensity | 0.327 | 0.337 | 0.097 | 0.101 | 0.250 | 0.241 | 0.071 | 0.072 |
| Exogeneity ratio | 0.636 | 0.629 | 0.663 | 0.670 | 0.654 | 0.657 | 0.704 | 0.726 |
| Commodity | Live cattle | Lean Hog | ||||||
| Baseline intensity | 0.077 | 0.078 | 0.083 | 0.081 | 0.058 | 0.063 | 0.061 | 0.059 |
| Average intensity | 0.119 | 0.117 | 0.121 | 0.117 | 0.085 | 0.090 | 0.085 | 0.080 |
| Exogeneity ratio | 0.701 | 0.699 | 0.714 | 0.733 | 0.743 | 0.741 | 0.760 | 0.772 |
Table 3.
Residual analyses.
| Contract | Front | Back | Front | Back | ||||
|---|---|---|---|---|---|---|---|---|
| Transaction | Buy | Sell | Buy | Sell | Buy | Sell | Buy | Sell |
| Commodity | Corn | Wheat | ||||||
| Kolmogorov–Smirnov | 0.84 | 0.84 | 0.88 | 0.89 | 0.87 | 0.83 | 0.89 | 0.89 |
| Ljung–Box | 0.64 | 0.67 | 0.94 | 0.92 | 0.78 | 0.80 | 0.94 | 0.94 |
| Commodity | Live cattle | Lean Hog | ||||||
| Kolmogorov–Smirnov | 0.91 | 0.87 | 0.91 | 0.88 | 0.93 | 0.93 | 0.91 | 0.90 |
| Ljung–Box | 0.92 | 0.91 | 0.91 | 0.91 | 0.94 | 0.93 | 0.93 | 0.93 |
© 2020 by the authors. Licensee MDPI, Basel, Switzerland. This article is an open access article distributed under the terms and conditions of the Creative Commons Attribution (CC BY) license (http://creativecommons.org/licenses/by/4.0/).
Share and Cite
MDPI and ACS Style
Volkenand, S.; Filler, G.; Odening, M. Price Discovery and Market Reflexivity in Agricultural Futures Contracts with Different Maturities. Risks 2020, 8, 75. https://doi.org/10.3390/risks8030075
AMA Style
Volkenand S, Filler G, Odening M. Price Discovery and Market Reflexivity in Agricultural Futures Contracts with Different Maturities. Risks. 2020; 8(3):75. https://doi.org/10.3390/risks8030075
Chicago/Turabian StyleVolkenand, Steffen, Günther Filler, and Martin Odening. 2020. "Price Discovery and Market Reflexivity in Agricultural Futures Contracts with Different Maturities" Risks 8, no. 3: 75. https://doi.org/10.3390/risks8030075
Note that from the first issue of 2016, this journal uses article numbers instead of page numbers. See further details here.