Neural Network Pricing of American Put Options


1
ISEG, Universidade de Lisboa, Rua do Quelhas 6, 1200-078 Lisbon, Portugal
2
CEMAPRE/REM Research Center, Rua do Quelhas 6, 1200-078 Lisbon, Portugal
*
Author to whom correspondence should be addressed.
Risks 2020, 8(3), 73; https://doi.org/10.3390/risks8030073
Submission received: 31 March 2020
/
Revised: 3 June 2020
/
Accepted: 24 June 2020
/
Published: 2 July 2020
(This article belongs to the Special Issue Machine Learning in Finance, Insurance and Risk Management)
Abstract
:In this study, we use Neural Networks (NNs) to price American put options. We propose two NN models—a simple one and a more complex one—and we discuss the performance of two NN models with the Least-Squares Monte Carlo (LSM) method. This study relies on American put option market prices, for four large U.S. companies—Procter and Gamble Company (PG), Coca-Cola Company (KO), General Motors (GM), and Bank of America Corp (BAC). Our dataset is composed of all options traded within the period December 2018 until March 2019. Although on average, both NN models perform better than LSM, the simpler model (NN Model 1) performs quite close to LSM. Moreover, the second NN model substantially outperforms the other models, having an RMSE ca. 40% lower than the presented by LSM. The lower RMSE is consistent across all companies, strike levels, and maturities. In summary, all methods present a good accuracy; however, after calibration, NNs produce better results in terms of both execution time and Root Mean Squared Error (RMSE).
JEL Classification:
C45; C63; G13; G171. Introduction
This study compares two different methods to price American put options. While call options give the right to its holder to buy the underlying asset at a pre-defined price, the strike value, put options give the right to sell it. European style options can only be exercised at a pre-defined fixed date, the maturity. American style options, instead, can be exercised at any moment until maturity, leading to an optimal stopping time problem.
The case of American put options is particularly hard to solve, and there are no closed-form solutions.
This problem was first studied by Brennan and Schwartz (1977), and it has been recurrent in the literature ever since. Important references on this matter are Bunch and Johnson (2000); Carr et al. (1992); Chen et al. (2008); Cremers and Weinbaum (2010); Geske and Johnson (1984); Kim (1990); Kuske and Keller (1998); Parkinson (1977); Rogers (2002); Sullivan (2000); Zhu (2006), for instance. For a recent overview of different approximation methods to price American put options, see Zhao (2018).
Here, we focus on the comparison of two methods: the least-squares Monte Carlo method, a simulation method first presented by Longstaff and Schwartz (2001), and a machine learning method, Neural Networks (NNs).
Most studies on NN explore mainly European style options. That is the case of Hutchinson et al. (1994), the first article where NNs were trained to price options, but also of Bennell and Sutcliffe (2004); Garcia and Gençay (2000); Gradojevic et al. (2009); Yao et al. (2000); Liu et al. (2019). A very recent exception is Jang and Lee (2019), which looked into market prices of S&P 100 American put options.
This study is, thus, one of the first to use NNs to address the American put option problem, using real observed market data. As opposed to Jang and Lee (2019), here, we look at options on individual stocks. It is also based on a larger real market dataset, when compared to other NN studies, which either use less market data or rely on simulated data.
The rest of the text is organized as follows. Section 2 presents a brief literature overview. Section 3 explains the two methodological approaches used, with particular emphasis on the NN architecture and logic. Section 4 explains the data selection process and its descriptive statistics and specifies both methods’ implementation details. Section 5 presents and discusses the results. Finally, Section 6 concludes and suggests further developments.
2. Literature Overview
The pricing of American style options is a classical problem in financial mathematics. This type of problem is associated with a moving boundary that is related to the optimal time to exercise the option. Various approaches have been proposed and developed for the valuation problem of American options. Methods based on solving partial differential equations include finite differences schemes as introduced by Brennan and Schwartz (1977) and the finite element method as presented by Allegretto et al. (2001).
In the class of simulation and tree approaches, the most popular techniques include the binomial and trinomial tree methods and the Least-Squares Monte Carlo (LSM) method proposed in Longstaff and Schwartz (2001).
Zhao (2018) studied the pricing of put and call options by comparing eight different valuation methods on a one-dimensional scale. He compared numerical methods as the binomial and trinomial tree methods and the explicit and implicit finite difference and concluded that the binomial method had the best overall performance in terms of both time and accuracy. In the simulation methods class, he analyzed the simulated tree from Broadie et al. (1997), the bundling technique from Tilley (1993), and the LSM method, with LSM showing the best results also in terms of both accuracy and execution time.
The fundamental idea of the LSM approach is that the optimal exercise strategy is obtained by the conditional expectation of the payoff from maintaining the option alive. This conditional expectation is estimated using the cross-sectional information in the simulated paths by use of least squares, allowing accurately valuing American options by simulation. It should be noted that simulation methods tend to be more attractive when compared to other numerical schemes when the complexity of the option grows or the number of the underlying assets increases.
The consistency and convergence rates of the LSM were investigated by Clément et al. (2002). Variations of the original regression techniques have also been explored. Examples are nonparametric least squares regression estimates as in Egloff (2005) and Egloff et al. (2007), the smoothing spline regression estimates of Kohler (2008), or the recursive kernel regression estimates by Barty et al. (2008). In Kohler et al. (2010), the authors presented a further modification of the LSM algorithm using neural networks instead of regressions, proving the convergence of the proposed algorithm and applying it to pricing American put options written on several underlyings, using simulated data under Black–Scholes assumptions and the Heston model.
Artificial Neural Networks (NN) were firstly mathematically formalized in McCulloch and Pitts (1943) as a biologically-inspired programming paradigm that enables a computer to learn from observable data. The introduction of the error backpropagation learning algorithm by Rumelhart et al. (1985) has since contributed to the increase in popularity of NNs in many research fields. NNs and deep learning currently provide the most efficient solution to many problems in image recognition, speech recognition, or natural language processing. They have also been applied to predict and/or classify economic and financial variables such as the gross domestic product as in Tkacz (2001), the unemployment rate in Moshiri and Brown (2004), inflation in Choudhary and Haider (2012), exchange rates in Pacelli et al. (2011), or even to predict financial crashes as in Rotundo (2004).
In particular, for pricing financial derivatives, many studies have been pointing to the advantages of using NN as the main or complementary tool. For instance, Hutchinson et al. (1994) proposed the use of learning networks for estimating the price of European options and argued that learning networks are able to recover the Black–Scholes formula using a two year training set of daily options prices and that the resulting network could be used to obtain prices and successfully delta-hedge options out-of-sample. Garcia and Gençay (2000) estimated a generalized option pricing formula that has a functional format similar to the Black–Scholes formula through a feedforward NN model and obtained small delta-hedging errors relative to the hedging performance of the Black–Scholes model. Yao et al. (2000) used backpropagation NN to forecast option prices of Nikkei 225 index futures and showed that for volatile markets, an NN option pricing model can outperform the traditional Black–Scholes model. However, they pointed out that the Black–Scholes model is still adequate for pricing at-the-money options and suggested to partition the data according to moneyness when applying neural networks. In Bennell and Sutcliffe (2004), a comparison between the performance of Black–Scholes with an NN was carried out for pricing European call options on the FTSE 100 index, and they concluded that for out-of-the-money options, the NN is clearly superior to Black–Scholes and comparable for other cases excluding the deep in-the-money and long maturity options. Gradojevic et al. (2009) proposed a Modular Neural Network (MNN) model to obtain prices for S&P-500 European call options. The modules based on moneyness and time to maturity of the options improve the out-of-sample performance when compared with standard feedforward neural network option pricing models.
While most studies on NN, dealing with real observed market data, focus on European options, the empirical study of Jang and Lee (2019) targeted S&P 100 American put options prices and also pointed out the better performance of NNs when compared with the classical financial option models.
Recently, Becker et al. (2019) showed how NN can be used to provide estimates for the optimal value for other stopping time problems, such as the pricing of Bermudan max-call and callable multi barrier reverse convertible options and the problem of optimally stopping a fractional Brownian motion, providing an alternative for simulation methods for high-dimensional problems. Becker et al. (2019) focused on high dimensionality American and Bermudan options.
In this study, we consider the one-dimensional American put pricing case and compare the classical LSM method, as proposed in Longstaff and Schwartz (2001), as the idea is to compare the “best” of the pure simulation methods (according to the comparative study of Zhao 2018) with the more recent approach of using pure NN and deep learning methods. An advantage of the latter is the fact that it is a model free, real market data-driven approach.
3. Methodology
3.1. Least-Squares Monte Carlo Method
The LSM implementation can be understood as a three step procedure:
- First, a model must be chosen, and using standard Monte Carlo techniques, a large number of paths for the underlying risky asset are simulated.Here, we assume stock prices S follow a geometrical Brownian motion (GBM) whose dynamics, under the risk neutral measure, are given by:where is a Wiener process, r is the risk-free interest rate, and q and are the associated stock dividend yield and volatility, respectively.
- Second, a backward induction process is conducted in which a value is recursively assigned to each state at every time step. At each point of the option cash-flow matrix, the exercise value is known, but the continuation value needs to be estimated. LSM uses regressions, considering the in-the-money states of the option cash-flow matrix at each time step and measurable functions of underlyings at the same time step and state, to estimate the continuation value of the option. In this study, we consider a five degree polynomial, so the continuation function is estimated as:where Y is the continuation value, X is the simulation stock value, and the residual error.
- Finally, when all states are valued for every time step, we calculate the value of the option by passing through all the time steps and states and by making an optimal decision on option exercise at every step for a particular price path and the value of the payoff that would result.
The LSM approach is easily implemented, but it depends on the chosen model (model risk), on the approximation method for the continuation value, and on the simulation decisions such as the number of paths, step size, etc.
In terms of underlying models, one could have considered alternative models, such as jump processes and processes with stochastic volatility, among many others. Here, we opted for the simplest possible model, GBM, but we did consider Bloomberg’s implied volatility to value each different option, so, to some extent, we include volatility smiles in the standard GBM model. For each simulation, we used a total of 1000 paths and 50 time steps.
3.2. Neural Networks
Haykin (1994) defined an NN as a “massively parallel distributed processor made up of simple processing units that has a natural propensity for storing experiential knowledge and making it available for use”.
The best part about considering an NN approach is that one does not need to assume any underlying pattern for the data. That is, NNs are a model-free purely data-driven approach. Patterns are captured using an almost exhaustive search. The provided data are regular enough (e.g., no infinite variance). The only assumption one needs to consider is on the ability of the NN to approximate the output function. As we discuss below, these are extremely mild assumptions due to the existence of the universal approximation theorem.
For our pricing of American put options, we collected market data on put prices (output), but also on the same inputs the model in Equation (1) requires: price of the underlying asset, volatility, interest rate, dividend yield, options’ strike price, and maturity. As we will see in Section 4.4, in our simplest NN, some of these inputs will not even be considered.
We consider an NN with a feedforward architecture as represented in Figure 1. Although different architectures can be considered, for tackling the problem of option pricing, the feedforward dynamic is the most widely used. Examples of this include Tang and Fishwick (1993), Hutchinson et al. (1994), Yao et al. (2000), and Garcia and Gençay (2000).
For exposition simplicity, we briefly present the dynamics of a feedforward NN with just one hidden layer, as represented in Figure 1. The architecture’s logic allows for more than one hidden layer, which would add more connections and weights between the hidden layers only. In our options pricing application, we use both a model with just one hidden layer and another with several.
A feedforward NN can be summarized as follows:
- The first layer, ( to ), represents the input layer, where d is the number of input variables. The second layer is the hidden layer, ( to ), where k is the number of nodes. Finally, f represents the output variable. The nodes in the same layer are not connected to each other, but each node is connected to each node from the neighboring layer. This connection is given by the weighted sum of the values of the previous nodes.
- Starting with the connection between the input layer and the hidden layer, let represent an input node and the node from the hidden layer, then each hidden node is obtained as:where is the number of input variables, is the weight of the input layer i with respect to the hidden node k, is the bias node, and is an activation function.
- As in the hidden layer, the output node also depends on an activation function, with the weighted sum of the hidden nodes as the argument. Once we have a value for each , the output of the function is given by:where f is the output value, is the number of nodes in the hidden layer, is the weight of the node , b is the bias, and is also an activation function.
The bias node is an extra node added to each layer (except the output layer). It is an extra argument to the activation function and acts as the independent term in a regression model (i.e., as a scaler). While the nodes are connected with the input layer through the weights, the bias node is not connected to the input layer. The argument of the activation function depends on the input nodes and the respective weights and is then used to complete the connection from the input nodes to each hidden node. It is the activation function that scales the argument to a different range, introducing non-linearity and making the model susceptible to non-linear combinations between the input variables.
The universal approximation theorem states that, under mild assumptions on the activation function, a feedforward network with one hidden layer and a finite number of neurons is able to approximate continuous functions on compact subsets of . Intuitively, this theorem states that, when given appropriate parameters, a simple NN can represent a wide variety of functions. One of the first versions of the theorem was proven by Cybenko (1989), for sigmoid activation functions. Leshno et al. (1993) later showed that the class of deep neural networks is a universal approximator if and only if the activation function is not polynomial, although for an NN with a single hidden layer, the width of such networks would need to be exponentially large. Hornik et al. (1989) showed that the multilayer feedforward architecture gives NNs the potential of being universal approximators and that this property is not obtained from the specific choice of the activation function, but on the multilayer feedforward architecture itself, which gives NNs the potential of being universal approximators. The usage of NNs as approximators for complex and multidimensional problems was reinforced by Barron (1993) with the result regarding the accuracy of the approximation of functions, which implies that the number of elements of an NN does not have to increase exponentially with the space dimension to maintain errors at a low level.
Besides the classical sigmoid function, , which can be seen on the left of Figure 2, several other activation functions have been considered in the literature. Krizhevsky et al. (2012) empirically compared the sigmoid function to a nonlinear function called Rectified Linear Units (ReLU), concluding that it consistently improves the NN training, decreasing its error. Lu et al. (2017) showed that an NN of width with ReLU activation functions is able to approximate any Lebesgue integrable function on an n-dimensional input space with respect to the distance, if the network depth is allowed to grow. Hanin and Sellke (2017) showed that an NN width n+1 would suffice to approximate any continuous function of n-dimensional input variables.
Xu et al. (2015) investigated the use of variants of ReLU, such as leaky ReLU. Although the authors recognized the need for rigorous theoretical treatment of their empirical results, they showed that leaky ReLU seems to work consistently better than the original ReLU.
The general equation for both classical ReLUs and leaky ReLU is given by:
The classical ReLU and an instance of a leaky ReLU are also represented on the right of Figure 2.
Following the most recent literature, in our option pricing NN, we opted for leaky ReLU (with ), instead of the traditional sigmoid function or standard ReLU, which has the advantage of avoiding zero gradients.
We note that the universal approximation theorem states that, given appropriate parameters, we can represent a wide variety of interesting functions using simple NN, but it does not touch upon the algorithmic learnability of those parameters. The most common learning procedure was introduced by Rumelhart et al. (1985) and is known as backpropagation. Under this setting, the weights of the nodes are iteratively adjusted in order to minimize the so-called cost function.
The cost function rates how good the NN does in the whole set of observations. Taking the Mean Squared Error (MSE) as an example of a cost function, we get:
where n is the number of observations, is the NN output value, for the set of parameters, and is the real observed market values.
Backpropagation adjusts the connection weights to correct for each error found.The error amount is effectively split among the connections. Technically, backpropagation computes the gradient of the cost function at a given state with respect to the weights. The weight updates are commonly done using Gradient Descent (GD),
where t is the iteration step we refer to, is the learning rate, and the gradient of the cost function. The choice of should be made carefully as values near one could cause the algorithm to be unstable and oscillate, resulting in missing a global/local minimum in one iteration, whereas values near zero can converge to a non-optimal solution and also slow the convergence to a solution. See LeCun et al. (2012) for an overview of learning rate issues.
The backpropagation learning algorithm:
- Starts with random or pre-selected weights at .
- Then, for each observation, weights are updated at step t according to:where the cost function gradients, , , can easily be obtained applying the chain rule:where and stand for the input and output of each NN node, respectively.
- Following this logic for every observation, the total error should decrease for each additional iteration step.
Stochastic Gradient Descent (SGD) was proposed by Bottou (2010) to deal with large-scale problems. In SGD, instead of updating the parameters after iterating once through the full training set, i.e., after one epoch, we update the weights after randomly choosing one observation. It is expected that the gradient based on the single observation is an approximation of the expected gradient of the training set. In our option application, we use a variation of the SGD, where instead of updating the weights after each observation, we set a size for a subset called the batch size and update the parameters for each randomly chosen subset of that size, within the same epoch. This process accelerates the computation time, prevents numerical instability, and is more efficient to use in large datasets, as shown in LeCun et al. (2012) and Bottou (2010). Therefore, when calibrating an NN, one needs to set the number of epochs (iterations) and the batch (random subsets) size that conditions the number of parameter updates per epoch.
Finally, in machine learning methods, it is common to use data scaled to a specific range (zero to one for example) in order to increase the accuracy of the models and allowing the loss function to find a global, or local, minimum. The transformation we use is given by:
where is the value to normalize and and are, respectively, the minimum and maximum values of the range. This transformation is also done due to the fact that the input variables have different scales. Output variables may be scaled or not, as they have a unique scale.
The learning algorithm from the multilayer perceptron could be affected by the different scales of the variables, and the loss function can fail to converge to the local, or global, minimum. This area is currently an area of research in machine learning. The problem with finding a local or global minimum was first presented by Rumelhart et al. (1985), where the authors concluded that although the learning algorithm finds a solution in almost every practical try, it does not guarantee that a solution can be found. In terms of the global minimum, Choromanska et al. (2015) focused their study on the loss function non-convexity, which leads the learning algorithms to find a local minimum instead of a global minimum. The authors showed that, although there is a lack of theoretical support for optimization algorithms in NN, the global minimum is not relevant in practice because it may lead to overfitting the model.
4. Data
4.1. Description, Treatment, and Statistics
We used Bloomberg’s collected data on 37,952 American put options, traded from December 2018 to March 2019. The individual stocks under analysis were Bank of America Corp (BAC), Procter and Gamble Company (PG), General Motors (GM), and Coca-Cola Company (KO), selected because of their high market capitalization and their large options trading volume.
For each option, besides daily close prices on the option itself, we collected underlying stock prices, strike prices, maturities, volumes, and implied volatilities1. We also retrieved the quarterly dividend paid per share from each company throughout the studied period. In terms of the risk-free interest rate, the U.S. Treasury rate for different maturities was used. For each option, we selected the rate with the closest maturity to that option2.
We applied a liquidity filter—a minimum amount of 20 trades per trading day—to ensure our analysis was based on reliable data. Furthermore, due to Bloomberg gathering information on trades during the last day of trading of an option, some trades presented zero maturity, so we had to remove those observations. Finally, we eliminated all missing values.
From the original 37,952 observations, we ended up with 21,111, which was still a much larger number than what could be found in the literature. Compare, for instance, with Kelly and Shorish (1994), Yao et al. (2000), or Kohler et al. (2010), who used 1369, 17,790, and 2000, respectively.
Table 1 presents the basic statistics of our sample input variables, Figure 3 is the associated histograms and Figure 4 the box plots.
Besides implied volatility, which varied mostly across the four different underlying companies, the variables that most impacted the output variable (put prices) were moneyness and maturity. Figure 5 represents the put price histogram and a moneyness versus maturity heat graph on put prices. In terms of the interest rate, there were no big variations in the term structure throughout the three months under consideration. In addition, the short end of the term structure was quasi-flat.
We considered as At-The-Money (ATM) those options with a five percent deviation from the current stock price. In put options, an option was In-The-Money (ITM) if the stock price was below the strike price, which meant that the moneyness, defined before as stock price divided by strike price, was below one. Therefore, below the threshold were the ITM options, and above the threshold were the Out-of-The-Money (OTM) options.
Table 2 shows the percentage of each category for each underlying company.
From Figure 3, we can also see that the moneyness distribution was heavily centered around one, with some extreme values in OTM options, and that, as expected, our maturity was heavily skewed and almost fully concentrated in maturities below one year (less than 365 days). Table 2 emphasizes that only 16% of the options in our sample were ITM and only about 18% had maturities larger than six months. Although both moneyness and maturity “biases” were expectable as short-term maturities and ATM/OTM are, by far, the most traded options in the market, this is an issue that may influence the NN models’ precision, when learning about ITM and/or larger maturity options.
Descriptive statistics per company can also be found in Table 3. Each underlying company has different characteristics, which positively impacts the machine learning process.
4.2. Training and Test Datasets
In order to train/develop and then test our NN models, we needed to have our data divided into a training dataset and a test dataset. The training dataset is a set of examples used to train the learning process parameters (weights, etc.) and to fine-tune (calibrate) the model. The test dataset is a dataset used to provide an unbiased evaluation of final model fit to the training dataset. As is common in machine learning techniques, here the division of both datasets was made randomly, with the training set consisting of 80% of the full dataset. It was, thus, over the remaining 20%—still more than 4000 options—that we tested the performance of both our NN models and the LSM method.
Using Kolmogorov–Smirnov tests, one can check if the distributions of the test and training sets are similar, feature-by-feature. Here, with the random sample selection, there was an assurance of similar distributions, as confirmed in Table 4 and Figure 6. If we were to use our NN models in other samples, checking that the training set used to train a particular NN model and the test set we wanted to apply the model to were in fact representative of the same reality seemed good practice.
4.3. LSM Specification
As mentioned in the Methodology Section, we considered the underlying stock to follow a GBM as in Equation (1). Although the equation variables r (interest rate), q (dividend yield), and (volatility) were assumed constant, it is important to recall that, in our test set, each option had a different set of parameters.
Besides the four different underlying stocks, we also had different trading dates t, with different initial stock values, dividend yields, different option maturities T, and interest rate observations that depended both on the trading date date t and maturity T. Finally, we also opted to use Bloomberg implied volatilities for , and the implied volatilities were option specific. In practical terms, this meant that for the case of each option of our test set—4222 options—we had to simulate both the underlying asset and to use LSM on each step of the cash-flow option matrix (as explained in Section 3.1) to obtain the output—its put price. For each simulation, we used a total of 1000 paths and 50 time steps.
By simulating the underlyings using option specific details, we improved over the standard GBM model, as we also took into account market data, in particular the existence and evolution of interest rates’ term structure and volatility smiles, over the test sample period.
4.4. NN Models’ Calibration
In order to minimize the error of an NN model, we needed to calibrate it within the training dataset. We used some beforehand-made decisions and also optimized parameters.
For both of our NN models, in order to start the learning process, we gave random weights, from the normal distribution with mean equal to zero and standard deviation equal to , to the hidden nodes. The starting values of the hidden nodes were a random choice and immediately changed after the first learning cycle ended. In both cases, we also considered a learning rate with decay per epoch of 1 × 10. The learning rate defined the number of the corrective steps that the algorithm took to adjust for errors obtained for each observation and led to a trade-off: a higher learning rate reduced the training time, at the cost of lower accuracy, while a lower learning rate took longer, but was more accurate.
For our NN Model 1, we opted to consider an NN as simple as possible with only one hidden layer, and a minimal number of inputs. In particular, given the small changes in the dividend yield and interest rates, we did not even consider them as inputs.
In our NN Model 2, we considered an increased number of inputs, adding to all the regular option inputs, also dummy variables per company and the average (training set) put price per company. The dummy variable takes only zero or one as values.The introduction of such variables is an alternative to training a different NN, for each company. The average put price per company works as an anchor, making the learning process faster.In terms of hidden layers, we compared NNs with 2, 3, and 4 layers and opted for 3 layers as the best performing model.
All other parameters were optimized, i.e., the alternatives were compared through a cross-validation test, where we looked at the training dataset MSE as the comparison metric:
where is the error of each prediction, with representing the prediction of the model and the true value of the option.
In NN Model 1 and for the number of nodes for our one hidden layer, we tested for three to 10 nodes. When comparing the values (see Figure 7), we noted that 7, 8, and 9 nodes were the ones with the lowest variance in MSE and also the lowest mean values. Therefore, for NN Model 1, we, thus, opted for nine hidden nodes in our one hidden layer. Likewise, for NN Model 2, we also optimized the number of nodes for the chosen three layers, considering for each layer between three and 20 nodes. The optimization was performed simultaneously over the three layers. Considering all combinations, the best performing solution was 16 nodes for Layer 1, 8 for Layer 2, and 4 for Layer 3.
After testing the three activation functions previously mentioned—sigmoid, ReLU, and leaky ReLU—a leaky ReLU with performed better in both models. Recall Figure 2.
An epoch is defined as the complete dataset training cycle. In terms of the updating sample size, commonly referred to as batch size, we assumed a batch size equal to 64. For our NN Model 1, we used 400 epochs, while for NN Model 2, we used 3000.
Finally, while in NN Model 1, we scaled both the input and output variables, in NN Model 2, we did not normalize the output variable. For this reason, the MSE values in Figure 8 have different ranges.
Once we decided the NN models’ architecture and optimized its parameters—in Table 5—the final step was the weight learning process (as described in Section 3.2), also known as network fitting.
In terms of learning curves for our NN models, in Figure 8, we can see the MSE curve from NN Model 1 going very fast to 0.001. NN Model 2 also seemed to decrease very fast, but if we take a better look at Figure 9, we see that there was still space for improvement. Notable also is the high variance when converging to the local optimum.
We can also observe that for NN Model 1, the learning curve for the validation set is below the learning curve for the training set, which can indicate that Model 1 is too simple to reproduce the pricing dynamics, as it presents signs of an under-fitted model. On the contrary, we observe a different behavior for NN Model 2 as we included more layers and variables to reflect the non-linearity and complexity of the relationships between input and output variables.
5. Results
In this section, we compare our NN models’ results with those of the LSM method, using the RMSE as the comparison measure for error, as well as the execution time for the comparison of the time spent by each method to price the options.
The methods were applied using the programming language Python Version 3.7.3 and run on a Macbook Pro 14.1 (MacOS Version 10.14.6) with an Intel Core i5 2.3 GHz processor with a memory of 2133 MHz and 8 GB of RAM.
The fitting of our NN models to the training set took about 2 and 5 min, for NN Model 1 and NN Model 2, respectively, due to the usage of TensorFlow and Keras3 Python modules, which substantially decreased the fitting time. NN Model 1 was faster than NN Model 2, because of its simpler architecture and fewer number of input variables.
LSM took about 0.38 s to price one option alone. Once fitted, the NN models’ pricing of an option was immediate. Even if we took the total fitting time into account, dividing it by the number of options in the test set, we got 0.07 s per option for NN Model 2, less than 20% of the time when compared to LSM, and 0.03 s for NN Model 1.
To compare the model results, we used RMSE, given by , with the MSE as previously defined in Equation (11), but now considered only over the test dataset.
Table 6 presents the RSME results. The RSME can be interpreted as the average USD ($) deviation from the true option value. Overall NN Model 2 was the best performing model, presenting total average deviations of per option, while for NN Model 1, the average deviation was , and for LSM, it was . This meant that overall, for our randomly selected test dataset, on average, NN models outperformed LSM, considered in the literature as one of the most accurate methods to price American options.
Procter & Gamble was the company with the highest deviations, no matter the model. This is probably due to the fact that its underlying was the one with the highest spot values (recall Table 3). Comparing across models, NN Model 2 was the one where this effect was less obvious.
These were, of course, just general results. Below, we analyze the performance of each model—both in absolute and relative RMSE terms—per moneyness and maturity classes.
Table 7 presents results per company and for different moneyness and maturity. Figure 10 illustrates the same results. Since these were absolute results, i.e., values in USD ($), naturally, the most expensive ITM options tended to present higher deviations than ATM or OTM options. See Figure 10a. This bias—or “smirk”—is present on the graphs of the four companies. More importantly, at all instances, our NN Model 2 (orange line) had the lowest errors. When comparing our naive NN Model 1 (blue line) and LSM (grey line), the evidence was mixed. For the underlyings GM and KO, our NN Model did better than LSM, no matter the moneyness class. When BAC stock was the underlying, LSM showed less errors than NN Model 1, with error levels above, but close to NN Model 2. Finally, for the PG stock, LSM and NN Model 1 showed very close results to one another, with NN Model 1 performing slightly better for ITM options and LSM slightly better for ATM and OTM options.
In terms of maturities, the longer the maturity, the more expensive is the option. This expected bias in model performance was evident for NN Model 1 and LSM, but interestingly enough not for NN Model 2, which tended to present a quasi-flat absolute error term structure. See Figure 10b. As before, our NN Model 2 performed better than the other two models for all maturities and companies, performing fantastically well in the case of options with maturities larger than six months.
When dealing with a variety of options with various prices, relative RMSE gave us the average error in percentage of option prices. Figure 11 and Table 8 present the relative results, presenting RMSE as the percentage of put prices.
The overall message was the same as with the absolute results: NN Model 2 was the best model, and our naive NN Model 1 performed close to LSM, beating it in some instances.
The ranges of relative errors of NN Model 2 were the smallest in all categories of moneyness and maturity. OTM had the highest percentual errors for all models. We must, however, remember these are relatively inexpensive options. Still, for the underlyings under consideration, NN Model 2 errors for OTM ranged from 9.53% to 15.95%, while for NN Model 1, they ranged from 23.32% to 38.60% and for LSM from 19.66% to 44.14%. to be relatively inexpensive options. Still, for the underlyings under consideration, NN Model 2 errors for OTM ranged from 9.53% to 15.95%, while for NN Model 1, they ranged from 23.32% to 38.60% and for LSM from 19.66% to 44.14%. ITM options were the ones presenting smaller ranges of relative errors, in between 4.93% and 9.45%, depending on the model and/or company under analysis.
The “winning” model—NN Model 2—presented errors as a percentage of options prices considerably lower than the alternative models, around: 5% for ITM, 10% for ATM, 12% for OTM, 20% for less than on month, 12% for between 1 month and 6 months, and 6% higher than 6 month maturity.
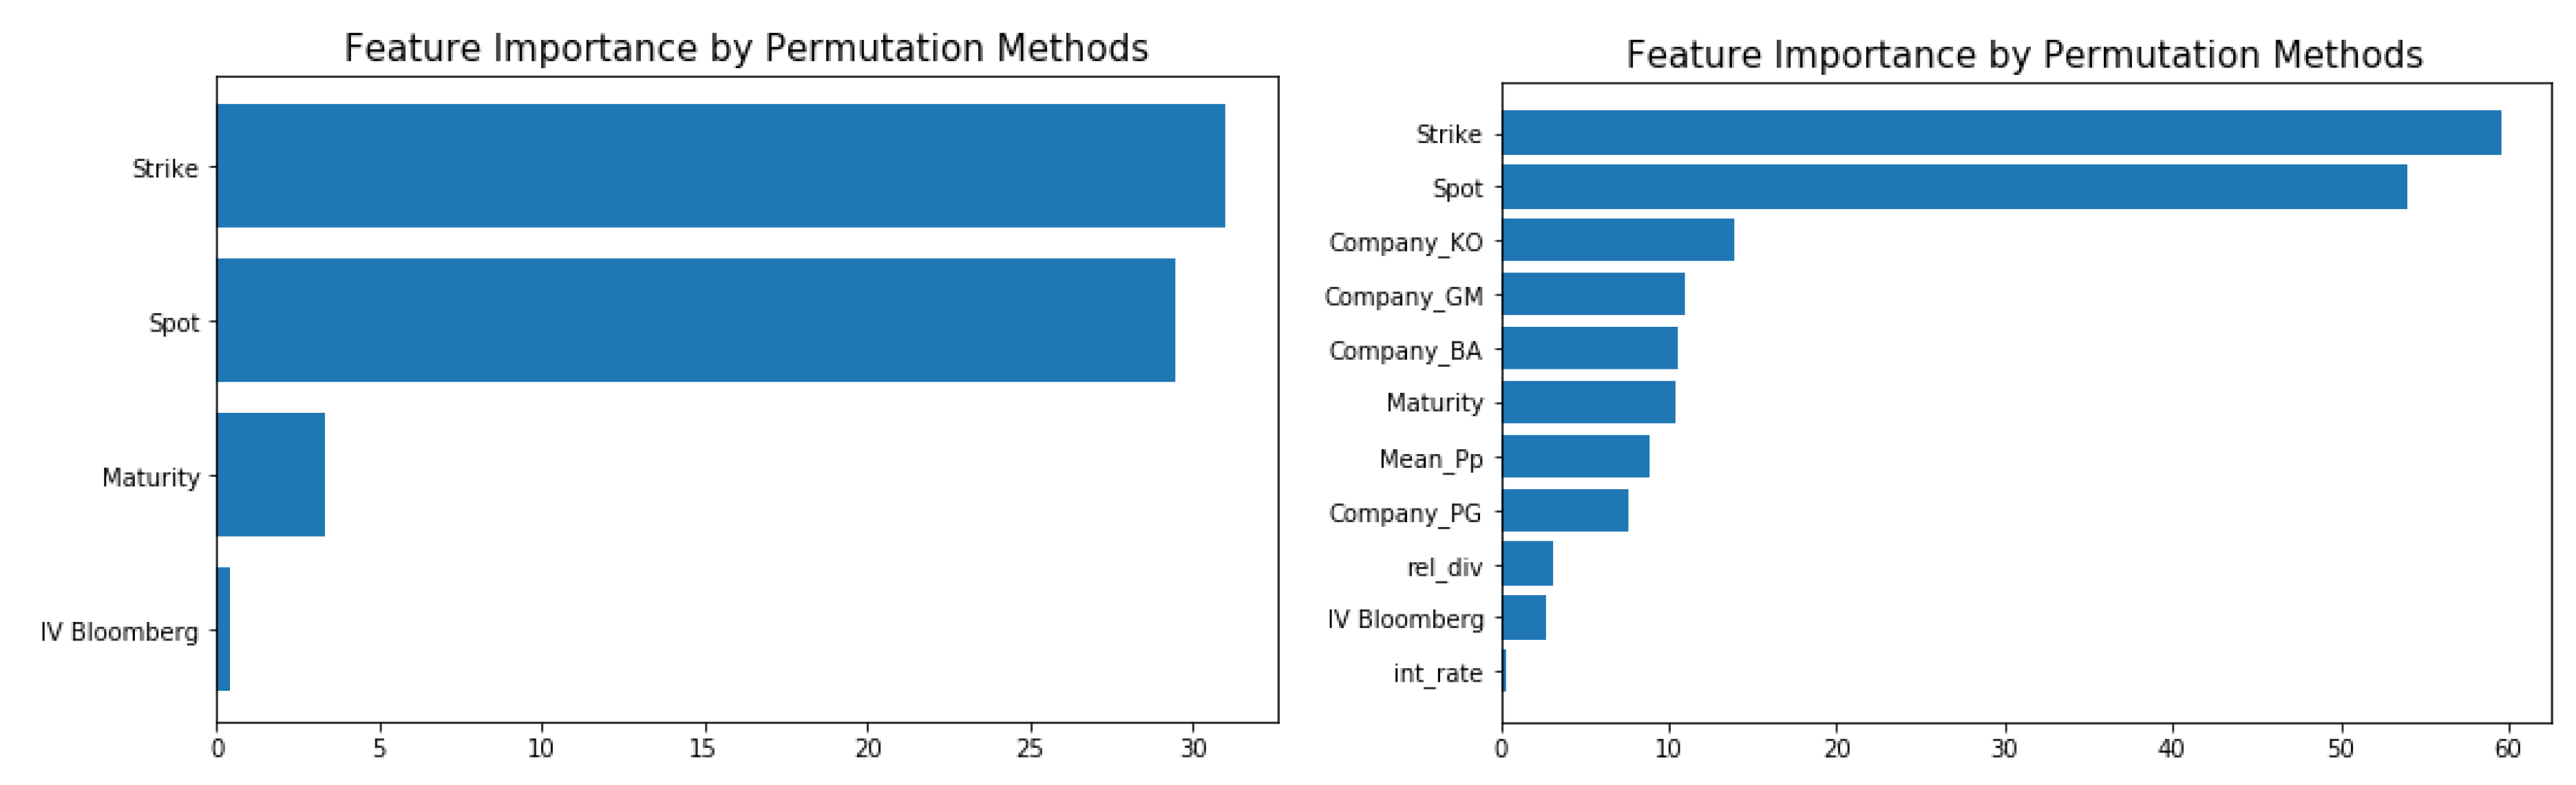
To conclude the analysis of our NN models and get a better feeling on the relative importance of each input, we used a permutation method. For each variable, we sorted the column of the variable randomly, ceteris paribus, and re-ran the new predictions on both NN models, comparing the new RMSE with the original RMSE from the correct, in terms of percentual deviation.
Figure 12 shows the ordered feature importance. For instance, when in NN Model 2, we randomized interest rate values, the total RMSE increased by 27%, which was not as substantial as the absence of a correct strike price, which increased the RMSE by approximately 6000%. It is not surprising that getting as input the correct spot and/or strike prices was key in obtaining the correct option prices.
The graphs are more interesting when read in comparative terms. For instance, it is clear that for NN Model 2, the dummy variables were important, with relevance similar to the option maturity and more relevant than implied volatility.
Table 9 shows a measure of the relative importance of each input for both NN models. This relative importance was computed using the permutation technique results, dividing each input RMSE percent increase by the sum of all inputs’ RMSE percent increase, for each model.
6. Conclusions
Neural Networks (NNs) had many advantages when it comes to option pricing as explored throughout this work. Still, some disadvantages could be encountered, as the necessity to have a complete and large dataset to train the modeling structure. This implies, for instance, that more exotic options and, in particular, over-the-counter options cannot be priced as fairly by the NN when compared with other derivatives more readily available in the markets and with a higher trading volume. Therefore, a note of advice is that, when using NN, the model is calibrated to past data, which means that any changes to the future composure of financial markets, for example, a big financial crisis, might modify the values of worldwide options, leading to miscalculations in prices and the need to retrain models.
In terms of the limitations of the analysis presented in this study, we note that although the number of options used here was larger than in most studies in the literature, it was still scarce, especially when compared to the datasets used to calibrate NN models in other fields. That is the case, for instance, in image recognition where NNs are the main methodology applied.
Regarding execution time, while LSM produced results in a reasonable amount of time to price a single option, if a more complicated underlying process, for example a jump process with stochastic volatility, were added into the LSM, the execution time might be compromised. On the contrary, once calibrated, the NN had an immediate execution time and could beat traditional methods also in terms of error performance. This study compared the classical LSM with two proposed NN models, i.e., our aim was to compare a pure simulation method to pure NN alternatives. Thus, we did not consider “mixed models” where NN are used within the LSM approach to estimate continuation values (as in Kohler et al. (2010)).
This study focused on training two NN models to a dataset from American put options with four companies’ stocks as the underlyings; each of the stocks from a different sector of activity. Despite using all traded options on those underlyings, we considered a relatively small time frame: from December 2018 until March 2019. It could be meaningful to analyze if an NN trained for a specific sector would yield better results, and if an NN trained on a complete year would alter the outcome of the results.
Nonetheless, the results of this study were extremely promising, in terms of NN applicability. Our simplest (naive) model, NN Model 1, performed at a level similar to or better than LSM, which is considered a reference in the empirical literature. As for the proposed NN Model 2, it outperformed by far both LSM and NN Model 1. The results were robust across underlyings, maturities, and levels of moneyness.
Should NN continue to gather good results, investment companies could start using them, to price an option and complete a trade instantaneously.
Author Contributions
Conceptualization, R.M.G., S.D.L. and B.S.; methodology, S.D.L. and B.S.; software, B.S.; validation, B.S.; formal analysis, R.M.G., S.D.L. and B.S.; investigation, R.M.G., S.D.L. and B.S.; resources, S.D.L. and B.S.; data curation, B.S.; writing —original draft preparation, R.M.G., S.D.L. and B.S.; writing review and editing, R.M.G. and S.D.L.; visualization, R.M.G. and S.D.L.; supervision, R.M.G. and S.D.L.; project administration, R.M.G.; funding acquisition, R.M.G. and S.D.L. All authors have read and agreed to the published version of the manuscript.
Funding
This work was partially supported by Project CEMAPRE/REM—UIDB/05069/2020 financed by FCT/MCTES (Portuguese Science Foundation), through national funds.
Acknowledgments
We are most grateful to Manuel L. Esquível and Kevin Fernandes for fruitful discussions, giving us both the academia and industry perspectives on this matter. We are also most grateful to the anonymous reviewers whose comments and suggestions helped improve and clarify this manuscript.
Conflicts of Interest
The authors declare no conflict of interest.
References
- Abadi, Martín, Paul Barham, Jianmin Chen, Zhifeng Chen, Andy Davis, Jeffrey Dean, Matthieu Devin, Sanjay Ghemawat, Geoffrey Irving, Michael Isard, and et al. 2016. Tensorflow: A system for large-scale machine learning. Paper presented at 12th USENIX Symposium on Operating Systems Design and Implementation (OSDI 16), Savannah, GA, USA, November 2–4; pp. 265–83. [Google Scholar]
- Allegretto, Walter, Yanping Lin, and Hongtao Yang. 2001. A fast and highly accurate numerical method for the evaluation of american options. Dynamics of Continuous Discrete and Impulsive Systems Series B 8: 127–38. [Google Scholar]
- Barron, Andrew R. 1993. Universal approximation bounds for superpositions of a sigmoidal function. IEEE Transactions on Information theory 39: 930–45. [Google Scholar] [CrossRef] [Green Version]
- Barty, Kengy, Pierre Girardeau, Cyrille Strugarek, and Jean-Sébastien Roy. 2008. Application of kernel-based stochastic gradient algorithms to option pricing. Monte Carlo Methods and Applications 14: 99–127. [Google Scholar] [CrossRef]
- Becker, Sebastian, Patrick Cheridito, and Arnulf Jentzen. 2019. Deep optimal stopping. Journal of Machine Learning Research 20: 1–25. [Google Scholar]
- Becker, Sebastian, Patrick Cheridito, Arnulf Jentzen, and Timo Welti. 2019. Solving high-dimensional optimal stopping problems using deep learning. arXiv arXiv:1908.01602. [Google Scholar]
- Bennell, Julia, and Charles Sutcliffe. 2004. Black–scholes versus artificial neural networks in pricing ftse 100 options. Intelligent Systems in Accounting, Finance & Management: International Journal 12: 243–60. [Google Scholar]
- Bottou, Léon. 2010. Large-scale machine learning with stochastic gradient descent. In Proceedings of COMPSTAT’2010. Heidelberg: Springer, pp. 177–86. [Google Scholar]
- Brennan, Michael J., and Eduardo S. Schwartz. 1977. The valuation of american put options. The Journal of Finance 32: 449–62. [Google Scholar] [CrossRef]
- Broadie, Mark, Paul Glasserman, and Gautam Jain. 1997. Enhanced monte carlo estimates for american option prices. Journal of Derivatives 5: 25–44. [Google Scholar] [CrossRef] [Green Version]
- Bunch, David S., and Herb Johnson. 2000. The american put option and its critical stock price. The Journal of Finance 55: 2333–56. [Google Scholar] [CrossRef]
- Carr, Peter, Robert Jarrow, and Ravi Myneni. 1992. Alternative characterizations of american put options. Mathematical Finance 2: 87–106. [Google Scholar] [CrossRef]
- Chen, Xinfu, John Chadam, Lishang Jiang, and Weian Zheng. 2008. Convexity of the exercise boundary of the american put option on a zero dividend asset. Mathematical Finance: An International Journal of Mathematics, Statistics and Financial Economics 18: 185–97. [Google Scholar] [CrossRef] [Green Version]
- Choromanska, Anna, Mikael Henaff, Michael Mathieu, Gérard Ben Arous, and Yann LeCun. 2015. The loss surfaces of multilayer networks. Paper presented at 18th International Conference on Artificial Intelligence and Statistics, San Diego, CA, USA, May 9–12; pp. 192–204. [Google Scholar]
- Choudhary, M. Ali, and Adnan Haider. 2012. Neural network models for inflation forecasting: An appraisal. Applied Economics 44: 2631–35. [Google Scholar] [CrossRef] [Green Version]
- Clément, Emmanuelle, Damien Lamberton, and Philip Protter. 2002. An analysis of a least squares regression method for american option pricing. Finance and Stochastics 6: 449–71. [Google Scholar] [CrossRef]
- Cremers, Martijn, and David Weinbaum. 2010. Deviations from put-call parity and stock return predictability. Journal of Financial and Quantitative Analysis 45: 335–67. [Google Scholar] [CrossRef] [Green Version]
- Cybenko, George. 1989. Approximations by superpositions of a sigmoidal function. Mathematics of Control, Signals and Systems 2: 183–92. [Google Scholar] [CrossRef]
- Egloff, Daniel. 2005. Monte carlo algorithms for optimal stopping and statistical learning. The Annals of Applied Probability 15: 1396–432. [Google Scholar] [CrossRef]
- Egloff, Daniel, Michael Kohler, and Nebojsa Todorovic. 2007. A dynamic look-ahead monte carlo algorithm for pricing bermudan options. The Annals of Applied Probability 17: 1138–71. [Google Scholar] [CrossRef] [Green Version]
- Garcia, René, and Ramazan Gençay. 2000. Pricing and hedging derivative securities with neural networks and a homogeneity hint. Journal of Econometrics 94: 93–115. [Google Scholar] [CrossRef] [Green Version]
- Geske, Robert, and Herb E. Johnson. 1984. The american put option valued analytically. The Journal of Finance 39: 1511–24. [Google Scholar] [CrossRef]
- Gradojevic, Nikola, Ramazan Gençay, and Dragan Kukolj. 2009. Option pricing with modular neural networks. IEEE Transactions on Neural Networks 20: 626–37. [Google Scholar] [CrossRef]
- Hanin, Boris, and Mark Sellke. 2017. Approximating continuous functions by relu nets of minimal width. arXiv arXiv:1710.11278. [Google Scholar]
- Haykin, Simon. 1994. Neural Networks. New York: Prentice Hallk, vol. 2. [Google Scholar]
- Hornik, Kurt, Maxwell Stinchcombe, and Halbert White. 1989. Multilayer feedforward networks are universal approximators. Neural Networks 2: 359–66. [Google Scholar] [CrossRef]
- Hutchinson, James M., Andrew W. Lo, and Tomaso Poggio. 1994. A nonparametric approach to pricing and hedging derivative securities via learning networks. The Journal of Finance 49: 851–89. [Google Scholar] [CrossRef]
- Jang, Huisu, and Jaewook Lee. 2019. Generative bayesian neural network model for risk-neutral pricing of american index options. Quantitative Finance 19: 587–603. [Google Scholar] [CrossRef] [Green Version]
- Kelly, David L., and Jamsheed Shorish. 1994. Valuing and Hedging American Put Options Using Neural Networks. Pittsburgh: Carnegie Mellon University. [Google Scholar]
- Kim, In Joon. 1990. The analytic valuation of american options. The Review of Financial Studies 3: 547–72. [Google Scholar] [CrossRef]
- Kohler, Michael. 2008. A regression-based smoothing spline monte carlo algorithm for pricing american options in discrete time. AStA Advances in Statistical Analysis 92: 153–78. [Google Scholar] [CrossRef]
- Kohler, Michael, Adam Krzyżak, and Nebojsa Todorovic. 2010. Pricing of high-dimensional american options by neural networks. Mathematical Finance: An International Journal of Mathematics, Statistics and Financial Economics 20: 383–410. [Google Scholar] [CrossRef] [Green Version]
- Krizhevsky, Alex, Ilya Sutskever, and Geoffrey E. Hinton. 2012. Imagenet classification with deep convolutional neural networks. Paper presented at Advances in Neural Information Processing Systems, Lake Tahoe, NV, USA, December 3–6; pp. 1097–105. [Google Scholar]
- Kuske, Rachel A., and Joseph B. Keller. 1998. Optimal exercise boundary for an american put option. Applied Mathematical Finance 5: 107–16. [Google Scholar] [CrossRef]
- LeCun, Yann A., Léon Bottou, Genevieve B. Orr, and Klaus-Robert Müller. 2012. Efficient backprop. In Neural Networks: Tricks of the Trade. Berlin/Heidelberg: Springer, pp. 9–48. [Google Scholar]
- Leshno, Moshe, Vladimir Ya Lin, Allan Pinkus, and Shimon Schocken. 1993. Multilayer feedforward networks with a nonpolynomial activation function can approximate any function. Neural Networks 6: 861–67. [Google Scholar] [CrossRef] [Green Version]
- Liu, Shuaiqiang, Cornelis Oosterlee, and Sander Bohte. 2019. Pricing options and computing implied volatilities using neural networks. Risks 7: 16. [Google Scholar] [CrossRef] [Green Version]
- Longstaff, Francis A., and Eduardo S. Schwartz. 2001. Valuing american options by simulation: A simple least-squares approach. The Review of Financial Studies 14: 113–47. [Google Scholar] [CrossRef] [Green Version]
- Lu, Zhou, Hongming Pu, Feicheng Wang, Zhiqiang Hu, and Liwei Wang. 2017. The expressive power of neural networks: A view from the width. Paper presented at Advances in Neural Information Processing Systems, Long Beach, CA, USA, December 4–9; pp. 6231–39. [Google Scholar]
- McCulloch, Warren S., and Walter Pitts. 1943. A logical calculus of the ideas immanent in nervous activity. The Bulletin of Mathematical Biophysics 5: 115–33. [Google Scholar] [CrossRef]
- Moshiri, Saeed, and Laura Brown. 2004. Unemployment variation over the business cycles: A comparison of forecasting models. Journal of Forecasting 23: 497–511. [Google Scholar] [CrossRef]
- Pacelli, Vincenzo, Vitoantonio Bevilacqua, and Michele Azzollini. 2011. An artificial neural network model to forecast exchange rates. Journal of Intelligent Learning Systems and Applications 3: 57. [Google Scholar] [CrossRef] [Green Version]
- Parkinson, Michael. 1977. Option pricing: The american put. The Journal of Business 50: 21–36. [Google Scholar] [CrossRef]
- Rogers, Leonard C. G. 2002. Monte carlo valuation of american options. Mathematical Finance 12: 271–86. [Google Scholar] [CrossRef]
- Rotundo, Giulia. 2004. Neural networks for large financial crashes forecast. Physica A: Statistical Mechanics and Its Applications 344: 77–80. [Google Scholar] [CrossRef]
- Rumelhart, David E., Geoffrey E. Hinton, and Ronald J. Williams. 1985. Learning Internal Representations by Error Propagation. Technical Report. San Diego: California Univ San Diego La Jolla Inst for Cognitive Science. [Google Scholar]
- Sullivan, Michael A. 2000. Valuing american put options using gaussian quadrature. The Review of Financial Studies 13: 75–94. [Google Scholar] [CrossRef]
- Tang, Zaiyong, and Paul A. Fishwick. 1993. Feedforward neural nets as models for time series forecasting. ORSA Journal on Computing 5: 374–85. [Google Scholar] [CrossRef]
- Tilley, James A. 1993. Valuing american options in a path simulation model. In Transactions of the Society of Actuaries. Citeseer. [Google Scholar]
- Tkacz, Greg. 2001. Neural network forecasting of canadian gdp growth. International Journal of Forecasting 17: 57–69. [Google Scholar] [CrossRef]
- Xu, Bing, Naiyan Wang, Tianqi Chen, and Mu Li. 2015. Empirical evaluation of rectified activations in convolutional network. arXiv arXiv:1505.00853. [Google Scholar]
- Yao, Jingtao, Yili Li, and Chew Lim Tan. 2000. Option price forecasting using neural networks. Omega 28: 455–66. [Google Scholar] [CrossRef]
- Zhao, Jinsha. 2018. American option valuation methods. International Journal of Economics and Finance 10: 1–13. [Google Scholar] [CrossRef] [Green Version]
- Zhu, Song-Ping. 2006. An exact and explicit solution for the valuation of american put options. Quantitative Finance 6: 229–42. [Google Scholar] [CrossRef]
| 1 | For implied volatility, we used the value determined by Bloomberg’s quantitative analytics department “Equity Implied Volatility Surface”. |
| 2 | The data source was the Federal Reserve System (U.S.) and was retrieved from the Federal Reserve Bank of St. Louis. |
| 3 | TensorFlow is an open-source library used in machine learning models; for further details, see Abadi et al. (2016). Keras is an NN library that is capable of running on top of TensorFlow and other libraries. It provides an API for building deep learning models quickly and efficiently. |
Figure 1.
Feedforward neural network structure. Where , with represent the input nodes, , wit , the hidden nodes, f the output and the activation functions and are as described in Equations (3) and (4), respectively.
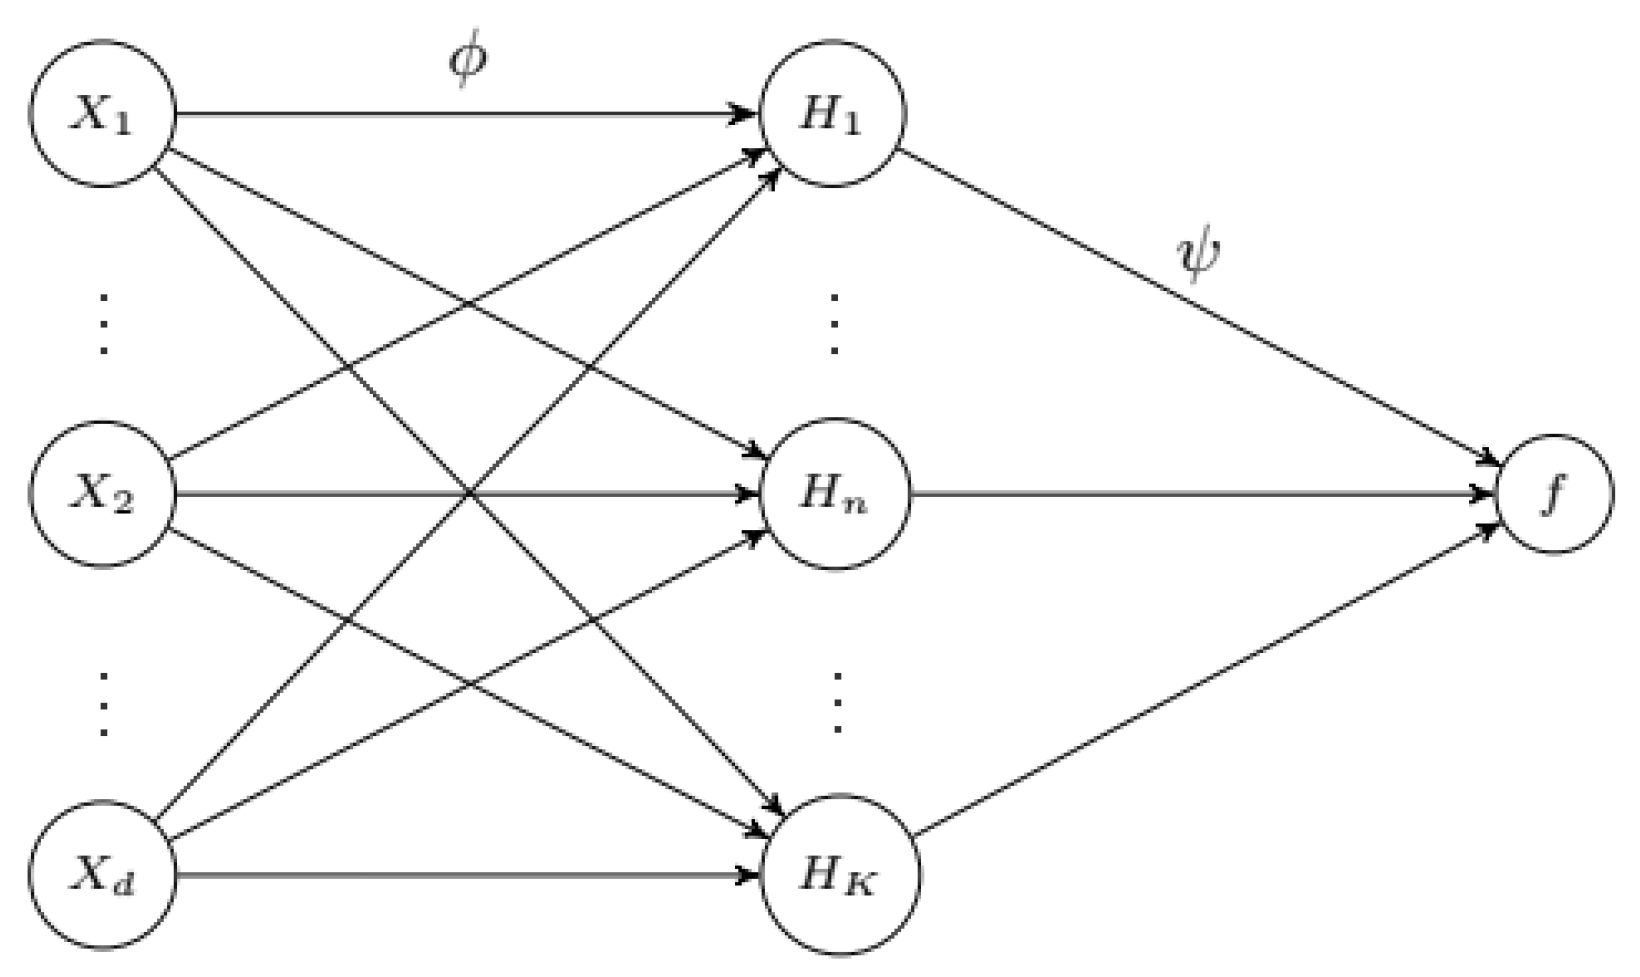
Figure 2.
Activation functions. On the l.h.s., the most commonly used sigmoid activation function. On the r.h.s., ReLU and leaky ReLU functions as in (5). The difference between the ReLU functions is in the negative part of the function, where in the case of leaky ReLU (red line), a can take a small value (0.01), while for ReLU, a is zero.
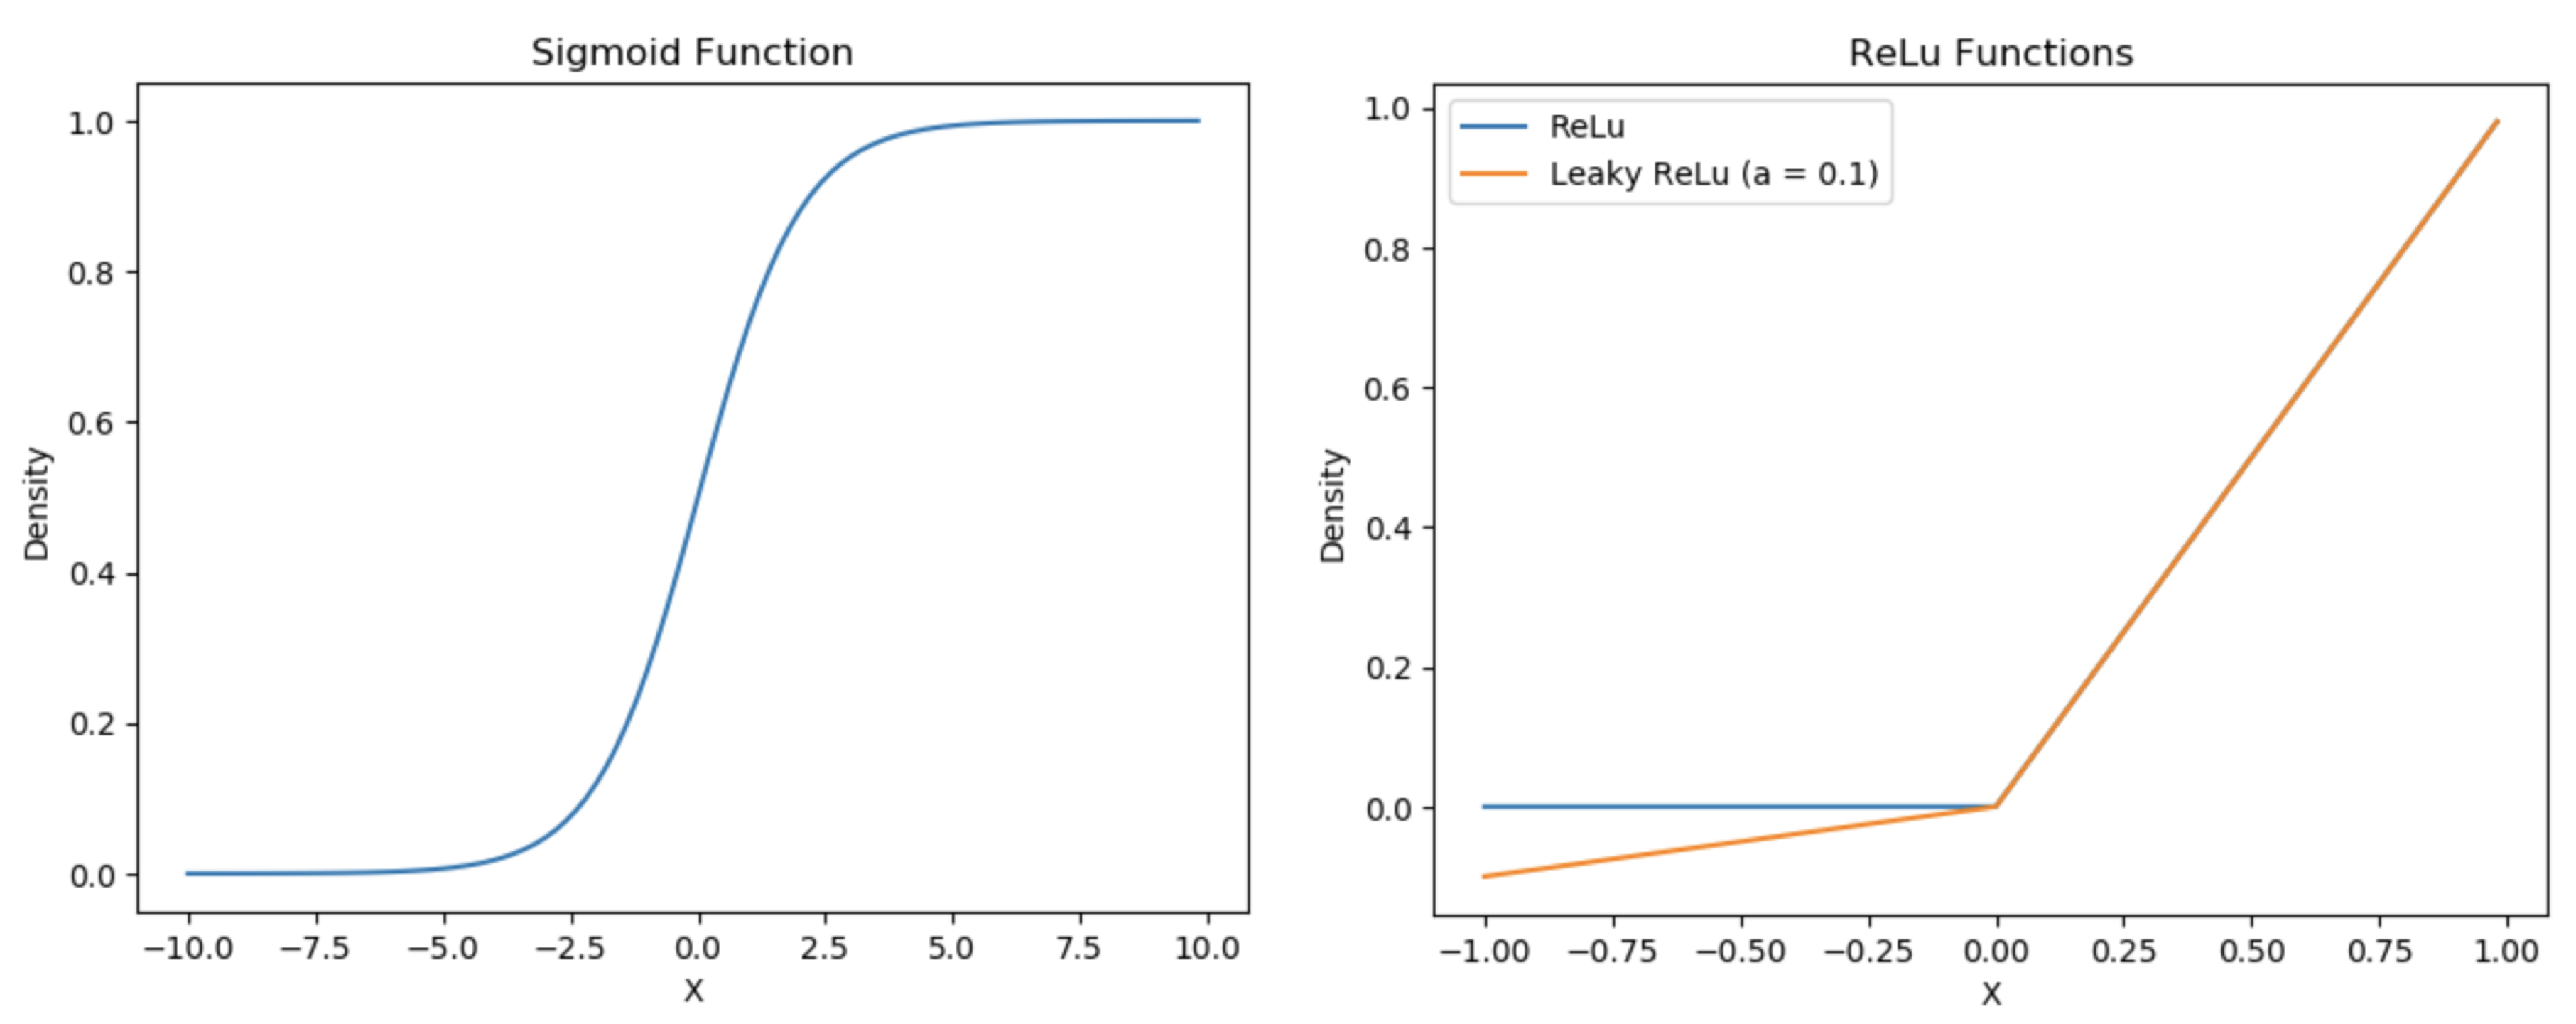
Figure 3.
Input variables’ histogram.

Figure 4.
Boxplots of the input variables.

Figure 5.
Put prices: output variable.
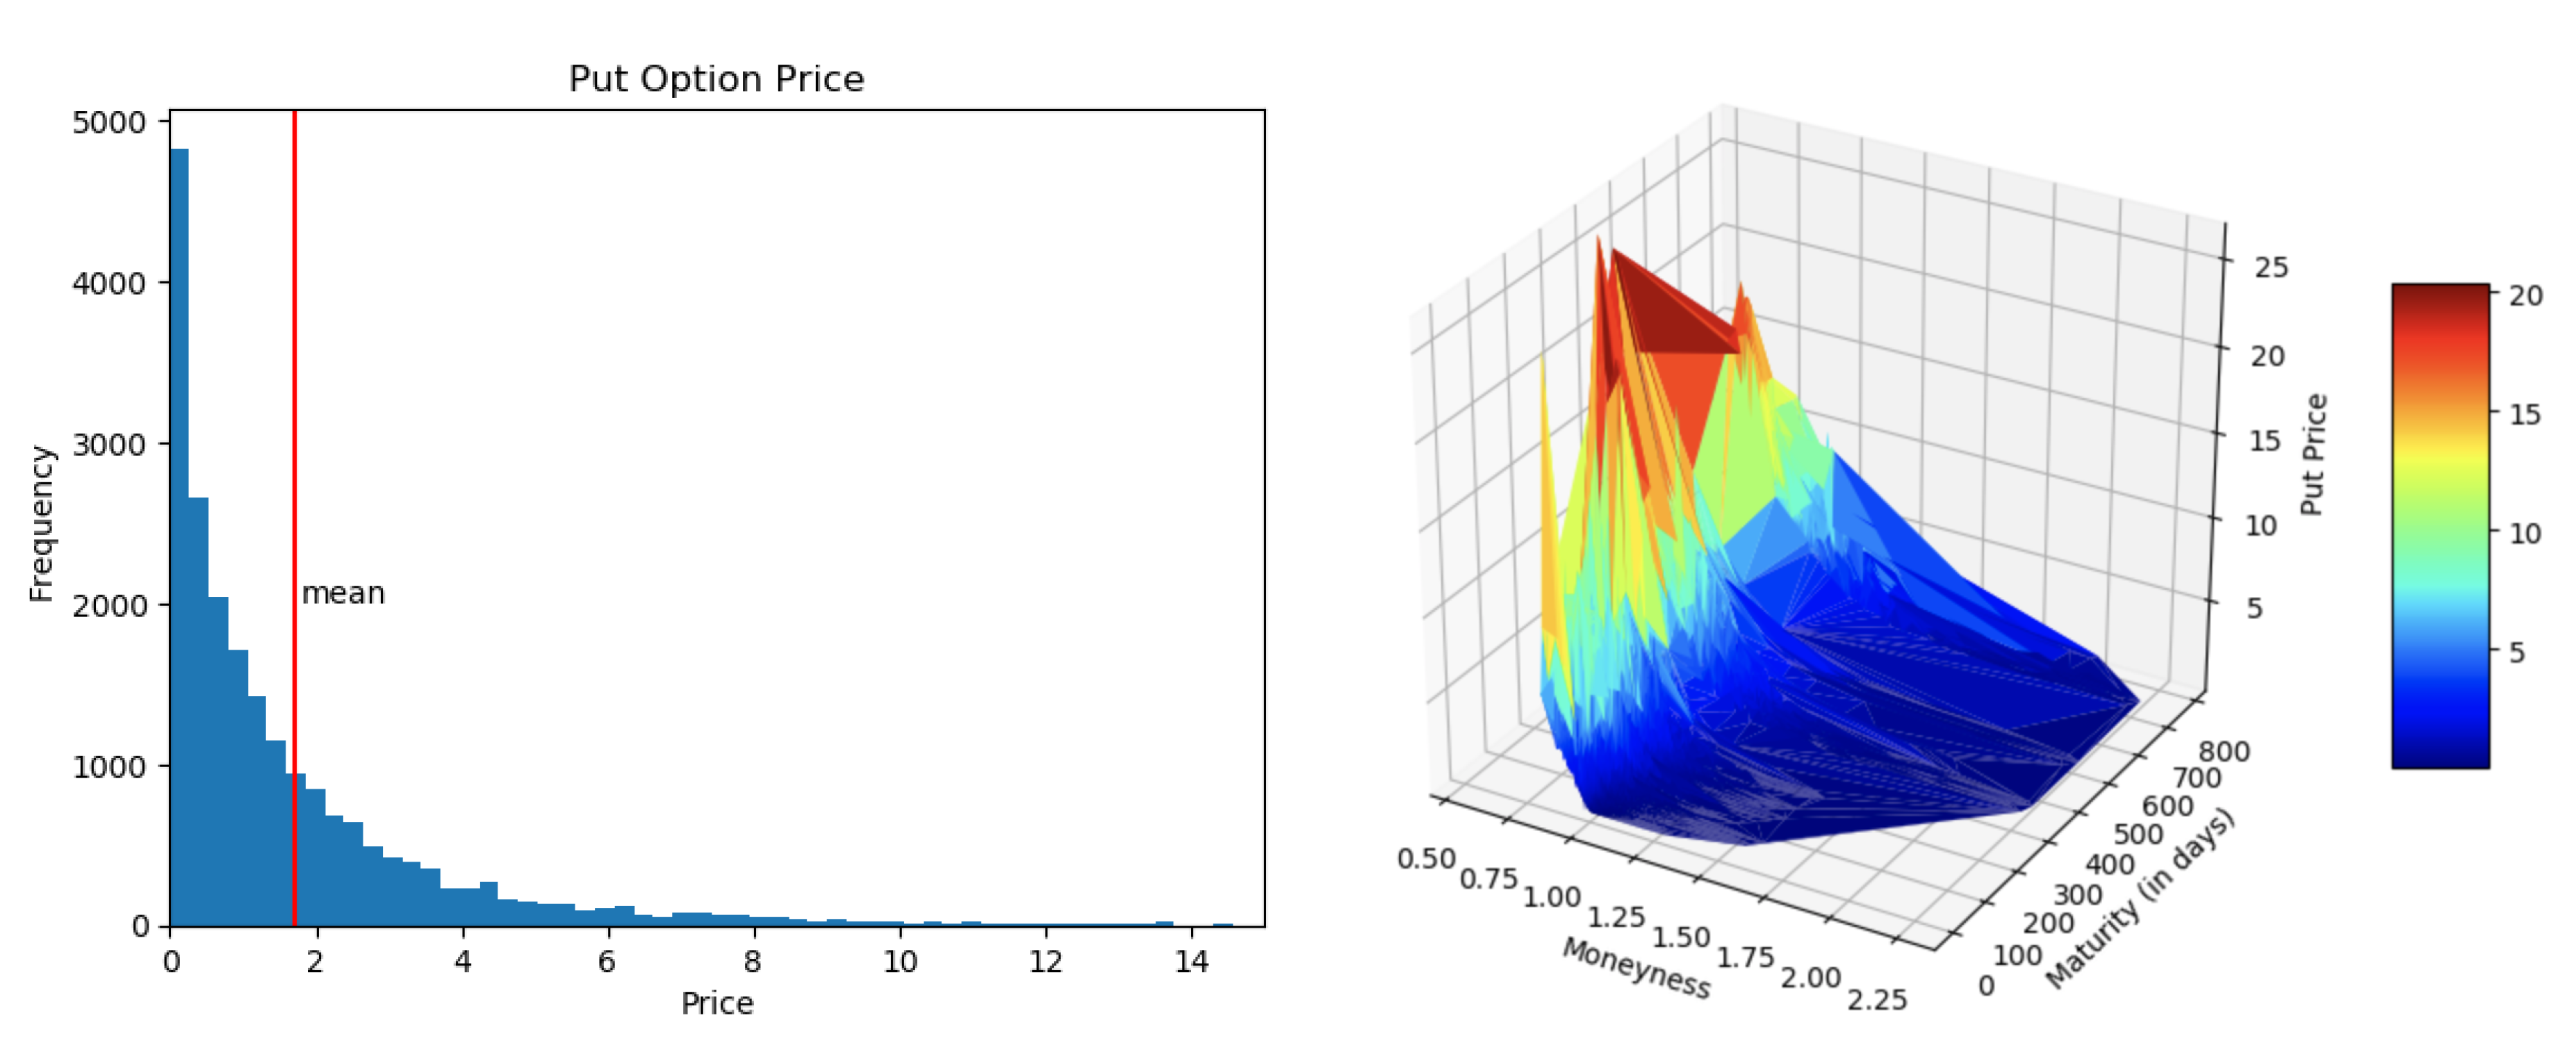
Figure 6.
Kolmogorov–Smirnov by feature.
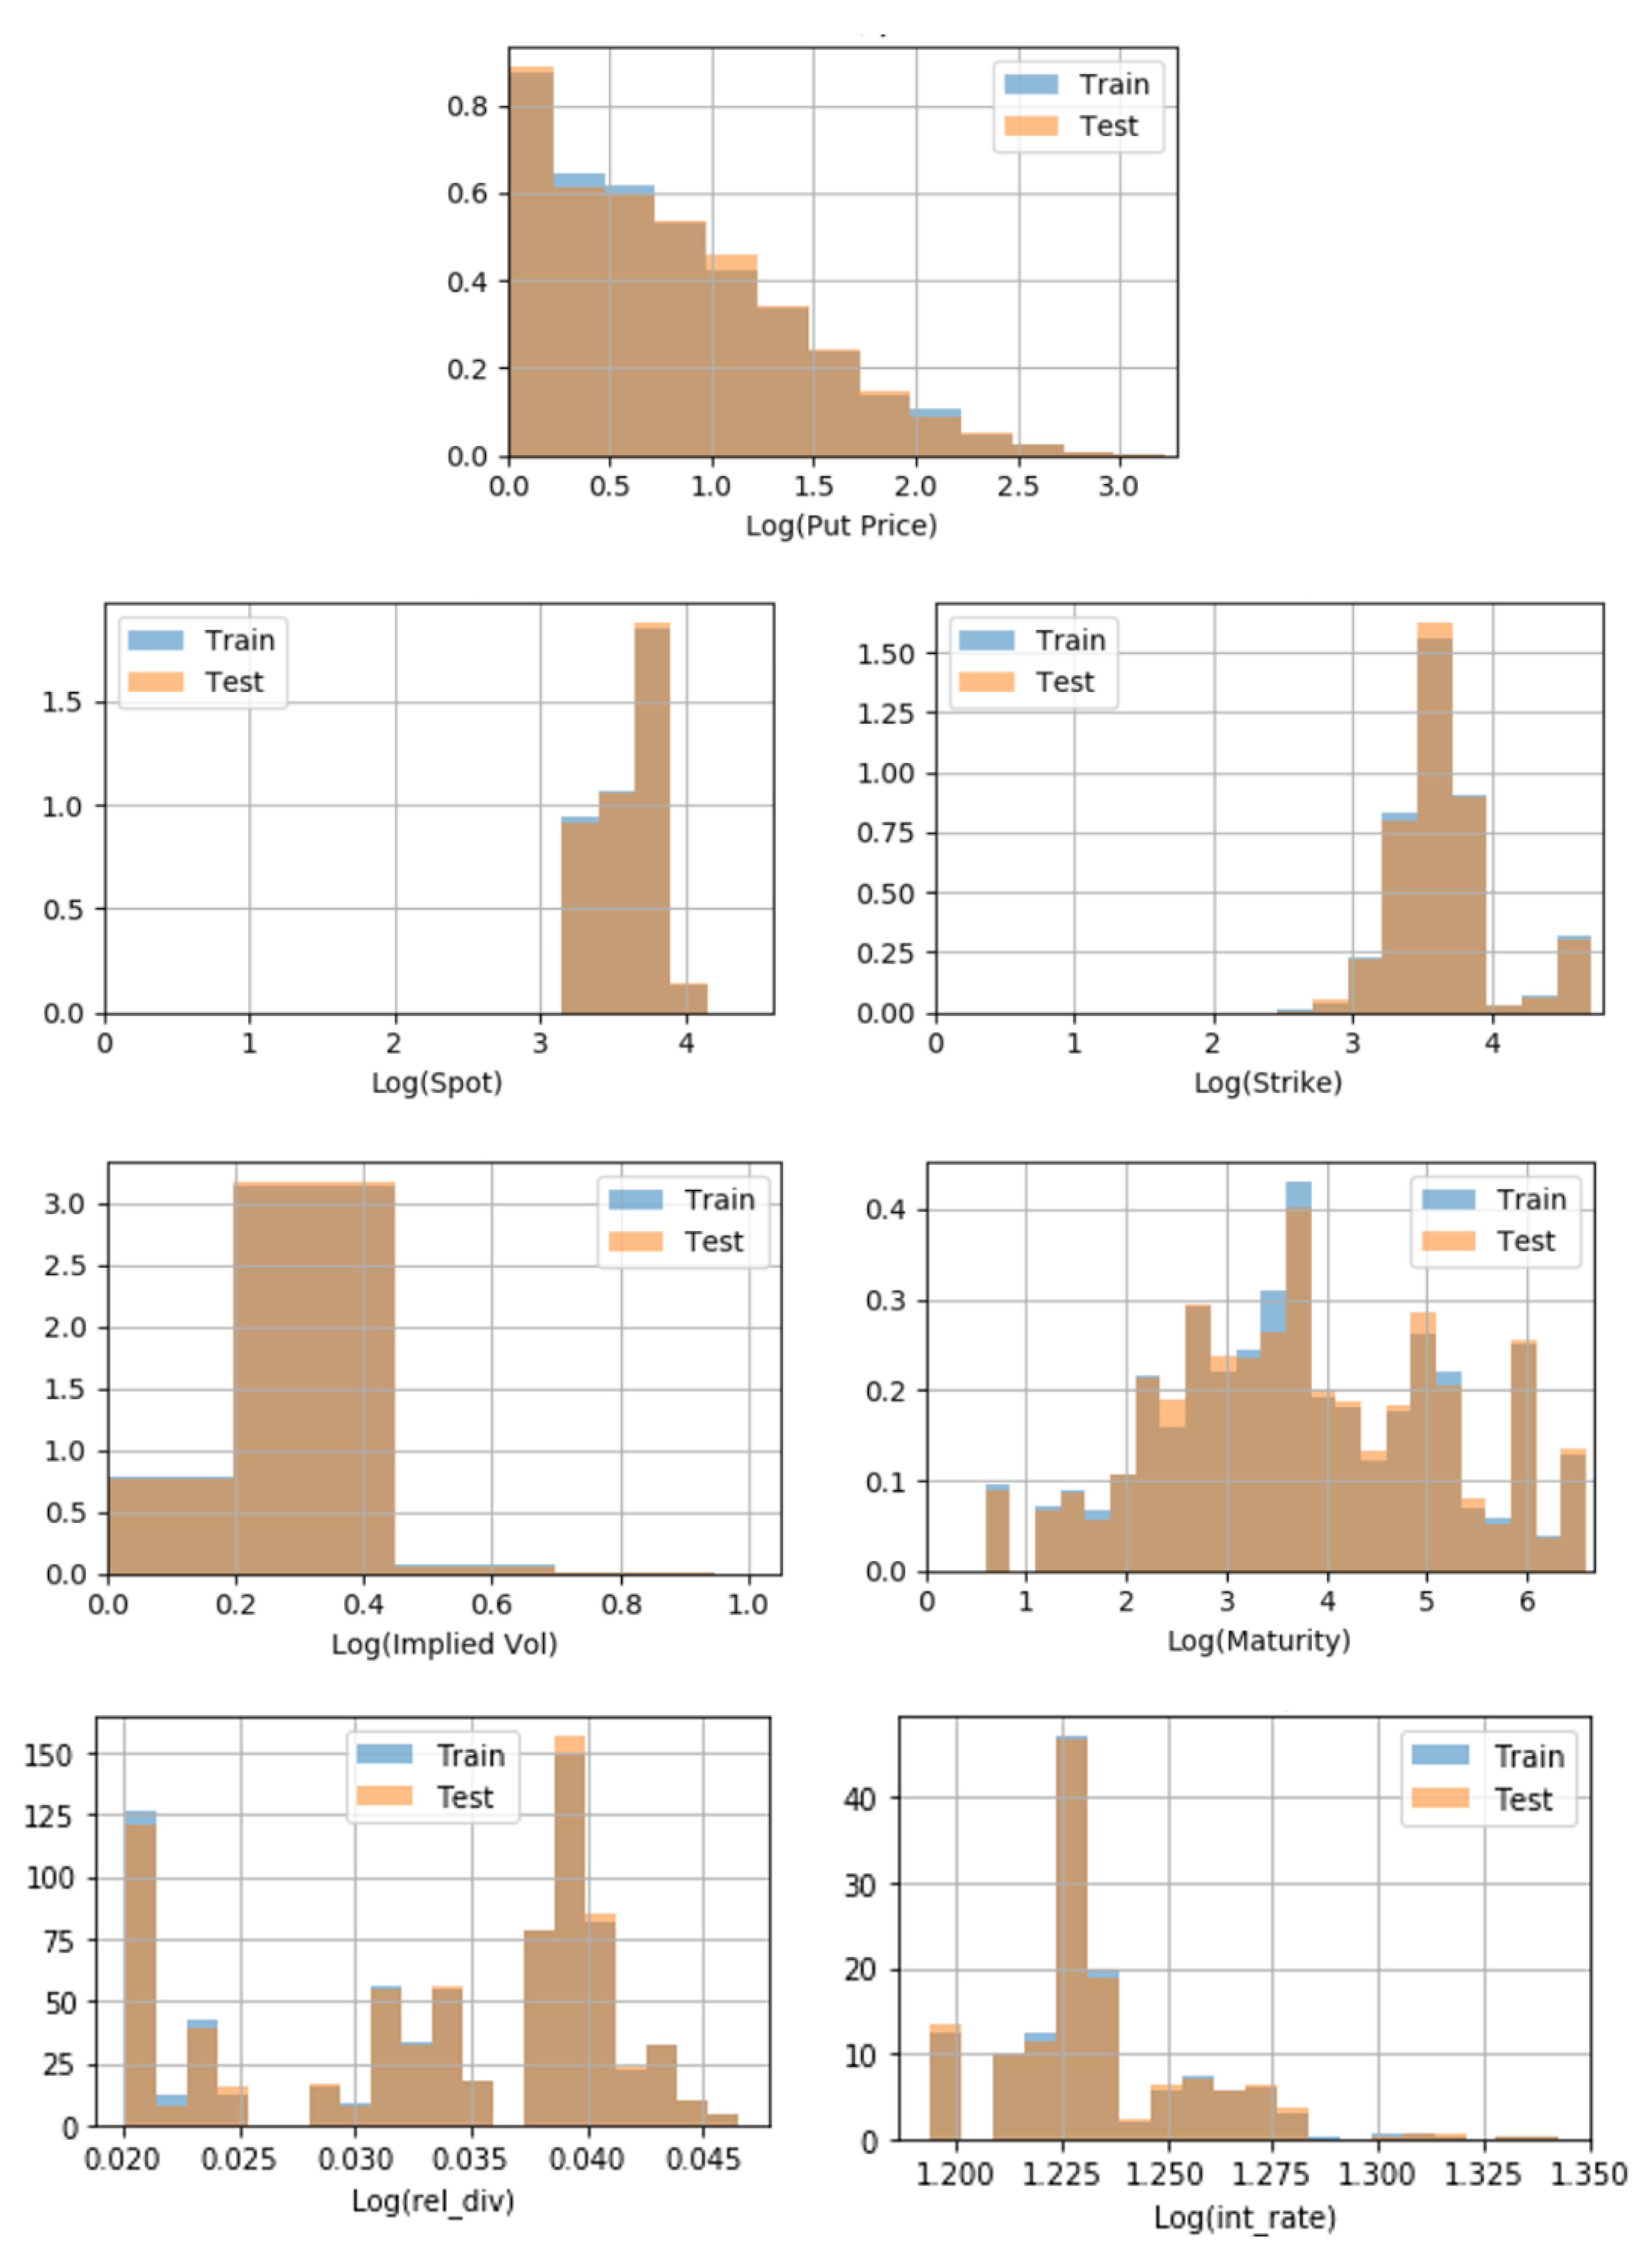
Figure 7.
NN Model 1: number of nodes (one hidden layer).
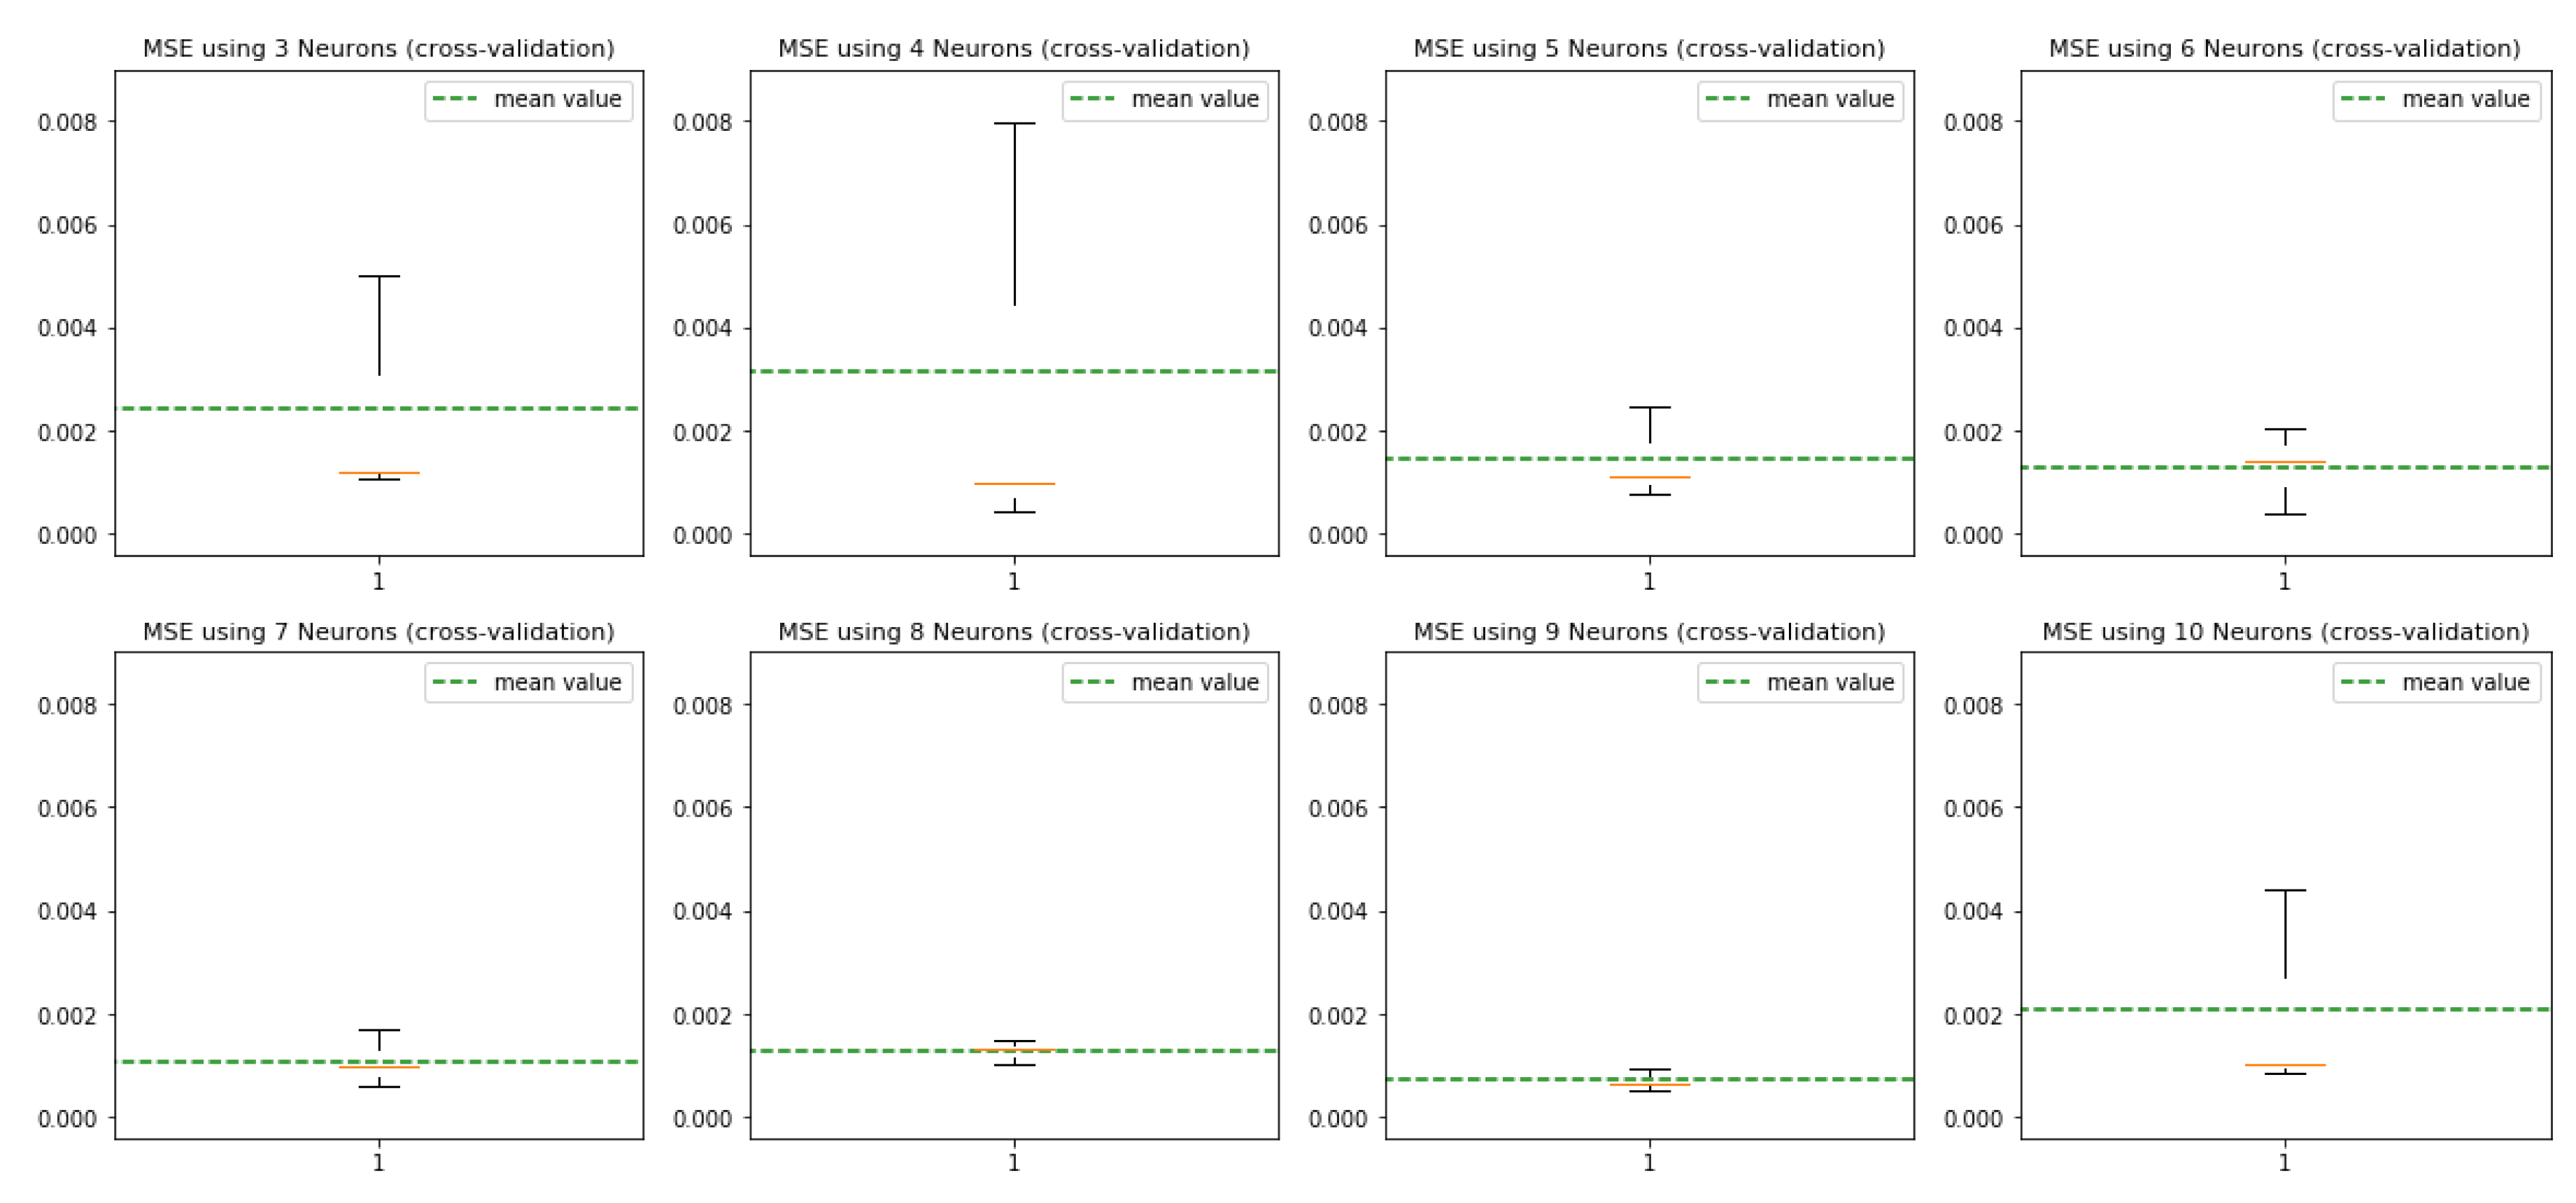
Figure 8.
Learning curves of NN models. NN Model 1 (on the left) and NN Model 2 (on the right). As in NN Model 1, the output is scaled put prices and in NN Model 2 unscaled put prices; the MSE values are not comparable.
Figure 8.
Learning curves of NN models. NN Model 1 (on the left) and NN Model 2 (on the right). As in NN Model 1, the output is scaled put prices and in NN Model 2 unscaled put prices; the MSE values are not comparable.
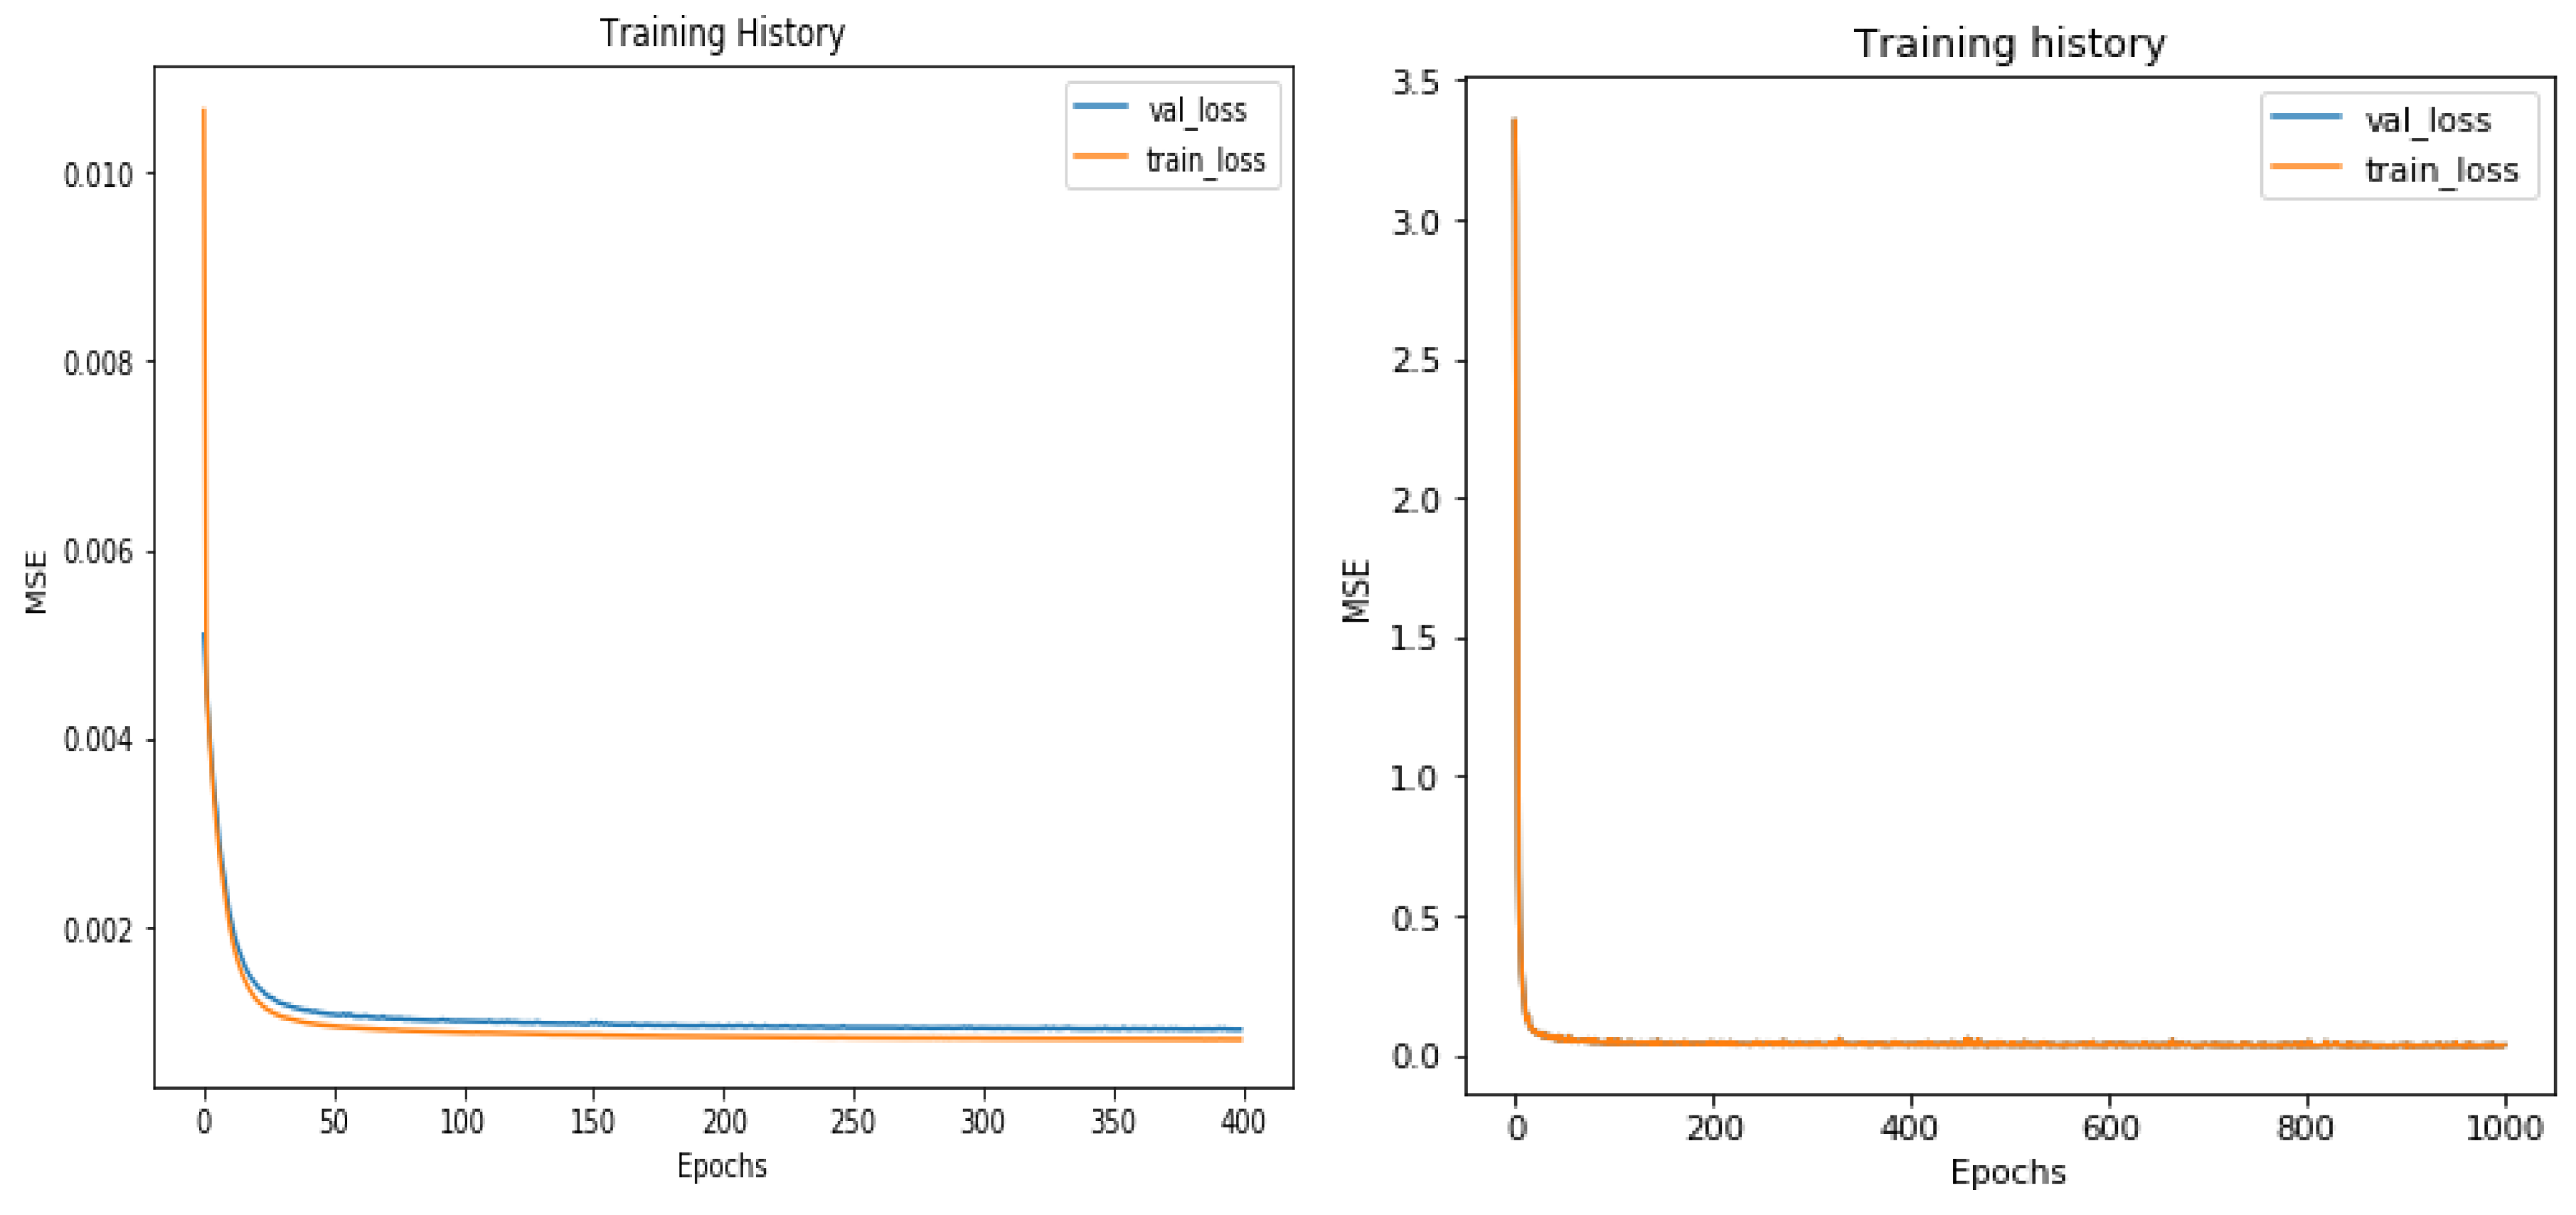
Figure 9.
NN models’ learning curves.
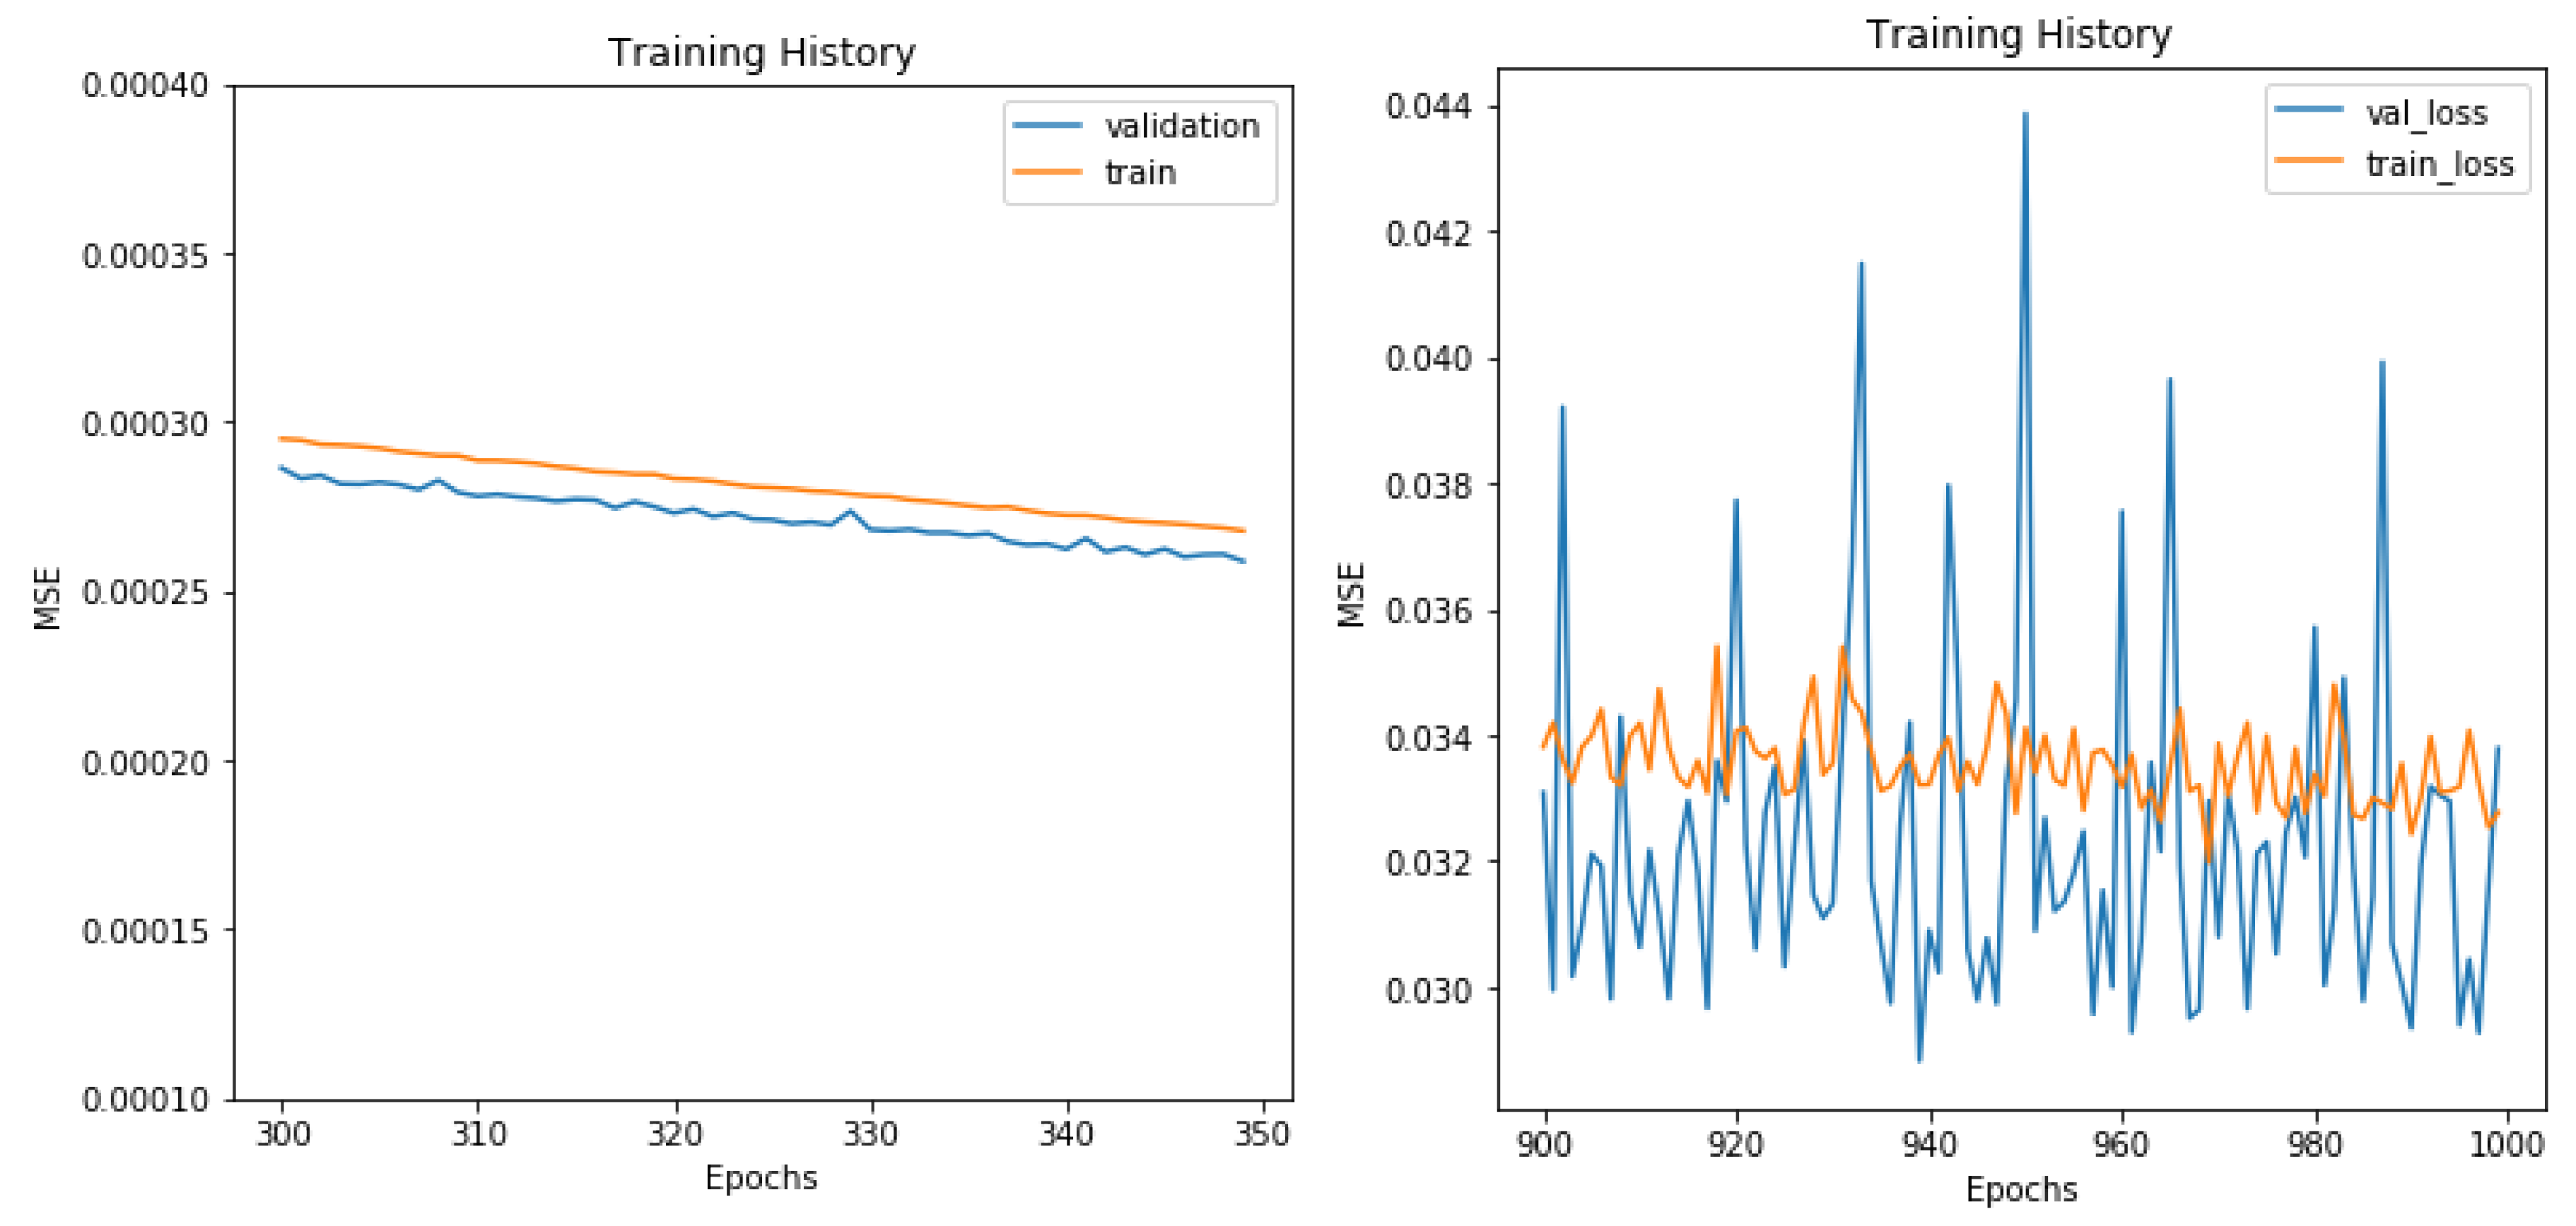
Figure 10.
RMSE per company: moneyness and maturity.
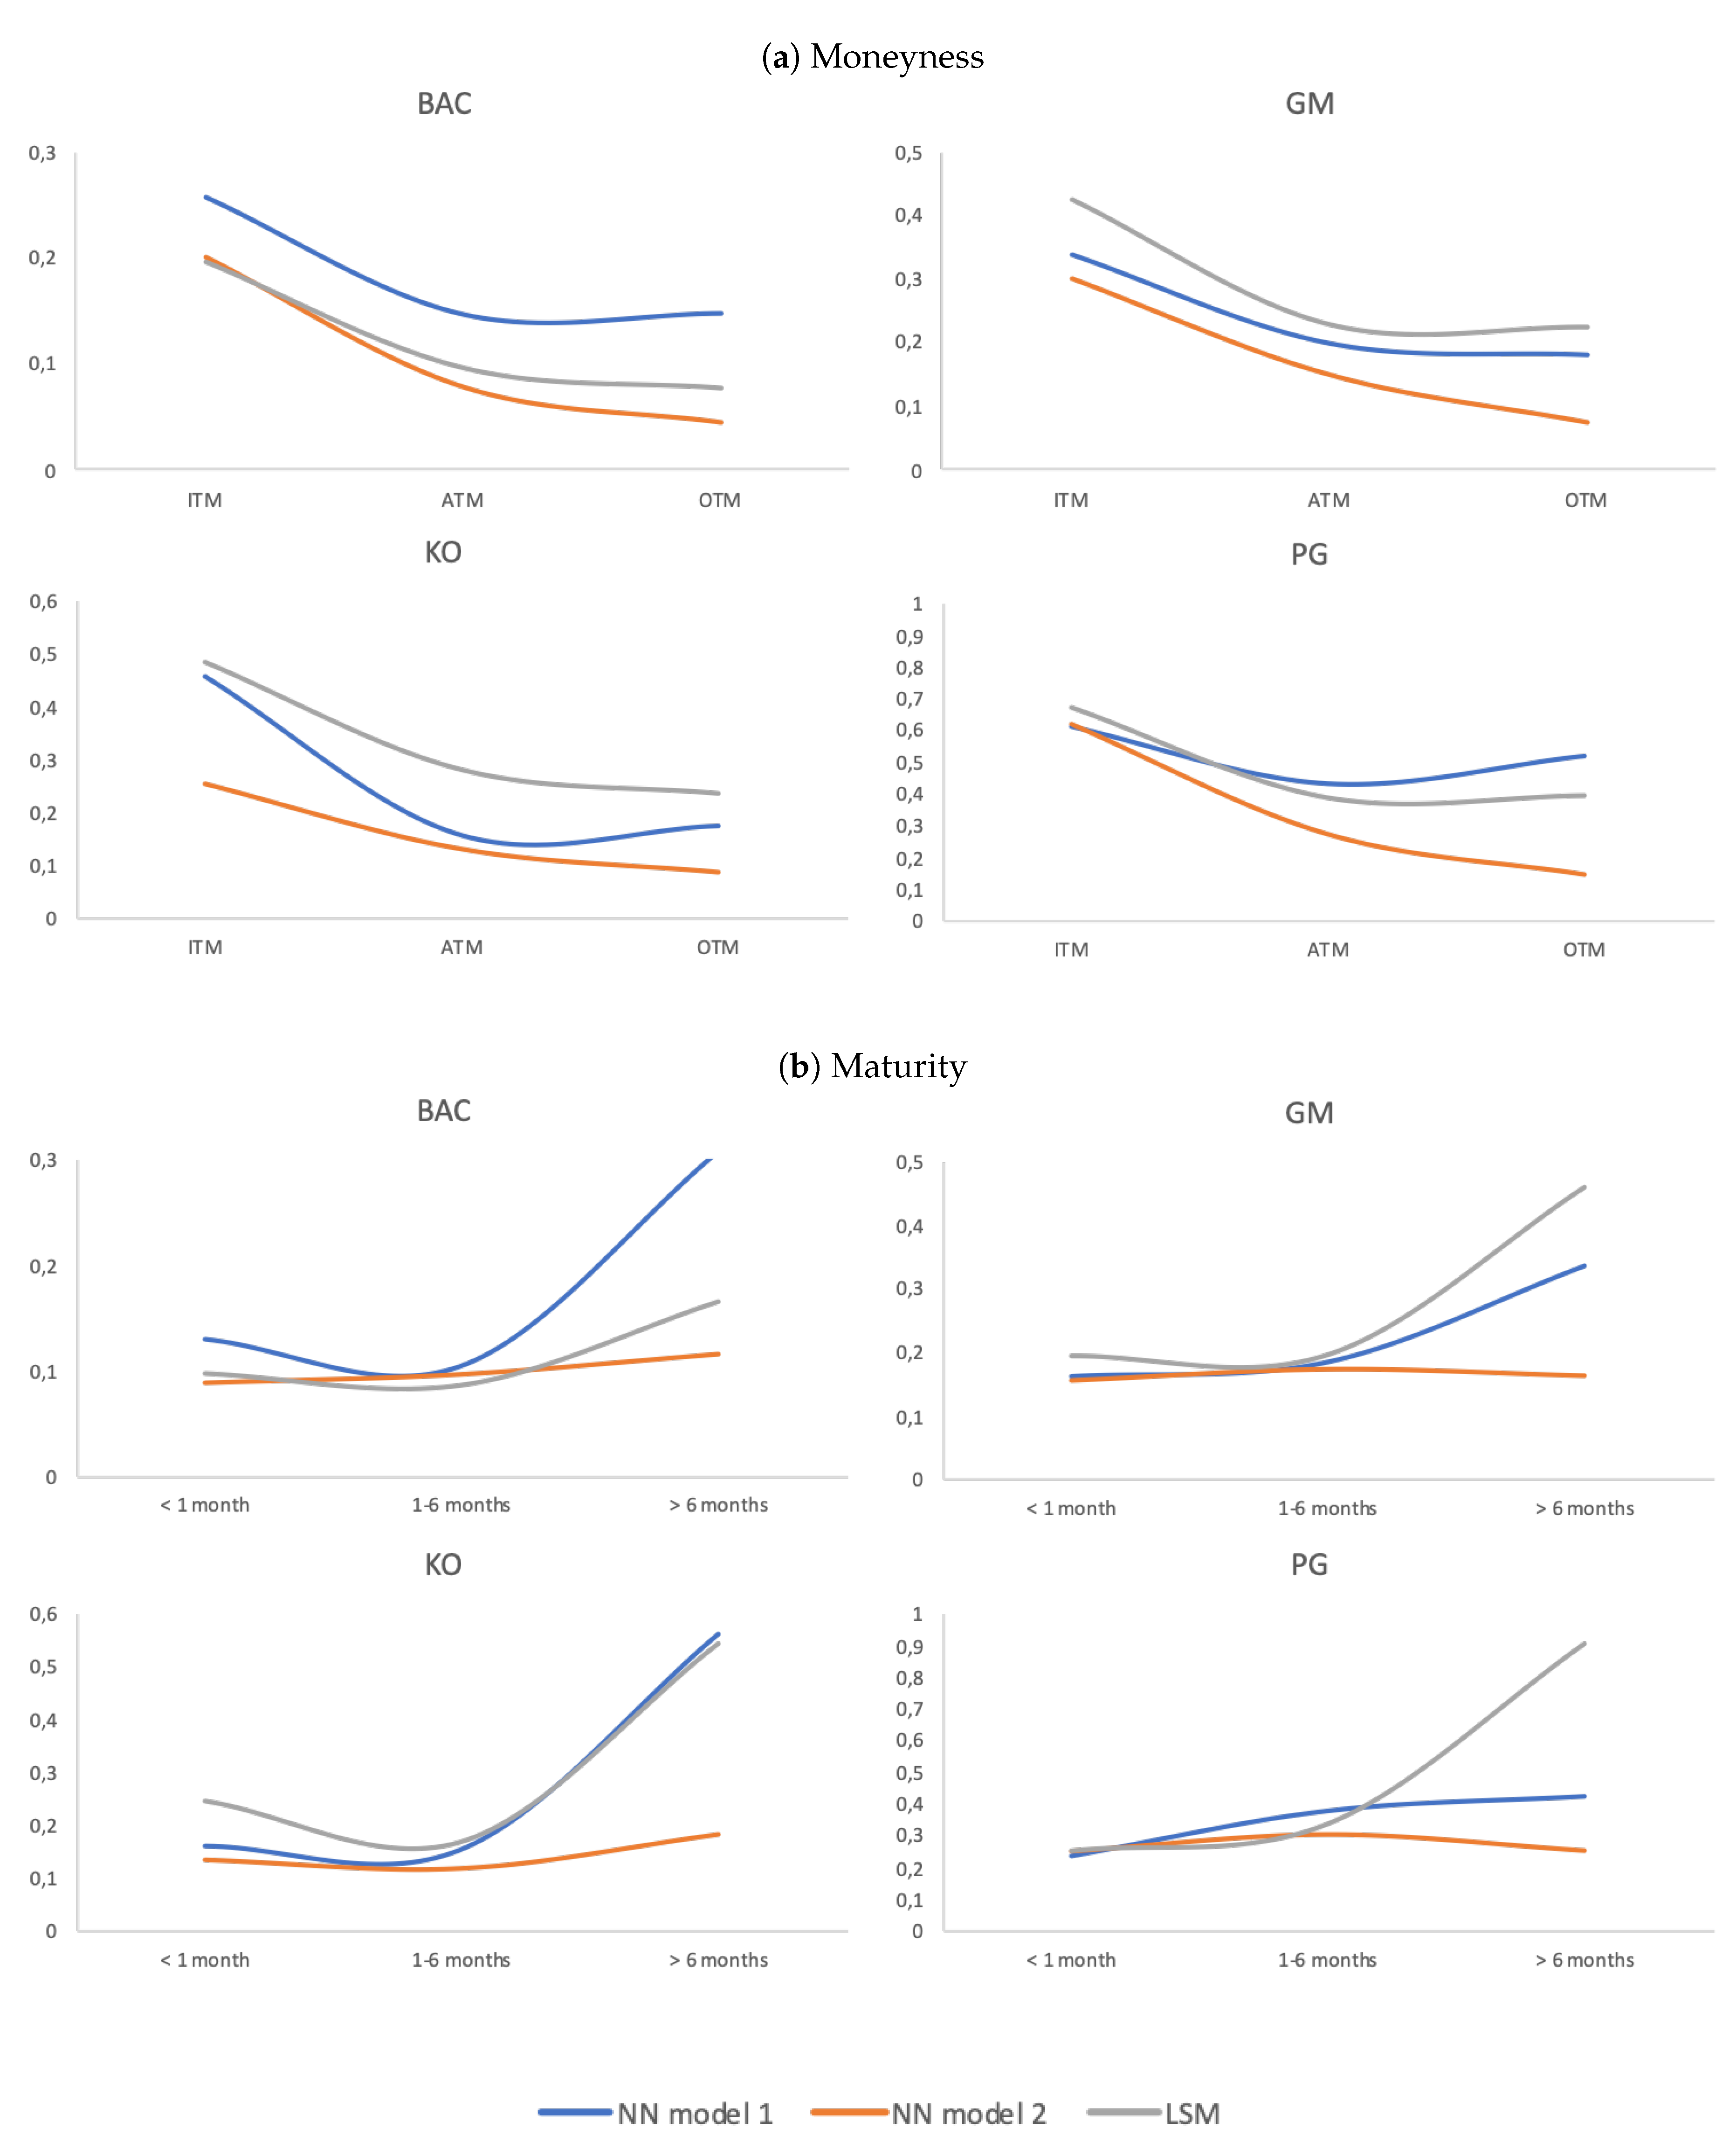
Figure 11.
Relative RMSE per company: moneyness and maturity.
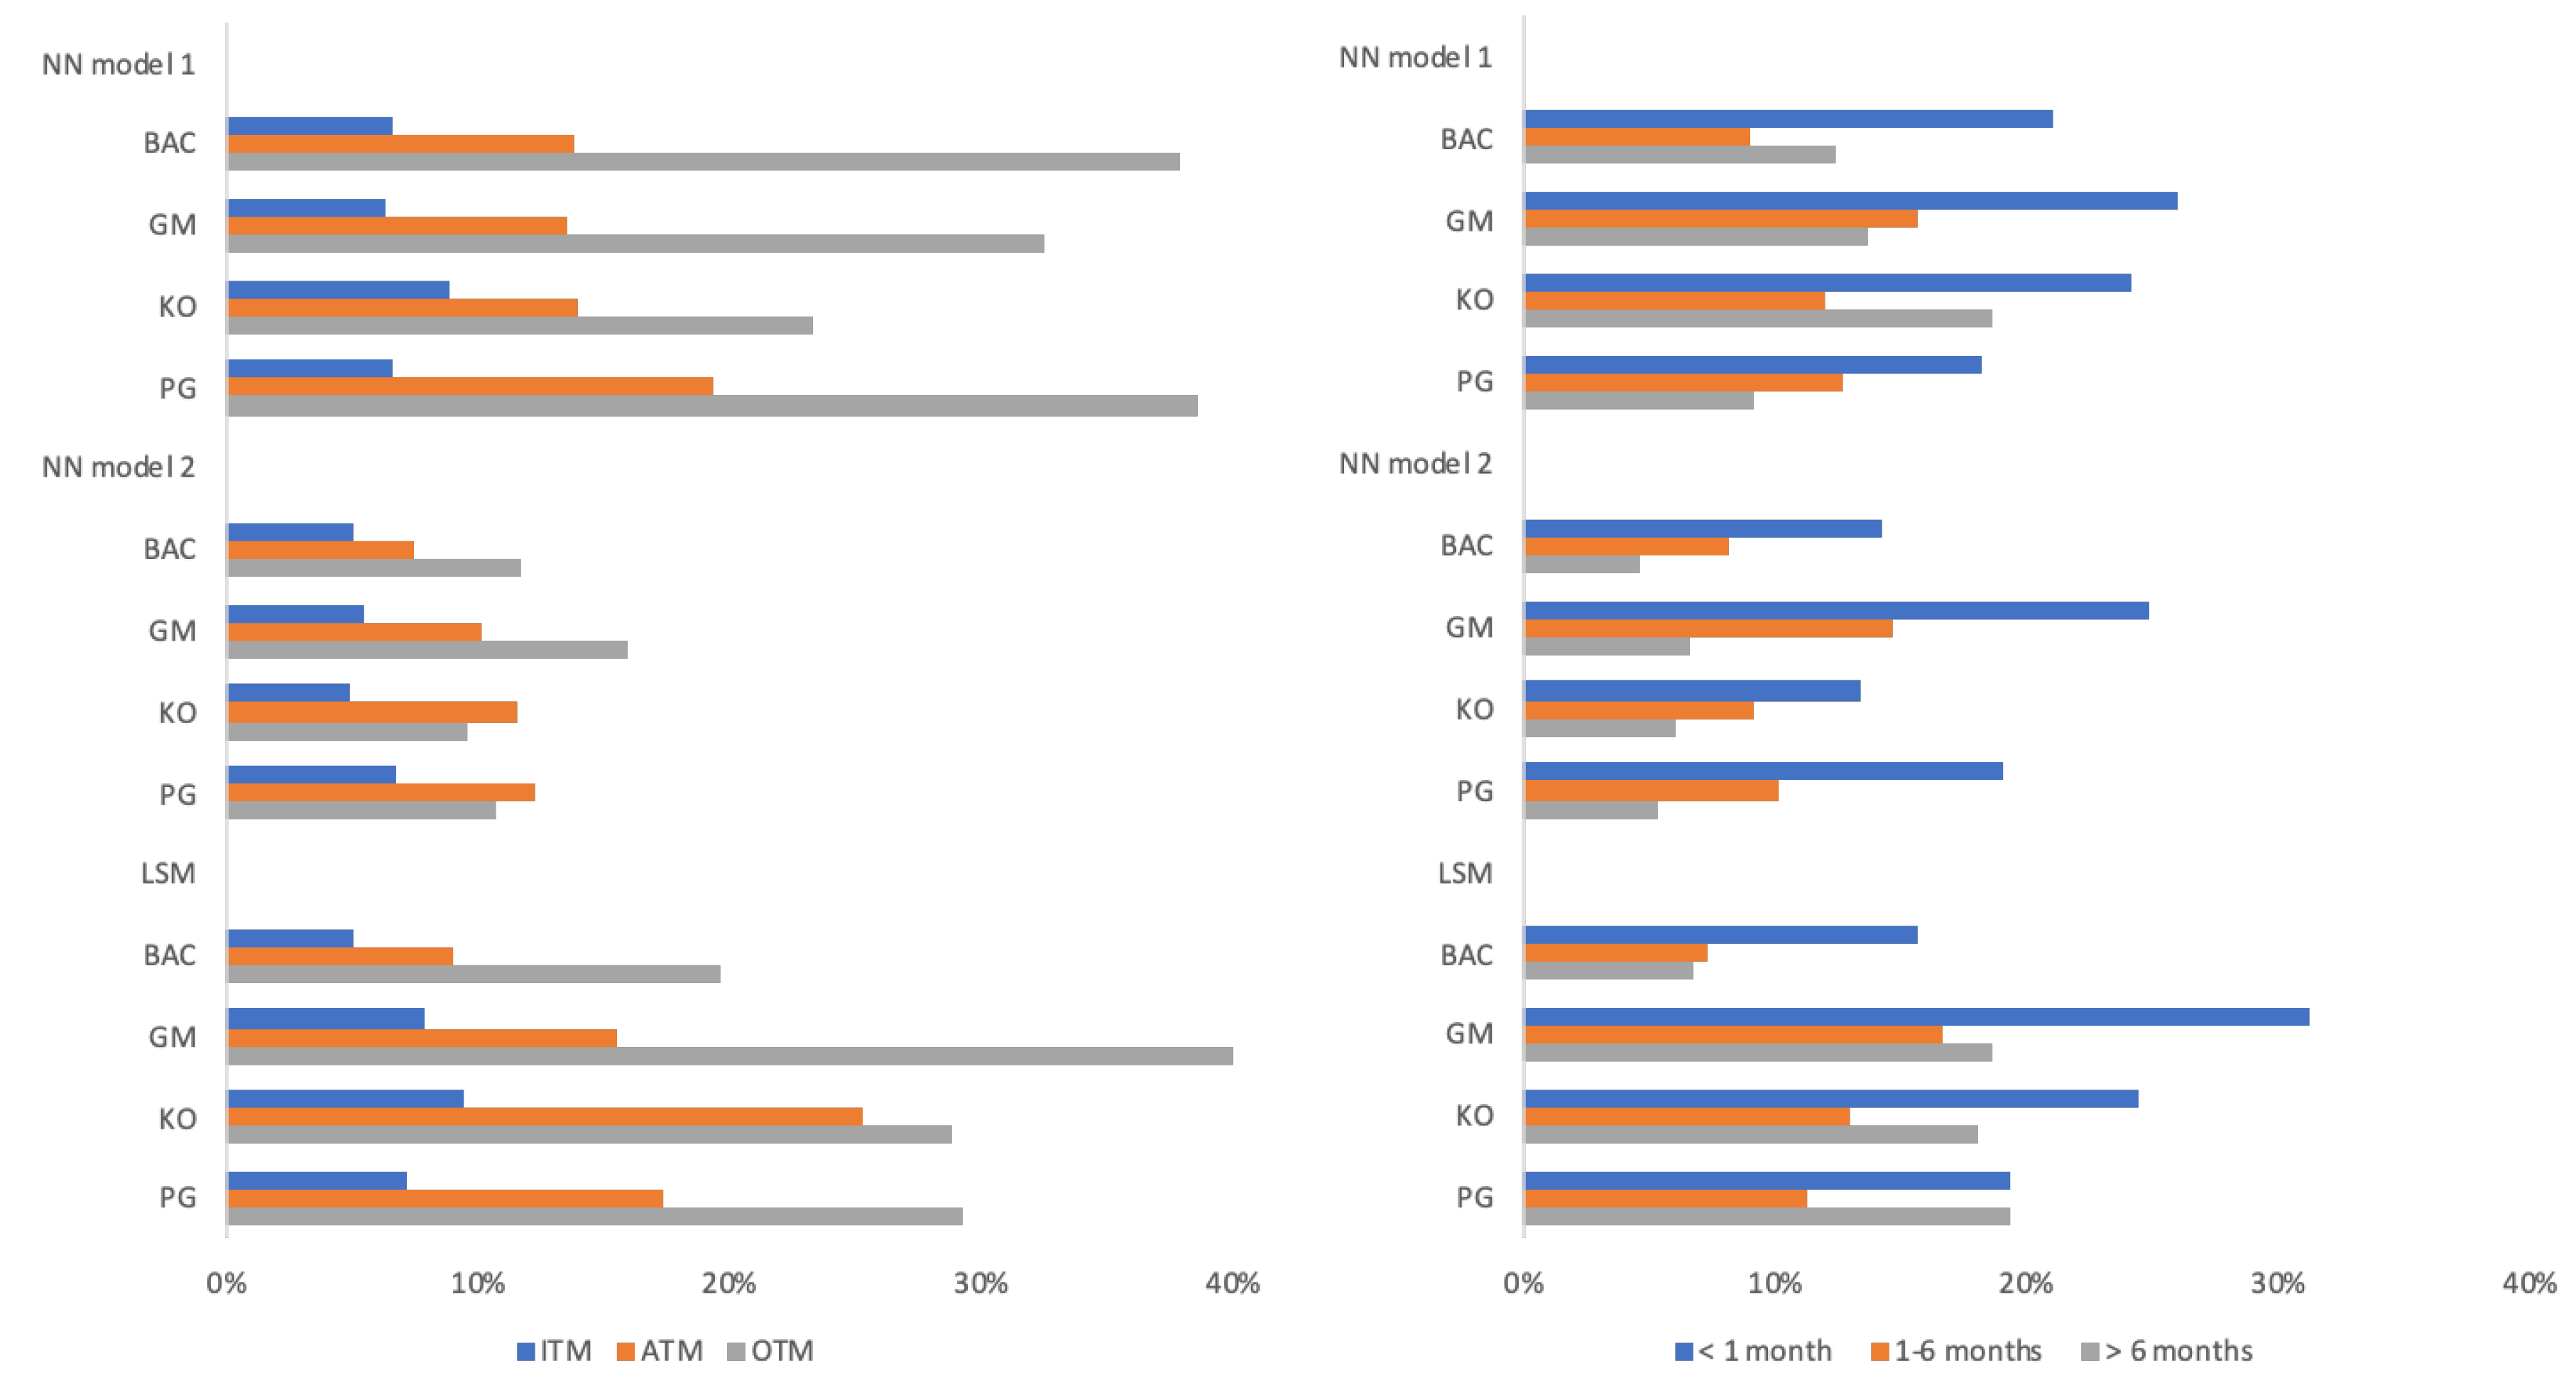
Figure 12.
Inputs’ permutation results. NN Model 1 (on the left) and NN Model 2 (on the right). The x-axis shows the increase, in percentage, of RMSE that results from considering one of the inputs randomized instead of the calibrated values.
Figure 12.
Inputs’ permutation results. NN Model 1 (on the left) and NN Model 2 (on the right). The x-axis shows the increase, in percentage, of RMSE that results from considering one of the inputs randomized instead of the calibrated values.

Table 1.
Statistics on input variables.
| Implied Volatility | Moneyness | Maturity | Dividend Yield | Interest Rate | |
|---|---|---|---|---|---|
| Mean | 0.296 | 1.056 | 113.2 | 0.034 | 0.024 |
| Std Dev | 0.105 | 0.162 | 171.9 | 0.008 | 0.001 |
| Min | 0.030 | 0.565 | 1 | 0.020 | 0.023 |
| 25% | 0.235 | 0.976 | 15 | 0.025 | 0.024 |
| 50% | 0.288 | 1.025 | 38 | 0.038 | 0.024 |
| 75% | 0.337 | 1.096 | 134 | 0.040 | 0.025 |
| Max | 2.862 | 2.268 | 779 | 0.048 | 0.028 |
Input variables: Bloomberg’s implied volatility, moneyness (ratio between stock price and strike price), maturity (time to maturity, here reported in days), dividend yields (also known as relative dividends), and the interest rate (FED risk-free rates).
Table 2.
Sample moneyness (a) and maturity (b).
| ITM | ATM | OTM | <1 Month | 1–6 Months | >6 Months | |||
|---|---|---|---|---|---|---|---|---|
| BAC | 18% | 33% | 49% | BAC | 35.18% | 43.78% | 21.05% | |
| GM | 18% | 43% | 39% | GM | 46.73% | 35.15% | 18.12% | |
| KO | 11% | 58% | 31% | KO | 38.40% | 43.25% | 18.36% | |
| PG | 5% | 71% | 24% | PG | 48.14% | 41.69% | 10.17% | |
| Total | 16% | 45% | 39% | Total | 42.72% | 39.16% | 18.12% | |
| (a) Moneyness | (b) Maturity | |||||||
Table 3.
Descriptive statistics per company.
| BAC | ||||||||
|---|---|---|---|---|---|---|---|---|
| Put Price | Imp.Vol. | Spot | Strike | Moneyness | Maturity | Div.Yield | Int.Rate | |
| Mean | 1.258 | 0.306 | 27.618 | 26.021 | 1.090 | 132.873 | 0.022 | 0.024 |
| Median | 0.620 | 0.279 | 28.306 | 26.500 | 1.047 | 49.000 | 0.021 | 0.024 |
| Std Dev | 1.764 | 0.119 | 1.644 | 4.142 | 0.207 | 181.865 | 0.001 | 0.001 |
| Min | 0.010 | 0.116 | 24.246 | 13.000 | 0.565 | 1.000 | 0.020 | 0.024 |
| 25% | 0.170 | 0.242 | 25.629 | 24.000 | 0.974 | 21.000 | 0.021 | 0.024 |
| 50% | 0.620 | 0.279 | 28.306 | 26.500 | 1.047 | 49.000 | 0.021 | 0.024 |
| 75% | 1.660 | 0.332 | 28.932 | 29.000 | 1.153 | 162.000 | 0.023 | 0.025 |
| Max | 19.400 | 2.862 | 29.480 | 45.000 | 2.268 | 743.000 | 0.025 | 0.026 |
| GM | ||||||||
| Put Price | Imp.Vol. | Spot | Strike | Moneyness | Maturity | Div.Yield | Int.Rate | |
| Mean | 1.902 | 0.336 | 37.31 | 36.175 | 1.050 | 109.743 | 0.041 | 0.024 |
| Median | 1.080 | 0.319 | 38.050 | 36.500 | 1.024 | 36.000 | 0.040 | 0.024 |
| Std Dev | 2.404 | 0.087 | 1.648 | 4.663 | 0.162 | 177.520 | 0.002 | 0.001 |
| Min | 0.010 | 0.140 | 31.933 | 18.000 | 0.578 | 1.000 | 0.038 | 0.023 |
| 25% | 0.400 | 0.287 | 36.378 | 34.000 | 0.968 | 15.000 | 0.039 | 0.024 |
| 50% | 1.080 | 0.318 | 38.050 | 36.500 | 1.024 | 36.000 | 0.040 | 0.024 |
| 75% | 2.480 | 0.363 | 38.547 | 39.000 | 1.093 | 105.000 | 0.042 | 0.024 |
| Max | 26.450 | 1.168 | 39.557 | 65.000 | 2.198 | 779.000 | 0.048 | 0.028 |
| KO | ||||||||
| Put Price | Imp.Vol. | Spot | Strike | Moneyness | Maturity | Div.Yield | Int.Rate | |
| Mean | 1.364 | 0.196 | 47.016 | 45.827 | 1.034 | 115.196 | 0.034 | 0.024 |
| Median | 0.780 | 0.182 | 46.960 | 46.000 | 1.019 | 43.000 | 0.034 | 0.024 |
| Std Dev | 1.890 | 0.059 | 1.371 | 3.995 | 0.099 | 165.670 | 0.001 | 0.001 |
| Min | 0.010 | 0.030 | 44.442 | 25.000 | 0.684 | 1.000 | 0.032 | 0.024 |
| 25% | 0.260 | 0.160 | 46.236 | 44.000 | 0.982 | 17.000 | 0.033 | 0.024 |
| 50% | 0.780 | 0.182 | 46.960 | 46.000 | 1.019 | 43.000 | 0.034 | 0.024 |
| 75% | 1.750 | 0.213 | 47.852 | 48.000 | 1.067 | 133.000 | 0.035 | 0.025 |
| Max | 20.100 | 0.761 | 49.359 | 65.000 | 1.849 | 750.000 | 0.036 | 0.026 |
| PG | ||||||||
| Put Price | Imp.Vol. | Spot | Strike | Moneyness | Maturity | Div.Yield | Int.Rate | |
| Mean | 2.354 | 0.221 | 92.891 | 90.32 | 1.033 | 77.076 | 0.031 | 0.024 |
| Median | 1.650 | 0.217 | 91.397 | 90.050 | 1.014 | 35.000 | 0.031 | 0.024 |
| Std Dev | 2.439 | 0.056 | 3.139 | 6.302 | 0.077 | 105.230 | 0.001 | 0.001 |
| Min | 0.010 | 0.090 | 89.929 | 60.000 | 0.790 | 1.000 | 0.029 | 0.024 |
| 25% | 0.710 | 0.186 | 90.454 | 87.500 | 0.992 | 14.000 | 0.030 | 0.024 |
| 50% | 1.650 | 0.217 | 91.397 | 90.500 | 1.014 | 35.000 | 0.031 | 0.024 |
| 75% | 3.080 | 0.250 | 94.840 | 94.000 | 1.049 | 100.000 | 0.032 | 0.025 |
| Max | 25.000 | 0.567 | 99.289 | 120.000 | 1.523 | 744.000 | 0.032 | 0.026 |
Statistics on output (put price) and input variables based on 21,111 American put options, traded from December 2018 to March 2019: 5302 (25.11%) are options on Bank of America Corp (BAC), 10,609 (50.25%) on General Motors (GM), 3154 (14.95%) on Coca-Cola Company (KO), and 2046 (9.69%) on Procter and Gamble Company (PG). Abbreviations: Imp.Vol = implied volatility, Div.Yield = dividend yield and Int.Rate = interest rate.
Table 4.
Kolmogorov–Smirnov by feature.
| Put Price | Imp.Vol. | Spot | Strike | Maturity | Div.Yield | Int.Rate | |
|---|---|---|---|---|---|---|---|
| p-value | 0.191 | 0.828 | 0.572 | 0.401 | 0.317 | 0.1121 | 0.88576 |
| statistic | 0.02 | 0.01 | 0.01 | 0.02 | 0.02 | 0.02 | 0.01 |
For small Kolmogorov–Smirnov statistics (high p-value), we do not reject the null hypothesis (equal distributions for both sets). Abbreviations: Imp.Vol = implied volatility, Div.Yield = dividend yield and Int.Rate = interest rate.
Table 5.
NN models.
| NN Model 1 | NN Model 2 | |
|---|---|---|
| Output variable | Put price (scaled) | Put price (unscaled) |
| Input variables | Stock price | Stock price |
| (all scaled) | Strike price | Strike price |
| Implied volatility | Implied volatility | |
| Maturity | Maturity | |
| Dividend yield | ||
| Interest rate | ||
| Dummy per company | ||
| Average (train set) put value | ||
| per company | ||
| Weights | Random: N(0, 0.5) | Random: N(0, 0.5) |
| Learning rate | ||
| w/decay per epoch of 1 × 10 | w/decay per epoch of 1 × 10 | |
| Hidden layers | 1 | 3 |
| Hidden nodes | 9 | 16, 8, and 4 |
| Activation function | ||
| Epochs | 400 | 3000 |
| Batch | 64 | 64 |
Table 6.
RMSE per model.
| NN Model 1 | NN Model 2 | LSM | |
|---|---|---|---|
| BAC | 0.166 | 0.099 | 0.112 |
| GM | 0.215 | 0.163 | 0.268 |
| KO | 0.198 | 0.139 | 0.302 |
| PG | 0.457 | 0.273 | 0.400 |
| Total | 0.223 | 0.161 | 0.259 |
Table 7.
RMSE per company: moneyness and maturity.
| ITM | <1 Month | ||||||
|---|---|---|---|---|---|---|---|
| NN Model 1 | NN Model 2 | LSM | NN Model 1 | NN Model 2 | LSM | ||
| BAC | 0.257 | 0.200 | 0.196 | BAC | 0.131 | 0.089 | 0.098 |
| GM | 0.339 | 0.300 | 0.424 | GM | 0.162 | 0.155 | 0.195 |
| KO | 0.458 | 0.254 | 0.487 | KO | 0.160 | 0.134 | 0.244 |
| PG | 0.613 | 0.622 | 0.671 | PG | 0.238 | 0.248 | 0.253 |
| ATM | 1–6 Months | ||||||
| NN Model 1 | NN Model 2 | LSM | NN Model 1 | NN Model 2 | LSM | ||
| BAC | 0.147 | 0.079 | 0.096 | BAC | 0.106 | 0.097 | 0.087 |
| GM | 0.199 | 0.149 | 0.228 | GM | 0.185 | 0.174 | 0.197 |
| KO | 0.157 | 0.130 | 0.283 | KO | 0.154 | 0.118 | 0.167 |
| PG | 0.430 | 0.272 | 0.385 | PG | 0.380 | 0.304 | 0.338 |
| OTM | >6 Months | ||||||
| NN Model 1 | NN Model 2 | LSM | NN Model 1 | NN Model 2 | LSM | ||
| BAC | 0.148 | 0.046 | 0.077 | BAC | 0.308 | 0.116 | 0.166 |
| GM | 0.181 | 0.074 | 0.224 | GM | 0.338 | 0.163 | 0.469 |
| KO | 0.175 | 0.086 | 0.238 | KO | 0.561 | 0.182 | 0.543 |
| PG | 0.519 | 0.144 | 0.392 | PG | 0.426 | 0.250 | 0.904 |
| (a) Moneyness | (b) Maturity | ||||||
Table 8.
Relative RMSE per company: moneyness and maturity.
| ITM | <1 Month | ||||||
|---|---|---|---|---|---|---|---|
| NN Model 1 | NN Model 2 | LSM | NN Model 1 | NN Model 2 | LSM | ||
| BAC | 6.56% | 5.10% | 5.00% | BAC | 21.00% | 14.27% | 15.71% |
| GM | 6.25% | 5.53% | 7.82% | GM | 25.97% | 24.85% | 31.26% |
| KO | 8.89% | 4.93% | 9.45% | KO | 24.14% | 13.40% | 24.40% |
| PG | 6.58% | 6.68% | 7.20% | PG | 18.23% | 19.00% | 19.38% |
| ATM | 1–6 Months | ||||||
| NN Model 1 | NN Model 2 | LSM | NN Model 1 | NN Model 2 | LSM | ||
| BAC | 13.87% | 7.45% | 9.05% | BAC | 8.96% | 8.20% | 7.35% |
| GM | 13.60% | 10.18% | 15.58% | GM | 15.64% | 14.71% | 16.65% |
| KO | 14.01% | 11.60% | 25.25% | KO | 11.99% | 9.19% | 13.01% |
| PG | 19.36% | 12.25% | 17.33% | PG | 12.69% | 10.16% | 11.29% |
| OTM | >6 Months | ||||||
| NN Model 1 | NN Model 2 | LSM | NN Model 1 | NN Model 2 | LSM | ||
| BAC | 37.78% | 11.74% | 19.66% | BAC | 12.44% | 4.69% | 6.71% |
| GM | 23.32% | 9.53% | 28.86% | GM | 13.66% | 6.59% | 18.59% |
| KO | 32.46% | 15.95% | 44.14% | KO | 18.59% | 6.03% | 17.99% |
| PG | 38.60% | 10.71% | 29.16% | PG | 9.08% | 5.33% | 19.27% |
| (a) Moneyness | (b) Maturity | ||||||
Table 9.
Inputs’ relative importance.
| Input Variables | NN Model 1 | NN Model 2 |
|---|---|---|
| Stock price | 45.92% | 29.66% |
| Strike price | 48.31% | 32.75% |
| Implied volatility | 0.64% | 1.51% |
| Maturity | 5.14% | 5.72% |
| Dividend yield | 1.73% | |
| Interest Rate | 0.15% | |
| Company_BAC | 5.79% | |
| Company_GM | 6.03% | |
| Company_KO | 7.65% | |
| Company_PG | 4.16% | |
| Average (train set) put value | 4.84% |
© 2020 by the authors. Licensee MDPI, Basel, Switzerland. This article is an open access article distributed under the terms and conditions of the Creative Commons Attribution (CC BY) license (http://creativecommons.org/licenses/by/4.0/).
Share and Cite
MDPI and ACS Style
Gaspar, R.M.; Lopes, S.D.; Sequeira, B. Neural Network Pricing of American Put Options. Risks 2020, 8, 73. https://doi.org/10.3390/risks8030073
AMA Style
Gaspar RM, Lopes SD, Sequeira B. Neural Network Pricing of American Put Options. Risks. 2020; 8(3):73. https://doi.org/10.3390/risks8030073
Chicago/Turabian StyleGaspar, Raquel M., Sara D. Lopes, and Bernardo Sequeira. 2020. "Neural Network Pricing of American Put Options" Risks 8, no. 3: 73. https://doi.org/10.3390/risks8030073
Note that from the first issue of 2016, this journal uses article numbers instead of page numbers. See further details here.