Liquidity Risk Drivers and Bank Business Models


1
Department of Economics, University of Messina, Piazza Pugliatti, 1, 98122 Messina, Italy
2
Department of Economics and Business, University of Catania, Corso Italia 55, 95129 Catania, Italy
*
Author to whom correspondence should be addressed.
Risks 2019, 7(3), 89; https://doi.org/10.3390/risks7030089
Submission received: 27 June 2019
/
Revised: 21 August 2019
/
Accepted: 23 August 2019
/
Published: 25 August 2019
Abstract
:This paper examines the bank liquidity risk while using a maturity mismatch indicator of loans and deposits (LTDm) during a specific period. Core banking activities that are based on the process of maturity transformation are the most exposed to liquidity risk. The financial crisis in 2007–2009 highlighted the importance of liquidity to the functioning of both the financial markets and the banking sector. We investigate how characteristics of a bank, such as size, capital, and business model, are related to liquidity risk, while using a sample of European banks in the period after the financial crisis, from 2011 to 2017. While employing a generalized method of moment two-step estimator, we find that the banking size increases the liquidity risk, whereas capital is not an effective deterrent. Moreover, our findings reveal that, for savings banks, income diversification raises the liquidity risk while investment banks reliant on non-deposit funding decrease the exposure to liquidity risk.
JEL Classification:
G21; G28; G18; G321. Introduction
The 2007–2009 financial crisis highlighted the vulnerability of banks to liquidity risk and the implications of banking business models. During the crisis, the identification of proper risk management for different business models was challenging (Altunbas et al. 2011). Moreover, banks that exhibited traditional characteristics during the financial turmoil had a “survival advantage” (Chiorazzo et al. 2018). This led to the need for specific regulation regarding both the management and measurement of liquidity risk with a view to achieving greater stability in the financial system.
In 2013, the Basel Committee on Banking Supervision (BCBS 2013) introduced two indicators for the minimum requirements of liquidity. The document concerning the first requirement was published in 2013, “Basel III: The Liquidity Coverage Ratio and liquidity risk monitoring tools”, and in 2014, the Basel Committee on Banking Supervision (BCBS 2014) published “Basel III: The Net Stable Funding Ratio”.
Although the indicators cover different timeframes, they have a complementary effect, that is, they ultimately perform the same function. Liquidity Coverage Ratio (LCR) refers to high-quality short-term cash (HQLA) by considering a 30-day timeframe during a significant stress scenario. The Net Stable Funding Ratio (NSFR) aims at decreasing funding risk, while considering a timeframe of a year (Blundell-Wignall et al. 2014). Therefore, we have highlighted the complementary function of the two requirements: The LCR applies to liquid asset quality during a one-month stress period; the NSFR helps long-term resilience over one year, during which time the banks must be able to finance their activities while using sufficiently stable sources and stabilizing both the assets and liabilities of the balance sheet.
Following the definitions of the two liquidity requirements, we computed the loan-to-deposit (LTD) ratio in order to consider at least one of the two significant time spans using maturity mismatches. In this field of study, some scholars provided observations on liquidity creation before and during the crisis (Berger and Bouwman 2009; Berger et al. 2016; Brunnermeier 2009), whereas, in the aftermath of the 2008 Global Financial Crisis, the main determinants of the mismatch between market liquidity of assets and the funding liabilities of credit co-operative Italian banks was investigated (Vento et al. 2016). Other studies have examined the link between profitability and performance in different banking business models (Roengpitya et al. 2014, 2017).
This study lies between the previous two (Berger et al. 2016; Roengpitya et al. 2017), because it analyzed banking liquidity risk while using a new proxy, which has been applied to different bank business models. Moreover, this research aims at extending studies on liquidity risk, across an unbalanced panel dataset of 4844 European Union (EU) banks during a specific period, from 2011 to 2017.
There are several reasons for our decision to analyze liquidity risk in the European banking system and in the period identified. In the EU countries, non-financial companies rely more on bank credit, as a funding source, than in other contexts, such as America, in which financial markets grant finance for business a predominant role.
Although the European banking system is structurally homogeneous, it is characterized by banks with significant operating differences and different levels of risk resilience. Some banks have better capital instruments and liquid assets than other banks, with different compliance and competitiveness costs. In some European countries, a significant impact of non-performing loans on banks’ balance sheets (Greece, Cyprus, Portugal, Italy, and Bulgaria) and weak economic conditions (e.g., sovereign debt on GPD) affect banks’ liquidity risk differently.
In the aftermath of the 2008 Global Financial Crisis, the general idea that governments’ response to sovereign debt crisis was inadequate became widespread. The year 2011 is remembered for the tough economic and financial conditions, regarding the growing difficulty for banks in obtaining funds for the various EU Member States. At first, the data showed a monetary expansion, together with copious liquidity. If the economic recovery progressed with the strengthening of domestic demand in the early part of the year, in the second half of the year, the euro area macroeconomic conditions got worse due to the exacerbation of sovereign debt market tensions. The worsening of this debt and its impact on the banking sector generated new risks for financial stability, which implies a domino effect on the larger countries of the area. The prospect of global growth and the sustainability of public finances were both affected. Given these circumstances, the Governing Council of the European Central Bank (ECB) was prompted to adopt non-standard monetary policy measures to avoid adverse repercussions and to implement new liquidity provision measures. Lastly, in response to the global financial crisis, the European Systemic Risk Board (ESRB) was created—an EU macro-prudential supervisory body that is responsible for both the detection and estimation of systemic risks, as well as the development of warning systems (ECB 2012).
In our study, we empirically analyzed the main drivers of the LTD ratio maturity mismatches (LTDm), testing whether the bank size and capital affect LTDm and verifying the existence of differences in the bank business models. We measured flow over time because balance sheet measures do not account for a bank’s capacity to access funding sources. This would help in detecting changes through a more accurate approach, instead of using static balance sheet ratios. Therefore, as a proxy of LTDm, we divided the short-term loans (i.e., three months) by the long-term deposits (i.e., between three and twelve months).
Considering the maturity mismatches in LTD is a step forward for risk management. As financial institutions consider liquidity risk an integral part of their operations, they are able to understand whether different types of banks have the same influence on the relationship between the loans granted and the deposits collected. Banks usually face disparate kinds of risk, as their nature changes in accordance with the characteristics of each business. However, holding much more capital and liquidity buffer is needed to tackle future distress (Scannella 2012). As widely adopted in numerous scientific research studies, we compared our measurement of liquidity risk with several dependent variables; we employed a dynamic panel regression model with clustered heteroscedasticity standard errors at the bank level, while using both fixed-effect and random-effects models.
This paper is structured, as follows: Section 2 examines the corresponding literature, Section 3 provides the descriptive data analysis, Section 4 presents the model specification and methodology applied, and Section 5 contains the preliminary results. In Section 6, we propose the robustness test and in Section 7, we deal with the endogeneity issue. Finally, Section 8 contains our conclusions.
2. Theoretical Background
Although a large, growing body of literature on bank liquidity risk is available, throughout the years, scholars have implemented different approaches for measuring such risk. Indeed, Tirole (2008) claimed that it is not easy to summarize the risk of liquidity in a single measure. The literature proposed several indicators that aimed at representing the liquidity position of a bank (Barth et al. 2003; Molyneux and Thornton 1992; Bourke 1989). Kosmidou et al. (2005) expressed liquidity risk exposure as the “deposit run off ratio”, indicating that a higher value in the ratio would mean lower vulnerability in terms of liquid assets. In line with this view, Pasiouras and Kosmidou (2007) defined liquidity risk applied to EU banks as the share of illiquid assets (i.e., granted loans) covered by short-term liabilities.
Several studies have investigated the phenomenon of liquidity risk from macroeconomic and microeconomic perspectives, highlighting the main determinants and effects.
From the macroeconomic point of view, Van den End (2016) decomposed the LTD ratio into numerator (loans) and denominator (deposits). He showed that an increase in LTD was due to loan growth that is partly financed by non-deposit funding, which mostly happened in the economic upswing. The opposite occurred during the economic downturn when a rise in deposits lowered the liquidity risk. Demirgüç-Kunt et al. (2003) used the ratio of liquid assets on total assets in order to estimate the effect of regulation and banking concentration. Chen et al. (2018) investigated the liquidity risk related to both regulation and macroeconomic drivers. A further macro key factor is geography. In fact, developing countries were shown to have a different liquidity risk cause to developed nations due to macroeconomic factors, like unemployment, education levels, and financial literacy. In this regard, Singh and Sharma (2016) argued that the liquidity problem was a matter of “customer insecurity” rather than bank inefficiency.
From a microeconomic point of view, the literature focus on bank-specific factors is twofold. Some scholars detected the main drivers of liquidity risk, whereas other studies identified which banks’ business models were related to performance and profitability (Roengpitya et al. 2017; Mergaerts and Vennet 2016; Beck et al. 2013). Scholars have also investigated the main determinants of liquidity risk (Bonfim and Kim 2012) by focusing on efficiency (Fiordelisi et al. 2011). Matz and Neu (2007) applied the cash capital position and implemented balance sheet liquidity analysis in order to investigate the degree of liquidity of both assets and liabilities.
Literature regarding the main drivers of liquidity risk prospered thanks to other contributions. It has been found that bigger banks are not riskier (Birindelli et al. 2018; Bertay et al. 2013; Mercieca et al. 2007; Demsetz and Strahan 1997). On the other hand, studies have shown that larger banks are less stable (Battaglia et al. 2014; De Haan and Poghosyan 2012). We expect a positive sign for the banking size coefficient, which means that larger banks tend to increase their liquidity risk, thus we posit:
Hypothesis 1.
Banking size is negatively related to liquidity risk.
New studies on the construction of a more comprehensive and dynamic liquidity risk measure started soon after the publication of the document, “Principles for Sound Liquidity Risk Management and Supervision” by the Basel Committee on Banking Supervision (BCBS 2008). Indeed, Resti and Sironi (2011) contributed to the literature by analyzing funding liquidity risk with three Basel approaches: (1) the stock approach (calculating the cash capital position), (2) the cash-flow approach (difference between convertible assets and volatile liabilities), and (3) the hybrid approach (liquidity gap plus asset disposal). Following the same document, Berger and Bouwman (2009), considered time and cost for the creation of bank liquidity, and found that capital positively contributes to liquidity creation in large banks. In a more recent study, Khan et al. (2017) highlighted that well-capitalized banks exhibit lower liquidity risk. A negative sign for capital coefficient is expected, because a higher level of capital mitigates liquidity exposure; hence, we proposed the following:
Hypothesis 2.
Well-capitalized banks should suffer less liquidity risk.
In accordance with the regulatory framework of Basel III, recent research has focused on: maturity mismatches as a liquidity measure, using the maturity ladder (De Haan and Van den End 2013); the difference between quickly convertible assets and liabilities (Valverde et al. 2016; Imbierowicz and Rauch 2014); and, market liquidity conditions (Bai et al. 2018). Bonner et al. (2015) found significant relationships between liquidity buffers and both higher lending volumes and higher interest rates; that is, between the bank size and business model, respectively. Ayadi et al. (2016) indicated lower values in the NSFR in wholesale and investment banks, but higher ones in retail-oriented banks.
Few studies have investigated the relationship between risk and business models; in particular, they consider default risk rather than specific bank risks. For this reason, in this particular field, the literature is still mixed. With regard to business models, Mergaerts and Vennet (2016) recommended an in-depth investigation of bank business models regarding post-crisis regulatory and supervisory practices. A traditional funding structure, namely that of retail-oriented banks, ensures both profitability and stability banking in the long run. The resilience that is associated with the latter business model, to a large degree, depends on the creation of a lasting lending and strong deposits relationship. The benefits of shifting to a retail-funded model are also proven by reduction in default risk, as shown in a study by the European Central Bank (ECB 2016). This study focused on the duo, “stability-performance”, through bank business models, analyzing changes before and after the crisis in the euro area. Larger and more retail-oriented banks showed a lower default risk, which is exactly what happens when financial institutions adopt a diversification strategy for income sources. During the pre-crisis period, income diversification policy led to an increase in default risk, whereas, throughout and after the downturn, the importance of being a larger bank declined. However, there is evidence concerning the riskiness of investment models both before and during the crisis. Banks that appeared to be less risky before the financial crisis ended up being the riskiest (Hryckiewicz and Kozlowski 2017). Moreover, holding higher deposits (i.e., relationship deposits) is correlated with low risk, whereas wholesale funding is linked to higher risk (Kok et al. 2016). A study of different bank business models in 15 EU countries showed that non-traditional activities that were produced by smaller banks ensure stability, whereas investment-oriented institutions are more likely to be risk-exposed by definition (Köhler 2014).
Moreover, the impact of business models on liquidity risk is expected to vary; in particular, savings banks, as opposed to commercial and investment banks, are less likely to suffer liquidity exposure, and thus display negative signs. Accordingly, we posit the following:
Hypothesis 3.
Commercial and investment banks are positively related to liquidity risk, unlike savings banks.
Because of Basel III, concern for liquidity risk management has grown to widen and deepen the way in which European banks and supervisory authorities deal with a liquidity stress scenario in different banking activities. Whether differences in bank business models affect liquidity risk remains an unresolved issue. We proposed different estimation techniques and dealt with the endogeneity issue, while employing a generalized method of moments estimator as a more suitable approach in this type of study. Moreover, this research differs from previous studies in that it takes a disaggregated indicator of loans and deposits maturities as liquidity risk proxy, and it investigates the impact of business models on maturity mismatch risk.
3. Data
The objective of our analysis is to detect, through the use of maturity mismatch, whether bank size and capital affect liquidity risk, and if there are significant differences between business models. Computing maturity transformation is challenging due to the unavailability of many maturities data on both assets and liabilities sides (De Haan and Van den End 2013).
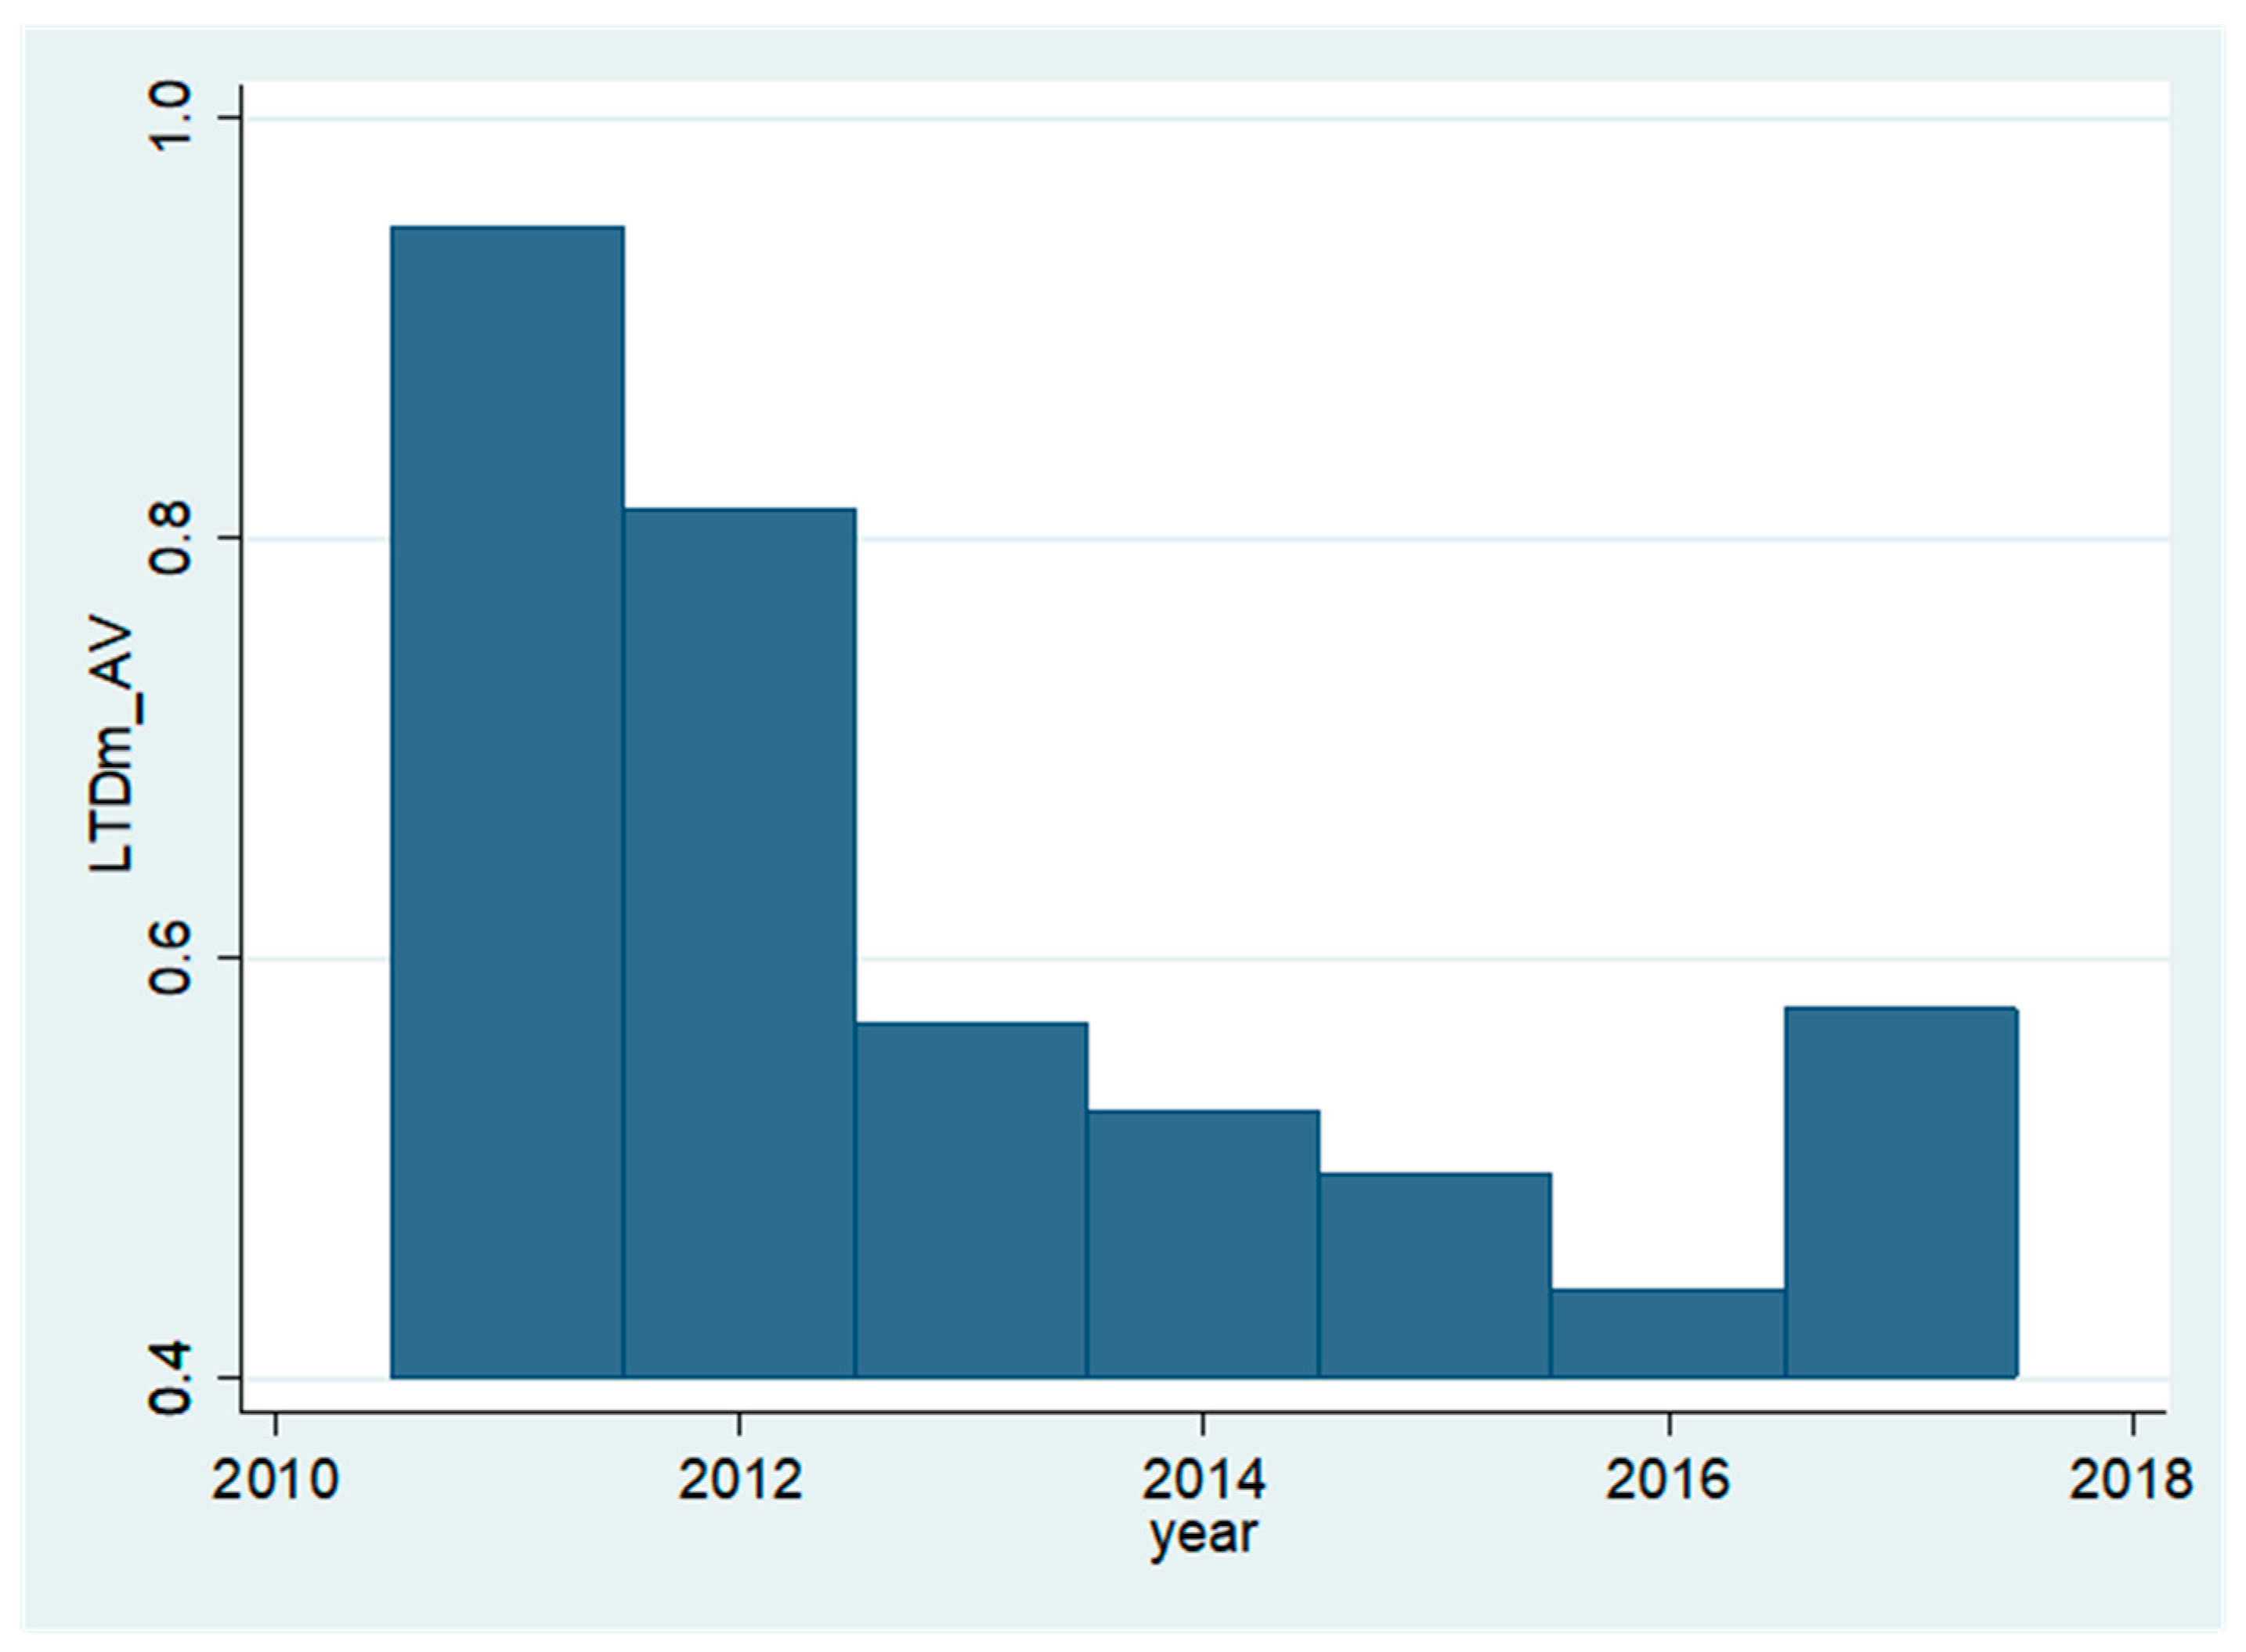
The main dataset considers European banks over a seven-year period, from 2011 to 2017. The banks selected are from the Bureau van Dijk 2018 (BvD 2018) Orbis Banks database, excluding central banks. Outlier values are likely to distort the relation given that, all variables—except dummy variables—are winsorized at the 99th percentile—as most of the literature does (Khan et al. 2017; Nguyen et al. 2017; Köhler 2015; Berger and Bouwman 2009). In addition, we showed an LTDm trend with a time-series graph (Figure A1 in Appendix A) and found that the average values of LTDm demonstrated that liquidity risk increased up until 2010/2011, whereas it decreased afterward. This is consistent with Bai et al. (2018), who showed that before the financial distress, banks created liquidity to the detriment of post-crisis times, that is, generating instability afterward.
The dataset included both listed and unlisted banks. Table 1 presents the descriptive statistics for the variables. The liquidity risk indicator is the ratio between short-term loans and long-term deposits. Moreover, we include two other dependent variables, that is, total loans over total deposits and short-term borrowing (LTDST) and liquid assets over deposit and short-term borrowing (LADST), as liquidity proxies widely used in the literature. We compared these three variables, because we believed that considering maturity mismatch through LTDm is a better proxy in measuring liquidity risk. As independent variables, we include a natural logarithm of total assets, which accounts for bank size, and TIER, which indicates bank capital and specialization dummies. In accordance with the (BvD 2018) Orbis Bank Focus classification (Köhler 2015), we choose commercial, investment, and savings banks as businesses models, including them as specialization variables.
The three dummy variables account for bank business models, while taking the value of one when the specialization is equal to commercial, investment, or savings banks; otherwise, the value was zero. The classification of the specialization dummies has been taken from the (BvD 2018) Orbis Bank Focus database. In particular, commercial banks’ activities are mostly based on the lending and deposits relationship; on the contrary, investment models have a diversified government portfolio, and their predominant activities rely on non-deposit funding. However, commercial and investment banks are both characterized by an investment-oriented business model, which considers shareholders’ interests in order to maximize profits (Köhler 2015). Rather, saving banks not only base their activity on the increase of customer deposits, i.e., deposit-oriented, but also on the granting of loans. Indeed, saving banks have a more deposit-oriented business model that is focused on stakeholders’ interests.
As control variables, we consider cost-to-income for efficiency, two profitability measures (i.e., return on assets (ROA) and net interest margin (NIM)), and risk-weighted assets (RWA), which account for operational, market, and credit risks. Adding this set of variables helps us to deal with the omitted variable problem. The average level of LTDm in European banks was 38%. The average natural logarithm of the total assets is 14.65. Return on assets constitutes 3.8% of the total assets. Income structure was expressed as the share of non-interest income in the total operating income, whereas the share of non-deposit funding considers different types of funding, rather than customers. Appendix A shows the data sources and classification for all the variables used in this study. Before carrying out dynamic panel regression analysis, we performed a pair-wise correlation of the variables to check for the presence of multicollinearity. The correlation matrix is presented in Table 2. The correlation can be given by the composition of the variables; as most of them are financial ratios, the total assets are included in their construction. Correlation coefficients in bold are significant at the 5% level, and they are mostly <|0.5|, which suggests small or medium strength correlation. Therefore, a severe multicollinearity issue in our data does not exist. The correlation coefficients of the liquidity risk variables were (1) LTDm, (2) LTDST, and (3) LADST, with the proportion of banking sizes being 0.258, 0.247, and 0.239, respectively. In addition to the pair-wise correlation test of multicollinearity, we also conduct the Variance Inflation Factor (VIF) and Tolerance Test Statistics. Table A2 in the Appendix A reports two columns: VIF and Tolerance values, which are the reciprocal of VIFs. This last parameter ranks between zero and one. The higher the tolerance index, the lower the variance that the independent variable shares with the others, and the larger the contribution that it can make to the explanation of the dependent variable. A smaller value, however, indicates a lot of variance with the other variables, so the contribution is usually more limited. A particularly low tolerance value may be indicative of variables that are likely to cause computational problems in the estimation of regression coefficients. However, the low VIF values indicate low collinearity; for high values, the collinearity is high. As a rule of thumb, up to the value 3, the situation can be tolerated; exceeding the threshold, the values between 5 and 10 are indicative of strong collinearity.
Previous findings showed that bank stability depends on the bank’s income and funding structure. By looking into funding structure, we want to test whether LTDm depends on other variables, such as bank size and capital. Furthermore, our model includes dummy variables of banking specializations.
4. Model and Methodology
Multiple regression analysis allows for us to verify the presence of statistic-dependent connections between several variables: dependent and multiple independent variables.
We first tested the hypothesis of banking size and capital support, on the different liquidity risk dependent variables in order to identify what the drivers of the LTD ratio maturity mismatch were. Thus, we thus estimated the following dynamic panel regression model with clustered heteroscedasticity and standard errors at the bank level in order to account for the serial correlation of the dependent variable for each bank.
where LRit is the dependent variable, which indicates: (1) the loan to deposit ratio maturity mismatch (LTDm), (2) the loan to deposit and short-term funding ratio (LTDST), and (3) the ratio between the liquid asset and deposit and short-term funding (LADST) of bank I in year t. We add the independent variables for banking size, capital, and specialization dummies to the coefficients associated with the control variables. Furthermore, δt is a year dummy and αi is a bank specific fixed effect. Including the fixed effects takes into account bank characteristics that do not vary over time. Moreover, dynamic panel estimations and using a lagged dependent variable certainly help mitigate concern about persistency and the correlation of past and future values of error terms.
LRit = αi + γLRit−1 + β1LNTAit + β2TIERit + β3SPECit + β4ROAit + β5NIMit + β6RWAit + β7CINCit + δt + εit,
The LTDm is created to analyze the profiles of the loans as related to the customers and interbank, on deposits of the same categories with maturities starting from three to 12 months. If the short-term loans (i.e., less than 3 months) are neither covered by the three-month nor by the long-term deposits, the institution’s chance of liquidity risk increases. Therefore, the higher the ratio, the less liquid the bank is. Thus, we used LTDm to account for the bank’s capacity to access funding sources. As banking activity is characterized by a demand for deposit funding, determining maturities is the main problem of the banking book composition, where “duration” becomes the key factor in portfolio management. Consequently, as required by Basel III, this indicator is optimized for its time reference. This makes LTDm, as compared to global indicators, a better expression of the phenomenon that we have chosen to study.
We ran a dynamic panel regression with LTDm, LTDST, and LADST as the dependent variables; after that, we included bank business models to establish how liquidity risk was linked to the nature of banking activities, and whether different business models affected bank liquidity risk-taking. We assumed that there was a persistence of liquidity risk, so we added the dependent variable as a lagged regressor to our model. The preferred statistical software in conducting this empirical research was STATA 13 (StataCorp. 2013 Release 13, StataCorp LP, Statistical Software. College Station, TX, USA).
5. Preliminary Results
As outlined in this section, we investigated the main drivers of the loan to deposit ratio maturity mismatch (LTDm), by estimating a dynamic model with fixed effect regressions using the full sample. Table 3, models 1 to 3 and models 7 to 9, reports the results of the fixed-effect model estimation with a dynamic component. A negative outcome of the estimated coefficients positively affected the liquidity risk, reducing it thanks to a lending contraction or a rise in deposit-taking, because our dependent variable, namely LTDm, was made up of loans and deposits at numerator and denominator, respectively. Conversely, positive coefficients would raise the ratio, leading to an increase in liquidity risk.
Table 3 shows that the liquidity risk is negative related to the increase in bank asset size, as indicated by the significant relationship of the natural logarithm of the total assets, LTDm at the 1% significance level (see Table 3, Panels 1 and 4). The coefficient that is associated with natural logarithm of total assets (LNTA) indicates that, if the size increases by 1%, we foresee an increase in liquidity risk by 0.005401. This supports our first hypothesis and is also consistent with the aforementioned theoretical background of larger banks being riskier (Battaglia et al. 2014; De Haan and Poghosyan 2012). Moreover, the probability of moral hazard will rise if larger banks increase their lending activity at a lower franchise, whereas holding adequate levels of capital contributes not only to a decrease in liquidity risk but also to a reduction in the incidence of eventual losses. Depositors always pay the cost of bank inefficiency, which in exchange produces a high return for the banks; deposit-rate ceilings help to reduce risk-taking incentives by expanding the franchise, in order to enable banks to choose prudent assets and mitigate moral hazard (Hellmann et al. 2000). The negative and high statistical significance of TIER would support our second hypothesis (i.e., well-capitalized banks should suffer less liquidity risk), but, as the coefficient that is associated with capital produced small values (see Table 3, Panel 1), we can conclude that this variable had a lower impact on mitigating liquidity risk than the previous literature had foreseen (Berger and Bouwman 2009). Specification models 4 to 6 were estimated with random effects in order to account for the bank specialization dummies. This is because, in a fixed-effects panel regression using the fe option, time-invariant predictors will be cancelled out due to collinearity with fixed effects. “Industry” does not vary within our panels because each bank belongs to the same specialization, and is correlated with fixed effects. With respect to the business models, savings banks are involved in activities that lower LTDm by an average of 0.065% (see Table 3, Panel 4). Using the other two dependent variables, commercial and investment banks are the only significant specialization. These results support Hypothesis 3 concerning the impact of different business models on liquidity risk. As for LTDST, the business activities of investment banks contributed to a reduction of liquidity risk. The same happened for both commercial and investment models, with a LATDS dependent variable (see Table 3, Panel 6) being an indicator of liquidity; therefore, a positive outcome has to be interpreted as a decrease in liquidity risk.
Finally, adding a first lag of the dependent variable to all three liquidity measures showed the influence of past values: Liquidity risk was correlated with its own past equivalent. Concerning specification models 7 to 9, we extended the baseline model to test the relationship between liquidity risk and two other variables that account for income and funding structure, which are: (1) non-interest income and (2) non-deposit funding (Köhler 2015). In doing so, we re-estimated the fixed-effect dynamic panel data model. Again, bank specialization was controlled by bank fixed effects, which dropped our business model dummy variables (see Table 3, Panel 7 to 9). The findings from the extended model were quite similar to the previous fixed-effects dynamic regression results, with both size and tier retaining the same significant outcomes; that is, if bank size (LNTA) increases by 1%, we can expect liquidity risk to increase by an average of 0.0048. We inferred that LTDm increased due to over-diversification and non-deposit funding activities because the coefficients that were associated with both diversification (NONINTINC) and wholesale funding (NONDEPFUN) showed positive outcomes (see Table 3, Panel 7).
6. Robustness
Once we had proven that the share of these two additional variables might affect risk in business models, our concern was to investigate whether diversification income and wholesale funding have implications for each business model. We proceeded by splitting the sample into commercial, investment, and savings banks. Most of the studies regarding business models are focused on the profitability side, but we wanted to investigate liquidity risk across different banks. The results of the three business models’ differences are based on their specialization activities. Ayadi et al. (2016) outlined the diversity of banks before and after the 2007–2009 crisis through analysis of both multiple performance and risk indicators. The findings indicated that commercial banks relied less on retail activities, whereas they incremented market and interbank activities from 2005 to 2014. As these types of bank increase their share of non-interest income activities, this result is in line with an over-diversification process leading to higher risk. Indeed, Table 4 indicates that savings banks have a positive and statistically significant share of non-interest income, which means that, as positive values raise liquidity risk, these banks may not benefit from income diversification strategy; indeed, they might suffer from over-diversification. Non-deposit funding decreases LTDm in savings banks.
7. Endogeneity
The results that were obtained from the previous model estimations might be driven by endogeneity. Shifts in business models, or in both profit generating and funding activities, cause changes in liquidity risk. Moreover, adding an autoregressive component to the Least Square Dummy Variable produces inconsistent results for a dynamic panel data model with individual effects. This is true whether they are random or fixed—Nickell Bias (Nickell 1981)—because the strict exogeneity assumption of the regressors is violated.
Thus, the previous methodology implemented in banks leads to bias results due to simultaneity or omitted variables.
We apply a Generalized Method of Moments (GMM) dynamic panel estimator in order to correct and improve our estimation results, which fits into the endogeneity issue, differencing regressors (Difference GMM), or instrumenting explanatory variables with internal instruments, that is, their own lags (System GMM). Both estimators shall be applied where the following conditions are met: (1) the process is dynamic; (2) time invariant characteristics can be related to explanatory variables; (3) the panel dataset is made up of short time (T) and larger observations (N); (4) regressors are not strictly exogenous; and, (5) heteroskedasticity and autocorrelation are present within individuals, not across them (Roodman 2009).
In particular, if the dependent variable is persistent and close to being a random walk, the Difference GMM produces bias and inefficient results in a finite sample, especially when the time span is short. Poor performance is due to the use of weak instruments; therefore, a System GMM estimator has been proposed in order to solve this issue (Blundell and Bond 1998). It has been proven that some persistence exists in the series. This estimator has a lower bias and a higher efficiency than all of the others do. Given the difficulty in finding proper instruments for the endogenous regressors, System GMM allows for us to deal with a considerable number of endogenous variables, such as bank capital, efficiency, and assets that are instrumented with their own lags. It has been proven that liquidity risk has high persistence levels; thus, we implement System GMM as more suitable than Difference GMM in this type of research.
The findings are confirmed while using two-step System GMM, as proposed by Arellano and Bover (1995) and Blundell and Bond (1998). The results for the bank independent variables are similar to the previous estimations: Larger banks (LNTA) have a significantly higher liquidity risk exposure; hence, banking size keeps its outcomes, losing some significance that is caused by endogeneity, from 1% to 5%. The coefficient associated with capital is no longer statistically significant, meaning that capital had no influence on maturity mismatch between short-term loans and long-term deposits (see Table 5). As regards control variables, NIM as a profitability measure has a positive statistical significance, which means that, as bank NIM increases, liquidity risk decreases, which could be explained by earnings distortions, due to both asset and liability mismatch maturity (Angbazo 1997). Moreover, banks with diversified income may suffer an increase in maturity mismatch index concerning diversification structure. Indeed, both non-interest income and non-deposit funding weakly contribute to raising LTDm. The lagged dependent variables are also significant, indicating that the bank liquidity risk is persistent. By simply using the LTDm ratio, the Hansen J statistic accepts the null hypothesis that the instruments are exogenous (see Table 5, Panel 1). Time and industry dummy variables have been used as the exogenous variables for System GMM together with the maximum lag lengths for the endogenous variables. When considering the second dependent variable, that is, total loans over total short-term borrowings, TIER is statistically significant at 5%, which could be explained by the construction of the dependent variable itself, which takes into account the total amount of loans granted by the banks covered by the total amount of short-term funding, without considering the respective (their) maturity. It is important to compare the results achieved using our liquidity-risk indicator with respect to the ratios adopted in the literature, as it sheds some light on the importance of maturity mismatch in measuring the liquidity-risk exposure. Notably, we also ran a pooled regression to compare the coefficients of the lagged dependent variable of System GMM with the previous regressions. We know from the theory that the value obtained from GMM should be between the value of the pooled and dynamic regressions and that this is proven in our research (see Table A3 in Appendix A).
Regarding the bank business models, our results show that savings banks are less prone to suffering from a liquidity risk maturity mismatch. Savings specialization models contribute to lowering the ratio, because the associated coefficient is negative and statistically significant (see Table 5, column 1). Savings banks’ activities seem to be the soundest because of their reliance on a retail-oriented model and the differences of the credit portfolio composition. Moreover, banks that increase their share of non-deposit funding are worse at resisting risk. As proliferation of instruments may overfit endogenous variables and lead to a loss in power, we consider a change in the number of lags in the GMM estimation model as a robustness check. Table 5 (see columns 4 to 6) shows the outcomes of the other robustness test in order to verify that our results are sufficiently robust to withstand changing lags, which considers a shorter lag length. In particular, we run different models with lag 4, which confirmed all the previous findings. For instance, liquidity risk may occur when bank size increases as well as when there is a higher share of non-deposit funding; thus, banks that rely on different types of funding, rather than on customer deposits, are more exposed to liquidity shortages, which can lead to greater instability and a higher probability of failure as a result (Altunbas et al. 2011).
8. Conclusions
Liquidity risk represents one of the most important causes of the 2007–2009 financial crisis. Since then, banking regulatory bodies have imposed new regulations in order to protect banks and, in particular, they protect depositors from high exposure to risk to prevent further financial distress. This study proposed a liquidity risk measure with special attention to the LTD ratio. The time reference was optimized and the risk component was given by the so-called “maturity mismatch”.
We carried out our analysis on a European sample of different banking types in the 2011–2017 time period. With the use of our indicators, the results in Table 5 partly corroborate our previous findings: We detected empirical evidence that, as banking size increases, risk also increases, whereas liquidity risk does not decrease with a bank’s capital ratio. However, our decision to use a more accurate measure of liquidity risk than those used by other scholars had different outcomes with respect to the aggregated indicators (i.e., LTDST and LADST). These outcomes have an important effect on the way that a bank may lend or create a long-term lending relationship. Hence, along with a proper differentiation of bank business activities, the use of LTDm is the most suitable in this type of research. During the crisis, different banking types suffered in disparate ways (Hryckiewicz and Kozlowski 2017). We identified three major business models, proving that the savings model might be the most exposed to maturity mismatch, because its share of non-deposit funds increased. The banks might not benefit from income diversification activities, which weakly increases maturity mismatches. Diversification is not an easy task. In certain circumstances, risk would increase in trying to involve both the largest and the most diverse number of customers, whereas liquidity risk may be supported by ever-growing loan-granting activities. This is consistent with the literature, which considers these types of bank to be more retail oriented. Indeed, the traditional banking model has been proven to have advantages in survival during a crisis (Chiorazzo et al. 2018)—just as it is able to maintain a strong relationship with its customers, thanks to its traditional activities. Moreover, banks aspiring to greater size and profitability must raise their share of diversified funding sources, accepting the trade-off between profitability and risk.
This analysis could be a tangible contribution to the economy through the understanding of the nature of business-model activities and funding strategies. Savings banks have a more retail-oriented business, which accounts for most customer loans and deposits, even though there is a considerable proportion of both interbank and trading activities that are increasingly at risk. In general, banks increase their share of non-deposit funding activity when difficulties in deposit-gathering arise or when a decrease in interest rates no longer makes them attractive to customers. Therefore, wholesale funding might be employed as an additional source of funding for liquidity management. This explains why savings banks or investment banks might reduce the liquidity risk through other sources of funding.
The overall liquidity conditions changed after the crisis; in particular, the reduction in liquidity risk was mainly due to an increase in the share of short-term deposits gathering activity, which was carried out by financial institutions with new promotional interest rate strategies. Indeed, for the most part, bank funding is made up of demand deposits; if there is a boost in lending growth, and deposits do not grow alike, the funding mismatch may jeopardize the stability of the institution as well as the rate transmission, especially when bank-run phenomena are triggered by a financial crisis.
Reacting to past events, considerable progress has been made, thanks to applied macroeconomic policies; indeed, macroprudential measures allowed for banks to build up reserves, discouraged the granting of risky loans, and strengthened the resilience of the financial system (BIS 2018). Macroprudential measures achieved their purpose in strengthening the financial system, even if stress tests before the financial crisis did not lead to useful information for systemic banking risk. Basel’s new liquidity requirements also achieved their purpose, especially with LCR, which was applied in the EU in January 2018. The results proposed in this paper aimed at ensuring better monitoring, as well as filling a gap in a new approach to bank liquidity risk, which is, why empirical evidence plays a key role in dealing with new methodologies. The European Banking Authority (EBA 2019) showed that LCR is composed primarily of 46% outflows from wholesale deposits, of which 38% are non-operational and 8% are operational. Moreover, the EBA underlined the lack of clarity in LCR implementation and regulatory provision. Hence, banking liquidity monitoring must consider the maturity ladder in implementing Basel Committee standards (BCBS 2009); as additional approaches can favour forecasting, LTDm offers information for further assessing liquidity risk in granting long-term loans, while considering short-term or long-term deposits. Liquidity strategies and cash management are based on available deposit-gathering to cover shortfalls or meet normal payments. The renewal of deposit concept, as highlighted by the EBA, reminded us of the importance of the lending and deposit relationship supported by our indicator, whose policy implications could help in clarifying a bank’s liquidity situation during the trade cycle, that is, when deposits are expected to be used and renovated by others. As already pointed out, duration (i.e., time dimension) constitutes a crucial factor in building different indicators for banks to have knowledge of their positions with respect to liquidity at different times. Moreover, as the EBA, in order to evaluate the availability of liquidity under stress for various maturity scenarios, recommended that bank supervisors obtain a wider view of liquidity risk, in this case a liquidity risk indicator, such as LTDm, which would account for both demand and long-term deposits in the face of respective loans and verify the proneness to withdrawal and its impact on financial stability. Indeed, future policy action should consider the degree of withdrawal expectation. This should naturally lead to a better harmonization of the Basel framework and the EU regulatory framework, towards a more resilient and stable global financial system.
Against this background, our results can be improved, while considering other factors that may affect bank liquidity. Indeed, the study has some limitations, which could be overcome with future research. For instance, bank age (banks’ life cycle) is one characteristic that may influence profitability as well as risk in banks. Several scholars tend to exclude de novo banks from the sample and control for age in the estimation, as banks at the maturity stage might face different banking landscapes than those at the initial stage of their life cycle. Moreover, how bank governance decisions influence directors’ strategies, focusing on the presence of a risk committee in mitigating liquidity risk appetite, could be investigated. Therefore, specifically examining the effect of bank life cycles, together with an analysis of both bank governance and board characteristics, is a worthwhile direction for future research on liquidity risk.
Author Contributions
The current paper is a combined effort of S.G., and S.M.: conceptualization, S.G. and S.M.; methodology, S.G. and S.M.; software, S.G.; formal analysis, S.G. and S.M.; data curation, S.G.; writing—original draft preparation, S.G.; writing—review and editing, S.M.; supervision S.M.
Funding
This research received no external funding.
Conflicts of Interest
The authors declare no conflict of interest.
Appendix A

Table A1.
Description of Variables.
| Variable | Description | Source |
|---|---|---|
| LTDm | Fraction of maturity mismatch loans divided by deposits | Authors’ elaboration |
| LTDST | Fraction of total loans divided by total deposits and short-term funding | (BvD 2018) |
| LADST | Fraction of liquid assets over deposits and short-term funding | (BvD 2018) |
| LNTA | Natural logarithm of total assets for banking size | Authors’ elaboration |
| TIER | Capital Ratio equity divided by total assets | (BvD 2018) |
| NIM | Difference between interest income and interest expenses relative to the amount of interest-earning assets | (BvD 2018) |
| ROA | Net income by total assets, as profitability of bank assets. | (BvD 2018) |
| CINC | Efficiency Ratio: total operating expenses by total operating income. A lower ratio means that the bank is more efficient | (BvD 2018) |
| RWA | Risk weighted assets over total assets | (BvD 2018) |
| NONINTINC | Non-interest income divided by total income | (BvD 2018) |
| NONDEPFUND | Non-deposit funding divided by total liabilities | (BvD 2018 |
Table A2.
The Variance Inflation Factor (VIF) and Tolerance Test Statistics.
| Variable | VIF | 1/VIF |
|---|---|---|
| L.LTDm | 1.12 | 0.892157 |
| LNTA | 2.69 | 0.372034 |
| TIER | 2.1 | 0.476446 |
| NIM | 1.5 | 0.665971 |
| ROA | 1.01 | 0.987571 |
| CINC | 1.22 | 0.821309 |
| RWA | 1.64 | 0.60795 |
| NONINTINC | 1.09 | 0.918706 |
| NONDEPFUND | 1.16 | 0.865695 |
| Mean VIF | 1.5 |
Source: Stata Statistical Software.
Table A3.
Pooled dynamic regression.
| LTDm | LTDST | LADST | |
|---|---|---|---|
| (1) | (2) | (3) | |
| L. LTDm | 0.8678 | ||
| (0.0110) *** | |||
| L. LTDST | 0.9767 | ||
| (0.0058) *** | |||
| L. LADST | 0.9296 | ||
| (0.0073) *** | |||
| LNTA | 0.0131 | 0.3529 | 0.0316 |
| (0.0057) ** | (0.1057) *** | (0.1064) | |
| TIER | −0.0000 | −0.0008 | 0.0006 |
| (0.0000) *** | (0.0002) *** | (0.0003) ** | |
| NIM | 0.0047 | −0.6400 | −0.2237 |
| (0.0105) | (0.1916) *** | (0.1977) | |
| RWA | −0.0001 | 0.0381 | 0.0195 |
| (0.0006) | (0.0115) *** | (0.0117) * | |
| ROA | −0.0532 | 0.4297 | 0.0209 |
| (0.0141) *** | (0.2589) * | (0.2669) | |
| CINC | −0.0010 | 0.0162 | −0.0345 |
| (0.0004) ** | (0.0080) ** | (0.0081) *** | |
| NONINTINC | −0.0007 | −1.7219 | 0.7997 |
| (0.0426) | (0.7915) ** | (0.8152) | |
| NONDEPFUN | 0.0165 | 0.3652 | −0.2621 |
| (0.0099) * | (0.1896) * | (0.1872) | |
| Observations | 2236 | 2234 | 2236 |
| R-squared | 0.7665 | 0.9467 | 0.9007 |
| Year dummies | Yes | Yes | Yes |
It shows the pooled regression results of our baseline model. Note that we winsorize all bank variables at the 99-percentile level to mitigate the impact of outliers. Robust standard error are reported in parentheses. * p < 0.10, ** p < 0.05, *** p < 0.01 denote significance levels, respectively. Source: Stata Statistical Software.
Figure A1.
Average of loans-to-deposits maturity mismatch (LTDm) of the EU banks. The LTDm remained stable from the second part of 2010 to 2012, decreased from 2013 to 2016 and increased from 2017. Source: Stata Statistical Software.
Figure A1.
Average of loans-to-deposits maturity mismatch (LTDm) of the EU banks. The LTDm remained stable from the second part of 2010 to 2012, decreased from 2013 to 2016 and increased from 2017. Source: Stata Statistical Software.
References
- Altunbas, Yener, Simone Manganelli, and David Marques-Ibanez. 2011. Bank Risk During the Financial Crisis—Do Business Models Matter? ECB Working paper series No. 1394; Frankfurt: European Central Bank. [Google Scholar]
- Angbazo, Lazarus. 1997. Commercial bank net interest margins, default risk, interest-rate risk, and off-balance sheet banking. Journal of Banking & Finance 21: 55–87. [Google Scholar]
- Arellano, Manuel, and Olympia Bover. 1995. Another look at the instrumental variable estimation of error-components models. Journal of Econometrics 68: 29–51. [Google Scholar] [CrossRef] [Green Version]
- Ayadi, Rym, Willem De Groen, Ibtihel Sassi, Walid Mathlouthi, Harol Rey, and Olivier Aubry. 2016. Banking Business Models Monitor 2015 Europe. Brussels: CEPS Paperbacks. [Google Scholar]
- Bai, Jennie, Arvind Krishnamurthy, and Charles-Henri Weymuller. 2018. Measuring liquidity mismatch in the banking sector. The Journal of Finance 73: 51–93. [Google Scholar] [CrossRef]
- Barth, James R., Daniel E. Nolle, Triphon Phumiwasana, and Glenn Yago. 2003. A Cross-Country Analysis of the Bank Supervisory Framework and Bank Performance. Financial Markets Institutions & Instruments 12: 67–120. [Google Scholar]
- Battaglia, Francesca, Angela Gallo, and Anna Elvira Graziano. 2014. Strong Boards, Risk Committee and Bank Performance: Evidence from India and China. In Corporate Governance in Emerging Markets. Berlin: Springer, pp. 79–105. [Google Scholar]
- Basel Committee on Banking Supervision. 2008. Principles for Sound Liquidity Risk Management and Supervision. Basel: Bank for International Settlements. [Google Scholar]
- Basel Committee on Banking Supervision. 2009. International Framework for Liquidity Risk Measurement, Standards and Monitoring. Basel: Bank for International Settlements. [Google Scholar]
- Basel Committee on Banking Supervision. 2013. Basel III: The Liquidity Coverage Ratio and liquidity Risk Monitoring Tools. Basel: Bank for International Settlements. [Google Scholar]
- Basel Committee on Banking Supervision. 2014. Basel III: The Net Stable Funding Ratio. Basel: Bank for International Settlements. [Google Scholar]
- Beck, Thorsten, Olivier De Jonghe, and Glenn Schepens. 2013. Bank competition and stability: Cross-country heterogeneity. Journal of Financial Intermediation 22: 218–44. [Google Scholar] [CrossRef]
- Berger, Allen N., and Christa H.S. Bouwman. 2009. Bank liquidity creation. Review of Financial Studies 22: 3779–837. [Google Scholar] [CrossRef]
- Berger, Allen N., Christa H.S. Bouwman, Thomas Kick, and Klaus Schaeck. 2016. Bank liquidity creation following regulatory interventions and capital support. Journal of Financial Intermediation 26: 115–41. [Google Scholar] [CrossRef]
- Bertay, Ata Can, Asli Demirgüç-Kunt, and Harry Huizinga. 2013. Do we need big banks? Evidence on performance, strategy and market discipline. Journal of Financial Intermediation 22: 532–58. [Google Scholar] [CrossRef]
- Birindelli, Giuliana, Stefano Dell’Atti, Antonia Patrizia Iannuzzi, and Marco Savioli. 2018. Composition and Activity of the Board of Directors: Impact on ESG Performance in the Banking System. Sustainability 10: 4699. [Google Scholar] [CrossRef]
- Bank for International Settlements. 2018. IV. Moving Forward with Macroprudential Frameworks, Annual Economic Report. Basel: Bank for International Settlements. [Google Scholar]
- Blundell, Richard, and Stephen Bond. 1998. Initial conditions and moment restrictions in dynamic panel data models. Journal of Econometrics 87: 115–43. [Google Scholar] [CrossRef]
- Blundell-Wignall, Adrian, Paul Atkinson, and Caroline Roulet. 2014. Bank business models and the Basel system: Complexity and interconnectedness. OECD Journal: Financial Market Trends 2013: 43–68. [Google Scholar] [CrossRef]
- Bonfim, Diana, and Moshe Kim. 2012. Liquidity Risk in Banking: Is There Herding? Working papers. Lisbon: Banco De Portugal. [Google Scholar]
- Bonner, Clemens, Iman Van Lelyveld, and Robert Zymek. 2015. Banks’ liquidity buffers and the role of liquidity regulation. Journal of Financial Services Research 48: 215–34. [Google Scholar] [CrossRef]
- Bourke, Philip. 1989. Concentration and other determinants of bank profitability in Europe, North America and Australia. Journal of Banking & Finance 13: 65–79. [Google Scholar]
- Brunnermeier, Markus K. 2009. Deciphering the liquidity and credit crunch 2007–2008. Journal of Economic Perspectives 23: 77–100. [Google Scholar] [CrossRef]
- Bureau van Dijk. 2018. Orbis Database. London: Bureau van Dijk. [Google Scholar]
- Chen, Yi-Kai, Chung-Hua Shen, Lanfeng Kao, and Chuan-Yi Yeh. 2018. Bank Liquidity Risk and Performance. Review of Pacific Basin Financial Markets and Policies 21: 1–40. [Google Scholar] [CrossRef]
- Chiorazzo, Vincenzo, Vincenzo D’Apice, Robert De Young, and Pierluigi Morelli. 2018. Is the traditional banking model a survivor? Journal of Banking & Finance 97: 238–56. [Google Scholar]
- De Haan, Jakob, and Tigran Poghosyan. 2012. Bank size, market concentration, and bank earnings volatility in the US. Journal of International Financial Markets, Institutions and Money 22: 35–54. [Google Scholar] [CrossRef]
- De Haan, Leo, and Jan Willem van den End. 2013. Bank liquidity, the maturity ladder, and regulation. Journal of Banking & Finance 37: 3930–50. [Google Scholar]
- Demirguc-Kunt, Asli, Luc Laeven, and Ross Levine. 2003. The Impact of Bank Regulations, Concentration, and Institutions on Bank Margins. Washington: The World Bank. [Google Scholar]
- Demsetz, Rebecca S., and Philip E. Strahan. 1997. Diversification, size, and risk at bank holding companies. Journal of Money, Credit, and Banking 29: 300–13. [Google Scholar] [CrossRef]
- European Central Bank. 2012. Annual Report 2011. Frankfurt: European Central Bank. [Google Scholar]
- European Central Bank. 2016. Financial Stability Review 2016. In Special Features, C: Recent Trends in Euro Area Banks’ Business Models and Implications for Banking Sector Stability. Frankfurt: European Central Bank. [Google Scholar]
- European Banking Authority. 2019. Monitoring of Liquidity Coverage Ratio Implementation in the EU—First Report. Paris: European Banking Authority. [Google Scholar]
- Fiordelisi, Franco, David Marques-Ibanez, and Phil Molyneux. 2011. Efficiency and risk in European banking. Banks Journal of Banking & Finance 35: 1315–26. [Google Scholar]
- Hellmann, Thomas F., Kevin C. Murdock, and Joseph E. Stiglitz. 2000. Liberalization, moral hazard in banking, and prudential regulation: Are capital requirements enough? American Economic Review 90: 147–65. [Google Scholar] [CrossRef]
- Hryckiewicz, Aneta, and Łukasz Kozłowski. 2017. Banking business models and the nature of financial crisis. Journal of International Money and Finance 71: 1–24. [Google Scholar] [CrossRef]
- Imbierowicz, Björn, and Christian Rauch. 2014. The Relationship between Liquidity Risk and Credit Risk in Banks. Journal of Banking & Finance 40: 242–56. [Google Scholar]
- Khan, Muhammad Saifuddin, Harald Scheule, and Eliza Wu. 2017. Funding liquidity and bank risk taking. Journal of Banking & Finance 82: 203–16. [Google Scholar]
- Köhler, Matthias. 2014. Does non-interest income make banks more risky? Retail versus investment-oriented banks. Review of Financial Economics 23: 182–93. [Google Scholar] [CrossRef]
- Köhler, Matthias. 2015. Which banks are more risky? The impact of business models on bank stability. Journal of Financial Stability 16: 195–212. [Google Scholar] [CrossRef]
- Kok, Christoffer, Csaba Móré, and Monica Petrescu. 2016. Recent trends in euro area banks’ business models and implication for banking sector stability. Financial Stability Review 1: 3. [Google Scholar]
- Kosmidou, Kyriaki, Sailesh Tanna, and Fotios Pasiouras. 2005. Determinants of Profitability of Domestic UK Commercial Banks: Panel Evidence from the Period 1995–2002. Economics, Finance and Accounting Applied Research Working paper series No. RP08-4; Coventry: Coventry University. [Google Scholar]
- Matz, Leonard, and Peter Neu. 2007. Liquidity risk management strategies and tactics. In Liquidity Risk Measurement and Management: A Practitioner’s Guide to Global Best Practices. Hoboken: John Wiley & Sons, pp. 100–20. [Google Scholar]
- Mercieca, Steve, Klaus Schaeck, and Simon Wolfe. 2007. Small European banks: Benefits from diversification? Journal of Banking & Finance 31: 1975–98. [Google Scholar]
- Mergaerts, Frederik, and Rudi Vander Vennet. 2016. Business model and bank performance: A long-term perspective. Journal of Financial Stability 22: 57–75. [Google Scholar] [CrossRef]
- Molyneux, Philip, and John Thornton. 1992. Determinants of European bank profitability: A note. Journal of Banking & Finance 16: 1173–78. [Google Scholar]
- Nguyen, My, Shrimal Perera, and Michael Skully. 2017. Bank market power, asset liquidity and funding liquidity: International evidence. International Review of Financial Analysis 54: 23–38. [Google Scholar] [CrossRef]
- Nickell, Stephen. 1981. Biases in dynamic models with fixed effects. Econometrica: Journal of the Econometric Society 49: 1417–26. [Google Scholar] [CrossRef]
- Pasiouras, Fotios, and Kyriaki Kosmidou. 2007. Factors influencing the profitability of domestic and foreign commercial banks in the European Union. Research in International Business and Finance 21: 222–37. [Google Scholar] [CrossRef]
- Resti, Andrea, and Andrea Sironi. 2011. La crisi finanziaria e Basilea 3: Origini, Finalità e Struttura del Nuovo Quadro Regolamentare (No. 1). Carefin Working paper. Milano: CAREFIN. [Google Scholar]
- Roengpitya, Rungporn, Nikola Tarashev, and Kostas Tsatsaronis. 2014. Bank Business Models. Basel: Bank for International Settlements. [Google Scholar]
- Roengpitya, Rungporn, Nikola Tarashev, Kostas Tsatsaronis, and Alan Villegas. 2017. Bank Business Models: Popularity and Performance. BIS, Working paper 682. Basel: Bank for International Settlements. [Google Scholar]
- Roodman, David. 2009. How to Do Xtabond2? An introduction to “Difference” and “System GMM” in STATA. STATA Journal 9: 86–136. [Google Scholar] [CrossRef]
- Scannella, Enzo. 2012. Capital regulation and Italian banking system: Theory and empirical evidence. International Journal of Economics and Finance 4: 31–43. [Google Scholar] [CrossRef]
- Singh, Anamika, and Anil Kumar Sharma. 2016. An empirical analysis of macroeconomic and bank-specific factors affecting liquidity of Indian banks. Future Business Journal 2: 40–53. [Google Scholar] [CrossRef] [Green Version]
- Tirole, Jean. 2008. Liquidity shortages: theoretical underpinnings. Banque de France Financial Stability Review: Special Issue on Liquidity 11: 53–63. [Google Scholar]
- Valverde, Santiago Carbó, Pedro Jesús Cuadros Solas, and Francisco Rodríguez Fernández, eds. 2016. Liquidity Risk, Efficiency and New Bank Business Models. Berlin: Springer. [Google Scholar]
- Van den End, Jan Willem. 2016. A macroprudential approach to address liquidity risk with the loan-to-deposit ratio. The European Journal of Finance 22: 237–53. [Google Scholar] [CrossRef]
- Vento, Gianfranco, Andrea Pezzotta, and Stefano Di Colli. 2016. Liquidity Mismatch, Bank Borrowing Decision and Distress: Empirical Evidence from Italian Credit Co-Operative Banks. In Liquidity Risk, Efficiency and New Bank Business Models. Edited by Santiago Carbó Valverde, Pedro Jesús Cuadros Solas and Francisco Rodríguez Fernández. Cham: Palgrave Macmillan Studies in Banking and Financial Institutions. [Google Scholar]
Table 1.
Descriptive statistics variables.
| Variable | Obs | Mean | SD | Min | Max |
|---|---|---|---|---|---|
| Dependent variables | |||||
| LTDm | 2236 | 0.386 | 0.708 | 0.024 | 7.312 |
| LTDST | 2234 | 73.704 | 27.159 | 2.149 | 246.633 |
| LADST | 2236 | 18.234 | 20.533 | 1.336 | 244.634 |
| Independent variables | |||||
| LNTA | 2236 | 14.652 | 2.165 | 10.332 | 20.238 |
| TIER | 2236 | 249.1941 | 786.086 | 0.3537 | 3964 |
| NIM | 2236 | 2.064 | 0.852 | −0.204 | 7.951 |
| CINC | 2236 | 0.766 | 0.185 | 0.0805 | 1.783 |
| RWA | 2236 | 54.386 | 15.240 | 7.679 | 110.873 |
| ROA | 2236 | 0.0038 | 0.0092 | −0.058 | 0.169 |
| NONINTINC | 2236 | 0.3611 | 0.178 | −0.167 | 1.065 |
| NONDEPFUN | 2236 | 0.1703 | 0.7892 | 0.000 | 21.361 |
| COMMERCIAL | 2236 | 0.2021 | 0.4016 | 0 | 1 |
| INVESTMENT | 2236 | 0.0076 | 0.0868 | 0 | 1 |
| SAVINGS | 2236 | 0.3157 | 0.4649 | 0 | 1 |
We present a summary of statistics for the dependent and control variables. Liquidity risk is alternatively defined as the ratio between loans and deposits maturity mismatch, as overall loans on deposits and short-term funding, and as liquid assets over deposit and short-term funding (liquidity index). Source: Stata Statistical Software.
Table 2.
Pearson correlation coefficients.
| 1 | 2 | 3 | 4 | 5 | 6 | 7 | 8 | 9 | 10 | 11 | |
|---|---|---|---|---|---|---|---|---|---|---|---|
| LTDm | 1.000 | ||||||||||
| LTDST | 0.034 | 1.000 | |||||||||
| LADST | 0.215 | −0.101 | 1.000 | ||||||||
| LNTA | 0.258 | 0.247 | 0.239 | 1.000 | |||||||
| TIER | 0.117 | 0.078 | 0.244 | 0.656 | 1.000 | ||||||
| NIM | −0.092 | 0.006 | −0.191 | −0.299 | −0.207 | 1.000 | |||||
| CINC | −0.155 | −0.294 | −0.017 | −0.211 | −0.083 | −0.091 | 1.000 | ||||
| RWA | −0.113 | 0.040 | −0.275 | −0.414 | −0.330 | 0.489 | 0.079 | 1.000 | |||
| ROA | 0.040 | 0.000 | −0.012 | −0.017 | −0.029 | −0.005 | −0.019 | −0.012 | 1.000 | ||
| NONINTINC | 0.066 | −0.225 | 0.168 | 0.039 | 0.039 | −0.122 | 0.064 | −0.029 | 0.076 | 1.000 | |
| NONDEPFUN | 0.134 | 0.381 | 0.106 | 0.189 | 0.051 | −0.165 | −0.244 | −0.225 | 0.006 | −0.211 | 1.000 |
This table reports the correlation coefficients of all the variables used in the EU banking sector during the 2011–2017 time period. Correlation coefficients in bold are significant at the 5% level. Source: Stata Statistical Software.
Table 3.
Dynamic panel data analysis.
| LTDm | LTDST | LADST | LTDm | LTDST | LADST | LTDm | LTDST | LADST | |
|---|---|---|---|---|---|---|---|---|---|
| (1) | (2) | (3) | (4) | (5) | (6) | (7) | (8) | (9) | |
| L. LTDm | 0.2820 | 0.8085 | 0.2854 | ||||||
| (0.1080) ** | (0.0850) *** | (0.1079) ** | |||||||
| L. LTDST | 0.3884 | 0.9727 | 0.3991 | ||||||
| (0.0571) *** | (0.0098) *** | (0.0633) *** | |||||||
| L. LADST | 0.5965 | 0.9079 | 0.5980 | ||||||
| (0.2041) ** | (0.0202) *** | (0.1945) ** | |||||||
| LNTA | 0.5401 | −6.0381 | −13.2721 | 0.0209 | 0.3883 | −0.0823 | 0.4846 | −4.3064 | −10.0064 |
| (0.0691) *** | (4.0090) | (8.5877) | (0.0063) *** | (0.1495) *** | (0.1242) | (0.0826) *** | (2.6639) | (6.3423) | |
| TIER | −0.0003 | −0.0004 | 0.0068 | −0.0000 | −0.0009 | 0.0009 | −0.0003 | −0.0003 | 0.0082 |
| (0.0001) *** | (0.0024) | (0.0028) ** | (0.0000) *** | (0.0004) ** | (0.0002) *** | (0.0001) *** | (0.0031) | (0.0036) * | |
| NIM | −0.0990 | −0.7606 | 3.3449 | 0.0000 | −0.7602 | −0.1805 | −0.0638 | −0.9390 | 3.2162 |
| (0.0372) ** | (1.9519) | (2.9537) | (0.0099) | (0.3057) ** | (0.5338) | (0.0224) ** | (1.3041) | (2.7034) | |
| RWA | −0.0015 | 0.3129 | −0.2528 | −0.0005 | 0.0439 | 0.0103 | −0.0009 | 0.2999 | −0.2429 |
| (0.0014) | (0.0869) *** | (0.0652) *** | (0.0003) * | (0.0164) *** | (0.0474) | (0.0015) | (0.0938) ** | (0.0538) *** | |
| ROA | −0.0080 | 48.1042 | −13.1194 | −0.1814 | 57.1675 | −16.4052 | v0.1495 | 48.8407 | −21.5145 |
| (0.2729) | (48.0840) | (18.1641) | (0.2801) | (39.5807) | (19.4139) | (0.2791) | (48.3521) | (24.9992) | |
| CINC | −0.0413 | 4.6706 | 2.2975 | −0.1138 | 2.2789 | −2.5367 | −0.0360 | 4.5010 | 2.5975 |
| (0.0278) | (4.1019) | (2.3471) | (0.0560) ** | (1.2334) * | (1.7733) | (0.0305) | (3.5246) | (2.8604) | |
| COMMERCIAL | 0.0057 | 0.1630 | 1.3475 | ||||||
| (0.0424) | (0.5053) | (0.3888) *** | |||||||
| INVESTMENT | 0.1416 | −1.4248 | 4.6768 | ||||||
| (0.1437) | (0.5717) ** | (1.1602) *** | |||||||
| SAVINGS | −0.0650 | −0.2031 | 0.0166 | ||||||
| (0.0127) *** | (0.3596) | (0.1679) | |||||||
| NONINTINC | 0.0541 | −0.0349 | 6.3599 | ||||||
| (0.0277) * | (3.8817) | (4.1000) | |||||||
| NONDEPFUN | 0.0470 | −1.4684 | −2.5310 | ||||||
| (0.0188) ** | (1.0737) | (3.5743) | |||||||
| Obs. | 2236 | 2234 | 2236 | 2236 | 2234 | 2236 | 2236 | 2234 | 2236 |
| Adj. R-squared | 0.12 | 0.18 | 0.25 | 0.76 | 0.94 | 0.90 | 0.12 | 0.18 | 0.25 |
| Time fixed effect | Yes | Yes | Yes | Yes | Yes | Yes | Yes | Yes | Yes |
| Firm fixed effect | Yes | Yes | Yes | No | No | No | Yes | Yes | Yes |
This table reports the dynamic panel regression results with fixed effects and one lag of the dependent variables which express bank liquidity risk. Clustered heteroscedasticity standard errors at the bank level account for serial correlation in parentheses. * p < 0.10, ** p < 0.05, *** p < 0.01 denote significance levels. Regressions 4 to 6 are performed with random effects to account for the specialization dummies. The potentially endogenous variables are banking size, capital support, profitability indicators, and cost-income ratio. The regressions include time (year) dummies. Source: Stata Statistical Software.
Table 4.
Bank business models’ fixed-effects panel regression.
| Investment Banks | LTDm | LTDST | LADST |
|---|---|---|---|
| (1) | (2) | (3) | |
| NONINTINC | 1.1460 | 13.9389 | −68.6101 |
| (0.9923) | (18.1004) | (55.0633) | |
| NONDEPFUN | −0.8317 | 0.7554 | 5.0565 |
| (0.3222) ** | (3.3061) | (7.6240) | |
| Obs. | 86 | 85 | 86 |
| Adj. R-squared | 0.86 | 0.21 | 0.11 |
| Time fixed effect | Yes | Yes | Yes |
| Firm fixed effects | Yes | Yes | Yes |
| Commercial Banks | LTDm | LTDST | LADST |
| (4) | (5) | (6) | |
| NONINTINC | 0.3348 | 5.9092 | 11.7311 |
| (0.2823) | (9.1702) | (12.9405) | |
| NONDEPFUN | −0.1499 | 10.8639 | −38.7673 |
| (0.3239) | (9.7196) | (21.5307) * | |
| Obs. | 452 | 451 | 452 |
| Adj. R-squared | 0.02 | 0.10 | 0.50 |
| Time fixed effect | Yes | Yes | Yes |
| Firm fixed effects | Yes | Yes | Yes |
| Savings Banks | LTDm | LTDST | LADST |
| (7) | (8) | (9) | |
| NONINTINC | 0.4018 | 2.3581 | −0.9815 |
| (0.2075) * | (2.7548) | (4.4026) | |
| NONDEPFUN | −0.1421 | −0.0239 | −2.1704 |
| (0.0550) ** | (0.8127) | (1.1538) * | |
| Obs. | 706 | 706 | 706 |
| Adj. R-squared | 0.07 | 0.48 | 0.21 |
| Time fixed effect | Yes | Yes | Yes |
| Firm fixed effects | Yes | Yes | Yes |
It shows the results of our baseline model for investment, commercial, and savings banks. Regressions involve panel data analysis and are estimated with bank-specific fixed effects. We report the results for non-interest income and non-deposits funding activities of the full regression. Note that we winsorized all bank variables (except dummy variables) at the 99th percentile level to mitigate the impact of outliers. Time fixed effects and bank fixed effects are included in the regressions. Cluster standard errors at bank level are reported in parentheses. * p < 0.10, ** p < 0.05, *** p < 0.01 denote significance levels. Source: Stata Statistical Software.
Table 5.
Two-step system Generalized Method of Moments (GMM).
| LTDm | LTDST | LADST | LTDm | LTDST | LADST | |
|---|---|---|---|---|---|---|
| (1) | (2) | (3) | (4) | (5) | (6) | |
| L. LTDm | 0.4826 | 0.4888 | ||||
| (0.0902) *** | (0.0932) *** | |||||
| L. LTDST | 0.9683 | 0.9671 | ||||
| (0.0376) *** | (0.0375) *** | |||||
| L. LADST | 0.9660 | 0.9623 | ||||
| (0.0406) *** | (0.0460) *** | |||||
| LNTA | 0.0592 | 1.1432 | 0.1060 | 0.0435 | 1.1731 | 0.1202 |
| (0.0264) ** | (0.6764) * | (0.6344) | (0.0228) * | (0.6048) * | (0.5934) | |
| TIER | −0.0000 | −0.0022 | 0.0012 | −0.0000 | −0.0024 | 0.0013 |
| (0.0001) | (0.0012) * | (0.0008) | (0.0001) | (0.0010) ** | (0.0008) | |
| NIM | 0.1200 | −0.4597 | 0.6707 | 0.0925 | −0.6522 | 0.7990 |
| (0.0412) *** | (1.2219) | (1.9369) | (0.0476) * | (1.1897) | (1.9498) | |
| RWA | 0a.0012 | 0.0102 | 0.0422 | 0.0004 | 0.0158 | 0.0458 |
| (0.0022) | (0.0543) | (0.0443) | (0.0023) | (0.0515) | (0.0508) | |
| ROA | −1.9971 | 101.0904 | 15.6360 | −2.4253 | 100.7422 | 17.5565 |
| (2.3927) | (60.7734) * | (26.2530) | (2.8258) | (55.1719) * | (24.2959) | |
| CINC | −0.1158 | 8.1081 | 0.0396 | −0.1508 | 8.4942 | 0.0132 |
| (0.1939) | (4.8173) * | (2.9897) | (0.2343) | (4.4902) * | (3.0901) | |
| NONINTINC | 0.0867 | −6.6916 | −5.3309 | 0.0633 | −5.9086 | −5.0037 |
| (0.2192) | (4.3906) | (3.3019) | (0.2398) | (4.4216) | (3.2559) | |
| NONDEPFUN | 0.0725 | −0.1076 | -0.0487 | 0.0705 | −0.0465 | 0.0046 |
| (0.0205) *** | (0.4988) | (0.2248) | (0.0211) *** | (0.4594) | (0.2249) | |
| COMMERCIAL | 0.0210 | −0.1373 | −0.4645 | 0.0413 | −0.1789 | −0.6174 |
| (0.0526) | (1.1381) | (1.4253) | (0.0527) | (1.0821) | (1.3878) | |
| INVESTMENT | 0.3447 | −3.0834 | 0.6927 | 0.3271 | −3.2270 | 1.2480 |
| (0.6692) | (2.1467) | (3.2415) | (0.6156) | (1.9050) * | (3.3324) | |
| SAVINGS | −0.0563 | −0.6842 | 0.2200 | −0.0466 | −0.7269 | 0.2315 |
| (0.0244) ** | (0.5451) | (0.3899) | (0.0216) ** | (0.4799) | (0.3839) | |
| Observations | 2236 | 2234 | 2236 | 2236 | 2234 | 2236 |
| N_g | 881 | 880 | 881 | 881 | 880 | 881 |
| j | 188 | 187 | 188 | 180 | 179 | 180 |
| Test for AR (1) (p-value) | 0.0170 | 0.0014 | 0.0061 | 0.0171 | 0.0015 | 0.0065 |
| Test for AR (2) (p-value) | 0.9341 | 0.8681 | 0.5996 | 0.9423 | 0.8677 | 0.5925 |
| Hansen Test (p-value) | 0.5507 | 0.2295 | 0.5344 | 0.6838 | 0.2611 | 0.4454 |
| Time dummies | Yes | Yes | Yes | Yes | Yes | Yes |
This table reports the results of the two step System GMM estimations. “N_g” and “j” account for the number of groups and the instruments, respectively. The Hansen J-test refers to the over-identification test used for the restriction in the GMM estimation. The AR2 is the Arellano Bond test for the existence of the second order autocorrelation. Robust standard errors in parentheses; * p < 0.10, ** p < 0.05, *** p < 0.01 denote significance levels. Source: Stata Statistical Software.
© 2019 by the authors. Licensee MDPI, Basel, Switzerland. This article is an open access article distributed under the terms and conditions of the Creative Commons Attribution (CC BY) license (http://creativecommons.org/licenses/by/4.0/).
Share and Cite
MDPI and ACS Style
Galletta, S.; Mazzù, S. Liquidity Risk Drivers and Bank Business Models. Risks 2019, 7, 89. https://doi.org/10.3390/risks7030089
AMA Style
Galletta S, Mazzù S. Liquidity Risk Drivers and Bank Business Models. Risks. 2019; 7(3):89. https://doi.org/10.3390/risks7030089
Chicago/Turabian StyleGalletta, Simona, and Sebastiano Mazzù. 2019. "Liquidity Risk Drivers and Bank Business Models" Risks 7, no. 3: 89. https://doi.org/10.3390/risks7030089
Note that from the first issue of 2016, this journal uses article numbers instead of page numbers. See further details here.