Using Cutting-Edge Tree-Based Stochastic Models to Predict Credit Risk


Abstract
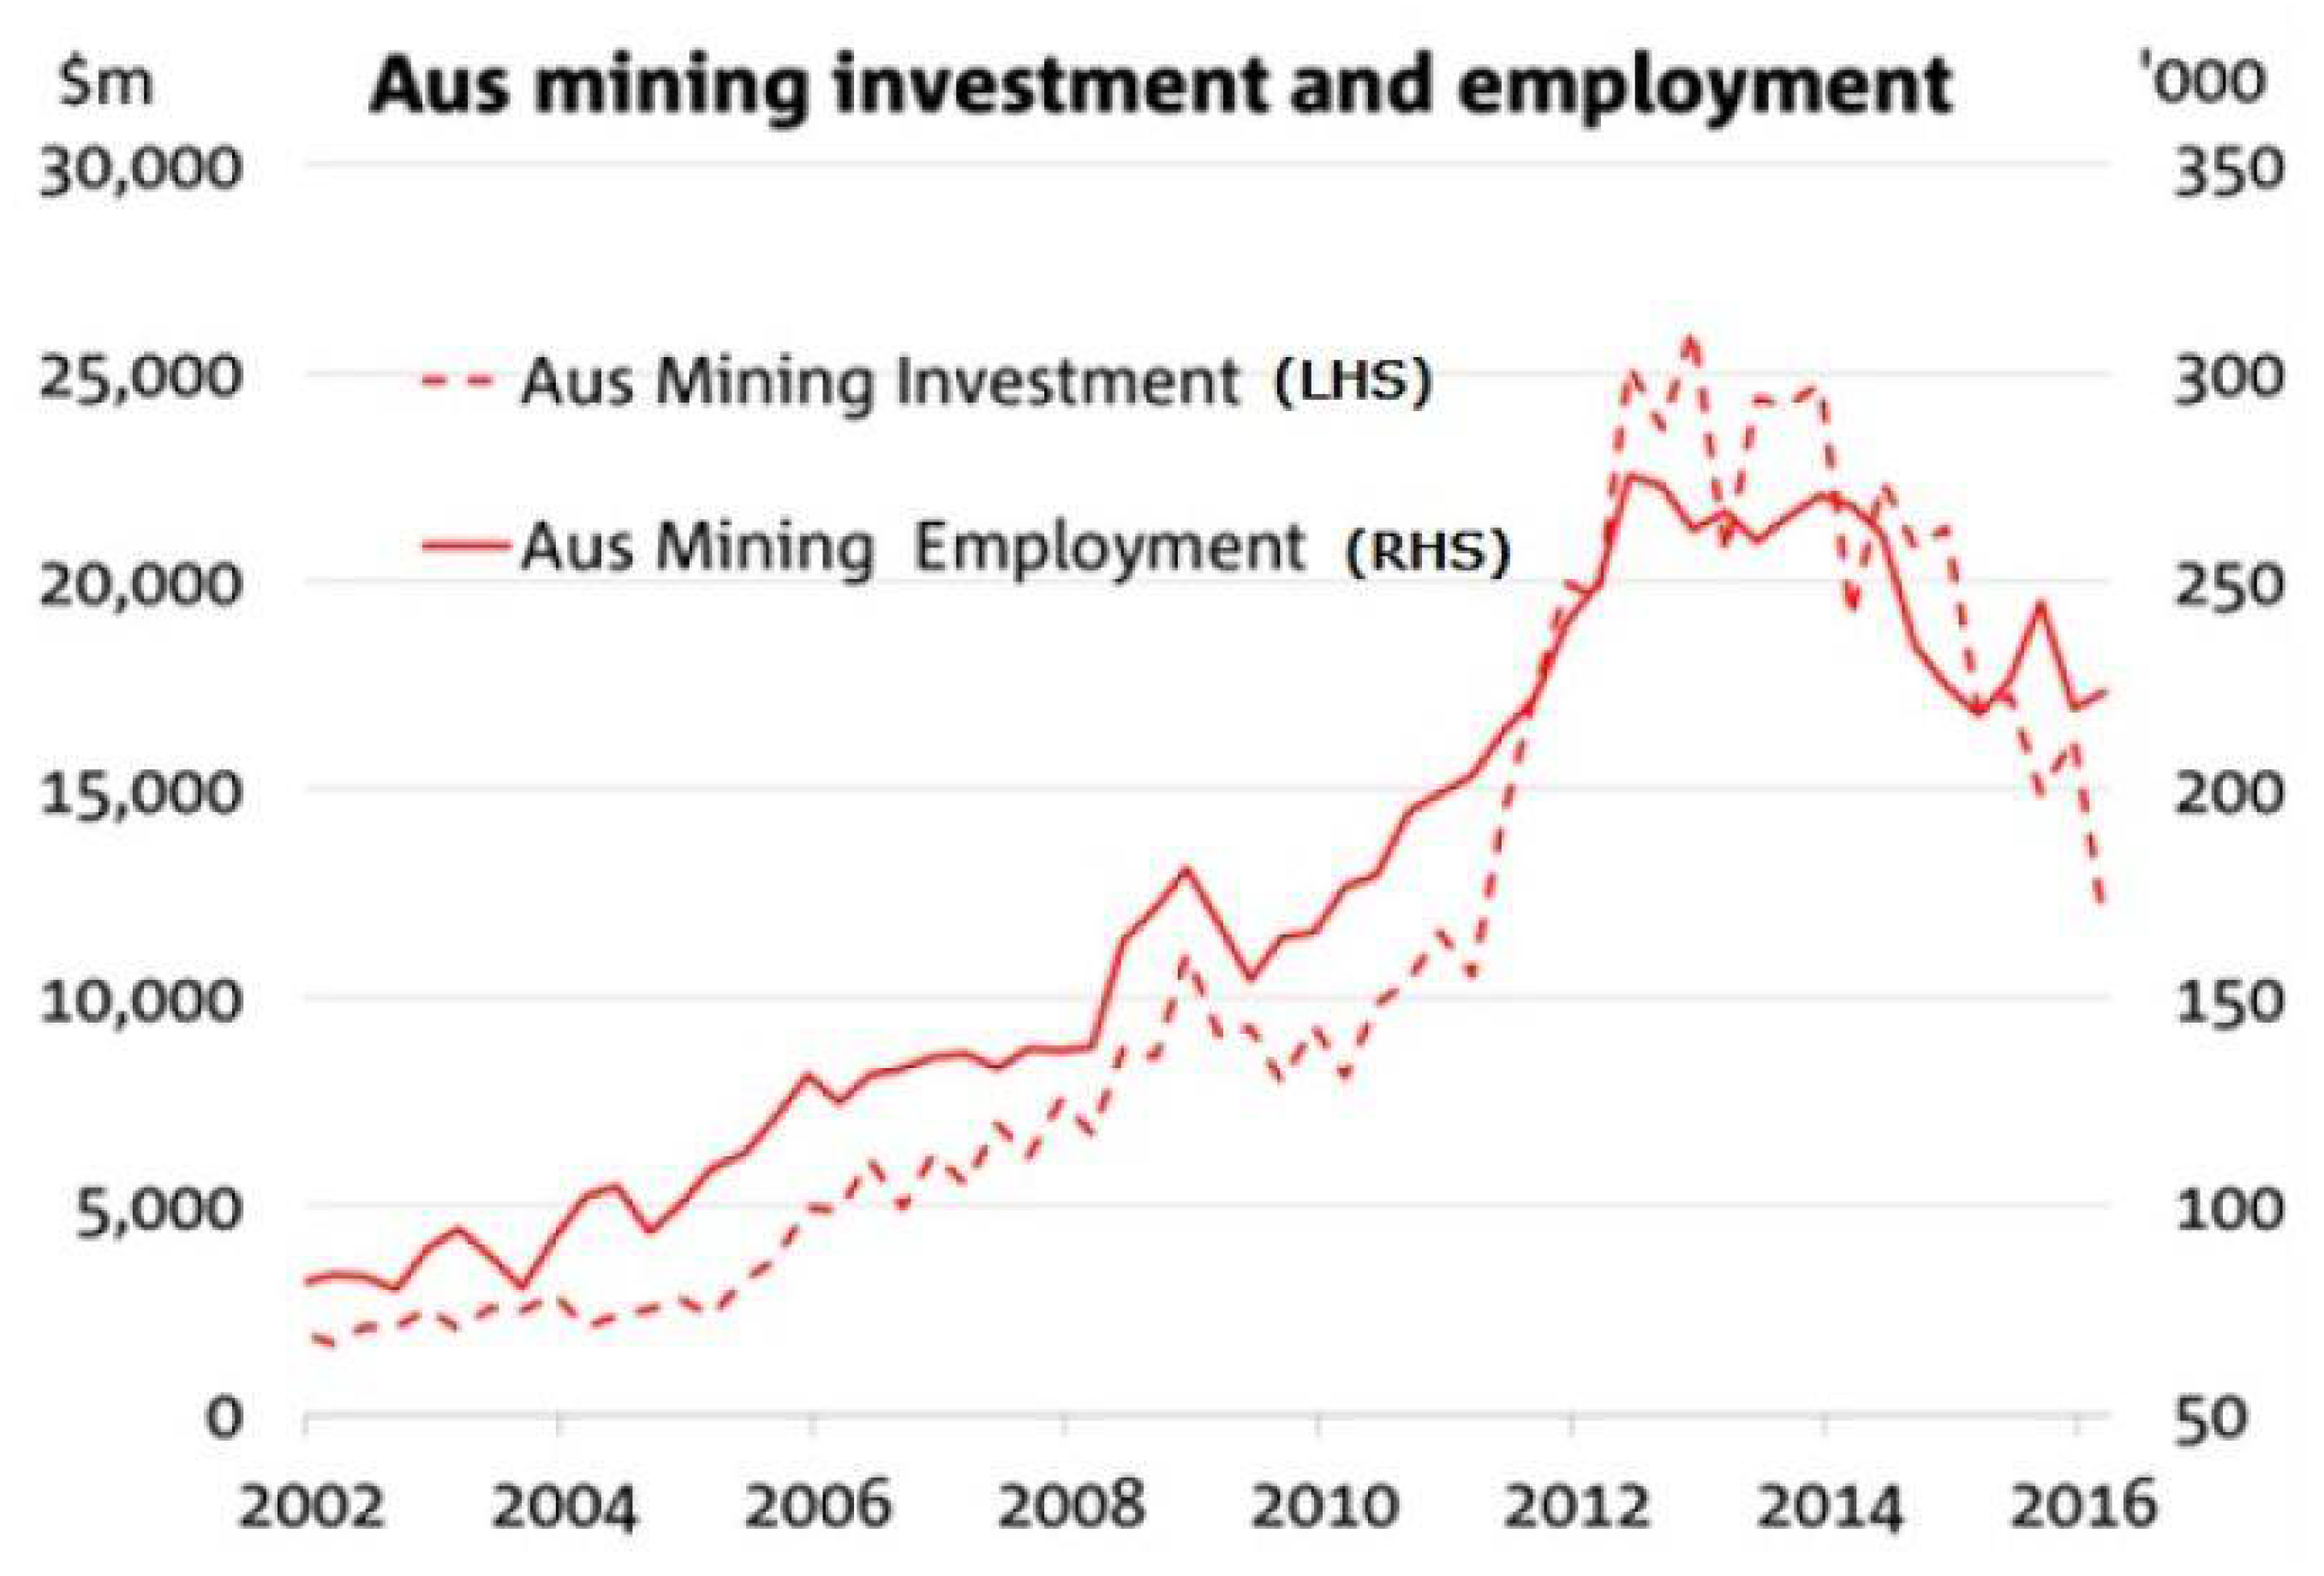
:1. Introduction
2. Literature Review
- ○
- Z = Discriminant Score of Company;
- ○
- i & c = Estimated Parameters;
- ○
- xi = Independent Variables (the five ratios previously mentioned).
3. Data
4. Methodology
4.1. Logistic Regression (LR)
4.2. Decision Trees (DT)
4.3. Random Forests (RF)
4.4. Stochastic Gradient Boosting (SGB)
4.5. Cut-Off Values for Classification
5. Results
5.1. LR Model
5.2. Decision Tree Model
5.3. Random Forests Model
5.4. Stochastic Gradient Boosting Model
6. Conclusions
Author Contributions
Conflicts of Interest
References
- Altman, Edward I. 1968. Financial Ratios Discriminant Analysis & the Prediction of Corporate Bankruptcy. The Journal of Finance 23: 589–609. [Google Scholar]
- Altman, Edward I. 1993. Corporate Financial Distress and Bankruptcy, 2nd ed. New York: John Wiley & Sons. [Google Scholar]
- Altman, Edward I., Malgorzata Iwanicz-Drozdowska, Erkki Laitinen, and Arto Suvas. 2014. Distressed Firm and Bankruptcy Prediction in an International Context: A Review and Empirical Analysis of Altman’s Z-Score Model. Available online: https://ssrn.com/abstract=2536340 (accessed on 15 April 2018).
- Anderson, Seth. 2006. Anderson, Investment Management and Mismanagement: History, Findings, and Analysis. New York: Springer Science & Business Media, vol. 17. [Google Scholar]
- ASIC. 2015. Corporate Insolvencies: September Quarter 2015. Sydney: Australian Securities & Investments Commission. [Google Scholar]
- Bayley, Luke, and Stephen Taylor. 2007. Identifying Earnings Overstatements: A Practical Test. Available online: https://ssrn.com/abstract=995957 (accessed on 10 May 2018).
- Beaver, William H. 1966. Financial ratios as predictors of failure. Journal of Accounting Research 4: 71–111. [Google Scholar] [CrossRef]
- Beneish, Messod. 1997. Detecting GAAP violation: Implications for assessing earnings management among firms with extreme financial performance. Journal of Accounting and Public Policy 16: 271–309. [Google Scholar] [CrossRef]
- Bhattacharyya, Siddhartha, Sanjeev Jha, Kurian Tharakunnel, and J. Christopher Westland. 2011. Data mining for credit card fraud: A comparative study. Decision Support Systems 50: 602–13. [Google Scholar] [CrossRef]
- Breiman, Leo. 1984. Classification and Regression Trees. Boca Raton: CRC Press. [Google Scholar]
- Chandra, Karthik, Vadlamani Ravi, and Indranil Bose. 2009. Failure prediction of dotcom companies using hybrid intelligent techniques. Expert Systems with Applications 36: 4831–37. [Google Scholar] [CrossRef]
- Chen, Mu-Yen. 2011. Predicting corporate financial distress based on integration of decision tree classification and logistic regression. Expert Systems with Applications 38: 11261–72. [Google Scholar] [CrossRef]
- Chung, Kim Choy, Shin Shin Tan, and David K. Holdsworth. 2008. Insolvency Prediction Model Using Multivariate Discriminant Analysis and Artificial Neural Network for the Finance Industry in New Zealand. International Journal of Business and Management 39: 19–28. [Google Scholar]
- Cybinski, Patti. 2001. Description, explanation, prediction—The evolution of bankruptcy studies. Managerial Finance 27: 29–44. [Google Scholar] [CrossRef]
- Daniel, Brindescu, and Ionut Golet. 2013. Prediction of corporate bankruptcy in Romania through the use of logistic regression. Annals of Faculty of Economics 1: 976–86. [Google Scholar]
- Fantazzini, Dean, and Silvia Figini. 2009. Random survival forests models for SME credit risk measurement. Methodology and Computing in Applied Probability 11: 29–45. [Google Scholar] [CrossRef]
- FitzPatrick, Paul J. 1932. A Comparison of the Ratios of Successful Industrial Enterprises with Those of Failed Companies. Washington: The Certified Public Accountant, pp. 598–605. [Google Scholar]
- Geng, Rubin, Indranil Bose, and Xi Chen. 2015. Prediction of financial distress: An empirical study of listed Chinese companies using data mining. European Journal of Operational Research 24: 236–47. [Google Scholar] [CrossRef]
- Gepp, Adrian. 2015. Financial Statement Fraud Detection Using Supervised Learning Methods. Gold Coast: Bond University. [Google Scholar]
- Gepp, Adrian, and Kuldeep Kumar. 2012. Business Failure Prediction Using Statistical Techniques: A Review. In Some Recent Developments in Statistical Theory and Applications. Boca Raton: Brown Walker Press, pp. 1–25. [Google Scholar]
- Gepp, Adrian, Kuldeep Kumar, and Sukanto Bhattacharya. 2010. Business failure prediction using decision trees. Journal of Forecasting 29: 536–55. [Google Scholar] [CrossRef]
- Halteh, Khaled. 2015. Bankruptcy prediction of industry-specific businesses using logistic regression. Journal of Global Academic Institute Business & Economics 1: 151–63. [Google Scholar]
- Hua, Zhongsheng, Yu Wang, Xiaoyan Xu, Bin Zhang, and Liang Liang. 2007. Predicting corporate financial distress based on integration of support vector machine and logistic regression. Expert Systems with Applications 33: 434–40. [Google Scholar] [CrossRef]
- Huarng, Kun, Hui Yu, and Cheng Chen. 2005. The application of decision trees to forecast financial distressed companies. Paper presented at the International Conference on Intelligent Technologies and Applied Statistics, Taipei, Taiwan, June 25. [Google Scholar]
- Hung, Chihli, and Jing-Hong Chen. 2009. A selective ensemble based on expected probabilities for bankruptcy prediction. Expert Systems with Applications 36: 5297–303. [Google Scholar] [CrossRef]
- Jaikengit, Aim. 2004. Corporate Governance and Financial Distress: An Empirical Analysis—The Case of Thai Financial Institutions. Ph.D. Thesis, Case Western Reserve University, Cleveland, OH, USA. [Google Scholar]
- Kumar, P. Ravi, and Vadlamani Ravi. 2007. Bankruptcy prediction in banks and firms via statistical and intelligent techniques—A review. European Journal of Operational Research 180: 1–28. [Google Scholar] [CrossRef]
- Kumar, Kuldeep, and Clarence Tan. 2005. Some recent developments in financial distress prediction. In Bulletin of the International Statistical Institute. Oxford: International Statistical Institute. [Google Scholar]
- Laitinen, Erkki K., and Teija Laitinen. 2001. Bankruptcy prediction: application of the Taylor’s expansion in logistic regression. International Review of Financial Analysis 9: 327–49. [Google Scholar] [CrossRef]
- Lee, Sangjae, and Wu Choi. 2013. A multi-industry bankruptcy prediction model using back-propagation neural network and multivariate discriminant analysis. Expert Systems with Applications 40: 2941–46. [Google Scholar] [CrossRef]
- Letts, Stephen. 2016. Mining Industry to Lose 50,000 More Jobs as Boom Comes to an End: NAB. ABC News. June 11. Available online: http://www.abc.net.au/news/2016-06-10/mining-boom-halfway-down-the-mining-cliff/7500700 (accessed on 30 September 2016).
- Mensah, Yaw. 1984. An examination of the stationarity of multivariate bankruptcy prediction models: A methodological study. Journal of Accounting Research 22: 380–95. [Google Scholar] [CrossRef]
- MorningStar. 2015. Available online: http://corporate.morningstar.com/au/asp/subject.aspx?xmlfile=5677.xml (accessed on 2 April 2015).
- MorningStar. 2016. About DatAnalysis. Available online: http://datanalysis.morningstar.com.au/af/help (accessed on 5 August 2016).
- Mukkamala, Srinivas, Armando Vieira, and Andrew H. Sung. 2006. Model selection and feature ranking for financial distress classification. Paper presented at the 8th International Conference on Enterprise Information Systems (ICEIS 2006), Paphos, Cyprus, May 23–27. [Google Scholar]
- Nanni, Loris, and Alessandra Lumini. 2009. An experimental comparison of ensemble of classifiers for bankruptcy prediction and credit scoring. Expert Systems with Applications 36: 3028–33. [Google Scholar] [CrossRef]
- Ohlson, James. 1980. Financial ratios and the proabilistic prediction of bankruptcy. Journal of Accounting Research 18: 109–31. [Google Scholar] [CrossRef]
- Perez, Muriel. 2006. Artificial neural networks and bankruptcy forecasting: A state of the art. Neural Computer & Application 15: 154–63. [Google Scholar]
- Perols, Johan. 2011. Financial statement fraud detection: An analysis of statistical and machine learning algorithms. Auditing: A Journal of Practice & Theory 30: 19–50. [Google Scholar]
- Ravi, Vadlamani, Parmalik Kumar, Eruku Srinivas, and Nikola Kasabov. 2007. A Semi-Online Training Algorithm for the Radial Basis Function Neural Networks: Applications to Bankruptcy. In Advances in Banking Technology and Management: Impacts of ICT and CRM: Impacts of ICT and CRM. Pennsylvania: IGI-Global. [Google Scholar]
- Shah, Nikita. 2014. Developing Financial Distress Prediction Models Using Cutting Edge Recursive Partitioning Techniques: A Study of Australian Mining Performance. Review of Integrative Business and Economics 3: 103–43. [Google Scholar]
- Shultz, Kenneth S., Calvin C. Hoffman, and Roni Reiter-Palmon. 2005. Using archival data for IO research: Advantages, pitfalls, sources, and examples. The Industrial-Organizational Psychologist 42: 31–37. [Google Scholar]
- Smith, Malcolm, Yun Ren, and Yinan Dong. 2011. The predictive ability of “conservatism” and “governance” variables in corporate financial disclosures. Asian Review of Accounting 19: 171–85. [Google Scholar] [CrossRef]
- Sun, Jie, and Hui Li. 2008. Data mining method for listed companies’ financial distress prediction. Knowledge-Based Systems 21: 1–5. [Google Scholar] [CrossRef]
- Whiting, David, James Hansen, James McDonald, Conan Albrecht, and W. Steve Albrecht. 2012. Machine learning methods for detecting patterns of management fraud. Computational Intelligence 28: 505–27. [Google Scholar] [CrossRef]
- Winakor, Arthur, and Raymond Smith. 1935. Changes in the Financial Structure of Unsuccessful Industrial Corporations. Bulletin 51: 1–41. [Google Scholar]
- Yu, Qi, Yoan Miche, Eric Séverin, and Amaury Lendasse. 2014. Bankruptcy prediction using extreme learning machine and financial expertise. Neurocomputing 128: 296–302. [Google Scholar] [CrossRef]
- Zhang, Heping, and Burton Singer. 2010. Recursive Partitioning and Applications, 2nd ed. New York: Springer. [Google Scholar]


| Method | Percentage in Literature |
|---|---|
| MDA | 27.45% |
| LR | 25.49% |
| DT | 7.84% |
| RF | 5.88% |
| SGB | 5.88% |
| Variable | Description |
|---|---|
| Net Profit Margin | Net Profit/Revenue |
| EBIT Margin | Earnings Before Interest and Tax/Net Revenue |
| Return on Equity (ROE) | Net Profit After Tax/(Shareholders Equity − Outside Equity Interests) |
| Return on Assets (ROA) | Earnings before interest/(Total Assets Less Outside Equity Interests) |
| Return on Invested Capital (ROIC) | Net Operating Profit Less Adjusted Tax/Operating Invested Capital |
| NOPLAT Margin | Net Operating Profit Less Adjusted Tax/Revenue |
| Inventory Turnover | Net Sales/Inventory |
| Asset Turnover | Operating Revenue/Total Assets |
| PPE Turnover | Revenue/(Property, Plant & Equipment − Accumulated Depreciation) |
| Depreciation/PP&E | Depreciation/Gross PPE |
| Depreciation/Revenue | Depreciation/Revenue |
| Working Cap/Revenue | Working Capital/Revenue |
| Working Cap Turnover | Operating Revenue/Operating Working Capital |
| Gross Gearing (D/E) | (Short-Term Debt + Long-Term Debt)/Shareholders Equity |
| Financial Leverage | Total Debt/Total Equity |
| Current Ratio | Current Assets/Current Liabilities |
| Quick Ratio | (Current Assets − Current Inventory)/Current Liabilities |
| Gross Debt/CF | (Short-Term Debt + Long-Term Debt)/Gross Cash Flow |
| Cash per Share ($) | Cash Flow/Shares Outstanding |
| Invested Capital Turnover | Operating Revenue/Operating Invested Capital Before Goodwill |
| Net Gearing | (Short-Term Debt + Long-Term Debt − Cash)/Shareholders Equity |
| NTA per Share ($) | Net Tangible Assets (NTA)/Number of Shares on Issue |
| BV per Share ($) | (Total Shareholder Equity − Preferred Equity)/Total Outstanding Shares |
| Receivables/Op. Rev. | Debtors/Operating Revenue |
| Inventory/Trading Rev. | Inventory/Trading Revenue |
| Creditors/Op. Rev. | Creditors/Operating Revenue |
| Sales per Share ($) | Total Revenue/Weighted Average of Shares Outstanding |
| EV/EBITDA | Enterprise Value/Earnings Before Interest, Tax, Depreciation & Amortisation |
| PER | Price/Earnings Ratio = {(Market Value of Share)/(Earnings per Share)} |
| Sample Partition | Number of Rows | Percentage | Not Risky Companies | Risky Companies | Class Imbalance % |
|---|---|---|---|---|---|
| Train | 2700 | 80.00% | 2419 | 281 | 89.59% Not Risky − 10.41% Risky |
| Test | 675 | 20.00% | 617 | 58 | 91.41% Not Risky − 8.59% Risky |
| Total | 3375 | 100.00% | 3036 | 339 | 89.96% − 10.04% Risky |
| Classification Table | ||||||||
|---|---|---|---|---|---|---|---|---|
| Observed | Predicted | |||||||
| Training | Testing | |||||||
| Status | Percentage Correct | Status | Percentage Correct | |||||
| Risky | Not Risky | Risky | Not Risky | |||||
| Step 1 | Status | Risky (0) | 2 | 279 | 0.7 | 0 | 58 | 0.0 |
| Not Risky (1) | 2 | 2417 | 99.9 | 2 | 615 | 99.7 | ||
| Overall Percentage | 89.6 | 91.1 | ||||||
| (a) | (b) | |||||||
| Train Sample | Test Sample | |||||||
| Class | Cases | Misclassified | % Error | Class | Cases | Misclassified | % Error | |
| Risky (0) | 281 | 111 | 39.50% | Risky (0) | 58 | 16 | 27.59% | |
| Not Risky (1) | 2419 | 1422 | 58.78% | Not Risky (1) | 617 | 364 | 59.00% | |
| (c) | ||||||||
| Accuracy at Predicting Not Risky Companies (Specificity) | 41.00% | |||||||
| Accuracy at Predicting Risky Companies (Sensitivity) | 72.41% | |||||||
| Simple Average | 56.71% | |||||||
| (a) | (b) | ||||||
| Train Sample | Test Sample | ||||||
| Class | Cases | Misclassified | % Error | Class | Cases | Misclassified | % Error |
| 0 | 281 | 66 | 23.49% | 0 | 58 | 14 | 24.14% |
| 1 | 2419 | 788 | 32.58% | 1 | 617 | 200 | 32.41% |
| (c) | |||||||
| Accuracy at Predicting Not Risky Companies (Specificity) | 67.59% | ||||||
| Accuracy at Predicting Risky Companies (Sensitivity) | 75.86% | ||||||
| Simple Average | 71.72% | ||||||
| (a) | (b) | ||||||
| Train Sample | Test Sample | ||||||
| Class | Cases | Misclassified | % Error | Class | Cases | Misclassified | % Error |
| 0 | 281 | 81 | 28.83% | 0 | 58 | 13 | 22.41% |
| 1 | 2419 | 806 | 33.32% | 1 | 617 | 204 | 33.06% |
| (c) | |||||||
| Accuracy at Predicting Not Risky Companies (Specificity) | 66.94% | ||||||
| Accuracy at Predicting Risky Companies (Sensitivity) | 77.59% | ||||||
| Simple Average | 72.26% | ||||||
| (a) | (b) | ||||||
| Train Sample | Test Sample | ||||||
| Class | Cases | Misclassified | % Error | Class | Cases | Misclassified | % Error |
| 0 | 281 | 49 | 17.44% | 0 | 58 | 15 | 25.86% |
| 1 | 2419 | 596 | 24.64% | 1 | 617 | 165 | 26.74% |
| (c) | |||||||
| Accuracy at Predicting Not Risky Companies (Specificity) | 73.26% | ||||||
| Accuracy at Predicting Risky Companies (Sensitivity) | 74.14% | ||||||
| Simple Average | 73.70% | ||||||
| Model | Overall Model Accuracy | Most Important Variables | AUC % |
|---|---|---|---|
| Logistic Regression | Specificity: 41.00% Sensitivity: 72.41% Average: 56.71% | PER, Sales per Share, Gross Debt/CF | 59.00% |
| Decision Tree | Specificity: 67.59% Sensitivity: 75.86% Average: 71.72% | Invested Capital Turnover, BV per Share, NTA per Share | 74.00% |
| Random Forest | Specificity: 66.94% Sensitivity: 77.59% Average: 72.26% | Invested Capital Turnover, BV per Share, NTA per Share | 78.99% |
| Stochastic Gradient Boosting | Specificity: 73.26% Sensitivity: 74.14% Average: 73.70% | PPE Turnover, Invested Capital Turnover, PER | 88.98% |
© 2018 by the authors. Licensee MDPI, Basel, Switzerland. This article is an open access article distributed under the terms and conditions of the Creative Commons Attribution (CC BY) license (http://creativecommons.org/licenses/by/4.0/).
Share and Cite
Halteh, K.; Kumar, K.; Gepp, A. Using Cutting-Edge Tree-Based Stochastic Models to Predict Credit Risk. Risks 2018, 6, 55. https://doi.org/10.3390/risks6020055
Halteh K, Kumar K, Gepp A. Using Cutting-Edge Tree-Based Stochastic Models to Predict Credit Risk. Risks. 2018; 6(2):55. https://doi.org/10.3390/risks6020055
Chicago/Turabian StyleHalteh, Khaled, Kuldeep Kumar, and Adrian Gepp. 2018. "Using Cutting-Edge Tree-Based Stochastic Models to Predict Credit Risk" Risks 6, no. 2: 55. https://doi.org/10.3390/risks6020055
APA StyleHalteh, K., Kumar, K., & Gepp, A. (2018). Using Cutting-Edge Tree-Based Stochastic Models to Predict Credit Risk. Risks, 6(2), 55. https://doi.org/10.3390/risks6020055