

Trading Activity in the Corporate Bond Market: A SAD Tale of Macro-Announcements and Behavioral Seasonality?

1
Assistant Professor of Finance, School of Business Administration, SUNY New Paltz, New Paltz, NY 12561, USA
2
Research Associate, Center for International Securities and Derivatives Markets, Isenberg School of Management, University of Massachusetts, Amherst, MA 01003, USA
3
Professor (Emeritus) of Finance, Isenberg School of Management, University of Massachusetts, Amherst, MA 01003, USA
4
Independent
*
Author to whom correspondence should be addressed.
†
Author information: https://scholar.google.com/citations?user=H3NS68sAAAAJ&hl=en .
Risks 2024, 12(5), 80; https://doi.org/10.3390/risks12050080
Submission received: 28 January 2024
/
Revised: 26 April 2024
/
Accepted: 8 May 2024
/
Published: 14 May 2024
(This article belongs to the Special Issue Risk Analysis in Financial Crisis and Stock Market)
Abstract
:This study investigates the determinants of trading activity in the U.S. corporate bond market, focusing on the effects of Seasonal Affective Disorder (SAD) and macroeconomic announcements. Employing the General-to-Specific (Gets) Autometrics methodology, we identify distinct behavioral responses between retail and institutional investors to SAD, noting a significant impact on retail trading volumes but not on institutional trading or bond returns. This discovery extends the understanding of behavioral finance within the context of bond markets, diverging from established findings in equity and Treasury markets. Additionally, our analysis delineates the influence of macroeconomic announcements on trading activities, offering new insights into the market’s reaction to economic news. This study’s findings contribute to the broader literature on market microstructure and behavioral finance, providing empirical evidence on the interplay between psychological factors and macroeconomic information flow within corporate bond markets. By addressing these specific aspects with rigorous econometric techniques, our research enhances the comprehension of trading dynamics in less transparent markets, offering valuable perspectives for academics, investors, risk managers, and policymakers.
Keywords:
macroeconomic announcements; corporate bonds; trading; Autometrics; seasonality; seasonal affective disorder; behavioral financeJEL Classification:
G12; G14; C22; C52; C58; E441. Introduction
This research embarks on an in-depth exploration of the U.S. corporate bond market, a domain that combines features of both fixed-income and equity markets. At its core, this research investigates the multifaceted determinants of trading activity within this market, with a particular focus on the impact of “behavioral seasonal” effects, such as that of Seasonal Affective Disorder (SAD); informational effects, including macroeconomic announcements; and other traditional bond market factors, such as credit rating changes. Grounded in the robust application of the General-to-Specific (Gets) Autometrics method, this study dissects the interplay between these factors, uncovering significant insights into both institutional and retail investor behavior in the over-the-counter corporate bond market.
Our study gives primary attention to the impact of SAD on trading behaviors in the corporate bond market. This exploration is inspired by a growing body of research, including Kamstra and Kramer (2023), which has documented the effect of SAD in equity and U.S. Treasury markets.
Our research extends this line of inquiry to the corporate bond market, examining how the SAD cycle—characterized by a reduction in daylight hours beginning in mid-September, peaking in late December, and declining again by mid-June—influences trading decisions. The SAD cycle has been found to affect risk aversion and intertemporal substitution preferences of market participants in equity and fixed-income markets, making the corporate bond market a natural testing ground for the SAD hypothesis.
This cycle provides a compelling lens through which to analyze seasonal behavioral effects on market dynamics, a phenomenon yet to be thoroughly documented in the corporate bond market.
Figure 1 displays a graphical representation of the incidence and onset/recovery cycle of SAD based on New York City as a point of reference. The cycle begins with the shortening of daylight time in the middle of September and peaks in late December on the 354th day of the year. The cycle then declines to a minimum in mid-June. A growing number of studies have associated financial market activity with this seasonal factor.
Recent finance research has sought to explain the time-varying behavior of financial markets by linking risk aversion and intertemporal substitution preferences to seasonal, behavioral, and informational variables. While we expect the market for corporate debt to be informationally efficient, research suggests that the vastness of the corporate market offers gaps where markets may be slow to adjust to new information. For example, Wei (2018) observes that bonds purchased by individual investors exhibit lower performance in the subsequent month compared to bonds that have been heavily divested, whereas institutional investors experience the opposite. Additionally, Cai et al. (2019) show evidence of institutional herding behavior in the corporate bond market.
The corporate bond market exhibits characteristics that are shared by both fixed income and equity markets. The focus of this study is on investigating the determinants of trading activity in the US corporate bond market, considering factors such as behavioral seasonality, macroeconomic announcements, aggregate credit ratings activity, and other variables highlighted in the asset pricing and market microstructure literature. Previous research efforts have been limited in number in terms of exploring the factors influencing trading dynamics in the US corporate bond market, when compared to other financial markets. This limitation is attributed partially to constraints related to data availability, the relatively short lifespan of corporate debentures, time variation in the level of corporate bond issuances and redemptions, the comparatively low liquidity of corporate debt in contrast to sovereign bonds and equities, as well as other institutional considerations. Given the hypothesized time-varying risk aversion and intertemporal substitution preferences associated with the SAD cycle, it is particularly important to understand how the effects are transmitted in less-liquid debt markets where price discovery is facilitated by a core group of “top bonds” that dealers hold in inventory to meet client demand.
The methodology of this research leverages advanced econometric techniques, notably the Gets modeling approach.1 This method is renowned for its flexibility and efficacy in identifying the underlying dynamics in economic data. The automated Autometrics implementation allows for analysis of the intricate relationships between psychological factors, macroeconomic events, and both performance and trading activity. The objective is to estimate a parsimonious, encompassing, and congruent model of significant drivers of returns and trading activity. Our application of automated Gets extends the existing body of knowledge on fixed-income market mechanics by highlighting a previously unexplored form of nonlinear deterministic seasonality, while demonstrating the utility of machine learning (ML) techniques commonly applied in macroeconomic analysis.
Our findings reveal that the SAD cycle has a pronounced effect on overall investment-grade (IG) trading activity, increasing trading during the onset of symptoms and decreasing during recovery. High-yield (HY) bonds increase in trade frequency based on the incidence of the SAD variable. Results suggest a possible substitution effect between IG and HY bond sectors. The results appear to be driven by retail investors, as the effect is not found in more sophisticated institutional investors. We find that dealers are affected by SAD only to the extent that inter-dealer trades are required to facilitate changing retail demand over the SAD cycle.
In addition to this, the influence of macroeconomic releases on the corporate bond market constitutes a key focus of our investigation. Studies such as those by Green (2004), Savor and Wilson (2013, 2014), and Ai and Bansal (2018) have demonstrated the significant influence of economic news on bond prices and trading volumes. These insights form a crucial part of our analysis, as we examine how the announcement risks shape market behaviors and investor decisions. Macroeconomic announcements were found to have a significant impact on both bond market returns and trading activity.
Both labor market measures, nonfarm payrolls and initial jobless claims, and inflation data, core consumer and producer price inflation, are shown to have highly significant effects. These results not only affirm the critical role of behavioral seasonality and shocks to macroeconomic factors in the corporate bond market but also pave the way for new studies on trading and risk management. The integration of these findings into existing market models offers a meaningful perspective on the interplay between psychological factors and economic indicators, providing valuable insights for investors, policymakers, and market analysts.
While we do not find SAD effects in either stock or bond index returns, our results suggest that the over-the-counter and dealer-intermediated corporate bond market is a less likely candidate for this effect to be revealed on the performance side, as inter-dealer intermediation is required to facilitate additional retail demand over the SAD cycle, thus leaving these effects to be taken in the form of dealer commissions, as opposed to retail trader profits.
Our findings of significant SAD effects on trading activity for IG and HY total trades, but not institutional, suggest that retail investors are affected by SAD—with a possible substitution effect between IG and HY. The effect is also indicated in inter-dealer-intermediated (IDI) transaction regressions. These findings have implications for microstructure research and regulation, suggesting a greater investigation of dealer transaction costs for retail trade over the cycle.
2. Literature Review
Research has highlighted the significant yet often underappreciated effect of SAD on financial markets. However, there is a robust literature regarding the role macroeconomic variables play in shaping the dynamics of financial market trading and returns. This literature review focuses primarily on these key areas to provide insight into the functioning of the corporate bond market and its relation to psychological and economic forces, while also acknowledging other relevant factors like market microstructure and temporal influences.
2.1. Seasonal Affective Disorder
The primary area of interest in this study is the relationship between Seasonal Affective Disorder and corporate bond trading. The findings of previous studies have established a significant correlation between Seasonal Affective Disorder and trading behavior in equity and US Treasury markets, but a gap exists with respect to corporate debt markets. The impact of SAD on both institutional and retail investors has been noted, emphasizing the influence of seasonal psychological factors on market dynamics.
Building on earlier research that investigated daylight savings time effects, Kamstra et al. (2003) documented SAD effects in the stock market. Garrett et al. (2005) later employed a modified CAPM, which accommodates varying risk pricing according to seasonal differences in daylight length that effectively captures the SAD effect across international equity markets. Lin (2015) find that SAD is linked to how stocks respond to earnings announcements. Later, Kamstra et al. (2014) provided theoretical contributions suggesting that intertemporal substitution and risk aversion evolve seasonally in both equity and Treasury markets.
Levi et al. (2015) extend this line of inquiry by documenting an 80-basis-point cycle in US Treasury rates that is not associated with macroeconomic seasonality, sentiment, weather, auctions, supply, or monetary policy. They suggest that seasonal mood changes drive this cycle in a data-snooping robust reality test. Dolvin et al. (2009) suggest that the SAD effect exerts pressure on analyst earnings estimates. Additionally, Kamstra et al. (2017) provide evidence that SAD effects are also found in mutual fund asset flows. Together, these articles provide highly compelling evidence that Seasonal Affective Disorder has a significant impact on financial markets.
Still, several other authors offer critical assessments and contrary findings, such as Jacobsen and Marquering (2008), Kelly and Meschkle (2010), and Keef and Khaled (2011). However, these have been rebutted in Kamstra et al. (2009) and Kamstra et al. (2012). A recent summary of SAD-related effects is found in Kamstra and Kramer (2023).
However, relatively scarce investigation of SAD in the corporate bond market has been observed in the peer-reviewed literature. To our knowledge, the only application in this market in the literature is Frühwirth and Sögner (2015), who show no direct effect of SAD on corporate bond yield spreads but do find limited significance of an interaction with weather for lower-rated IG bonds. Although they investigate neither trade frequency nor do they control for macroeconomic announcement surprises, the results provide an excellent base of comparison.
2.2. Macroeconomic Effects
Relative to equity and Treasury markets, there are fewer studies that directly measure macroeconomic announcements on corporate debt markets. However, Treasury and stock market studies also provide useful information. With respect to the former, Elton et al. (2001) investigated scheduled macroeconomic announcement effects on bond prices, trading activity, and liquidity (bid–ask spreads) in the U.S. Treasury market, finding that economic news significantly influences bond prices and trading volume.
Similarly, Green (2004) observed a significant increase in the informational role of trading following economic announcements, indicating that the release of public information increases the level of information asymmetry in the government bond market. This suggests that macroeconomic announcements play a crucial role in driving the dynamics of bond trading activity.2
Researchers have long sought to develop theoretical foundations between macroeconomic factors and equity and bond markets. Recently, (Savor and Wilson 2013; Savor and Wilson 2014) and Ai and Bansal (2018) provided new insights, both theoretical and empirical, into risk–return tradeoffs faced by financial market participants relative to the information content of these regularly scheduled announcements. The results have since been extended by Fisher et al. (2022) to the measurement of macroeconomic announcement risk attention in the stock market.
Dewachter et al. (2019) show that real activity, inflation, and financial factors have an important role in determining the dynamics of both the term structure of risk-free rates and corporate credit spreads. Also, Wachter and Zhu (2021) show that much of the total equity premium is realized with macro-announcement days. Market betas, which measure systematic risk, and expected return associations are found to be concentrated on announcement days.
Despite mounting evidence suggesting that macroeconomic announcements are central aspects affecting expected returns and the risk aversion of competing equity and debt securities, less research has been conducted on macro-surprises in corporate debt markets; however, there are notable exceptions.
For instance, Chatrath et al. (2012) suggest that corporate bonds and Treasuries react asymmetrically to macro-shocks, with positive macro-shocks depressing yields on corporates and raising Treasury rates. This suggests that investors are shifting across different classes of bonds. Corporate bonds behave similarly to equity counterparts and are more sensitive to negative macro-shocks than positive shocks.
Jiang and Sun (2015) suggest that corporate bond trading activity spikes before macroeconomic announcements but that there is no change on announcement days and on days following announcements.
2.3. Microstructural and Other Effects
A growing number of studies explored the FINRA Trade Reporting and Compliance (TRACE) data to access this market in ways that were yet unavailable. Due to the previous unavailability of OTC transaction data, these studies have grown in number since the expansion of TRACE. As a result, critical insights are emerging with respect to microstructure topics such as liquidity and the role of dealers in facilitating retail and institutional demand.
According to Li and Galvani (2021), top bonds attract more informed trading and convey information more rapidly compared to “nontop” bonds. Wei and Zhou (2016) assess the information content of corporate debt transactions prior to earnings reports, showing that the direction of pre-announcement trading is linked to earnings surprises and that abnormal bond trading has predictive power for post-announcement returns. This finding suggests that there may be a greater degree of information asymmetry and strategic trading in the corporate bond market, particularly for top bonds.3
2.4. Deterministic Seasonality, Other Effects, and Modeling Implications
The literature review thus far has three facets—non-deterministic seasonality in the form of SAD effects, informational effects by way of surprises in macroeconomic announcements, and microstructure effects based on retail and institutional demand and the inter-dealer network providing liquidity to market participants. While these highlighted facets are our primary focus, other important regularities are documented in the literature that are also important to consider.
For example, it is well established that bond issues traditionally trade most frequently when they are first issued and less frequently as time passes and the issues become “seasoned”. This phenomenon is shown in Lindvall (1977), Schneeweis and Woolridge (1979), and Sorensen (1982). Likewise, various forms of deterministic seasonality have been found in financial markets, such as day-of-week, month-of-year, and holiday effects. For example, Hong and Yu (2009) suggest vacation effects in equity trading. Murfin and Petersen (2016) find 19-basis-points-cheaper lending from financial institutions during seasonal “sales” in late spring and autumn, compared to winter and summer. Likewise, holiday effects are well documented.4 The well-known tax-loss trading rule articulated by Branch (1977) exerts the “January Effect” in asset markets and is discussed in Thaler (1987), Bhardwaj and Brooks (1992), and Maxwell (1998).5
Collectively, the body of work suggests that modeling returns and/or trading activity requires a rigorous methodology that is flexible enough to deal with various sources of variation. For example, corporate bond returns and trading activity regressions each may suggest different factors and/or lag structures.
In efficient markets, Fama (1991) suggests that we would not expect significant lag effects on announcements in performance regressions, as new information would be quickly priced into market prices. However, given the nature of the OTC dealer market and the relative illiquidity of corporate bonds, it would not be unrealistic to see lagged changes in trading activity after announcements as well as “set-up” effects, modeled by lead dummy variables. We chose the automated Gets modeling framework to reduce the model to a statistically admissible model for each dependent variable under examination. The details are discussed in the following section.
3. Empirical Methodology
Our empirical methodology involves a Gets model discovery reduction in a high-dimensional autoregressive distributed lag model to a parsimonious, congruent, and encompassing terminal model which passes a full battery of specification tests. The distributed lag methodology has been a staple in the field of economics since its inception by Fisher (1925), within the realm of measuring business cycle fluctuations, and has been utilized across a wide array of economic domains (including agricultural and resource economics, monetary economics, and finance).6 The models are particularly informative when analyzing the dynamics of economic processes in the presence of institutional or technological rigidities.
In macroeconomic time series analysis, the ARDL approach of Pesaran and Shin (1998) and Pesaran et al. (2001) has become particularly popular with respect to modeling cointegrated time series when the series include a mix of I(0) and I(1) variables. This method was elegantly discussed and employed in Nica et al. (2023) within the macro-finance context of financial contagion.
Financial markets tend to exhibit a high degree of informational efficiency—meaning that prices incorporate all historical data rapidly—suggesting that there should be no significant lags in daily performance regressions. Given the reduced liquidity, transparency, and trade frequency in corporate bonds, we suspect an increase in trading ahead of announcements as suggested by Jiang and Sun (2015). Further, we expect that trading activity is substantially impacted on and in the days surrounding holidays, in December and/or January due to the aforementioned tax strategies; that the sample of trades will decline over time due to seasoning; and that the SAD behavioral seasonal will alter trading activity as well as macroeconomic announcements. Given the range of factors explored in the literature and the challenges associated with modeling corporate bond trading, we choose a flexible machine learning (ML) approach based on the Gets methodology.
3.1. General-to-Specific Modeling and Autometrics
The Gets methodology provides a framework for model discovery built on a foundation of statistical adequacy—based largely on the Gauss–Markov properties. A model is discovered by a model reduction algorithm designed to produce a statistically adequate model specification that conforms with the local data generating process (LDGP)—i.e., the joint density of the conditioning variables.
We would expect residuals from the reduced models to be NIID—i.e., the model is congruent with the LDGP. However, regressions of financial market data often fail to meet this critical standard of the Gauss–Markov properties. Financial market data are often afflicted with multiple sources of econometric mis-specifications. These include outliers, location shifts, measurement error, parameter non-constancy, and excess kurtosis in the residual distribution.
Further, modelers are faced with choices such as whether to adjust out-seasonality or to model the these important regularities. Hoover and Perez (1999) demonstrate automated Gets modeling algorithms that effectively reduce a high-dimensional General Unrestricted Model (GUM) down to a parsimonious, encompassing, and congruent terminal model. Autometrics is a machine learning implementation of the Gets methodology extensively documented in the literature.7 The model is algorithmically reduced along many search paths to a set of statistically admissible terminal models that pass all Gauss–Markov-based specification tests, as well as tests for parameter stability and for encompassing the General Unrestricted Model.
To visualize what automated Gets modeling seeks to achieve, consider Figure 2 (Panel A), which provides graphical specification tests on a first-order autoregressive model of the number of total daily trades for IG bonds. We see that the residuals exhibit a marked cyclical pattern in the residual plot and observe higher-order serial dependence in the corresponding correlogram. Furthermore, we observe that the model behaves quite erratically, particularly in the left tail in the QQ plot. The density is observed to be asymmetric, with extreme outliers in the left table. Gets seeks to produce a congruent representation of the local data-generating process when there are potentially many factors of interest from a theoretical perspective. Given the wide range of factors suggested in the literature, Gets modeling is an appropriate methodology for this application—provided that the algorithm can produce a congruent result.8 As we see in Figure 2 (Panel B), the Gets approach with saturation results in well-behaved residuals that are white noise, normally distributed, and serially uncorrelated.
To address mis-specification adequately, we utilize an econometric approach designed to provide robust parameter estimates under such adverse situations. We employ the General-to-Specific (Gets) modeling approach using Autometrics. Foundations of the approach are provided in Hendry (1993) and Hendry (1995), while recent extensions and improvements are laid out in Hendry and Doornik (2014) and Hendry (2024).9
Autometrics is a machine learning Gets-based approach that commences from a broad General Unrestricted Model (GUM) and then employs an automated “testing down” procedure to reduce the model to a statistically valid representation of the data generating process (DGP). The algorithm reduces the unrestricted model based on the characteristics of the local data-generating process—i.e., the joint density of the independent variables. It employs an iterative process to systematically eliminate statistically insignificant variables based on a pre-set significance threshold.
Autometrics conducts a battery of diagnostic mis-specification tests to ensure model adequacy, including tests for autocorrelation, heteroskedasticity (White’s test), autoregressive conditional heteroskedasticity (ARCH test by Engle), normality (Doornik–Hansen test), and nonlinearity (Ramsey’s RESET test). The resulting terminal specification is a more parsimonious and statistically robust model, efficiently capturing the essential dynamics of the data.10 To limit false retention to 1 out of 100 parameters, the target size is set to 0.01. The properties of the Autometrics algorithm are detailed extensively in Doornik (2009).11
While Gets was initially employed in macroeconomics, a growing number of recent studies have applied it to a financial market setting: Sucarrat and Escribano (2012), Bekaert et al. (2012), Bekaert and Hoerova (2014), Stillwagon (2016), Stillwagon (2017), Frydman and Stillwagon (2018), Frydman et al. (2020), Bekaert and Mehl (2019), and Bonnier (2022).12
Particularly important are the recent extensions to the Gets methodology, such as impulse indicator saturation (IIS) and step indicator saturation (SIS). We believe these represent key innovations in this area of research and note recent work outside of economics and finance, such as the use of indicator saturation to detect volcanic activity in Pretis et al. (2016). We employ both IIS and SIS in our analysis.
IIS is a robust estimation method used in econometrics to detect and remove outliers, data contamination, and location shifts in models. Johansen and Nielsen (2009) derive the asymptotic theory of this one-step M-estimator based on Huber’s skip function for stationary processes, as well as trend stationary autoregressions and unit root processes. The procedure involves adding an impulse indicator dummy variable for each observation to the set of candidate regressors, entered in blocks of T2, with significant outcomes retained. The process includes adding half the impulse indicators, recording significant outcomes, dropping that set, adding the other half, and recording significant outcomes again. The retained impulse indicators are then combined and selected based on significance. IIS has also been explored in Santos et al. (2007), Santos (2008), Castle and Hendry (2014), and Ericsson (2016).
SIS is a method used in model selection to detect location shifts that is described in Doornik et al. (2015) and Hendry and Pretis (2023). It involves adding a complete set of step indicators to a regression model. The step indicators take the form of a whole-sample vector, where each indicator represents the accumulation of steps up to a specific observation. The method involves a split-half analysis, where the model is divided into two subsets and significant step indicators are selected at each subset. The selected indicators are then combined, and the selection process is repeated. This method improves the non-null retention frequency compared to other methods like IIS and lasso. Castle et al. (2017) propose a test of systemic forecast failure, based on this method.
3.2. General Unrestricted Model
We proceed by specifying the General Unrestricted Model (GUM) containing all potential significant variables in Equation (1), in the form of a standard dynamic regression model. In this context, the autoregressive term ϕYt−1 allows the model to account for the persistence in the dependent variable. The time trend γt captures the seasoning effect—i.e., the expected decrease in bond trading as they age. The behavioral factors include two data series corresponding to the SAD literature, with one series corresponding to incidence and the other series to the onset/recovery cycle.
Equation (1): General Unrestricted Model [GUM0]
where
- is the dependent variable, representing returns and measures of trading activity.
- α (Alpha) is the constant term, representing the model’s intercept.
- ϕ (Phi) is the coefficient for the first-order autoregressive term Yt−1.
- γ (Gamma) is the coefficient for the time trend t, representing seasoning of corporate bonds—i.e., decrease in trading as bonds age.
- denotes behavioral SAD factors, with (Theta) coefficients.
- denotes the macroeconomic announcement variables, with i indicating the specific announcement and j representing the lag order (0 or 1). Announcements are unemployment claims, nonfarm payrolls, core CPI, and core PPI and are measured in both standardized surprises and absolute standardized surprises.13,14
- (Beta) are the coefficients for the macroeconomic announcement variables.
- represents other exogenous variables, with (Psi) as coefficients.
- SISs are the step indicator saturation variables, capturing level shifts or structural breaks, with τs (Tau) coefficients.
- IISl are the impulse indicator saturation variables, addressing outlier effects at specific points in time, with λl (Lambda) as coefficients.
- ϵt (Epsilon) is the error term, accounting for unobserved factors affecting Yt.
The double summation for macroeconomic announcements captures both their immediate and potential lagged impacts. If we assume the corporate bond market is informationally efficient, we expect the lagged macro-announcement terms to be insignificant in the performance regressions and drop out in the Gets reduction. However, we do not rule out lagged effects in trading activity that could reflect market frictions and informational inefficiencies.
Exogenous variables allow the model to include other relevant influences outside the core focus on macroeconomic announcements. Importantly, we control for contemporaneous and (first) lagged changes in the net number of Moody’s credit ratings changes, and both the return and volume on S&P 500 index stocks. The step indicator saturation variables SIS and impulse indicator saturation variables IIS enhance the model’s robustness, allowing it to adjust for structural breaks and outliers in the data (discussed below).
4. Description of Data
4.1. Dependent Variables: Return Data and Trading Activity
We proceed to estimate bond market performance regressions based on returns calculated from the Bank of America/Merrill Lynch Investment-Grade and High-Yield Corporate Bond Market Indexes daily. The data were retrieved from the St. Louis Federal Reserve’s FRED database.15 For comparison to stocks, we also use returns from the Standard & Poor’s 500 Index.16 The returns are used as dependent variables in the first subset of results. These models provide a basis for comparison to the literature on market efficiency and macroeconomic announcement effects in equity, debt, foreign exchange, and derivatives markets. They also allow us to contrast performance results to that of the trading activity regressions and enable us to characterize the relationship between returns and order flow in the vast and relatively unexplored corporate bond market.
The next set of three regression tables are for trading activity models. The corporate bond transaction data are aggregated from the FINRA transaction and reporting compliance database (TRACE).17 The TRACE system aggregates transaction details of corporate debt and other fixed-income securities. This study focuses only on bonds identified as being “frequently traded” based on their inclusion in the FINRA-Bloomberg corporate bond indices. This set of (relatively) active corporate issues is a representation of the “top bonds” that, according to Ronen and Zhou (2013), help facilitate price discovery.18 We believe this is a useful aggregation of a market that has long been bifurcated into a small group of actively-traded top bonds and a larger set of “nontop” bonds that are largely bought and held until maturity. Biais and Green (2007) investigated back to the early 1900s to find the existence of an “active crowd” of exchange-traded corporate bonds and a “cabinet crowd” of inactive bonds on the NYSE.19 Li and Galvani (2021) show that top bonds attract more informed traders and transmit information more rapidly than the less liquid “nontop” bonds.
Around 1000 bonds were initially downloaded, with 750 investment-grade and 300 high-yield top bonds in the IG and HY indices, respectively. We extracted 441 investment-grade bonds and 38 high-yield bonds from the indices that met our inclusion criteria. Our sample choice was selected to take advantage of FINRA, increasing the number of bonds reporting to the system. Therefore, we chose to begin our sample following the increased mandatory dissemination of trade data. On 1 October 2004, TRACE started phase IIIa implementation and required the reporting of all bonds that did not qualify for delayed dissemination. For investment-grade bonds, however, there were enough bonds reporting to extend the sample by four months. Therefore, we use 1 June 2004 as the beginning date for the investment-grade sample. Bonds were excluded based on the following criteria: debt called or maturing during our sample was eliminated so that trading activity data would not be biased by securities called or maturing during the sample period.20 Likewise, bonds that changed in terms of credit quality between IG and HY categories were also excluded.
Descriptive statistics are presented in Table 1. We see that our IG sample is notably larger than that of HY issues. We note that IG financial bonds trade the most frequently, at 7.4 daily trades per bond, while HY financial bonds traded the least frequently, at only 3.7 daily trades per bond. Our sample aggregated over 1.5 million IG trades, and approximately 101 thousand HY trades over the sample period. There were approximately 3000 daily IG trades from the IG sample and 239 daily trades in the less liquid and smaller HY sample.
4.2. Independent Variables: Economic Survey, Ratings, and Seasonal Data
We run two sets of estimation, performance regressions and trading activity regressions. In the former case, we are particularly interested in market efficiency. We expect to see evidence that the markets react rapidly to new information that deviates from their expectations. Therefore, we expect no significant lags on macroeconomic announcement variables. Likewise, we would also expect the equity market to be more efficient than the corporate bond market—particularly the HY sector of the bond market.
In our second and third sets of regressions, we focus on daily trading activity. We break down results for IG and HY, both overall and in terms of institutional trades. To better relate our results to the broader market microstructure literature, we also investigate inter-dealer (hereafter IDI) trading activity, both overall and institutional.
Macroeconomic survey data were acquired from Action Economics (hereafter AE), a San Francisco company specializing in capital market research and macroeconomic forecasting. AE conducts weekly surveys of financial market participants for the following week’s scheduled data announcements. We examine labor market data based on weekly initial jobless claims and monthly nonfarm payrolls reports. Also, inflation is modeled in the form of changes in both core Consumer Price Index (CPI) and core Producer Price Index (PPI) growth rates.21
Given that returns and trading activity may respond differently, we chose to allow for either the typical standardized surprise and/or the absolute standardized surprise to be discovered across our four macroeconomic indicators. Our prior expectation is that macro-surprises will impact corporate bond returns, as they have been shown in US Treasury and futures markets. However, we expect that the magnitude of the standardized surprise will be significant for trading activity, as investors would react to the level of disagreement with the result and expectation.
As is standard in prior studies, we follow the convention of standardizing the surprise component (reported value minus expected value) by dividing by the sample standard deviation of the surprise. Parameter estimates on an economic variable are interpreted as the expected change in the dependent variable associated with a one-standard-deviation surprise in the macroeconomic variable.
Seasonal variables—such as December and January “tax” effects—are modeled with dummy variables, as are seasonal pricing “loans on sale” effects of Murfin and Petersen and holiday effects. Leads and lag dummy variables are included to account for pre- and post-holiday effects. Bond age or “seasoning” effects are modeled based on a linear time trend. Behavioral seasonal factors are modeled based on the incidence and onset/recovery variables provided by Kamstra. Indicator saturation variables pick up unmodeled effects such outliers and level shifts.
We include independent variables that are likely to be of importance to market participants. This helps to avoid omitted variable bias. For example, we control for changes in credit quality by aggregating historical US corporate bond ratings changes. The Moody’s Default Risk Service Senior Ratings Table (SRT) data were acquired for this purpose.
The Moody’s Senior Ratings Algorithm (SRA) is used to produce the SRT. The data are divided into two series, one that aggregates the number of “notches up” and a second of “notches down” for Moody’s rated debt issues. A notch represents a change in rating—e.g., from A1 up to Aa3 or A3 down to Baa1—within the hierarchy of Moody’s debt ratings. We combine the two series into a net change variable. Once more, to facilitate meaningful interpretations of parameter estimates, this series is standardized by dividing by the sample standard deviation. The SRT’s data are recorded as estimated equivalent unsecured senior debt ratings and associated historical up/down rating notch changes. Moody’s discloses that the SRT consists of SRA-based estimates of ratings and may not precisely reflect the published Moody’s ratings (which are further refined by Moody’s ratings analysts). The SRT is still useful as a control variable to capture changes in issuer creditworthiness.
5. Empirical Results
5.1. Performance Regressions
Estimation results of Equation (1) are provided in Table 2, where we provide estimated coefficients and regression mis-specification diagnostics for three dependent variables: S&P 500 returns and returns of the Bank of America/Merrill Lynch IG and HY indices, respectively. All proposed variables were included in the GUM prior to model reduction, with surviving variables listed with coefficient estimates.
Importantly, SAD effects are not retained in the performance model reductions, indicating that no statistically significant effects were revealed in the model discovery process. The performance regressions stand in contrast to the findings by (Kamstra et al. 2003; Garrett et al. 2005; Kamstra et al. 2012, 2014; Levi et al. 2015; Kamstra and Kramer 2023) in US Treasury and international stock markets.
We also note that the first-order autoregressive terms are excluded in all three terminal models—i.e., the returns for all three classes of securities fail to exhibit temporal independence conditionally. This is a standard test of weak form market efficiency and provides evidence of the relative informational efficiency within these three corporate securities markets, as reflected in Fama (1991). Additionally, the lagged terms on macroeconomic surprises, macroeconomic announcement day dummy variables, and absolute macroeconomic surprises are all eliminated in the model reductions in each of these markets—consistent with the semi-strong form of the efficient market hypothesis (EMH).
For the S&P 500 index, even the contemporaneous announcements are reduced out by Autometrics, suggesting that any significant announcement effect dies out intraday and is not meaningful at a daily data frequency. This result underscores the finding of semi-strong form market efficiency in the market for blue chip US equities at the index level. However, we should be careful not to discount the apparent efficiency of the corporate debt markets. While there are significant announcement effects on bond returns in the daily data, the effects do not appear to persist beyond one day. This suggests that semi-strong-form efficient, corporate bonds are less efficient in incorporating new information when compared to large-cap equites.
The literature has confirmed the presence of macroeconomic surprise effects in bond markets—which affect risk premia such as the inflation risk premium in the Treasury market. Yet, corporate issues are also subject to default and liquidity risks, which may complicate things as far as the impact of announcements of labor market surprises such as in nonfarm payrolls and initial jobless claims. An unexpected shock to payrolls or claims might alter inflation and default risk premia asymmetrically, potentially with the opposite sign. Which effect dominates might change over time, depending on whether market participants weigh inflation risk more than default risk.
For this reason, we carefully consider the state of the economy during this period. Over our sample period, real GDP grew at over a 3% year-over-year rate each quarter with a maximum growth rate at just under 4.5%. Core Consumer Price Index inflation grew from a year-over-year rate of 1.7% to just under 2.7%. Thus, one might describe it as a classic “Goldilocks” period where both price and output growth were neither too hot nor too cold. Given this, we do not believe traders weighed one risk more than the other during this period.
Indeed, regression results show that both inflation and labor market activity influenced both credit quality sectors. Shocks in payrolls and consumer prices had significant effects in the speculative grade sector, while initial claims and core PPI were significant in the IG sector.
Positive standardized surprises to core producer prices decreased IG bond returns—which may have more to do with revenue concerns and was likely to be felt most in the manufacturing and machinery segments, where rising costs would pose a threat to profit margins. The coefficient on initial claims in the IG regression is positive, suggesting that returns increased (decreased) when claims were higher (lower) than expected. This may be a result of projected labor costs as opposed to forecasts of GDP growth concerns. While the parameter estimates may not have the same sign as we would expect for Treasury securities, it makes it clear that interpreting coefficients on macro-surprises in corporate bond return regressions is less clear-cut than in the Treasury market, where default risk is considered minimal.
However, the fact that the announcement day and pre-announcement day dummy variables are reduced from the models in the Autometrics reductions suggests that “set-up” effects were not present. This is contrary to findings in the Treasury market in van Dijk et al. (2016) ahead of Federal Open Market Committee meetings, nor did the mere existence of an announcement yield a significant dummy variable coefficient.22 Rather, it appears that the information content of the announcement and the magnitude of the deviation from expectations are of interest to traders, as shown in the majority of studies of macro-announcement effects.
IG bonds also demonstrate a sensitivity to changes in credit quality, as the parameter estimate on the Moody’s ratings changes is both positive and significant. This finding is consistent with our prior expectation that net upgrades on a given day are a positive for returns in the IG sector.
In the speculative grade bond sample, core consumer price shocks have a negative coefficient indicating positive surprises in core CPI decreased returns of HY issues. This may be a function of either the inflation risk premium or a lack of pricing power that would allow issuers to maintain profit margins by raising prices of goods and/or services. Nonfarm payrolls, known to be a critical data release for fixed-income traders, also have a negative parameter estimate. This is consistent with the behavior we see in the Treasury market, where lower-than-expected payroll growth is an indication that inflation pressures remain subdued, and the likelihood of Fed Funds rate increases is reduced.
Also notable are the significant coefficients on S&P 500 volume and the one-period lagged S&P 500 return. The return effect is consistent with the finding of Tolikas (2018) that equity returns lead corporate debt returns and may be a function of the increased search time associated with finding counterparties and negotiation transactions in the over-the-counter corporate market. As expected, the results confirm the existence of cross-market effects between the debt and equity markets.
Seasonal variations also play a role in assessing market efficiency. With the assumption of market efficiency, our expectation for equities is that both behavioral seasonal factors will be eliminated during the model reduction process. These priors are clearly met, as no behavioral seasonal factors survive the reduction process. This result carries over to both the IG and HY markets and is a sign that these markets, despite the increased trade transparency, are still weak-form efficient and that neither price history nor seasonality can be used to predict returns. While consistent with the efficient market hypothesis, the returns regressions are inconsistent with the SAD literature and the body of work summarized in Kamstra and Kramer (2023).
But while the vast literature on market efficiency produces strong priors with respect to the performance regressions, it offers relatively little guidance with respect to order flow. The following section extends our analysis with insights that illuminate the relationship between returns and order flow.
5.2. Trading Activity Results—Total and Large-Volume Trades
In this section, we provide Gets regression results for both total and institutional trading activity, which can be compared to the performance regressions. In Table 3, the dependent variables are total and institutional trades for top bonds in both the IG and HY categories. Large-volume trades are trade volumes over USD 5 million for IG and USD 1 million for HY.
Ronen and Zhou (2013) interpret the large-volume transactions as institutional trades. Mutual funds, hedge funds, and other financial intermediaries occupy this space in the market. Although no database field indicates whether large trades are institutional or retail, such an interpretation is very logical and consistent with the literature. Thus, we consider these trades to be generated by institutional traders.
The results for trading activity are in stark comparison to the return regressions, where all seasonals were removed in Gets model discovery. Here, the existence of day-of-week effects is apparent, as pronounced drops in activity were found on Monday and Friday in all four of the regressions. This is interesting but not unexpected as Nippani and Pennathur (2004) found a day-of-week effect in commercial paper returns.23
The well-established January effect, which trace back to the tax-loss trading rule of Branch (1977), reveals itself only in the HY institutional regression as we see a significant and positive coefficient on the January dummy variable. However, it does not appear in the other three regressions. However, December trading is consistently lower across both measures of trading activity (total and institutional) and for both IG and HY bonds.
While the significance of traditional seasonals offers a clear departure from the results of the performance regressions, they are far from surprising. The seasonal factors that are most interesting and provide the most important insights relative to recent academic literature are the significance of what we call “behavioral seasonals” that have recently been of growing interest to financial market researchers.
In the table, we see that both the SAD onset and incidence variables survive the Autometrics model reduction in total trades regressions. With respect to the IG total trades, a highly statistically significant decline in the number of trades is associated with the onset variable. On the HY side, however, the incidence variable survives the model reduction. In contrast to our performance regressions, these results support prior academic research on SAD effects that showed evidence of “winter blues” in financial markets.
Another notable seasonal factor in the literature is the Murfin and Petersen (2016) “loans on sale” effect—where seasonal credit conditions are more favorable during the months of May, June, and again in October. We find that IG total trades increase by a large magnitude during these periods and that both IG and HY institutional trading activity are significantly higher during these three months. This finding is consistent with the hypothesis that more favorable credit conditions attract market activity.
With respect to macroeconomic announcements, the results offer an example of the power of the Gets modeling methodology and the Autometrics algorithm, i.e., the ability of the methodology to discern an optimal specification when competing independent variable definitions are included in the GUM. We notice that unlike in the return regressions, where it was the standard surprise in macro-announcements that survives the reductions, the absolute standardized surprise is what matters for trading activity. The degree by which the economic announcements differ from the expectations of economists and traders is what is important when modeling order flow, not the direction of deviation.
The Gets methodology is built to manage such competing variable definition situations and this is an excellent example of how it can be used to address such problems without experiencing the drawbacks of alternative model reduction methodologies.24
5.3. Analysis of Trading Activity—Inter-Dealer Trades
Zitzewitz (2011) identified the presence of “paired bond trades” in the data set that arise as a function of inter-dealer intermediation (hereafter IDI) needed to facilitate transactions between counterparties. The author finds that almost 40 percent of dealer–client trades in TRACE are accompanied by an IDI transaction for the exact amount and often at nearly the exact same second.25
Based on this approach, we filtered out these IDI transactions and created data series to examine an additional subset of regressions. The filtering out of duplicated transactions allows us to quantify trading in client demand terms. These intermediated transactions represent a proxy for the degree of intermediation necessary to facilitate the ultimate demand of market participants.
In Table 4, we find that SAD effects depress inter-dealer trading activity in both IG and HY sectors, again with the onset/recovery variable depressing trading when days are shortened and increasing activity during recovery. Likewise, it is the SAD incidence variable that impacts HY trading, suggesting that as more people are affected, fewer trades for top HY bonds are facilitated by IDI transactions.
Overall, we find a significant spillover effect on dealers from retail investors affected by SAD. For macroeconomic announcement effects, we see the first evidence of order flow being affected by surprises in core PPI. Absolute surprises appear to affect trading with a one-day lag for IG IDI total trades, increasing the number of trades in the session following a surprise. Institutional HY IDI trades, however, are reduced on the day of a surprise.
6. Discussion and Conclusions
We explore what variables—behavioral SAD cycle, macroeconomic announcement surprises, credit quality, and others—drive US corporate bond market trading activity. Previous studies have documented a significant response of financial market returns to macroeconomic announcement surprises—i.e., stock, US Treasury, and futures markets. Likewise, studies have documented non-deterministic behavioral seasonality in equity and bond markets. We add to the literature by showing how daily measures of trading activity are affected by SAD, as well as surprises in macro-data and other factors suggested in the academic literature.
Our study’s findings, particularly the significant impact of Seasonal Affective Disorder (SAD) on (retail) trading volumes without a corresponding effect on bond returns, align with and extend the literature on SAD’s market influences. Kamstra et al. have extensively documented the SAD effect in financial markets, revealing how seasonal mood variations can affect investor behavior and market outcomes. For instance, Kamstra et al. (2012) refute criticisms of the SAD effect, emphasizing the robustness of the phenomenon across international markets and employing advanced statistical methodologies to affirm its presence. Moreover, Kamstra and Kramer (2023) provide a comprehensive overview of SAD’s impact not just on equity returns but also on government bond returns and mutual fund flows, highlighting the breadth of SAD’s influence across different market segments.
Our observation that SAD influences trading activity, particularly among retail investors, without directly affecting bond returns suggests a market microstructure mechanism at play, potentially involving intermediation costs or commissions absorbed in the corporate bond market. This insight adds a new dimension to understanding SAD’s impact, suggesting that while SAD-induced behavioral changes may not alter market returns directly, they manifest in increased trading volumes and, by implication, potentially higher transaction costs. This divergence underscores the importance of considering both direct and indirect effects of behavioral biases on market dynamics, offering a richer narrative for the role of psychological factors in financial markets.
Future research could delve deeper into the mechanisms through which SAD’s effects are mediated in the market, particularly exploring the role of intermediation costs and the differential impact on retail versus institutional trading behaviors. Such research could potentially take advantage of the more recent TRACE-Enhanced Database, to better differentiate between retail seller- and buyer-initiated trades, and the associated transaction costs (compared to institutional costs) over the SAD cycle to verify the possible substitution effects across credit quality and the extent to which intermediates profit from it. By building on the foundational work of Kamstra and others, further studies can illuminate the complex interplay between psychological factors, market structure, and financial outcomes.
Macroeconomic factors capturing core inflation and the strength of the labor market affect both corporate bond returns and trading activity. For example, we find a large drop in trading of investment-grade bonds on days following large absolute surprises in nonfarm payrolls and a modest increase in HY institutional trading on absolute surprises in core CPI. We also find an increase in institutional trading of HY bonds when there are surprises in PPI. Inter-dealer trading activity is also affected by core PPI shocks both contemporaneously (for IG total trades) and the following day (for HY institutional trades).
Seasoning effects were found for IG total trades, suggesting that the top IG bonds in our sample were declining in daily trading activity by more than a trade per day. This is consistent with the literature and our priors. Credit quality was also found to be important, complementing the findings of Wang and Wu (2015).26 Institutional IG bonds increase (decrease) following ratings upgrades (downgrades)—consistent with improved credit quality increasing the attractiveness of fixed-income securities.
The degree of IG and HY inter-dealer trade intermediation to facilitate client demand is consistently affected by the volume of equity trading in S&P 500 stocks for both institutional and overall trading. The “loans on sale” seasonal proposed by Murfin and Petersen (2016) is also present and appears to have a significant share in determining overall institutional IG trading, with a partial R-squared of 31 percent.
We also contribute to the econometric modeling literature from the Gets modeling perspective. First, the general finding is that we can effectively disentangle competing seasonal effects using Autometrics for model discovery. Even with a limited sample of top bonds, particularly so for HY, we were largely able to produce models consistent with all the Gauss–Markov assumptions (and additional specification tests—nonlinearity, encompassing, parameter stability) and pass this battery of tests at five-percent significance. The saturation variables selected suggest a greater propensity for outliers and level shifts in bonds, relative to stocks. This is consistent with the corporate bond being less efficient than the stock market.
Overall, we are encouraged by the performance of ML in corporate bond empirical analysis, as Autometrics results have captured a wide array of expected results in addition to facilitating our underlying focus on SAD and announcement effects. Given a void in ML-based corporate bond research, our results add to the recent random forests application of Fedenia et al. (2021) to ML corporate bond trading studies.
An important limitation of our findings is the short sample period. Due to the short life span of corporate bonds, particularly in the HY sector, it is difficult to aggregate a sample of bonds that exist over a long time periods without either maturing or being called. If researchers extend the sample size by including more bonds, they risk distorting their results by merging the relatively active top bonds with the highly illiquid ‘nontop’ bonds—which have been shown to behave asymmetrically.27 For this reason, we suggest further validation on newer samples of IG and HY corporate bonds, as well as additional cross-market validation studies of municipal and mortgage-backed securities.
Author Contributions
Conceptualization, J.J.F.; Methodology, J.J.F. and B.T.B.; Software, J.J.F. and B.T.B.; Validation, J.J.F., B.S.B. and B.T.B.; Formal analysis, J.J.F. and B.S.B.; Investigation, J.J.F., B.S.B. and B.T.B.; Resources, J.J.F. and B.S.B.; Data curation, J.J.F. and B.T.B.; Writing—original draft, J.J.F.; Writing—review & editing, J.J.F. and B.S.B.; Visualization, J.J.F.; Supervision, J.J.F. and B.S.B.; Project administration, J.J.F. and B.S.B.; Funding acquisition, J.J.F. All authors have read and agreed to the published version of the manuscript.
Funding
This research received no external funding.
Data Availability Statement
Economic announcement data were acquired from Action Economics, TRACE corporate bond trading database is available via subscription on WRDS and from FINRA, corporate default data were acquired from Moody’s. Standard & Poor’s 500 returns and corporate bond index returns were downloaded from the St. Louis Federal Reserve Banks FRED database.
Acknowledgments
We would like to thank Mahnaz Mahdavi of Smith College, and Hossein Kazemi, Nelson Lacey, and Sanjay Nawalkha from the University of Massachusetts-Amherst, for helpful suggestions and edits. Likewise, we would like to thank Kristin Backhaus, Orkunt Dalgic, Yuan Wen, and Zhuqi Miao of SUNY New Paltz; We would also like to thank conference participants from the IFABS 2017 Oxford Conference, Eastern Finance Association Annual Meetings, Midwest Finance Association Meetings, and Academy of Economics and Finance Meetings. Any remaining errors are the sole responsibility of the authors. This research was supported by the Center for International Securities and Derivatives Markets (CISDM) at the University Massachusetts—Amherst, SUNY New Paltz, and by the School of Business at the University of Connecticut. We thank Lana Doronkina for research assistance, proofreading, and manuscript preparation. This study was a chapter of the first author’s PhD dissertation.
Conflicts of Interest
The authors declare no conflicts of interest.
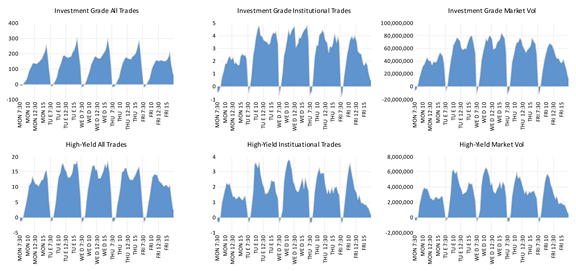
Appendix A. Day-of-Week and Time-of-Day Effects
The graphs depict day-of-week and time-of-day effects in corporate bond trading based on intraday regressions on half-hour-of-day dummy variables. Both effects are suggested by visual inspection. The time-of-day trading/volume pattern for IG bonds appear shaped like a “double-humped” Bactrian camel.
![Risks 12 00080 i001]()
Appendix B. Unit Root Tests
| Grade | Unit Root Tests | ADF T-Stat | ADF Prob. |
| Investment Grade | Total Trades | −3.8509 | 0.0026 |
| Institutional Trades | −4.3574 | 0.0004 | |
| Intermediated Trades | −3.7879 | 0.0032 | |
| Intermediated Institutional Trades | −5.0374 | 0.0000 | |
| AAA | AAA Total Trades | −5.3356 | 0.0000 |
| AAA Institutional Trades | −19.7355 | 0.0000 | |
| AAA Financial Trades | −5.4464 | 0.0000 | |
| AAA Institutional Nonfinancial Trades | −20.8957 | 0.0000 | |
| High-Yield | Total Trades | −4.6561 | 0.0001 |
| Institutional Trades | −4.6287 | 0.0001 | |
| Intermediated Trades | −15.9030 | 0.0000 | |
| Intermediated Institutional Trades | −5.1554 | 0.0000 | |
| Note: This table contains results of augmented Dickey–Fuller unit root tests on the dependent variables in this study. Full sample period is used in all tests. | |||
Appendix C. Predictor Description for General Unrestricted Model
Note: This table indicates the lag structure of predictor variables in the General Unrestricted Model (GUM) prior to the model reduction.
| Predictor | Lag Structure | Description |
| Macro-Announcement Surprises | Contemporaneous, Lag 1 | Standardized Surprises and Absolute Standardized Surprises for Nonfarm Payrolls, Initial Jobless Claims, Core CPI, Core PPI |
| Macroeconomic Announcement Day | Contemporaneous, Lead 1, Lag 1 | Dummy Variables for Surprises for Nonfarm Payrolls, Initial Jobless Claims, Core CPI, Core PPI |
| Credit Quality | Contemporaneous | Moody’s Ratings (Aggregate Net Credit Notches Up/Down) |
| Financial Market Returns | Contemporaneous, Lag 1 | S&P 500 Returns |
| Seasonal—Month of Year | Contemporaneous | December, January(January Effect) |
| Seasonal—Behavioral/Mood | Contemporaneous | Incidence and Onset of Seasonal Affective Disorder |
| Seasonal—Trend | Contemporaneous | Linear Time Trend |
| Seasonal—Pricing | Contemporaneous | Dummy Variable for Expensive and Cheap Loan Periods |
| Seasonal—Holiday | Contemporaneous, Lead 1, Lag 1 | Dummy Variable |
| Leads/Lags of Variables | Lead 1, Lag 1 | Anticipatory Behavior (Lead 1) are “Set-Up Effects”, Delayed Effects (Lag 1) |
Appendix D. AAA and AAA-Financial Trading Activity

Table A1.
AAA-rated trading activity. This table presents results for AAA-rated trading activity regressions for both IG and HY bond transactions. The dependent variables in each category are total trades and institutional trades, respectively. Regressions are performed using the Autometricstm in the PcGivetm package of OxMetricstm. Impulse- and step-indicator saturation methods are used. In all regressions except AAA institutional trades, the full battery of specification tests is passed at the 5% significance level.
| Investment Grade | Financial | |||
|---|---|---|---|---|
| Independent Variable | AAA Total Trades Coefficient | AAA Institutional Trades Coefficient | AAA Financial Total Trades Coefficient | AAA Financial Institutional Trades Coefficient |
| Trend | −0.54 **+ | |||
| S&P 500 Volume | 1.50 **+ | 21.77 **+ | 2.31 **+ | |
| S&P 500 Volume (−1) | −20.14 **+ | −1.53 **+ | ||
| Nonfarm Payrolls SS | 15.54 **+ | |||
| ABS Consumer Price Index SS | −2.11 **+ | −1.72 **+ | ||
| ABS Nonfarm Payrolls SS (+1) | −20.05 **+ | −15.77 **+ | ||
| Murfin Petersen Cheap | 332.71 **+ | 560.72 **+ | ||
| Monday | −13.04 **+ | −11.85 **+ | ||
| Tuesday | 14.75 **+ | 1.18 **+ | ||
| Wednesday | 1.70 **+ | 1.33 **+ | ||
| Friday | −42.71 **+ | −34.13 **+ | ||
| December | −25.36 ** | −1.90 **+ | ||
| NYSE Holiday | −255.93 **+ | −227.14 **+ | ||
| NYSE Holiday (+1) | −39.15 **+ | −39.56 **+ | ||
| NYSE Early Close | −182.78 **+ | −118.01 **+ | ||
| SAD Incidence | 2.17 **+ | |||
| SAD Onset | −71.86 **+ | |||
| Impulse Indicators | 19 | 6 | 20 | 10 |
| Step Indicators | 36 | 22 | 31 | 22 |
| AR 1-2 test | 0.93 [0.3933] | 0.25 [0.7809] | 0.66 [0.5161] | 0.84 [0.4317] |
| ARCH 1-1 test | 0.14 [0.7131] | 0.08 [0.7825] | 1.06 [0.3047] | 0.00 [0.9948] |
| Normality test | 3.61 [0.1643] | 39.97 [0.0000] ** | 0.10 [0.9496] | 9.10 [0.0106] * |
| Hetero test | 0.69 [0.9303] | 0.92 [0.5688] | 0.96 [0.5515] | 1.71 [0.0102] * |
| RESET23 test | 1.09 [0.3360] | 0.90 [0.4056] | 4.51 [0.0115] * | 0.93 [0.3937] |
Note: * significant at %, ** significant at 1%. **+ significant at 1% and unanimous selection in terminal models. SS represents standardized surprise for that macroeconomic variable. Moody’s represents the net change in ratings in terms of notches. (−1) indicates a one-period lag and (+1) indicates a one-period lead. Sample: 1 June 2004 to 31 July 2006.
| 1 | The Gets approach is also known as the “LSE Econometric Approach”, based on its origin at the London School of Economics during the 1970s under econometricians Denis Sargan and Sir David F. Hendry. |
| 2 | See also: with respect to volatility, Jones et al. (1998) and, with respect to US Treasury Auctions, Smales (2021), Amin and Tédongap (2023), and Forest and Mackey (2023). |
| 3 | See also: Holden et al. (2018) examine OTC corp bonds from a price discovery perspective. Also, Pasquariello and Sandulescu (2023) relate liquidity to speculation. |
| 4 | We found holiday effects on stock prices as far back in the literature as Fields (1934). Ariel (1990) studies higher stock returns ahead of holidays. Cadsby and Ratner (1992) extend this line of research internationally. Further extensions are found in Kim and Park (1994) and Meneu and Pardo (2004). |
| 5 | The rule involves selling previously purchased securities (that have since lost value) prior to the end of the calendar year to capture tax benefits and reacquiring them at the start of the subsequent year. |
| 6 | |
| 7 | See also: Hendry et al. (1984), Hendry (1988), Doornik and Hendry (2015), and Hendry and Mizon (2016). In particular, Hendry (2024) presents an review of the Gets methodology with recent advancements. |
| 8 | While the approach of Pesaran and Shin (1998), Pesaran et al. (2001), and Nica et al. (2023) bears similarity to the Gets approach, particularly with its emphasis on lag reduction and specification testing, Hendry’s automated Gets approach is preferable in terms of its ability to achieve parsimony in a financial context, where the long-run properties are of less interest, given the assumption of market efficiency. |
| 9 | Automated model selection procedures have also been examined by White (1990), Hoover and Perez (1999), Hendry and Krolzig (1999), Phillips (2005), McAleer (2005), Perez-Amaral et al. (2005), Groen and Kapetanios (2013), Bredahl Kock and Teräsvirta (2015), and Guerard et al. (2020). |
| 10 | Normality test is that of Doornik and Hansen (2008). |
| 11 | An open-source alternative to Autometrics can be found in R package, gets, in Pretis et al. (2018). The package can be customized to emulate the commercial implementation in OxMetrics via PcGive. |
| 12 | Forest (2018b) demonstrates the effectiveness of Gets in eliminating omitted variable bias in the Treasury market. See also: Pellini (2021), Khan et al. (2021), Muhammadullah et al. (2022), and Bonnier (2022). |
| 13 | We note the use of competing announcement measures. Consistent with the literature, our priors are that directional sensitivity to macroeconomic announcement surprises was seen in the retention of standardized surprise variables in performance regressions, while trading activity responsiveness would be found by retention of the absolute surprises. This is consistent with Brenner et al. (2009), who use an absolute measure in the return equation of their DCC model, while absolute announcement shocks are employed in the variance equation. Absolute surprises are commonly used as predictors that are inherently non-negative such as volatility. |
| 14 | The ability of Gets to handle competing variable definitions is described in Granger and Hendry (2005) (see question 5) and in Hendry and Doornik (2014). See also: Granger (2009). |
| 15 | Corporate bond market returns were calculated from the Bank of America Merrill Lynch US Corporate Master Total Return Index and the US High Yield Master II Total Return Index. Both series are downloadable from the Federal Reserve Bank of St. Louis FRED Database series, bamlcc0a0cmtriv and bamlhyh0a0hym2triv, respectively. |
| 16 | The data were retrieved from Yahoo! Finance. |
| 17 | Details can be found at http://www.finra.org/industry/trace (accessed on 27 January 2024). |
| 18 | Ronen and Zhou (2013) defined a top bond as an issue that attracts mostly institutional trades following the release of firm-specific information. These bonds help to facilitate the price discovery process. |
| 19 | |
| 20 | This allows us to evaluate the hypothesis that debt trades frequently as they age—this phenomenon is known as the “seasoning” effect. |
| 21 | “Core rates” exclude food and energy prices which tend to be volatile and can deviate from underlying price pressures. Market participants rely on the core rates to provide a better representation of the underlying pressures. |
| 22 | Heuson and Su (2003), exploring option-implied volatility behavior for US Treasuries, observed increased implied volatility the day prior to announcements that were later followed by a normalization. |
| 23 | Time-of-day effects are also visually discernable in Appendix A. |
| 24 | These include path dependency and repeated selection, among others. For more elaboration, see Hendry and Doornik (2014). |
| 25 | As we also found that the TRACE data exhibit an abundance of these “paired bond trades”, we employed the same 60-second filtering to the raw data to eliminate distortions arising from IDI trades. |
| 26 | The authors establish a link between trading activity, liquidity, and credit risk. See also: Ismailescu and Kazemi (2010). |
| 27 | Li and Galvani (2021), for instance, show differences in behavior on same-issuer bonds and show that informed trading applies asymmetrically between top and nontop bonds. In other words, just because a company has actively traded top bonds does not mean that we expect all their bonds to behave consistently. |
References
- Ai, Hengjie, and Ravi Bansal. 2018. Risk Preferences and the Macroeconomic Announcement Premium. Econometrica 86: 1383–430. [Google Scholar] [CrossRef]
- Amin, Shehryar, and Roméo Tédongap. 2023. The changing landscape of treasury auctions. Journal of Banking & Finance 148: 106714. [Google Scholar] [CrossRef]
- Ariel, R. A. 1990. High Stock Returns Before Holidays: Existence and Evidence on Possible Causes. Journal of Finance 45: 1611–26. [Google Scholar] [CrossRef]
- Bekaert, Geert, and Arnaud Mehl. 2019. On the global financial market integration “swoosh” and the trilemma. Journal of International Money and Finance 94: 227–45. [Google Scholar] [CrossRef]
- Bekaert, Geert, and Marie Hoerova. 2014. The VIX, the variance premium and stock market volatility. Journal of Econometrics 183: 181–92. [Google Scholar] [CrossRef]
- Bekaert, Geert, Robert J. Hodrick, and Xiaoyan Zhang. 2012. Aggregate Idiosyncratic Volatility. Journal of Financial and Quantitative Analysis 47: 1155–85. [Google Scholar] [CrossRef]
- Bhardwaj, Ravinder K., and Leroy D. Brooks. 1992. The January Anomaly: Effects of Low Share Price, Transaction Costs, and Bid-Ask Bias. The Journal of Finance 47: 553–75. [Google Scholar] [CrossRef]
- Biais, Bruno, and Richard C. Green. 2007. The Microstructure of the Bond Market in the 20th Century. Review of Economic Dynamics 33: 250–71. [Google Scholar] [CrossRef]
- Bonnier, Jean-Baptiste. 2022. Forecasting crude oil volatility with exogenous predictors: As good as it GETS? Energy Economics 111: 106059. [Google Scholar] [CrossRef]
- Branch, Ben. 1977. A Tax Loss Trading Rule. The Journal of Business 50: 198–207. [Google Scholar]
- Bredahl Kock, Anders, and Timo Teräsvirta. 2015. Forecasting Macroeconomic Variables Using Neural Network Models and Three Automated Model Selection Techniques. Econometric Reviews 35: 1753–79. [Google Scholar] [CrossRef]
- Brenner, Menachem, Paolo Pasquariello, and Marti Subrahmanyam. 2009. On the Volatility and Comovement of US Financial Markets around Macroeconomic News Announcements. Journal of Financial and Quantitative Analysis 44: 1265–89. [Google Scholar] [CrossRef]
- Cadsby, Charles Bram, and Mitchell Ratner. 1992. Turn-of-Month and Pre-Holiday Effects on Stock Returns: Some International Evidence. Journal of Banking & Finance 16: 497–509. [Google Scholar] [CrossRef]
- Cai, Fang, Song Han, Dan Li, and Yi Li. 2019. Institutional herding and its price impact: Evidence from the corporate bond market. Journal of Financial Economics 131: 139–67. [Google Scholar] [CrossRef]
- Castle, Jennifer L., and David F. Hendry. 2014. Model selection in under-specified equations facing breaks. Journal of Econometrics 178: 286. [Google Scholar] [CrossRef]
- Castle, Jennifer L., David F. Hendry, and Andrew B. Martinez. 2017. Evaluating Forecasts, Narratives and Policy Using a Test of Invariance. Econometrics 5: 39. [Google Scholar] [CrossRef]
- Chatrath, Arjun, Hong Miao, Sanjay Ramchander, and Sriram Villupuram. 2012. Corporate Bonds, Macroeconomic News, and Investor Flows. Journal of Fixed Income 22: 25–40. [Google Scholar] [CrossRef]
- Dewachter, Hans, Leonardo Iania, Wolfgang Lemke, and Marco Lyrio. 2019. A macro–financial analysis of the corporate bond market. Empirical Economics 57: 1911–33. [Google Scholar] [CrossRef]
- Dhrymes, Phoebus J. 1971. Distributed Lags: Problems of Estimation and Formulation. San Francisco: Holden-Day. [Google Scholar]
- Dolvin, Steven D., Mark K. Pyles, and Qun Wu. 2009. Analysts Get SAD Too: The Effect of Seasonal Affective Disorder on Stock Analysts’ Earnings Estimates. Journal of Behavioral Finance 10: 214–25. [Google Scholar] [CrossRef]
- Doornik, Jurgen A. 2009. Autometrics. Oxford: Oxford University Press. [Google Scholar] [CrossRef]
- Doornik, Jurgen A., and David F. Hendry. 2015. Statistical model selection with “Big Data”. Cogent Economics & Finance 3: 1045216. [Google Scholar] [CrossRef]
- Doornik, Jurgen A., and Henrik Hansen. 2008. An Omnibus Test for Univariate and Multivariate Normality. Oxford Bulletin of Economics and Statistics 70: 927–39. [Google Scholar] [CrossRef]
- Doornik, Jurgen A., David F. Hendry, and Felix Pretis. 2015. Detecting Location Shifts during Model Selection by Step-Indicator Saturation. Econometrics 3: 240–64. [Google Scholar] [CrossRef]
- Elton, Edwin, Martin J. Gruber, Deepak Agrawal, and Christopher Mann. 2001. Explaining the Rate Spread on Corporate Bonds. Journal of Finance LVI: 247–77. [Google Scholar] [CrossRef]
- Ericsson, Neil R. 2016. Eliciting GDP forecasts from the FOMC’s minutes around the financial crisis. International Journal of Forecasting 32: 571–83. [Google Scholar] [CrossRef]
- Fama, Eugene F. 1991. Efficient Capital Markets II. The Journal of Finance 46: 1575–617. [Google Scholar] [CrossRef]
- Fedenia, Mark, Tavy Ronen, and Seunghan Namc. 2021. Machine Learning in the Corporate Bond Market and Beyond: A New Classifier. Available online: https://ssrn.com/abstract=3848068 (accessed on 27 January 2024). [CrossRef]
- Fields, M. J. 1934. Security Prices and Stock Exchange Holidays in Relation to Short Selling. Journal of Business 7: 328–33. [Google Scholar] [CrossRef]
- Fisher, Adlai, Charles Martineau, Jinfei Sheng, and Stijn Van Nieuwerburgh. 2022. Macroeconomic Attention and Announcement Risk Premia. The Review of Financial Studies 35: 5057–93. [Google Scholar] [CrossRef]
- Fisher, Irving. 1925. Our Unstable Dollar and the So-called Business Cycle. Journal of the American Statistical Association 20: 179–202. [Google Scholar] [CrossRef]
- Fisher, Irving. 1937. Note on a Short-Cut Method for Calculating Distributed Lags. International Statistical Bulletin 29: 323–27. [Google Scholar]
- Forest, James J. 2018a. Essays in Financial Economics: Announcement Effects in Fixed Income Markets. Ph.D. dissertation, Department of Finance, Isenberg School of Management, University of Massachusetts—Amherst, Amherst, MA, USA; p. 164. [Google Scholar] [CrossRef]
- Forest, James J. 2018b. The Effect of Macroeconomic Announcements on Credit Markets: An Autometric General-to-Specific Analysis of the Greenspan Era. Working Paper. Amherst: University of Massachusetts. [Google Scholar] [CrossRef]
- Forest, James J., and Paul Turner. 2013. Alternative estimators of cointegrating parameters in models with nonstationary data: An application to US export demand. Applied Economics 45: 629–36. [Google Scholar] [CrossRef]
- Forest, James J., and Scott P Mackey. 2023. The Effect of Treasury Auctions on Returns: The 1990s Experience. Academy of Economics and Finance Journal 14: 1–10. [Google Scholar] [CrossRef]
- Frühwirth, Manfred, and Leopold Sögner. 2015. Weather and SAD related mood effects on the financial market. Quarterly Review of Economics and Finance 57: 11–31. [Google Scholar] [CrossRef]
- Frydman, Roman, and Joshua R. Stillwagon. 2018. Fundamental factors and extrapolation in stock-market expectations: The central role of structural change. Journal of Economic Behavior & Organization 148: 189–98. [Google Scholar] [CrossRef]
- Frydman, Roman, Nicholas Mangee, and Josh Stillwagon. 2020. How Market Sentiment Drives Forecasts of Stock Returns. Journal of Behavioral Finance 22: 351–67. [Google Scholar] [CrossRef]
- Garrett, Ian, Mark J. Kamstra, and Lisa A. Kramer. 2005. Winter blues and time variation in the price of risk. Journal of Empirical Finance 12: 291–316. [Google Scholar] [CrossRef]
- Granger, Clive W. J. 2009. In Praise of Pragmatics in Econometrics. In The Methodology and Practice of Econometrics: A Fetschrift in Honour of David F. Hendry. Edited by Jennifer L. Castle and Neil Sheppard. Oxford: Oxford University Press. [Google Scholar]
- Granger, Clive W. J., and David F. Hendry. 2005. A Dialogue Concerning a New Instrument for Econometric Modeling. Econometric Theory 21: 278–97. [Google Scholar] [CrossRef]
- Green, T. Clifton. 2004. Economic News and the Impact of Trading on Bond Prices. Journal of Finance 59: 1201–19. [Google Scholar] [CrossRef]
- Groen, Jan J. J., and George Kapetanios. 2013. Model Selection Criteria for Factor-Augmented Regressions. Oxford Bulletin of Economics and Statistics 75: 37–63. [Google Scholar] [CrossRef]
- Guerard, John, Dimitrios Thomakos, and Foteini Kyriazi. 2020. Automatic time series modeling and forecasting: A replication case study of forecasting real GDP, the unemployment rate and the impact of leading economic indicators. Cogent Economics & Finance 8: 1759483. [Google Scholar] [CrossRef]
- Hendry, David F. 1988. Encompassing. National Institute Economic Review 125: 88–103. [Google Scholar] [CrossRef]
- Hendry, David F. 1993. Econometrics: Alchemy of Science? Economica 47: 387–406. [Google Scholar] [CrossRef]
- Hendry, David F. 1995. Dynamic Econometrics. Oxford: Oxford University Press. [Google Scholar] [CrossRef]
- Hendry, David F. 2024. A Brief History of General-to-specific Modelling. Oxford Bulletin of Economics and Statistics 86: 1–20. [Google Scholar] [CrossRef]
- Hendry, David F., Adrian R. Pagan, and J. Denis Sargan. 1984. Dynamic Specification. In Handbook of Econometrics. Edited by Zvi Griliches and Michael D. Intriligator. Amsterdam: North Holland, pp. 1023–100. [Google Scholar] [CrossRef]
- Hendry, David F., and Felix Pretis. 2023. Quantifying the Uncertainty around Break Dates in Step-Indicator Saturation. SSRN Electronic Journal. [Google Scholar] [CrossRef]
- Hendry, David F., and Grayham E. Mizon. 2016. Improving the teaching of econometrics. Cogent Economics & Finance 4: 1170096. [Google Scholar] [CrossRef]
- Hendry, David F., and Hans-Martin Krolzig. 1999. Improving on ‘Data mining reconsidered’ by K.D. Hoover and S.J. Perez. The Econometrics Journal 2: 202–19. [Google Scholar] [CrossRef]
- Hendry, David F., and Jurgen A. Doornik. 2014. Empirical Model Discovery and Theory Evaluation: Automatic Selection Methods in Econometrics. Cambridge: MIT Press. [Google Scholar]
- Heuson, Andrea J., and Tie Su. 2003. Intra–day Behavior of Treasury Sector Index Option Implied Volatilities around Macroeconomic Announcements. Financial Review 38: 161–77. [Google Scholar] [CrossRef]
- Holden, Craig W., Yifei Mao, and Jayoung Nam. 2018. Price Discovery in the Stock, OTC Corporate Bond, and NYSE Corporate Bond Markets. SSRN Electronic Journal. [Google Scholar] [CrossRef]
- Hong, Harrison, and Jialin Yu. 2009. Gone fishin’: Seasonality in trading activity and asset prices. Journal of Financial Markets 12: 672–702. [Google Scholar] [CrossRef]
- Hoover, Kevin D., and Stephen Perez. 1999. Data mining reconsidered: Encompassing and the general-to-specific approach to specification search. Econometrics Journal 2: 167–91. [Google Scholar] [CrossRef]
- Ismailescu, Iuliana, and Hossien B. Kazemi. 2010. The Reaction of Emerging Market Credit Default Swap Spreads to Sovereign Credit Rating Changes. Journal of Banking and Finance 34: 2861–73. [Google Scholar] [CrossRef]
- Jacobsen, Ben, and Wessel Marquering. 2008. Is it the weather? Journal of Banking & Finance 32: 526–40. [Google Scholar] [CrossRef]
- Jiang, Hao, and Zheng Sun. 2015. News and Corporate Bond Liquidity. SSRN Electronic Journal. [Google Scholar] [CrossRef]
- Johansen, Søren, and Bent Nielsen. 2009. An Analysis of the Indicator Saturation Estimator as a Robust Regression Estimator. In The Methodology and Practice of Econometrics: Festschrift in Honour of David F. Hendry. Edited by J. L. Castle and N. Shephard. Oxford: Oxford University Press, pp. 1–36. [Google Scholar] [CrossRef]
- Jones, Charles M., Owen Lamont, and Robin L. Lumsdaine. 1998. Macroeconomic News and Bond Market Volatility. Journal of Financial Economics 47: 315–37. [Google Scholar] [CrossRef]
- Kamstra, Mark J., and Lisa A. Kramer. 2023. Seasonality in stock returns and government bond returns. In Handbook of Financial Decision Making. Edited by G. Hilary and D. McLean. Northampton: Edward Elgar Publishing, pp. 36–62. [Google Scholar]
- Kamstra, Mark J., Lisa A. Kramer, and Maurice D. Levi. 2003. Winter Blues: A SAD Stock Market Cycle. American Economic Review 93: 324–43. [Google Scholar] [CrossRef]
- Kamstra, Mark J., Lisa A. Kramer, and Maurice D. Levi. 2009. Is it the weather? Comment. Journal of Banking & Finance 33: 578–82. [Google Scholar] [CrossRef]
- Kamstra, Mark J., Lisa A. Kramer, and Maurice D. Levi. 2012. A careful re-examination of seasonality in international stock markets: Comment on sentiment and stock returns. Journal of Banking & Finance 36: 934–56. [Google Scholar] [CrossRef]
- Kamstra, Mark J., Lisa A. Kramer, Maurice D. Levi, and Russ Wermers. 2017. Seasonal Asset Allocation: Evidence from Mutual Fund Flows. Journal of Financial and Quantitative Analysis 52: 71–109. [Google Scholar] [CrossRef]
- Kamstra, Mark J., Lisa A. Kramer, Maurice D. Levi, and Tan Wang. 2014. Seasonally Varying Preferences: Theoretical Foundations for an Empirical Regularity. Review of Asset Pricing Studies 4: 39–77. [Google Scholar] [CrossRef]
- Keef, Stephen P., and Mohammed S. Khaled. 2011. A review of the seasonal affective disorder hypothesis. Journal of Socio-Economics 40: 959–67. [Google Scholar] [CrossRef]
- Kelly, Patrick J., and Felix Meschkle. 2010. Sentiment and Stock Returns: The SAD Anomaly Revisited. Journal of Banking & Finance 34: 1308–26. [Google Scholar] [CrossRef]
- Khan, Faridoon, Amena Urooj, Kalim Ullah, Badr Alnssyan, Zahra Almaspoor, and Paulo Jorge Silveira Ferreira. 2021. A Comparison of Autometrics and Penalization Techniques under Various Error Distributions: Evidence from Monte Carlo Simulation. Complexity 2021: 9223763. [Google Scholar] [CrossRef]
- Kim, Chan-Wung, and Jinwoo Park. 1994. Holiday Effects and Stock Returns: Further Evidence. Journal of Financial and Quantitative Analysis 29: 145–57. [Google Scholar] [CrossRef]
- Koyck, L M. 1954. Distributed Lags and Investment Analysis. Amsterdam: North-Holland. [Google Scholar] [CrossRef]
- Levi, Maurice D., Lisa A. Kramer, and Mark J. Kamstra. 2015. Seasonal Variation in Treasury Returns. Critical Finance Review 4: 45–115. [Google Scholar] [CrossRef]
- Li, Lifang, and Valentina Galvani. 2021. Informed Trading and Momentum in the Corporate Bond Market. Review of Finance 25: 1773–816. [Google Scholar] [CrossRef]
- Lin, Mei-Chen. 2015. Seasonal affective disorder and investors’ response to earnings news. International Review of Financial Analysis 42: 211–21. [Google Scholar] [CrossRef]
- Lindvall, John R. 1977. New Issue Corporate Bonds, Seasoned Market Efficiency and Yield Spreads. Journal of Finance 32: 1057–67. [Google Scholar] [CrossRef]
- Maxwell, William F. 1998. The January Effect in the Corporate Bond Market: A Systematic Examination. Financial Management 27: 18–30. [Google Scholar] [CrossRef]
- McAleer, Michael. 2005. Automated Inference and Learning in Modeling Financial Volatility. Econometric Theory 21: 232–61. [Google Scholar] [CrossRef]
- Meeker, J. Edward. 1922. The Work of the Stock Exchange. New York: Ronald Press Company. [Google Scholar]
- Meneu, Vicente, and Angel Pardo. 2004. Pre-Holiday Effect, Large Trades and Small Investor Behavior. Journal of Empirical Finance 11: 231–46. [Google Scholar] [CrossRef]
- Muhammadullah, Sara, Amena Urooj, Faridoon Khan, Mohammed N. Alshahrani, Mohammed Alqawba, Sanaa Al-Marzouki, and Peican Zhu. 2022. Comparison of Weighted Lag Adaptive LASSO with Autometrics for Covariate Selection and Forecasting Using Time-Series Data. Complexity 2022: 2649205. [Google Scholar] [CrossRef]
- Murfin, Justin, and Mitchell Petersen. 2016. Loans on sale: Credit market seasonality, borrower need, and lender rents. Journal of Financial Economics 121: 300–26. [Google Scholar] [CrossRef]
- Nica, Ionut, Irina Georgescu, Camelia Delacea, and Nora Chirita. 2023. Toward Sustainable Development: Assessing the Effects of Financial Contagion on Human Well-Being in Romania. Risks 11: 204. [Google Scholar] [CrossRef]
- Nippani, Srinivas, and Anita K. Pennathur. 2004. Day-of-the-week effects in commercial paper yield rates. The Quarterly Review of Economics and Finance 44: 508–20. [Google Scholar] [CrossRef]
- Pasquariello, Paolo, and Mirela Sandulescu. 2023. Speculation and Liquidity in Stock and Corporate Bond Markets. Ann Arbor: University of Michigan, p. 70. [Google Scholar] [CrossRef]
- Pellini, Elisabetta. 2021. Estimating income and price elasticities of residential electricity demand with Autometrics. Energy Economics 101: 105411. [Google Scholar] [CrossRef]
- Perez-Amaral, Teodosio, Giampiero M. Gallo, and Halbert White. 2005. A Comparison of Complementary Automatic Modeling Selection: RETINA and PcGets. Econometric Theory 21: 262–77. [Google Scholar] [CrossRef]
- Pesaran, M. Hashem, and Yongcheol Shin. 1998. An Autoregressive Distributed Lag Modelling Approach to Cointegration Analysis. In Econometric Society Monographs. Cambridge: Cambridge University Press, pp. 371–413. [Google Scholar]
- Pesaran, M. Hashem, Yongcheol Shin, and Richard J Smith. 2001. Bounds testing approaches to the analysis of level relationships. Journal of Applied Econometrics 16: 289–326. [Google Scholar] [CrossRef]
- Phillips, Peter C. B. 2005. Automated Discovery in Econometrics. Econometric Theory 21: 3–20. [Google Scholar] [CrossRef]
- Pretis, Felix, J. James Reade, and Genaro Sucarrat. 2018. Automated General-to-Specific (GETS) Regression Modeling and Indicator Saturation for Outliers and Structural Breaks. Journal of Statistical Software 86: 1–44. [Google Scholar] [CrossRef]
- Pretis, Felix, Lea Schneider, Jason E. Smerdon, and David F. Hendry. 2016. Detecting Volcanic Eruptions in Temperature Reconstructions by Designed Break-Indicator Saturation. Journal of Economic Surveys 30: 403–29. [Google Scholar] [CrossRef]
- Ronen, Tavy, and Xing Zhou. 2013. Trade and Information in the Corporate Bond Market. Journal of Financial Markets 16: 61–103. [Google Scholar] [CrossRef]
- Santos, Carlos. 2008. Impulse saturation break tests. Economics Letters 98: 136–43. [Google Scholar] [CrossRef]
- Santos, Carlos, David F. Hendry, and Soren Johansen. 2007. Automatic selection of indicators in a fully saturated regression. Computational Statistics 23: 317–35. [Google Scholar] [CrossRef]
- Savor, Pavel, and Mungo Wilson. 2013. How Much Do Investors Care About Macroeconomic Risk? Evidence from Scheduled Economic Announcements. Journal of Financial and Quantitative Analysis 48: 343–75. [Google Scholar] [CrossRef]
- Savor, Pavel, and Mungo Wilson. 2014. Asset pricing: A tale of two days. Journal of Financial Economics 113: 171–201. [Google Scholar] [CrossRef]
- Schneeweis, Thomas, and J. Randall Woolridge. 1979. Capital Market Seasonality: The Case of Bond Returns. Joural of Financial and Quantitative Analysis 14: 939–58. [Google Scholar] [CrossRef]
- Shultz, Birl. 1946. The Securities Market and How It Works. New York: Harper Bros Publishers. [Google Scholar]
- Smales, L. A. 2021. Macroeconomic news and treasury futures return volatility: Do treasury auctions matter? Global Finance Journal 48: 100537. [Google Scholar] [CrossRef]
- Sorensen, Eric H. 1982. On the Seasoning Process of New Bonds: Some Are More Seasoned Than Others. Journal of Financial and Quantitative Analysis XVII: 195–208. [Google Scholar] [CrossRef]
- Stillwagon, Josh R. 2016. Non-linear exchange rate relationships: An automated model selection approach with indicator saturation. The North American Journal of Economics and Finance 37: 84–109. [Google Scholar] [CrossRef]
- Stillwagon, Josh R. 2017. TIPS and the VIX: Spillovers from Financial Panic to Breakeven Inflation in an Automated, Nonlinear Modeling Framework. Oxford Bulletin of Economics and Statistics 80: 218–35. [Google Scholar] [CrossRef]
- Sucarrat, Genaro, and Alvaro Escribano. 2012. Automated Model Selection in Finance: General-to-Specific Modelling of the Mean and Volatility Specifications. Oxford Bulletin of Economics and Statistics 74: 716–35. [Google Scholar] [CrossRef]
- Thaler, Richard H. 1987. Anomalies: The January Effect. Economic Perspectives 1: 197–201. [Google Scholar] [CrossRef]
- Tolikas, Konstantinos. 2018. The lead-lag relation between the stock and the bond markets. The European Journal of Finance 24: 849–66. [Google Scholar] [CrossRef]
- van Dijk, Dick, Robin L. Lumsdaine, and Michel van der Wel. 2016. Market Set-up in Advance of Federal Reserve Policy Rate Decisions. The Economic Journal 126: 618–53. [Google Scholar] [CrossRef]
- Wachter, Jessica A, and Yicheng Zhu. 2021. A Model of Two Days: Discrete News and Asset Prices. The Review of Financial Studies 35: 2246–307. [Google Scholar] [CrossRef]
- Wang, Junbo, and Chunchi Wu. 2015. Liquidity, credit quality, and the relation between volatility and trading activity: Evidence from the corporate bond market. Journal of Banking & Finance 50: 183–203. [Google Scholar] [CrossRef]
- Wei, Jason. 2018. Behavioral biases in the corporate bond market. Journal of Empirical Finance 46: 34–55. [Google Scholar] [CrossRef]
- Wei, Jason, and Xing Zhou. 2016. Informed Trading in Corporate Bonds Prior to Earnings Announcements. Financial Management 45: 641–74. [Google Scholar] [CrossRef]
- White, Halbert. 1990. A Consistent Model Selection Procedure Based on M-Testing. In Modelling Economic Series. Edited by Clive W. J. Oxford: Granger. [Google Scholar]
- Wit, J. N. M. 1998. Irving Fisher: Pioneer on Distributed Lags. Amsterdam: Econometric Research and Special Studies Department. De Nederlandsche Bank, p. 8. [Google Scholar]
- Zitzewitz, Eric. 2011. Paired Bond Trades. Working Paper. Hanover: Dartmouth College. [Google Scholar] [CrossRef]
Figure 1.
SAD cycle indicators by Julian date.
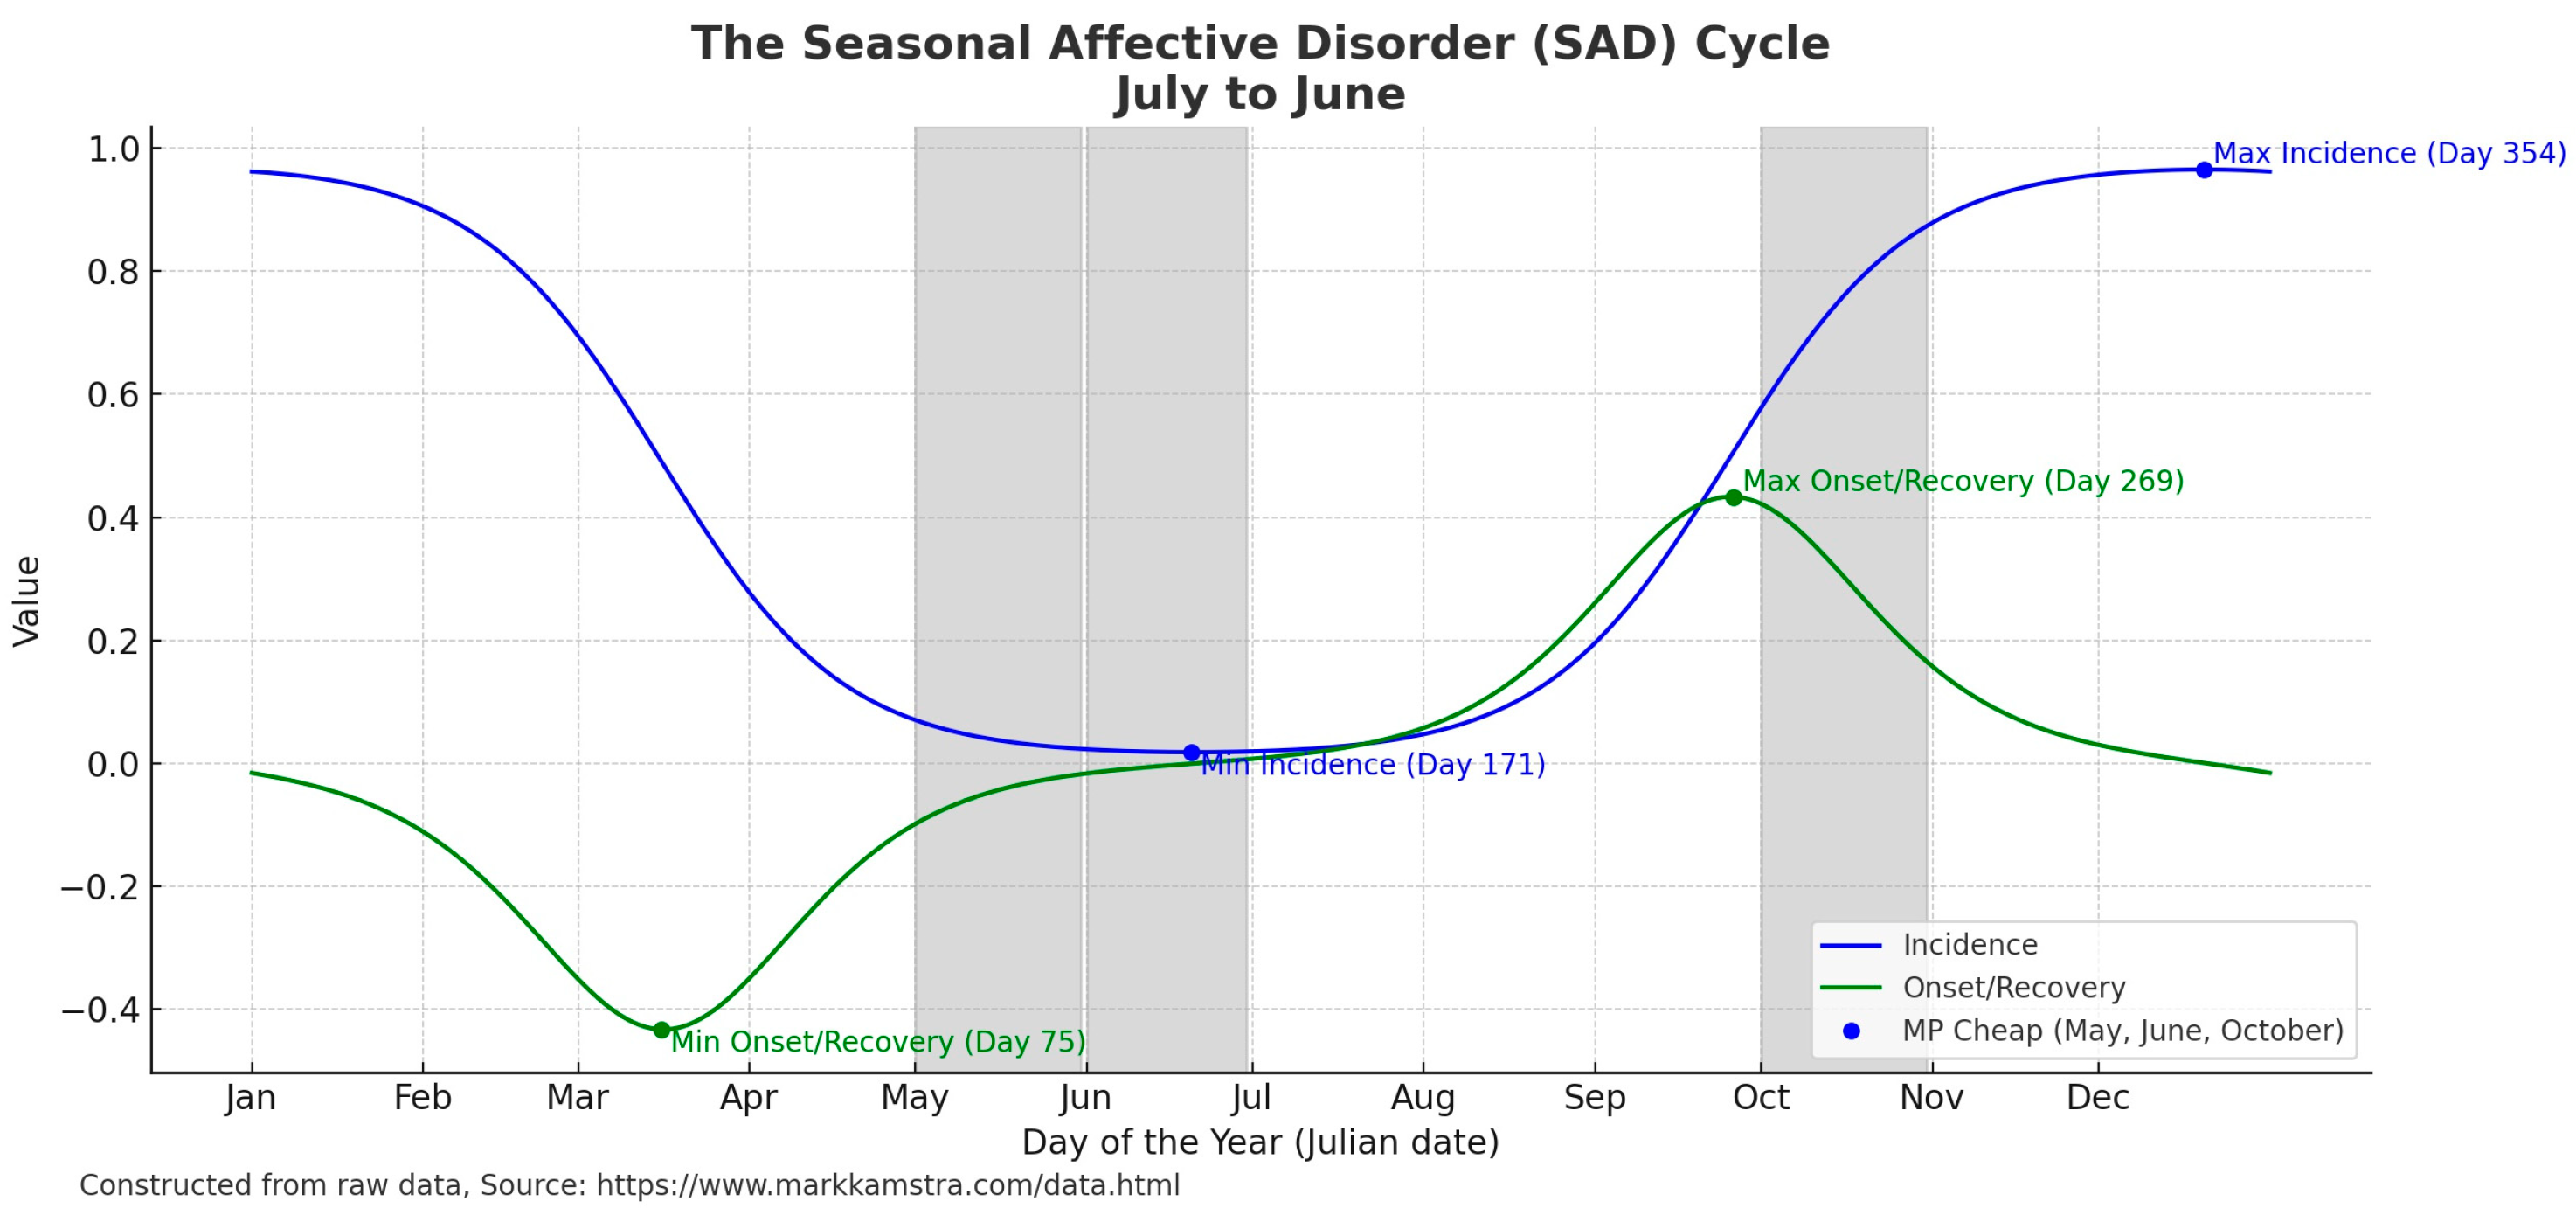
Figure 2.
Diagnostics of AR(1) model of IG total trades vs. Gets with IIS and SIS. (Panel (A)) AR(1); (Panel (B)) Gets Autometrics with IIS and SIS.
Figure 2.
Diagnostics of AR(1) model of IG total trades vs. Gets with IIS and SIS. (Panel (A)) AR(1); (Panel (B)) Gets Autometrics with IIS and SIS.
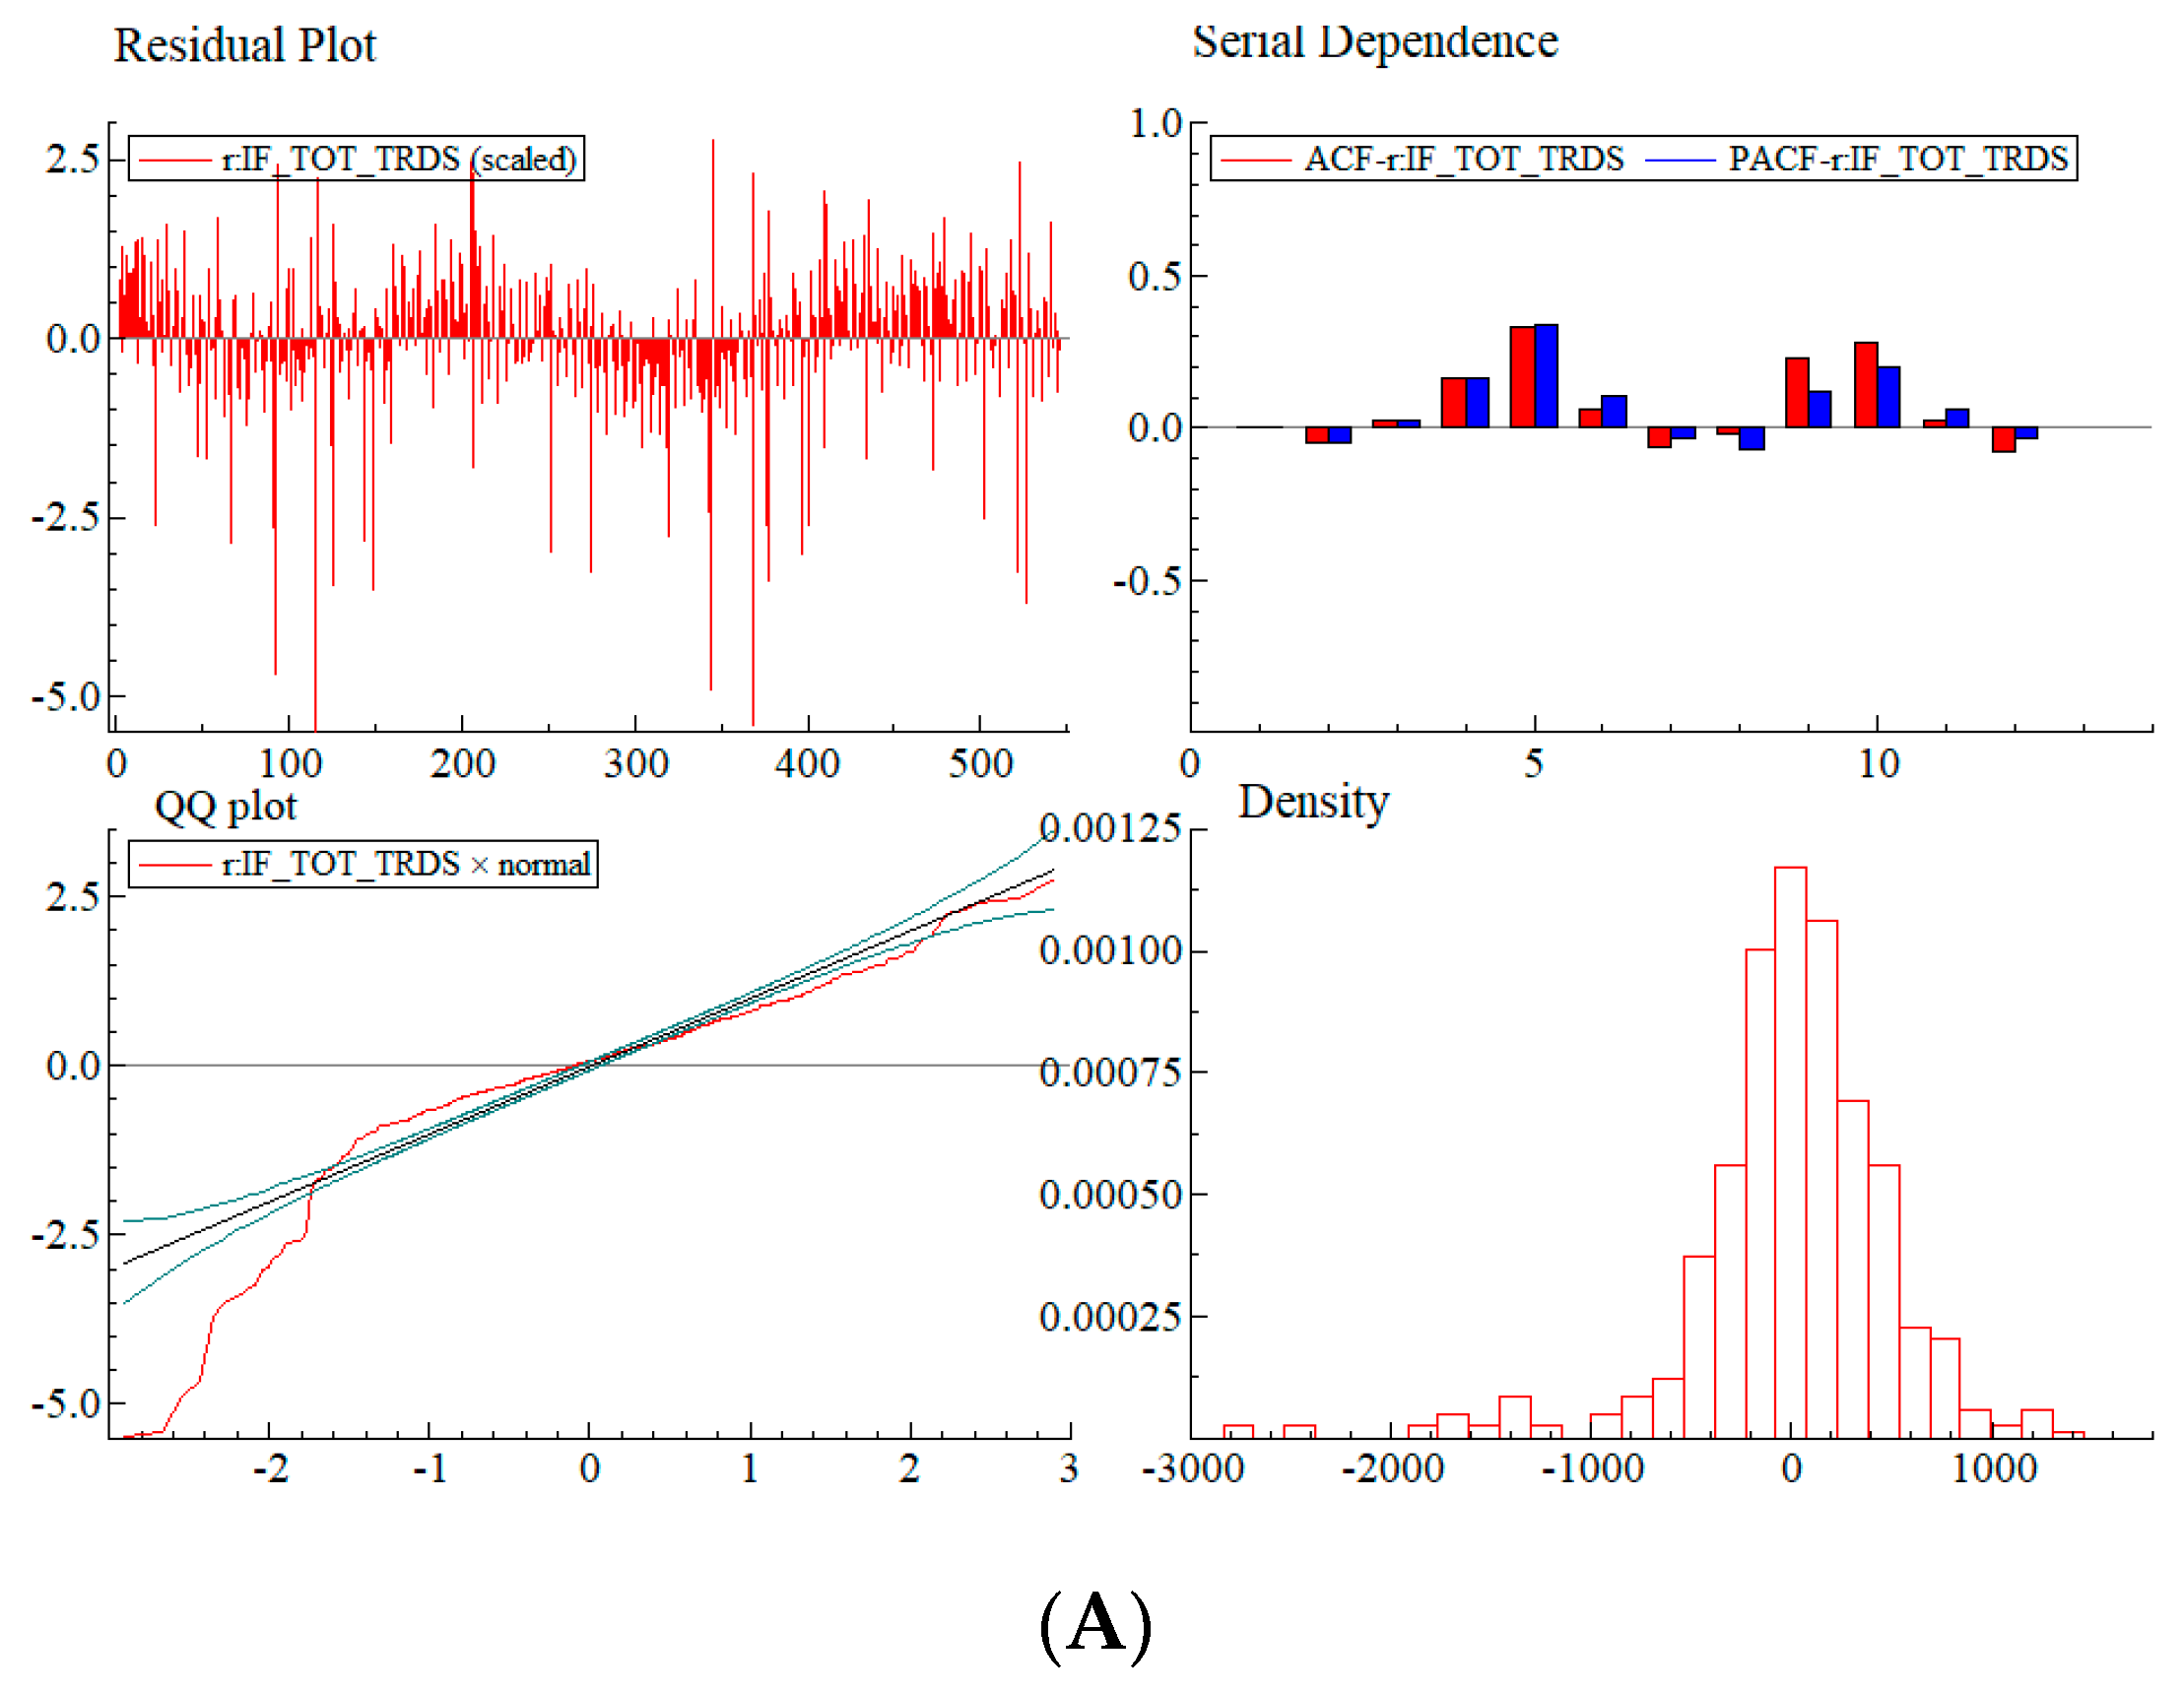

Table 1.
Descriptive statistics of trading activity for the period from 1 June 2004 to 31 July 2006.
Table 1.
Descriptive statistics of trading activity for the period from 1 June 2004 to 31 July 2006.
| Investment-Grade Bond Sample | High-Yield Bond Sample | |||||
|---|---|---|---|---|---|---|
| Filtered Sample | Financial | Nonfin. | Full Sample | Financial | Nonfin. | Full Sample |
| Number of Bonds | 262 | 179 | 441 | 6 | 32 | 38 |
| Days Traded | 506 | 506 | 506 | 422 | 422 | 422 |
| Total Trades | 984,362 | 555,245 | 1,539,606 | 9406 | 90,941 | 100,858 |
| Mean Trades Per Day | 1945 | 1097 | 3043 | 22 | 216 | 239 |
| Std. Dev. Trades per Day | 282 | 158 | 419 | 11 | 63 | 64 |
| Mean Par Vol. Per Day, USD | 754 | 106 | 395 | 571,481 | 79,757,235 | 80,328,716 |
| Std. Dev. Par Vol. Per Day, USD | 220 | 142 | 335 | 447,379 | 33,472,549 | 33,490,159 |
| Mean Par Vol. Per Trade, USD | 0.39 | 0.10 | 0.13 | 25,638 | 370,103 | 336,103 |
| Mean Trades Per Day Per Bond | 7.40 | 6.10 | 6.90 | 3.70 | 7.00 | 6.50 |
| Coeff. Of Var. Trades Per Day | 0.14 | 0.14 | 0.14 | 0.51 | 0.29 | 0.27 |
Note: IG volume data are in USD million, while the smaller HY bonds are straight USD values.
Table 2.
Performance regressions. This table presents results for performance regressions for the S&P 500 and both IG and HY bonds. Regressions are performed using the Autometricstm functionality in the PcGivetm package of OxMetricstm. Impulse- and step-indicator saturation methods are used. The full battery of tests is passed at the 5% significance level.
| Independent Variable | Return S&P 500 Coefficient | Return Inv. Grade Bonds Coefficient | Return High-Yield Bonds Coefficient |
|---|---|---|---|
| Constant | −0.19 a | 0.16 **+ | |
| Moody’s (−1) | 0.02 **+ | ||
| S&P 500 Volume | −0.04 ** | ||
| S&P 500 Return (−1) | 0.03 **+ | ||
| Core CPI SS | −0.05 ** | ||
| Nonfarm Payrolls SS | −0.11 **+ | ||
| Jobless Claims SS | 0.06 **+ | ||
| Core PPI SS | −0.13 ** | ||
| Impulse Indicators | 8 | 7 | 19 |
| Step Indicators | 12 | 22 | 46 |
| AR 1-2 test | 2.91 [0.0556] | 3.04 [0.0489] * | 4.55 [0.0110] * |
| ARCH 1-1 test | 0.32 [0.5707] | 0.00 [0.9967] | 0.00 [0.9556] |
| Normality test | 1.26 [0.5327] | 2.16 [0.3391] | 7.13 [0.0282] * |
| Hetero test | NR | 0.62 [0.9138] | 0.93 [0.6177] |
| RESET23 test | 0.00 [1.0000] | 0.25 [0.7752] | 1.10 [0.3353] |
| Log-likelihood | −487.69 | 98.34 | 674.80 |
| Parameters | 21 | 32 | 70 |
| Observations | 541 | 540 | 540 |
Note: * significant at 5%, ** significant at 1%, **+ significant at 1% and unanimous selection in terminal models. “a” indicates forced intercept due to no non-saturation regressors in regression. NR indicates no regressors for the test. SS represents standardized surprise for that macroeconomic variable. Moody’s represents the net change in ratings in terms of notches. (−1) indicates a one-period lag. (+1) indicates a one-period lead. Sample: 1 June 2004 to 31 July 2006.
Table 3.
Trading activity regressions. This table presents results for trading activity regressions for both IG and HY bond transactions. The dependent variables in each category are total trades and institutional trades, respectively. Regressions are performed using the Autometricstm functionality in the PcGivetm package of OxMetricstm. Impulse- and step-indicator saturation methods are used. Only in the case of institutional IG bonds do we see evidence of specification failure at the 5% significance level.
| Investment Grade | High Yield | |||
|---|---|---|---|---|
| Independent Variable | Total Trades Coefficient | Institutional Trades Coefficient | Total Trades Coefficient | Institutional Trades Coefficient |
| Trend | −2.30 ** | 0.19 ** | ||
| Moody’s (−1) | 1.78 ** | |||
| S&P 500 Volume | 9.14 **+ | 32.77 **+ | ||
| ABS Nonfarm Payrolls SS (−1) | −162.05 **+ | |||
| ABS Core CPI SS | 8.96 **+ | |||
| Monday | −224.11 **+ | −23.05 **+ | −8.61 **+ | |
| Tuesday | 95.11 **+ | 30.89 **+ | ||
| Wednesday | 19.83 ** | |||
| Friday | −443.70 **+ | −19.60 **+ | −38.87 **+ | −10.60 **+ |
| January | 25.42 ** | |||
| December | −163.40 **+ | −15.27 **+ | −34.44 **+ | −13.61 ** |
| NYSE Holiday | −2369.94 **+ | −28.90 **+ | −169.80 **+ | −29.29 **+ |
| NYSE Holiday (+1) | −413.48 **+ | |||
| NYSE Early Close | −1885.02 **+ | −31.59 **+ | −97.11 **+ | −32.42 ** |
| Murfin Petersen Cheap | 4348.37 ** | 33.97 **+ | 30.87 ** | |
| SAD Incidence | 67.09 **+ | |||
| SAD Onset/Recovery | −663.62 **+ | |||
| Impulse Indicators | 20 | 13 | 13 | 15 |
| Step Indicators | 47 | 25 | 27 | 25 |
| AR 1-2 test | 1.11 [0.3302] | 2.28 [0.1036] | 0.49 [0.6118] | 1.43 [0.2412] |
| ARCH 1-1 test | 0.02 [0.8759] | 1.62 [0.2040] | 2.17 [0.1416] | 0.90 [0.3420] |
| Normality test | 2.04 [0.3609] | 4.85 [0.0885] | 5.85 [0.0537] | 7.34 [0.0255] * |
| Hetero test | 0.99 [0.5037] | 0.92 [0.5978] | 0.85 [0.7226] | 1.43 [0.0646] |
| RESET23 test | 0.20 [0.8169] | 6.94 [0.0011] ** | 0.29 [0.7454] | 1.00 [0.3697] |
Note: * significant at 5%, ** significant at 1%. **+ significant at 1% and unanimous selection in terminal models. SS represents standardized surprise for that macroeconomic variable. Moody’s represents the net change in ratings in terms of notches. Murfin Petersen Cheap represents the credit market seasonal variable. (−1) indicates a one-period lag. (+1) indicates a one-period lead. Sample: 1 June 2004 to 31 July 2006.
Table 4.
Intermediated trading activity. This table presents results for inter-dealer intermediated trading activity regressions for both IG and HY bond transactions. The dependent variables in each category are total trades and institutional trades, respectively. Regressions are performed using Autometricstm in the PcGivetm package of OxMetricstm. Impulse- and step-indicator saturation methods are used. In all regressions, the full battery of specification tests is passed at the 5% significance level.
| Investment Grade | High Yield | |||
|---|---|---|---|---|
| Independent Variable | Intermediated Total Trades Coeff. | Intermediated Institutional Trades Coeff. | Intermediated Total Trades Coeff. | Intermediated Institutional Trades Coeff. |
| S&P 500 Volume | 53.386 **+ | 1.666 **+ | 11.815 **+ | 2.469 **+ |
| ABS Core PPI SS (−1) | 45.695 **+ | |||
| ABS Core PPI SS | −1.495 ** | |||
| Monday | −0.945 **+ | |||
| Tuesday | 31.088 **+ | 1.148 **+ | 4.892 **+ | |
| Wednesday | 1.244 **+ | |||
| Friday | −78.720 **+ | −1.073 **+ | −6.958 **+ | −1.243 ** |
| Murfin Petersen Cheap | 733.311 **+ | |||
| NYSE Holiday | −554.854 **+ | −3.669 **+ | −20.965 **+ | −3.626 **+ |
| NYSE Holiday (+1) | −119.735 **+ | −1.567 ** | ||
| NYSE Holiday (−1) | 227.439 **+ | |||
| NYSE Early Close | −321.619 **+ | |||
| NYSE Early Close (−1) | ||||
| December | −2.049 **+ | −4.658 **+ | −3.586 **+ | |
| SAD Incidence | −19.671 **+ | |||
| SAD Onset/Recovery | −126.954 **+ | |||
| Impulse Indicators | 7 | 25 | 18 | 18 |
| Step Indicators | 36 | 16 | 22 | 25 |
| AR 1-2 test | 0.57 [0.5670] | 3.58 [0.0287] * | 0.15 [0.8575] | 0.30 [0.7405] |
| ARCH 1-1 test | 0.13 [0.7144] | 1.05 [0.3069] | 0.19 [0.6608] | 6.06 [0.0142] * |
| Normality test | 1.88 [0.3902] | 5.45 [0.0656] | 8.84 [0.0121] * | 9.06 [0.0108] * |
| Hetero test | 0.70 [0.9131] | 1.59 [0.0509] | 1.06 [0.3840] | 1.62 [0.0255] * |
| RESET23 test | 0.99 [0.3724] | 0.30 [0.7390] | 0.99 [0.3742] | 1.45 [0.2352] |
Note: * significant at 5%, ** significant at 1%. **+ significant at 1% and unanimous selection in terminal models. SS represents standardized surprise for that macroeconomic variable. Moody’s represents the net change in ratings in terms of notches. (−1) indicates a one-period lag. (+1) indicates a one-period lead.
Disclaimer/Publisher’s Note: The statements, opinions and data contained in all publications are solely those of the individual author(s) and contributor(s) and not of MDPI and/or the editor(s). MDPI and/or the editor(s) disclaim responsibility for any injury to people or property resulting from any ideas, methods, instructions or products referred to in the content. |
© 2024 by the authors. Licensee MDPI, Basel, Switzerland. This article is an open access article distributed under the terms and conditions of the Creative Commons Attribution (CC BY) license (https://creativecommons.org/licenses/by/4.0/).
Share and Cite
MDPI and ACS Style
Forest, J.J.; Branch, B.S.; Berry, B.T. Trading Activity in the Corporate Bond Market: A SAD Tale of Macro-Announcements and Behavioral Seasonality? Risks 2024, 12, 80. https://doi.org/10.3390/risks12050080
AMA Style
Forest JJ, Branch BS, Berry BT. Trading Activity in the Corporate Bond Market: A SAD Tale of Macro-Announcements and Behavioral Seasonality? Risks. 2024; 12(5):80. https://doi.org/10.3390/risks12050080
Chicago/Turabian StyleForest, James J., Ben S. Branch, and Brian T. Berry. 2024. "Trading Activity in the Corporate Bond Market: A SAD Tale of Macro-Announcements and Behavioral Seasonality?" Risks 12, no. 5: 80. https://doi.org/10.3390/risks12050080
Note that from the first issue of 2016, this journal uses article numbers instead of page numbers. See further details here.