
Pricing Kernels and Risk Premia implied in Bitcoin Options

1
International Research Training Group 1792, Humboldt-Universität zu Berlin, 10117 Berlin, Germany
2
BRC Blockchain Research Center, Humboldt-Universität zu Berlin, 10117 Berlin, Germany
3
Sim Kee Boon Institute, Singapore Management University, Singapore 178899, Singapore
4
WISE Wang Yanan Institute for Studies in Economics, Xiamen University, Xiamen 361005, China
5
Department of Information Management and Finance, National Chiao Tung University, Hsinchu 300, Taiwan
6
Department of Mathematics and Physics, Charles University, 121 16 Praha 2, Czech Republic
*
Author to whom correspondence should be addressed.
Risks 2023, 11(5), 85; https://doi.org/10.3390/risks11050085
Submission received: 14 February 2023
/
Revised: 16 April 2023
/
Accepted: 24 April 2023
/
Published: 30 April 2023
(This article belongs to the Special Issue Data Analysis and Financial Risk Management in Financial Markets)
Abstract
:Bitcoin Pricing Kernels (PKs) are estimated using a novel data set from Deribit, the leading Bitcoin options exchange. The PKs, as the ratio between risk-neutral and physical density, dynamically reflect the change in investor preferences. Thus, the PKs improve the understanding of investor expectations and risk premiums in a new asset class. Bootstrap-based confidence bands are estimated in order to validate the results. Investors are heterogeneous in their risk profiles and preferences with respect to volatility and investment horizon. The empirical PKs turn out to be U-shaped for short-dated instruments and W-shaped for long-dated instruments. We find that investors are willing to pay a substantial risk premium to insure themselves against short-term price movements. The risk premium is smaller for longer-dated instruments and their traders are risk averse. The shape of the empirical PKs reveals the existence of a time-varying risk premium. The similarity between the shape of empirical PKs for Bitcoin and other markets that represent aggregate wealth shows that Bitcoin is becoming an established asset class.
JEL Classification:
C14; C50; G101. Introduction
The valuation of digital currencies has been a question that predated its first representative, Bitcoin. Upon the creation of Bit Gold, Szabo (2008) envisioned its value to arise from an interplay between the benefits of the two entities which foremost represent value: cash and metal. The argument put forward was that metal bears an inherent value that is largely independent of trusted third parties. However, the unwieldiness of metal incurs a relatively high transaction cost when used as a means of exchange. (Unbacked) Cash, on the other hand, draws its value largely from the trust in a third party’s acceptance. The combination of the two elements, coming in the form of a scarce digital resource that is governed by a trustless system, has been passed on to Bitcoin (BTC) and other Cryptocurrencies (CCs).
Since the inception of BTC as proposed by Nakamoto (2009), various arguments have been made on its valuation. Apart from the benefit of a trustless system, the arguments typically include the production cost of a block Hayes (2019), the benefit of borderless transactions Deng (2020); The Stellar Development Foundation (2022), the value of an inflation hedge Choi and Shin (2022), network effects Chen and Vinogradov (2021); Gandal and Halaburda (2016) or expectations about future price developments Blau (2017); Smaniotto and Neto (2022).
In addition to the former valuation approaches, we offer new insights by means of the BTC derivatives market which has emerged over the course of recent years. Since derivatives markets are particularly rich in information, their evolution provides a unique opportunity to assess the BTC market valuation through the application of proven econometric techniques. Key information about preferences and forward-looking decisions are called state price densities (SPDs), which can be estimated from option prices. SPDs yield risk-neutral probabilities, under which investors price derivatives. They provide the key to pricing exotic or illiquid options in an arbitrage-free manner Aït-Sahalia and Lo (1998) and offer insight into changing expectations about future developments. In conjunction with the physical density (PD) of Bitcoin returns, the resulting pricing kernels (PK) can be calculated. The shape and evolution of PKs over time disclose investor expectations under different market circumstances and give insight into time-varying preferences. We present the first paper that is based on real Bitcoin option data, inferring and disclosing investor preferences following hypothesizing papers on bootstrap-based confidence bands for empirical PKs Härdle et al. (2014) and cryptocurrency option pricing under an SVCJ model Hou et al. (2020).
BTC derivatives markets can already be regarded as efficient information processing mechanisms Alexander et al. (2022). Among those markets, Deribit is the leading crypto option exchange as measured by open interest and trading volume. As of 2022-07-25, Deribit manages more than 90% of the BTC option volume which translates during a 30-day window into an average 24-h trading volume of over 331.8 million USD Skew (2022). The competitors LedgerX, OKEx, CME, bit.com, and Binance are contributing respective averages of 1.9, 15.7, 13.2, 1.5, and 0.582 million USD.
A particularly interesting property of the BTC options market is its decentralized nature. Trading on Deribit is largely dominated by retailers. Despite an ongoing decline in retail market share in favor of institutions Coinbase (2022), who are cautious when investing in highly volatile and unregulated assets, the options market on Deribit remains driven by retailers: As of 2022-07-25, 86.65% of the volume is attributed to retail, whereas 9.16% and 1.19% are attributed to investors and whales Deribit (2022d). Deribit classifies market participants according to their share of the circulating BTC supply. According to Deribit’s classification, a “whale” is an entity that owns more than 1% of the supply on Deribit, an “investor” owns between 0.1% and 1%, and a “retailer” owns less than 0.1%. Considering the retail share in trading volume in conjunction with Deribit’s dominating market share over the competition, we figure that the Bitcoin price is mainly driven by retail. Analyzing a retail-driven marketplace renders the study of digital currencies such as BTC unique and different from the well-studied equity options markets, where retail only has a minor influence Bloomberg (2021).
Another interesting feature of the market under consideration is not just the dominating presence of retailers, but their easy access to leverage for speculation. Since Deribit is by design a margin-trading platform, levers of up to 100 are available for longs. Easy access to leverage could suggest the existence of the leverage effect if investors were risk affine. However, we cannot confirm a leverage effect to be present in the time frame under consideration.
2. Pricing Kernels
Assume a risky asset with a stochastic price process and a risk-free interest rate in a complete market. Following the second Fundamental Theorem of Asset Pricing, a unique martingale-equivalent measure Q exists in the described setting, under which derivatives can be priced in an arbitrage-free manner Pascucci and Agliardi (2011); Huynh et al. (2002).
Let be the price at time t of a contingent claim with payoff on the risky asset (underlying), which has a maturity at T and a time-to-maturity . For simplicity assume a constant interest rate . The price of any such contingent claim can be expressed as the discounted value of expected future payoffs, weighted with their respective probabilities of occurrence. The expectation operator is conditional on the information set at t under the equivalent martingale probability Q
Transforming the risk-neutral measure Q to the physical measure P yields the PK by Itô’s Lemma.
where the PK is defined as and for simplicity of notation we write for and drop the sequence .
The PK can therefore be approximated by the ratio between the risk-neutral density and the physical density. This process is discussed and executed in the following sections.
3. Nonparametric Estimation of State Price Densities
3.1. Derivation
As stated by Breeden and Litzenberger (1978), an SPD can be estimated via the second derivative of the call price function with respect to the strike price K.
A variety of call prices C with different strikes K is required in order to calculate the complete SPD q. The present value of a call can be priced in implied volatility (IV). In conjunction with the vector (time-to-maturity , strike K, spot S, interest rate r), the market call price can be calculated.
IV is estimated as a function of time-to-maturity and moneyness in the following section. Collapsing spot price S and strike K into a single variable reduces the effect of the curse of dimensionality. Similarly, we collapse S and the interest rate r into a Futures price.
3.2. Local Polynomial Estimation of the IV Surface
Assume that the implied volatilities have some noise added Rookley (1997); Huynh et al. (2002).
with a standardized error random variable , moneyness M, and independent and being the scaling of the error term given M and . Suppose g is smooth, i.e., it can be approximated using Taylor’s Theorem.
Taylor expansion of g in a neighborhood of :
The functional relationship between the IV surface and M and can now be approximated using a Weighted Least Squares Estimator (WLSE), minimizing the objective function
where for a Gaussian kernel with bandwidths and . is the vector of observed implied volatilities, is the vector of the local polynomial coefficients.
The resulting WLSE is
Following Härdle et al. (2014), a window of the last 500 daily returns (based on ) is used to calculate a nonparametric Kernel Density Estimator for the PD. 1
4. Literature Review
Breeden and Litzenberger (1978) derive SPDs using Arrow-Debreu prices and Butterfly Spreads. Their paper was the cornerstone for the now-existing vast literature on the estimation of SPDs. Without requiring a parametric form for SPDs, Rookley (1997) developed a nonparametric estimation method. IV skews are estimated by decomposing the functional relationship between IV, moneyness, and time-to-maturity . In this manner, it is possible to derive the SPD at every point in a robust way. Aït-Sahalia et al. (2001) estimated PKs from S&P500 options data and the according return series in order to assess the efficiency of the options market. Departures from SPD and PD are used to identify inefficient pricing. They designed a trading strategy, exploiting the skewness and kurtosis of the densities. The strategy is shown to have a high Sharpe Ratio. Grith et al. (2009) proposed a systematic modeling approach to study the evolution of PKs over time. With European DAX data, a series of empirical PKs is estimated from 2003 to 2006. While the risk-neutral density is inferred using Rookley’s method, the PD is estimated with a GARCH model. A common shape is identified and deviations of the time-varying EPKs are studied. The deviations between individual PKs are described using a set of parameters for horizontal and vertical shifts. The relationship between PKs and the Arrow–Pratt measure of Absolute Risk Aversion (ARA) provides insight into investors’ risk aversion. In related research, Härdle et al. (2014) derive bootstrap-based confidence bands for nonparametrically estimated PKs.
Inverse Options, meaning options settled in kind of the underlying asset, are dominant in the crypto world. Settlement of BTC options in terms of BTC changes the payoff function of the option from to and thus changes the contract’s net present value. Alexander and Imeraj (2021) adjusted Black–Scholes prices and hedge ratios to inverse options. However, it is argued that traders are erroneously applying vanilla Black–Scholes valuation instead of the corrected prices - perhaps because of being unaware of the concept. We decided to use the standard, non-inverse Black–Scholes pricing for multiple reasons. First, Alexander and Imeraj (2021) argued that traders are perhaps unaware of the difference. Since we are inferring investor expectations, we assume that it is more appropriate to infer pricing kernels under the same Black–Scholes prices that the investors use. Additionally, it is likely that many traders actually hedge their overall Bitcoin exposure. This would invert the “inverse” part of the option. Furthermore, reviewing the differences in pricing compared to the adjusted prices, we find that the difference is small in the absence of extreme moves in the underlying asset. This was not the case in the time period under consideration.
Hou et al. (2020) priced BTC options under an SVCJ model. Their results emphasize the tail risk introduced by jumps in the underlying asset. Jumps in particular introduce market incompleteness, but anonymity of transactions may be relevant as well. Chen and Vinogradov (2021) derived PKs and the impact of market incompleteness on risk premia. They state that a key property of cryptocurrency valuation is the user’s anonymity (or pseudonymity), which is simultaneously the source of value and incompleteness in the respective market. They argue that hedging an anonymous transaction would require an identity disclosure. This contradiction may introduce an effectively unhedgeable event.
5. Deribit
Deribit, a margin-trading platform for futures and options, was launched in June 2016 in the Netherlands and is currently incorporated in Panama. At the time of writing and as depicted on Figure 1, Deribit is the largest BTC option exchange Skew (2022). For both types of derivatives, BTC and ETH are the underlying currency, as well as the currency in which settlement is conducted. This allows viewing them as inverse options.
Bitcoin Option Contract Specifications
Deribit offers cash-settled European-style options. The underlying asset is a synthetic index, whose exact composition is described in the data section. Settlement is first calculated in USD and then conducted in kind of the underlying. e.g., a BTC call with a strike of 10,000 and a settlement value of 12,000 at maturity will result in a cashflow of 2000 USD, which is equivalent to BTC (excluding transaction cost). The settlement value is defined as the average of the underlying BTC index for the last 30 min before settlement. Each contract has a lot size of 1 BTC and is settled at 8 a.m. UTC on the respective maturity date. Maturity dates have a daily, monthly, quarterly, and annual frequency. Deribit is the only derivatives exchange to offer daily options. Instruments are trading 24/7 with a tick size of 0.0005 BTC. Due to the automatic usage of margin trading, margin-based liquidation of positions is possible. Initial margin and maintenance margins are both zero for long positions. For short positions, an initial margin is required Deribit (2022a, 2022b). In the case of liquidation, a penalty is applied to the defaulting party, whose proceeds are paid into the Deribit Insurance Fund Deribit (2020b).
Trading and deliveries on Deribit are subject to fees Deribit (2022c). The applied fees generally vary depending on whether the order was a liquidity maker or taker. However, for Bitcoin options they are equal. Trading fees are 0.03 percent of the underlying asset or 0.0003 BTC per options contract. The fees constitute a maximum of 12.5 percent of the contract’s value.
6. Data
6.1. Data Structure
The dataset consists of 8,444,664 order book snapshots, which were collected from Deribit in the time from 2021-04-01 to 2022-04-01. The snapshots were captured via the Deribit API V2. The database is available on the Blockchain Research Center (BRC). The full data set includes all parameters that the Deribit API V2 returns at the time of collection under the methods.
- {public/get_last_trades_by_instrument_and_time}, accessed on 12 February 2022
- {public/get_order_book}, accessed on 12 February 2022
Most importantly the results include
- Timestamps
- Greeks
- Implied Volatility
- Tick Direction
- Order Type
- Volume
- Instrument Price
- Strike
- Spot
High-frequent order book changes and executed trades are captured for options and futures whose underlying asset is BTC. Values of the underlying synthetic BTC USD Index are also saved. The underlying is calculated as an equally weighted BTC/USD price of eleven major crypto exchanges, namely Binance, Bitfinex, Bitstamp, Bittrex, Coinbase Pro, FTX, Gemini, Huobi, Itbit, Kraken, LMAX Digital, and OKEx. Individual feeds can be excluded due to administrative decisions or in the case of invalid data. The remaining feeds are sorted, truncated around the median price, and weighted Deribit (2020a).
6.2. Data Integrity
Data integrity plays a crucial role in crypto markets. Mark Carney, the chair of the Financial Stability Board and head of the Bank of England, warned that wash trading, pump and dumps, and spoofing, known as outlawed manipulation techniques in equity markets, are also present in crypto and pose a risk to financial stability Rodgers (2019). Wash trading is used to increase trading volume and thus artificially increase demand. A spoofer submits market non-bona fide price quotes to cause artificial price volatility Sar (2017). Pump and Dump is a form of securities fraud in which a group of traders rapidly and artificially inflate a price in order to offload their previously acquired inventory. Since Pump and Dump schemes require low liquidity (in the underlying asset), we can exclude this possibility for Bitcoin La Morgia et al. (2020).
Aloosh and Li (2019) found evidence for exchange-driven inflated volume, generated by wash trades, to market themselves under the guise of liquidity. Cong et al. (2019) reported that, on average, 70% of volume on decentralized exchanges is fake due to the use of wash trading. According to Bitmex (2019), up to 95% of trading volume on unregulated exchanges is generated by wash trading. To ensure data integrity, we exclusively use order books instead of executed trades in order to filter possible cases of wash trading.
To address the potential issue of spoofing, we adopt an approach related to Tuccella et al. (2021). They attempted to identify spoofing on cryptocurrency exchanges using a GRU model. Their predictors are a function of the number of canceled orders relative to the cumulative order size on each side of the order book. Since Bitcoin derivatives’ order books do not have the same amount of depth as spot or futures markets, we employ a stricter method and exclude all orders wherein the lifetime does not exceed two seconds. We find that less than 5% of orders are filtered due to a short order lifetime. We assume that traditional spoofing techniques, based on the rapid submission and cancellation of orders, are difficult to implement due to Deribit’s rate limits Deribit (2023). Users with less than one million USD in a 7-day turnover can only post five matching engine requests. These include a request for a buy or sell order or a corresponding cancellation. Although the limits for a market maker (who could be allowed to post 30 requests per second given a turnover of 25 million USD in seven days) are considerably higher, the market maker must still meet the quoting requirements for a large range of instruments. This effectively restricts the influence that single entities can have on certain instruments via the rapid submission and cancellation of orders and explains the rarity of such events in our dataset.
6.3. Preprocessing
Although market makers are obliged to quote most instruments for the majority of the time, some may not be quoted at all or only be quoted at the cost of a large spread Deribit (2020c). For Far-Out-of-Money (FOTM) contracts, when the minimum tick size exceeds the market IV, one can observe bids for 0% IV. Cases of quotes for 0% IV and all duplicates are excluded from the data set. Since the majority of option trading volume concentrates on instruments with short or medium time-to-maturity , we restrict to be smaller than or equal to one quarter of a year. is normalized on the span of a year. Instruments are grouped according to their time-to-maturity, over a range of 0, 1, 2, 4, and 8 weeks. We restrict moneyness to the interval in order to exclude the influence of high-volatility observations which could be unreliable Grith et al. (2009).
Call options are exclusively used in order to estimate the IV surface in Rookley’s method. Put-Call-Parity ensures arbitrage-free call option prices. However, we do not use Put-Call-Parity to increase our data sample. Conversion of option prices via Put-Call-Parity could introduce errors into our dataset due to market microstructure (MMN) noise. Our high-frequent order book data is extracted via an API. Due to rate limitations and a diverse number of instruments, order book snapshots cannot be taken simultaneously for all instruments. The data scraping application successively iterates over all instruments and captures changes in order books. While the resulting database provides a clear picture of order book data, it does not allow for a complete reconstruction of all order books at all times. Without simultaneity, the volatility of the underlying asset and order competition within the spread could change the prices of the corresponding instruments (required for Put-Call-Parity) between the individual snapshots. A range of futures may be available on Deribit, but only the perpetual futures contract is actually liquid. The classic (non-perpetual) futures also price in the settlement cost, which often causes them to trade in backwardation close to maturity. However, despite this, BTC options tend to be traded more frequently when they are close to maturity. The combination of these real-world limitations challenges the simple conversion via Put-Call-Parity and could introduce errors into our dataset. Furthermore, we do not see the necessity to use such a method as we have sufficient call option data to compute the IV surface from which we sample option prices. 2
7. Volatility
In accordance with Masset (2011) and Eraker (2021), the list of well-established stylized facts on volatility in traditional markets includes horizontal dependence of volatility, leverage effect, the volatility premium3 and extreme events. Horizontal dependence of volatility describes the tendency of local volatility clusters and the tendency to mean-reversion. Both properties can be observed in the 7-day rolling volatility. Sudden spikes in realized volatility form clusters and are often followed by similar drops. The leverage effect can be measured as a negative correlation between returns and volatility. Phases of negative returns coincide with high volatility and vice versa. The Pearson correlation between the underlying and realized volatility is −12.59%. The Pearson correlation between the underlying asset and the bid (ask) IV is −16.11% (−13.05%). Due to the low absolute values of correlation, the existence of a leverage effect is unlikely. However, the sign matches the direction of a leverage effect. Considering the large share of retailers with easy access to leverage, the lack of significance is a surprising result. It is well-known that, in general, the IV exceeds the unconditional annualized standard deviation. This is displayed in Figure 2. The difference between implied and realized volatility is commonly referred to as volatility premium. The mean 7-day rolling volatility is 70.96%, whereas the mean IV at the bid and ask are 85.28% and 93.57%. Spikes in realized volatility rarely exceed the ask of the IV. Consequently, the volatility premium is shown to be substantial throughout the regarded time period. Fat-tail events are priced in due to the classic volatility skew. This is depicted in Figure 3 and Figure 4, the empirical volatility skew4.
Since the data are high-frequency order book snapshots with substantial bid-ask spreads, we must address the issue of Market Microstructure Noise (MMN). A simple estimate of realized volatility would increase with our sample due to order competition within the spread. We resolve the issue of MMN in our calculation of realized volatility by taking the arithmetic mean after aggregating the implied volatility of bids and asks on a daily basis. Therefore, the frequency is matching the underlying BTC index. The formula for annualized, realized volatility of price p over a window of w days is
Annualization is based on 365 days since Bitcoin options are traded continuously on Deribit.
The term structure itself is easier to assess when regarding ATM options in a series of dates (Figure 5)5 ATM options are defined as those options, whose moneyness falls in the interval . A typical term structure of the Bitcoin options reveals a high level of implied volatility for short-dated options. For options with a time-to-maturity of three days or more, implied volatility drops sharply compared to the initial level. Naturally, IV is increasing with time-to-maturity.
8. Empirical Pricing Kernels
Instruments are grouped by time-to-maturity in order to summarize the findings (Figure 6, Figure 7, Figure 8, Figure 9, Figure 10 and Figure 11) 6 All instruments with less than one week to maturity are classified as having less than one, between one and two, between two and three, between three and four, and between five and eight weeks to maturity. We typically observe U-shaped PKs for short-term maturities. In a similar fashion to the oil market, investors perceive short-term price changes in any direction as undesirable and prefer to hedge their risk Christoffersen et al. (2021). For short-dated instruments, option writers are asking for substantial risk premia in order to reflect unhedgeable risks, such as jumps in the underlying asset Hou et al. (2020).
We find a different shape for longer-dated instruments. Typically, PKs in traditional markets are monotonically decreasing. This results from human risk aversion; investors are willing to insure themselves against losses and have a preference for smooth consumption curves. However, PKs outside of index options markets are not well studied Cuesdeanu and Jackwerth (2018). Grith et al. (2009) compartmentalize a pricing kernel in two segments around a possible breakpoint. Testing an unrestricted model against GMM estimates of the restricted one, they reject the monotonicity of the empirical PK in four out of five cases (performing a D-test). The phenomenon of having a decreasing slope, although with locally increasing sections in empirical PKs is called the pricing kernel puzzle. We observe a similar behavior and extend the existing literature on the pricing kernel puzzle to a new asset class.
Since the empirical PKs for short-dated instruments are U-shaped, we figure that investors are willing to pay a high-risk premium in order to ensure immediate price risks. With the increasing maturity of the instrument, the shape of the empirical PK resembles a “W” or “tilde”. This corresponds to a lower willingness to pay a risk premium.
The dynamic of the empirical PKs also reveals the existence of a time-varying risk premium in BTC markets. The observed PK shapes are closely aligned with the results reported in Cuesdeanu and Jackwerth (2018). However, their object of study is traditional markets, such as major indices which are highly correlated with aggregate wealth. We conclude that, due to the similarities of the empirical PKs, BTC is well on its way to becoming an established asset class. It may prove to be much rather a store of value than it is currently given credit for.
Apart from the discussion of results, deviations between PD and SPD can be interpreted as trading opportunities. Blaskowitz et al. (2004) design and evaluate trading strategies based on deviations between PD and SPD. Estimated PKs could be used by traders employing so-called Skewness or Kurtosis trades. Nevertheless, traders must recognize the hidden cost of employing such strategies in terms of substantial hedging cost, e.g., in the form of volatility and large spreads.
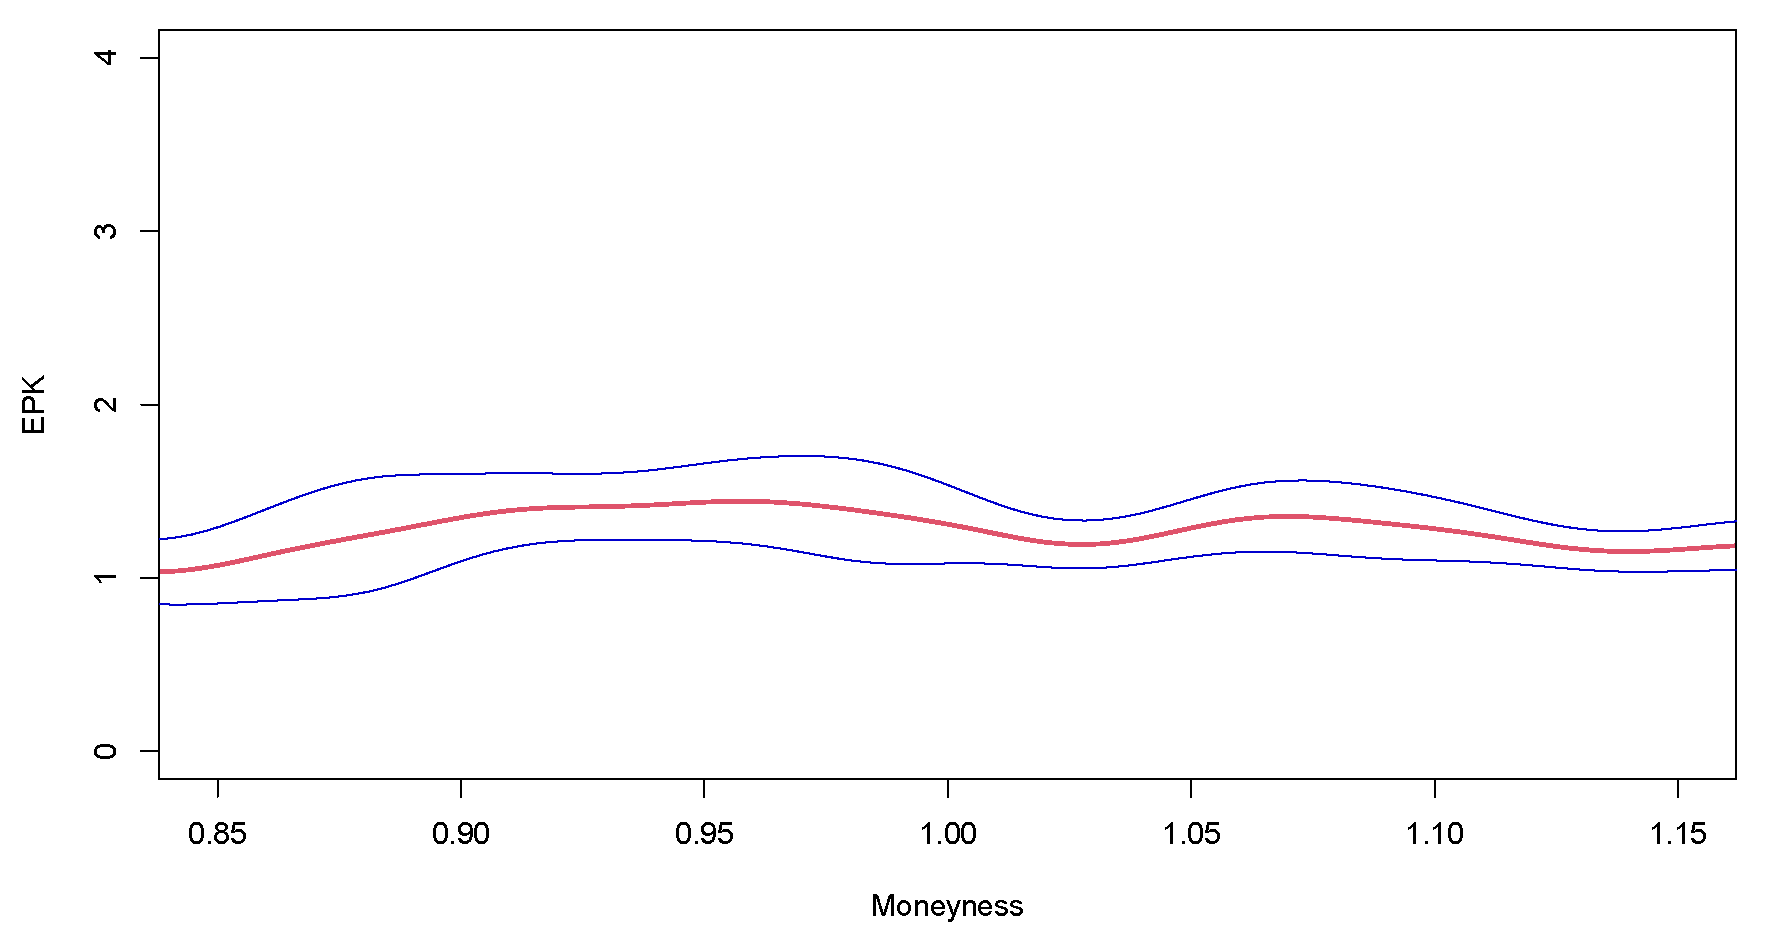
9. Bootstrap-Based Confidence Bands
Having computed a large set of empirical PKs with varying maturities, it should be ensured that the observed features are not mere artifacts. A useful tool to assess the validity of our estimated PKs is bootstrap-based confidence bands7 Following the derivation of Härdle et al. (2014), confidence bands at any confidence level can be derived via the “wild bootstrap method”. Figure 12, Figure 13, Figure 14, Figure 15, Figure 16, Figure 17 and Figure 18 are depicted exemplarily for the whole set. Confidence bands are tighter around the PKs when time-to-maturity increases. PKs are also flatter with growing time-to-maturity.
The concept of bootstrapping PK can be introduced by linearization of the PK. The stochastic deviation of the PK can be linearised into a stochastic part, containing the estimator of the SPD and a deterministic part containing the expectation of the physical density. The convergence of both parts can be proven separately.
Consider the leading term of
Resample data from the smoothed bivariate distribution of strike and moneyness (X, Y)
10. Conclusions
Empirical PKs have been estimated using Rookley’s Method on a dataset of order book snapshots from Deribit, the leading BTC options market. Bootstrap-based confidence bands have been estimated in order to validate the results.
We assess the presence of well-established stylized facts of volatility in the BTC market. We found horizontal dependence of volatility, meaning that volatility tends to cluster and revert to the mean. The difference between implied and realized volatility, commonly referred to as the volatility premium, is substantial. Realized volatility rarely exceeds the implied volatility. The IV term structure is found to be traditional. Despite market participants’ easy access to leverage, we cannot confirm the existence of a leverage effect.
Our analysis extends the literature to a new asset class and contributes to the pricing kernel puzzle. We are able to replicate empirical results from the analysis of PKs in traditional markets, which are highly correlated with aggregate wealth. Their similarity to PKs estimated from BTC options indicates that BTC is becoming an established asset class.
Furthermore, our analysis sheds light on the BTC valuation and risk aversion of retail traders. BTC option traders mostly consist of retailers who are heterogeneous in their risk profile. The price of short-dated instruments includes a high-risk premium. Such instruments reflect the anticipation of jumps in the underlying market. These instruments would be traded by either very risk-averse or risk-affine traders. Long-dated instruments are employed as classic hedging instruments. While a substantial risk premium is paid by traders in order to insure themselves against falling prices, they are additionally (but to a lesser degree) insuring themselves against sharply rising prices. Thus, investors are also hedging their risk of being priced out of a dynamic market.
Several extensions of the presented research are available for future studies. Among those, we would find an extended dataset insightful, that could support the estimation of PKs and their evolution over a longer time frame and possibly describe the convergence to the PKs of established markets. It would also be interesting to analyze the evolution of PKs around stress events in order to obtain further insights into investor risk aversion, the anticipation of such events, and trading opportunities.
Author Contributions
Conceptualization, Validation: J.W. and W.K.H. Software, Original Draft Preparation, Review and Editing, Visualization: J.W. Methodology, Supervision, Project Administration, Funding Acquisition: W.K.H. All authors have read and agreed to the published version of the manuscript.
Funding
This research was funded by Deutsche Forschungsgemeinschaft grant number IRTG 1792, Project Number 194669382 and Czech Science Foundation 19-28231X/CAS XDA 23020303.
Data Availability Statement
All underlying code is available on quantlet.com and a corresponding courselet is available on quantinar.com, accessed on 14 February 2023. The database is available on the Blockchain Research Center (BRC), accessed on 14 February 2023.
Conflicts of Interest
The authors declare no conflict of interest.
| 1 | Quantinar Chapter 24, Available online: https://quantinar.ro/course/103/statistics-of-financial-markets (accessed on 10 January 2023). |
| 2 | Quantlet: Preprocessing, Available online: https://github.com/QuantLet/BitcoinOptions/blob/master/main.py (accessed on 10 January 2023). |
| 3 | Quantlet: Volatility, Available online: https://github.com/QuantLet/BitcoinOptions/blob/master/src/vola.py (accessed on 10 January 2023). |
| 4 | Quantlet: IV Skew, Available online: https://github.com/QuantLet/BitcoinOptions/blob/master/src/vola_plots.py (accessed on 10 January 2023). |
| 5 | Quantlet: Main, Available online: https://github.com/QuantLet/BitcoinOptions/blob/master/main.py (accessed on 10 January 2023). |
| 6 | See note 5. |
| 7 | Quantlet: Main, available online: https://github.com/QuantLet/BitcoinOptions/blob/master/main.py (accessed on 10 January 2023). |
References
- Alexander, Carol, Jun Deng, Jianfen Feng, and Huning Wan. 2022. Net buying pressure and the information in bitcoin option trades. Journal of Financial Markets 63: 100764. [Google Scholar] [CrossRef]
- Alexander, Carol, and Arben Imeraj. 2021. Inverse options in a black-scholes world. arXiv. [Google Scholar] [CrossRef]
- Aloosh, Arash, and Jiasun Li. 2019. Direct evidence of bitcoin wash trading. Theory of Probability & Its Applications 5: 285–301. [Google Scholar] [CrossRef]
- Aït-Sahalia, Yacine, and Andrew W. Lo. 1998. Nonparametric estimation of state-price densities implicit in financial asset prices. The Journal of Finance 53: 499–547. [Google Scholar] [CrossRef]
- Aït-Sahalia, Yacine, Yubo Wang, and Francis Yared. 2001. Do option markets correctly price the probabilities of movement of the underlying asset? Journal of Econometrics 102: 67–110. [Google Scholar] [CrossRef]
- Bitwise Asset Management. 2019. Securities and Exchange Commission File No. SR-NYSEArca-2019-01. Available online: https://www.sec.gov/comments/sr-nysearca-2019-01/srnysearca201901-6135582-192240.pdf (accessed on 10 January 2023).
- Blaskowitz, Oliver, Wolfgang Karl Härdle, and Péter Schmidt. 2004. Skewness and Kurtosis Trades. In Handbook of Computational and Numerical Methods in Finance. New York: Springer Science+Business Media, pp. 1–14. [Google Scholar] [CrossRef]
- Blau, Benjamin M. 2017. Price dynamics and speculative trading in bitcoin. Research in International Business and Finance 41: 493–99. [Google Scholar] [CrossRef]
- Bloomberg. 2021. Retail traders slide back below 20% of market’s total volume. Available online: https://www.bloomberg.com/news/articles/2021-11-17/retail-traders-retreat-as-choppy-markets-challenge-easy-profits (accessed on 24 August 2021).
- Breeden, Douglas T., and Robert H. Litzenberger. 1978. Prices of state-contingent claims implicit in option prices. The Journal of Business 51: 621–51. [Google Scholar] [CrossRef]
- Chen, Cathy Yi-Hsuan, and Dmitri Vinogradov. 2021. Coins with Benefits: On Existence, Pricing Kernel and Risk Premium of Cryptocurrencies. Available online: http://dx.doi.org/10.2139/ssrn.3864578 (accessed on 24 April 2023).
- Choi, Sangyup, and Junhyeok Shin. 2022. Bitcoin: An inflation hedge but not a safe haven. Finance Research Letters 46: 102379. [Google Scholar] [CrossRef] [PubMed]
- Christoffersen, Peter, Kris Jacobs, and Xuhui (Nick) Pan. 2021. The State Price Density Implied by Crude Oil Futures and Option Prices. The Review of Financial Studies 35: 1064–103. [Google Scholar] [CrossRef]
- Coinbase, Cryptonews, and Simon Chandler. 2022. Institutions & Retail Compete for Bitcoin—Whose Hands are Stronger? Available online: https://cryptonews.com/exclusives/institutions-retail-compete-for-bitcoin-which-is-the-biggest-9695.htm (accessed on 22 March 2022).
- Cong, Lin, Xi Li, Ke Tang, and Yang Yang. 2019. Crypto wash trading. Papers 2108.10984, arXiv.org. Available online: https://doi.org/10.2139/ssrn.3530220 (accessed on 22 March 2022).
- Cuesdeanu, Horatio, and Jens Carsten Jackwerth. 2018. The pricing kernel puzzle: Survey and outlook. Annals of Finance 14: 289–329. [Google Scholar] [CrossRef]
- Deng, Qing. 2020. Application analysis on blockchain technology in cross-border payment. Paper presented at the 5th International Conference on Financial Innovation and Economic Development (ICFIED 2020), Sanya, China, January 10–12. [Google Scholar]
- Deribit. 2020a. Deribit btc-usd index. Available online: https://www.deribit.com/main#/indexes (accessed on 2 January 2022).
- Deribit. 2020b. Deribit insurance fund. Available online: https://www.deribit.com/main#/insurance (accessed on 4 January 2022).
- Deribit. 2020c. Deribit market maker obligations. Available online: https://www.deribit.com/pages/docs/options (accessed on 2 January 2022).
- Deribit. 2022a. Deribit Margin Requirements. Available online: https://www.deribit.com/kb/portfolio-margin (accessed on 12 February 2022).
- Deribit. 2022b. Deribit Margin Requirements. Available online: https://www.deribit.com/kb/options (accessed on 12 February 2022).
- Deribit. 2022c. Deribit Fees. Available online: https://www.deribit.com/pages/information/fees (accessed on 12 February 2022).
- Deribit. 2022d. Deribit volume share. Available online: https://www.deribit.com/statistics/BTC/market-data (accessed on 25 July 2022).
- Deribit. 2023. Deribit rate Limits. Available online: https://www.deribit.com/kb/deribit-rate-limits (accessed on 16 April 2021).
- Eraker, Bjorn. 2021. The volatility premium. Quarterly Journal of Finance (QJF) 11: 2150014. [Google Scholar] [CrossRef]
- The Stellar Development Foundation. 2022. 2022 Research Reveals High Awareness and Growing Cross-Border Use of Cryptocurrency in Four Key Markets. Available online: https://www.prnewswire.com/news-releases/2022-research-reveals-high-awareness-and-growing-cross-border-use-of-cryptocurrency-in-four-key-markets-301512401.html (accessed on 22 July 2022).
- Gandal, Neil, and Hanna Halaburda. 2016. Can we predict the winner in a market with network effects? competition in cryptocurrency market. Games 7: 16. [Google Scholar] [CrossRef]
- Grith, Maria, Wolfgang Karl Härdle, and Juhyun Park. 2009. Shape invariant modelling pricing kernels and risk aversion. Journal of Financial Econometrics 11: 370–99. [Google Scholar] [CrossRef]
- Hall, Peter. 1991. Edgeworth expansions for nonparametric density estimators, with applications. Statistics 22: 215–32. [Google Scholar] [CrossRef]
- Hayes, Adam S. 2019. Bitcoin price and its marginal cost of production: Support for a fundamental value. Applied Economics Letters 26: 554–60. [Google Scholar] [CrossRef]
- Hou, Ai Jun, Weining Wang, Cathy Y H Chen, and Wolfgang Karl Härdle. 2020. Pricing Cryptocurrency Options. Journal of Financial Econometrics 18: 250–79. [Google Scholar] [CrossRef]
- Huynh, Kim, Pierre Kervella, and Jun Zheng. 2002. Estimating State-Price Densities with Nonparametric Regression. SFB 373 Discussion Papers 2002,40, Humboldt University of Berlin, Interdisciplinary Research Project 373: Quantification and Simulation of Economic Processes. Applied Quantitative Finance. Heidelberg: Springer. [Google Scholar] [CrossRef]
- Härdle, Wolfgang Karl, Yarema Okhrin, and Weining Wang. 2014. Uniform Confidence Bands for Pricing Kernels. Journal of Financial Econometrics 13: 376–413. [Google Scholar] [CrossRef]
- La Morgia, Massimo, Alessandro Mei, Francesco Sassi, and Julinda Stefa. 2020. Pump and dumps in the bitcoin era: Real time detection of cryptocurrency market manipulations. Paper presented at the 2020 29th International Conference on Computer Communications and Networks (ICCCN), Honolulu, HI, USA, August 3–6; pp. 1–9. [Google Scholar] [CrossRef]
- Masset, Philippe. 2011. Volatility stylized facts. SSRN Electronic Journal. Available online: https://doi.org/10.2139/ssrn.1804070 (accessed on 22 July 2022).
- Nakamoto, Satoshi. 2009. Bitcoin: A Peer-to-Peer Electronic Cash System. Available online: https://bitcoin.org/bitcoin.pdf (accessed on 22 July 2022).
- Pascucci, Andrea, and R. Agliardi. 2011. PDE and Martingale Methods in Option Pricing. New York: Springer Science & Business Media, pp. 429–495. [Google Scholar]
- Rookley, Cameron. 1997. Fully Exploiting the Information Content of Intra Day Option Quotes: Applications in Option Pricing and Risk Management. Available online: https://citeseerx.ist.psu.edu/document?repid=rep1&type=pdf&doi=b92f641d43de7441cc5cc41aa0e24d2c57a4e247 (accessed on 15 April 2023).
- Rodgers, T. 2019. 95 Percent of Volume Could Be Wash Trading as Bitcoin Price Surges. Available online: https://www.forbes.com/sites/tomrodgers1/2019/04/04/99-of-volume-could-be-wash-trading-as-bitcoin-takes-back-5000/?sh=4640bcbc23d5 (accessed on 15 April 2023).
- Sar, Meric. 2017. Dodd-Frank and the Spoofing Prohibition in Commodities Markets. Fordham Journal of Corporate & Financial Law. Available online: https://ir.lawnet.fordham.edu/jcfl/vol22/iss3/3/ (accessed on 14 February 2023).
- Skew. 2022. Open Interest for Bitcoin Options over Time. Available online: https://analytics.skew.com/dashboard/bitcoin-options (accessed on 25 July 2022).
- Smaniotto, Emanuelle Nava, and Giacomo Balbinotto Neto. 2022. Speculative trading in bitcoin: A brazilian market evidence. The Quarterly Review of Economics and Finance 85: 47–54. [Google Scholar] [CrossRef]
- Szabo, Nick. 2008. Bit Gold. Available online: https://unenumerated.blogspot.com/2005/12/bit-gold.html (accessed on 28 July 2022).
- Tuccella, Jean-Noël, Philip Nadler, and Ovidiu Şerban. 2021. Protecting retail investors from order book spoofing using a gru-based detection model. arXiv arXiv:2110.03687. [Google Scholar]
Figure 1.
Open Interest in BTC Options per Exchange. Snapshot from skew.com on 2022-01-16. Deribit, LedgerX, CME, bit.com.
Figure 1.
Open Interest in BTC Options per Exchange. Snapshot from skew.com on 2022-01-16. Deribit, LedgerX, CME, bit.com.
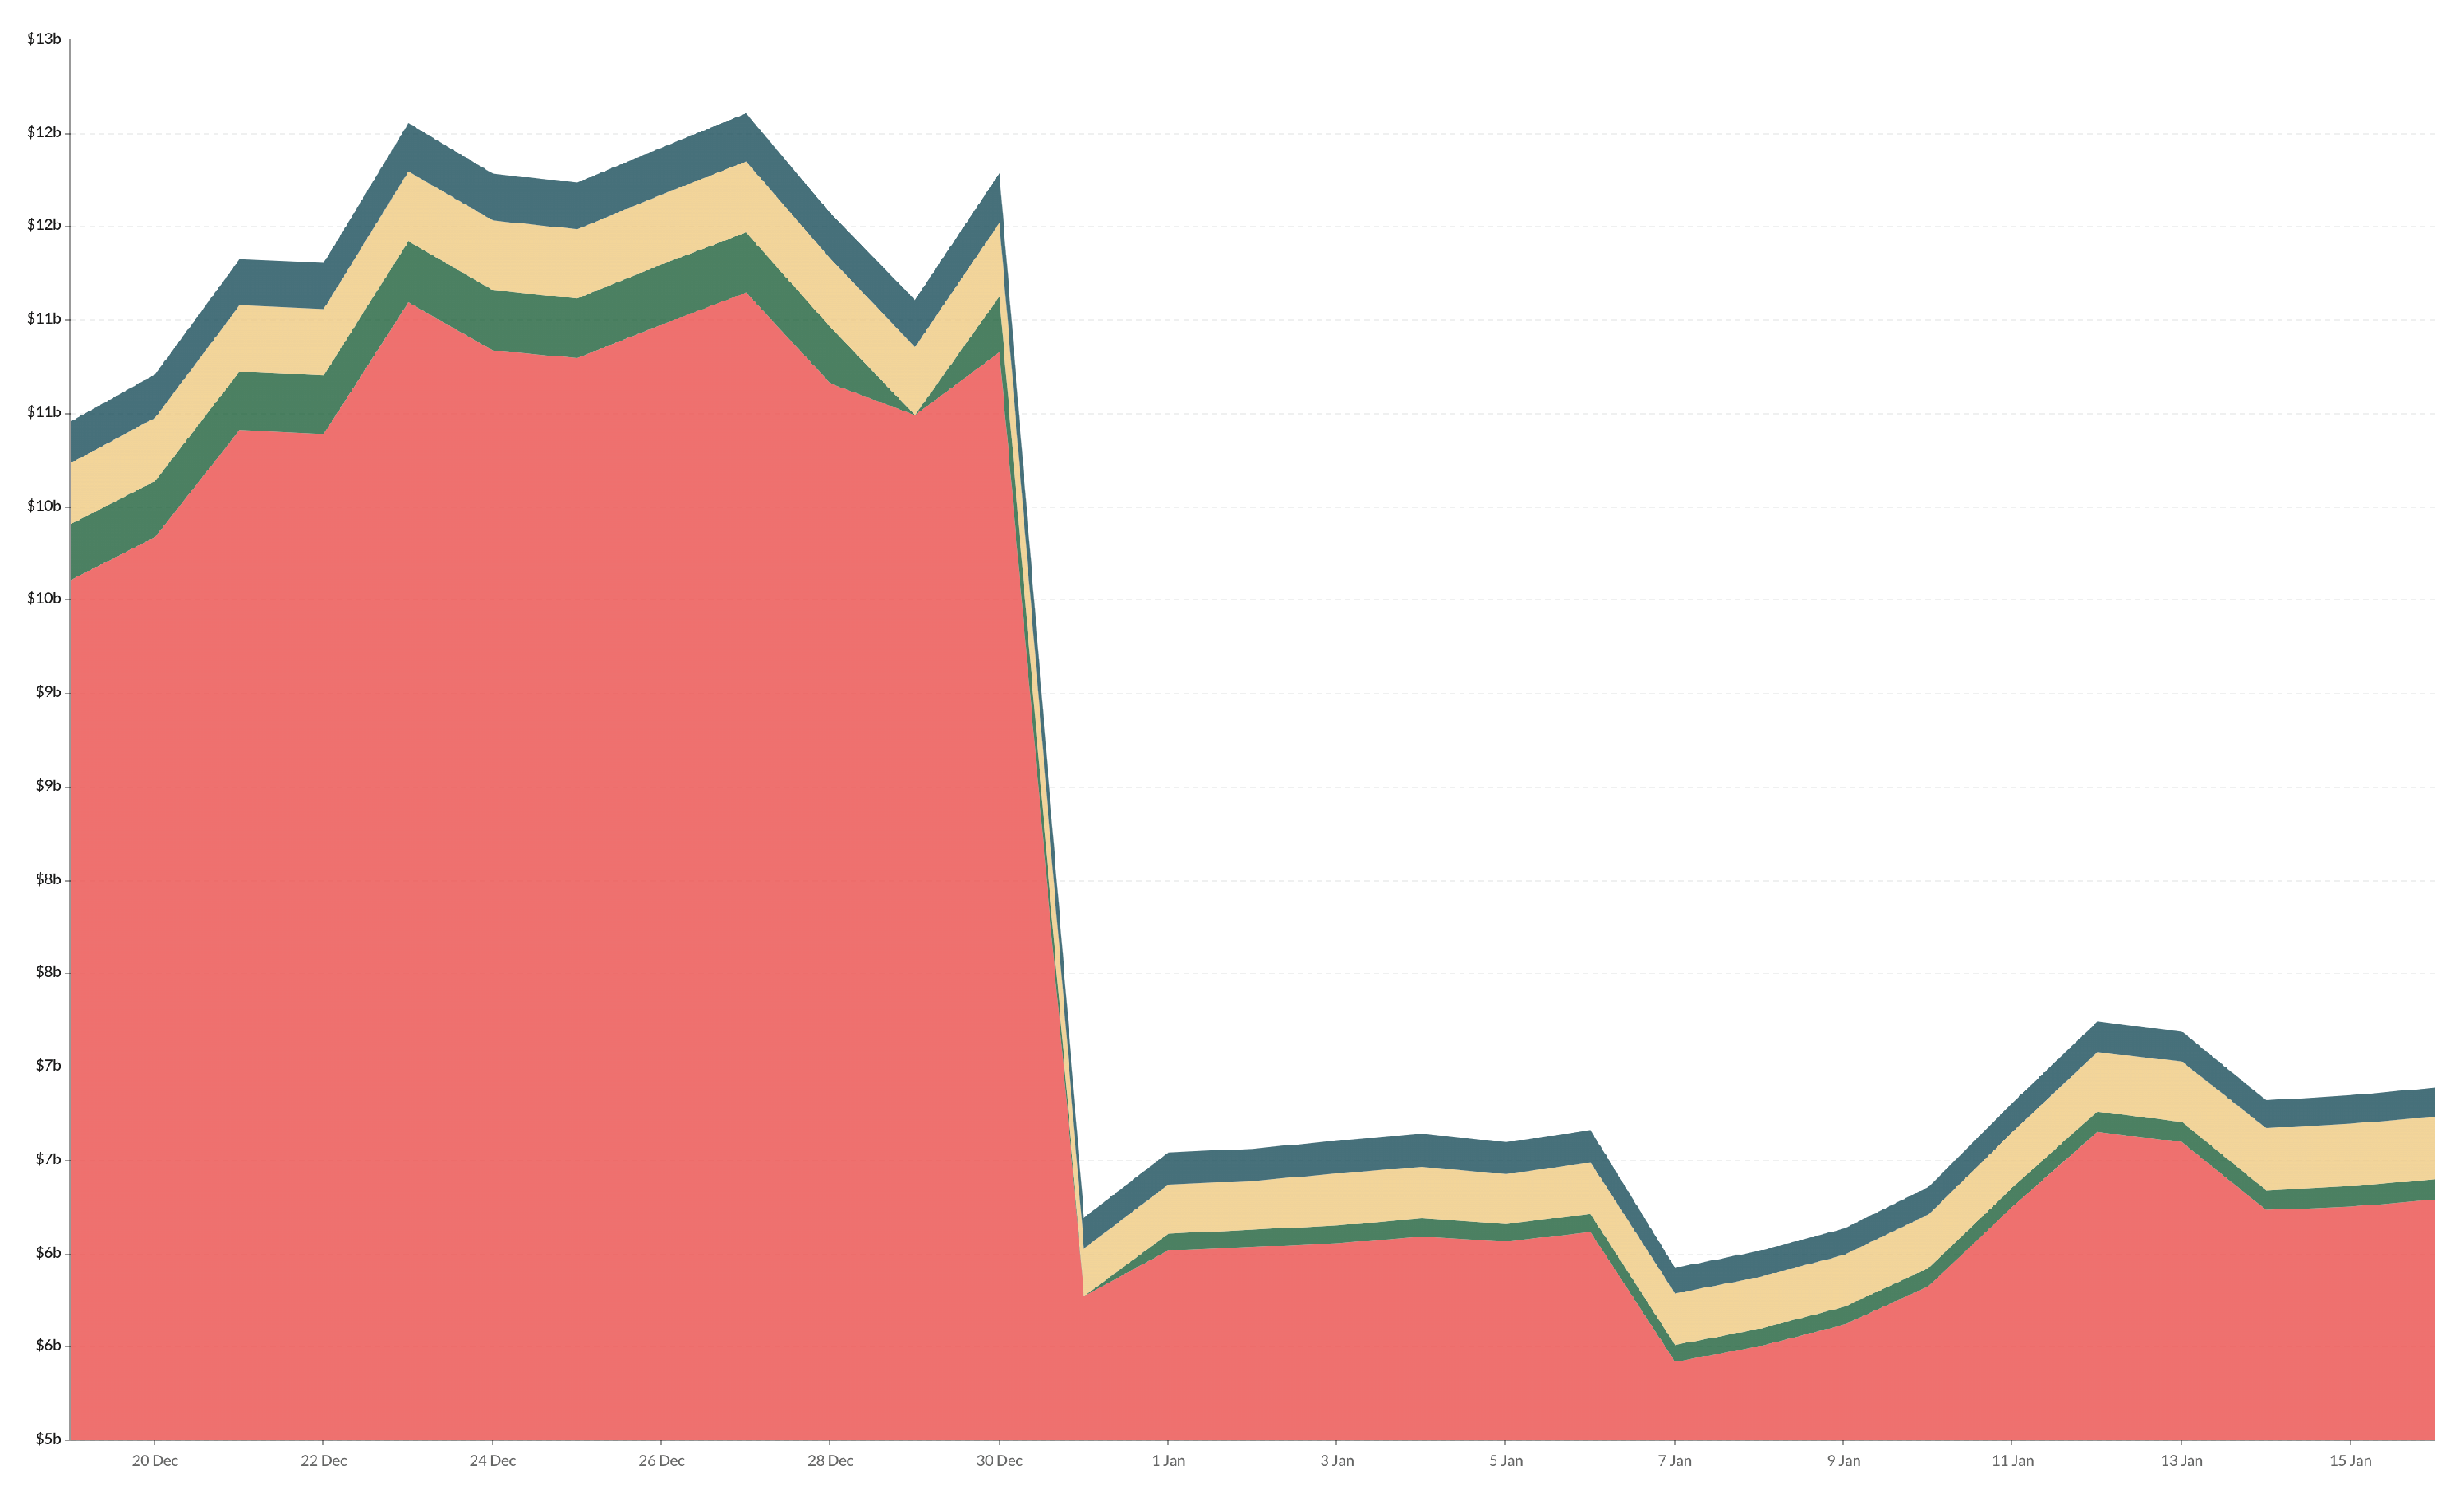
Figure 2.
Implied volatility vs. realized volatility. Realized volatility is annualized and regarded in a 7-day window. IV is calculated as the average of observed order books at the bid and ask. Described data filters apply. Ask IV, Bid IV, 7 Day Rolling Volatility.
Figure 2.
Implied volatility vs. realized volatility. Realized volatility is annualized and regarded in a 7-day window. IV is calculated as the average of observed order books at the bid and ask. Described data filters apply. Ask IV, Bid IV, 7 Day Rolling Volatility.

Figure 3.
Volatility Skew shown in the empirical Volatility Surface on 2021-05-23.
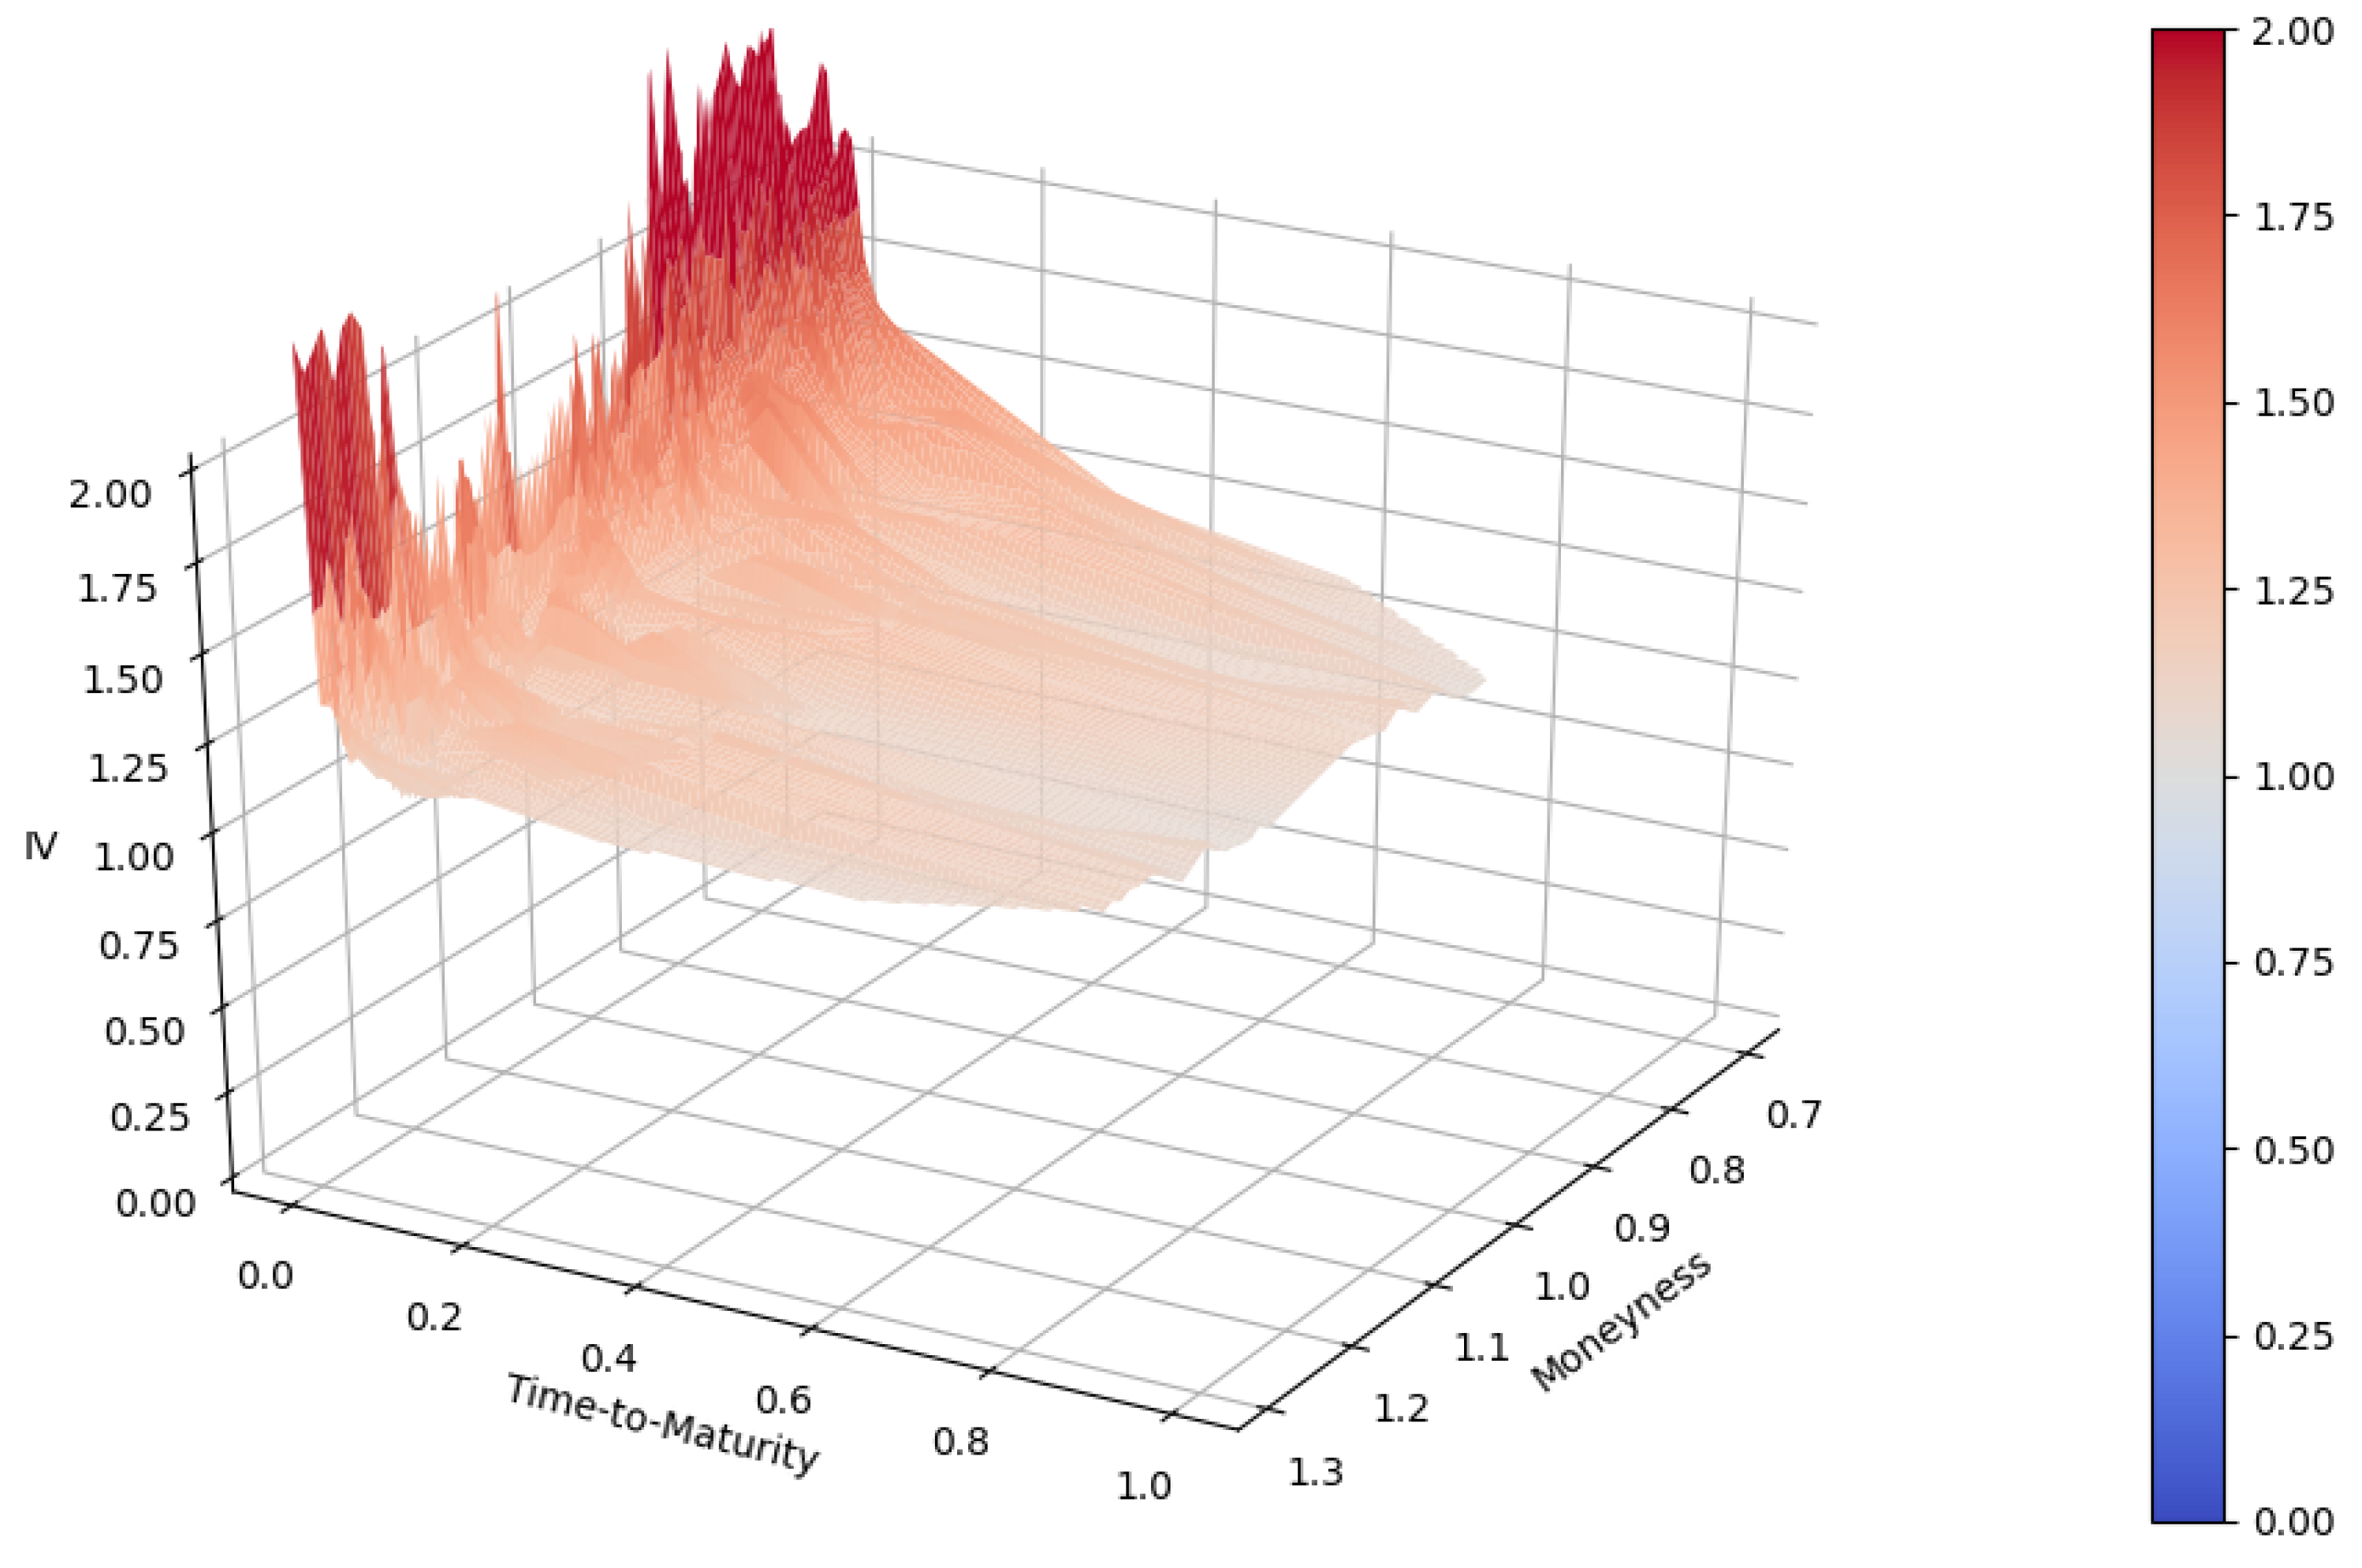
Figure 4.
Volatility Skew shown in a calmer period on 2021-09-08.

Figure 5.
ATM Term Structure from 2022 to 01-01 until 2022-01-08. Moneyness .
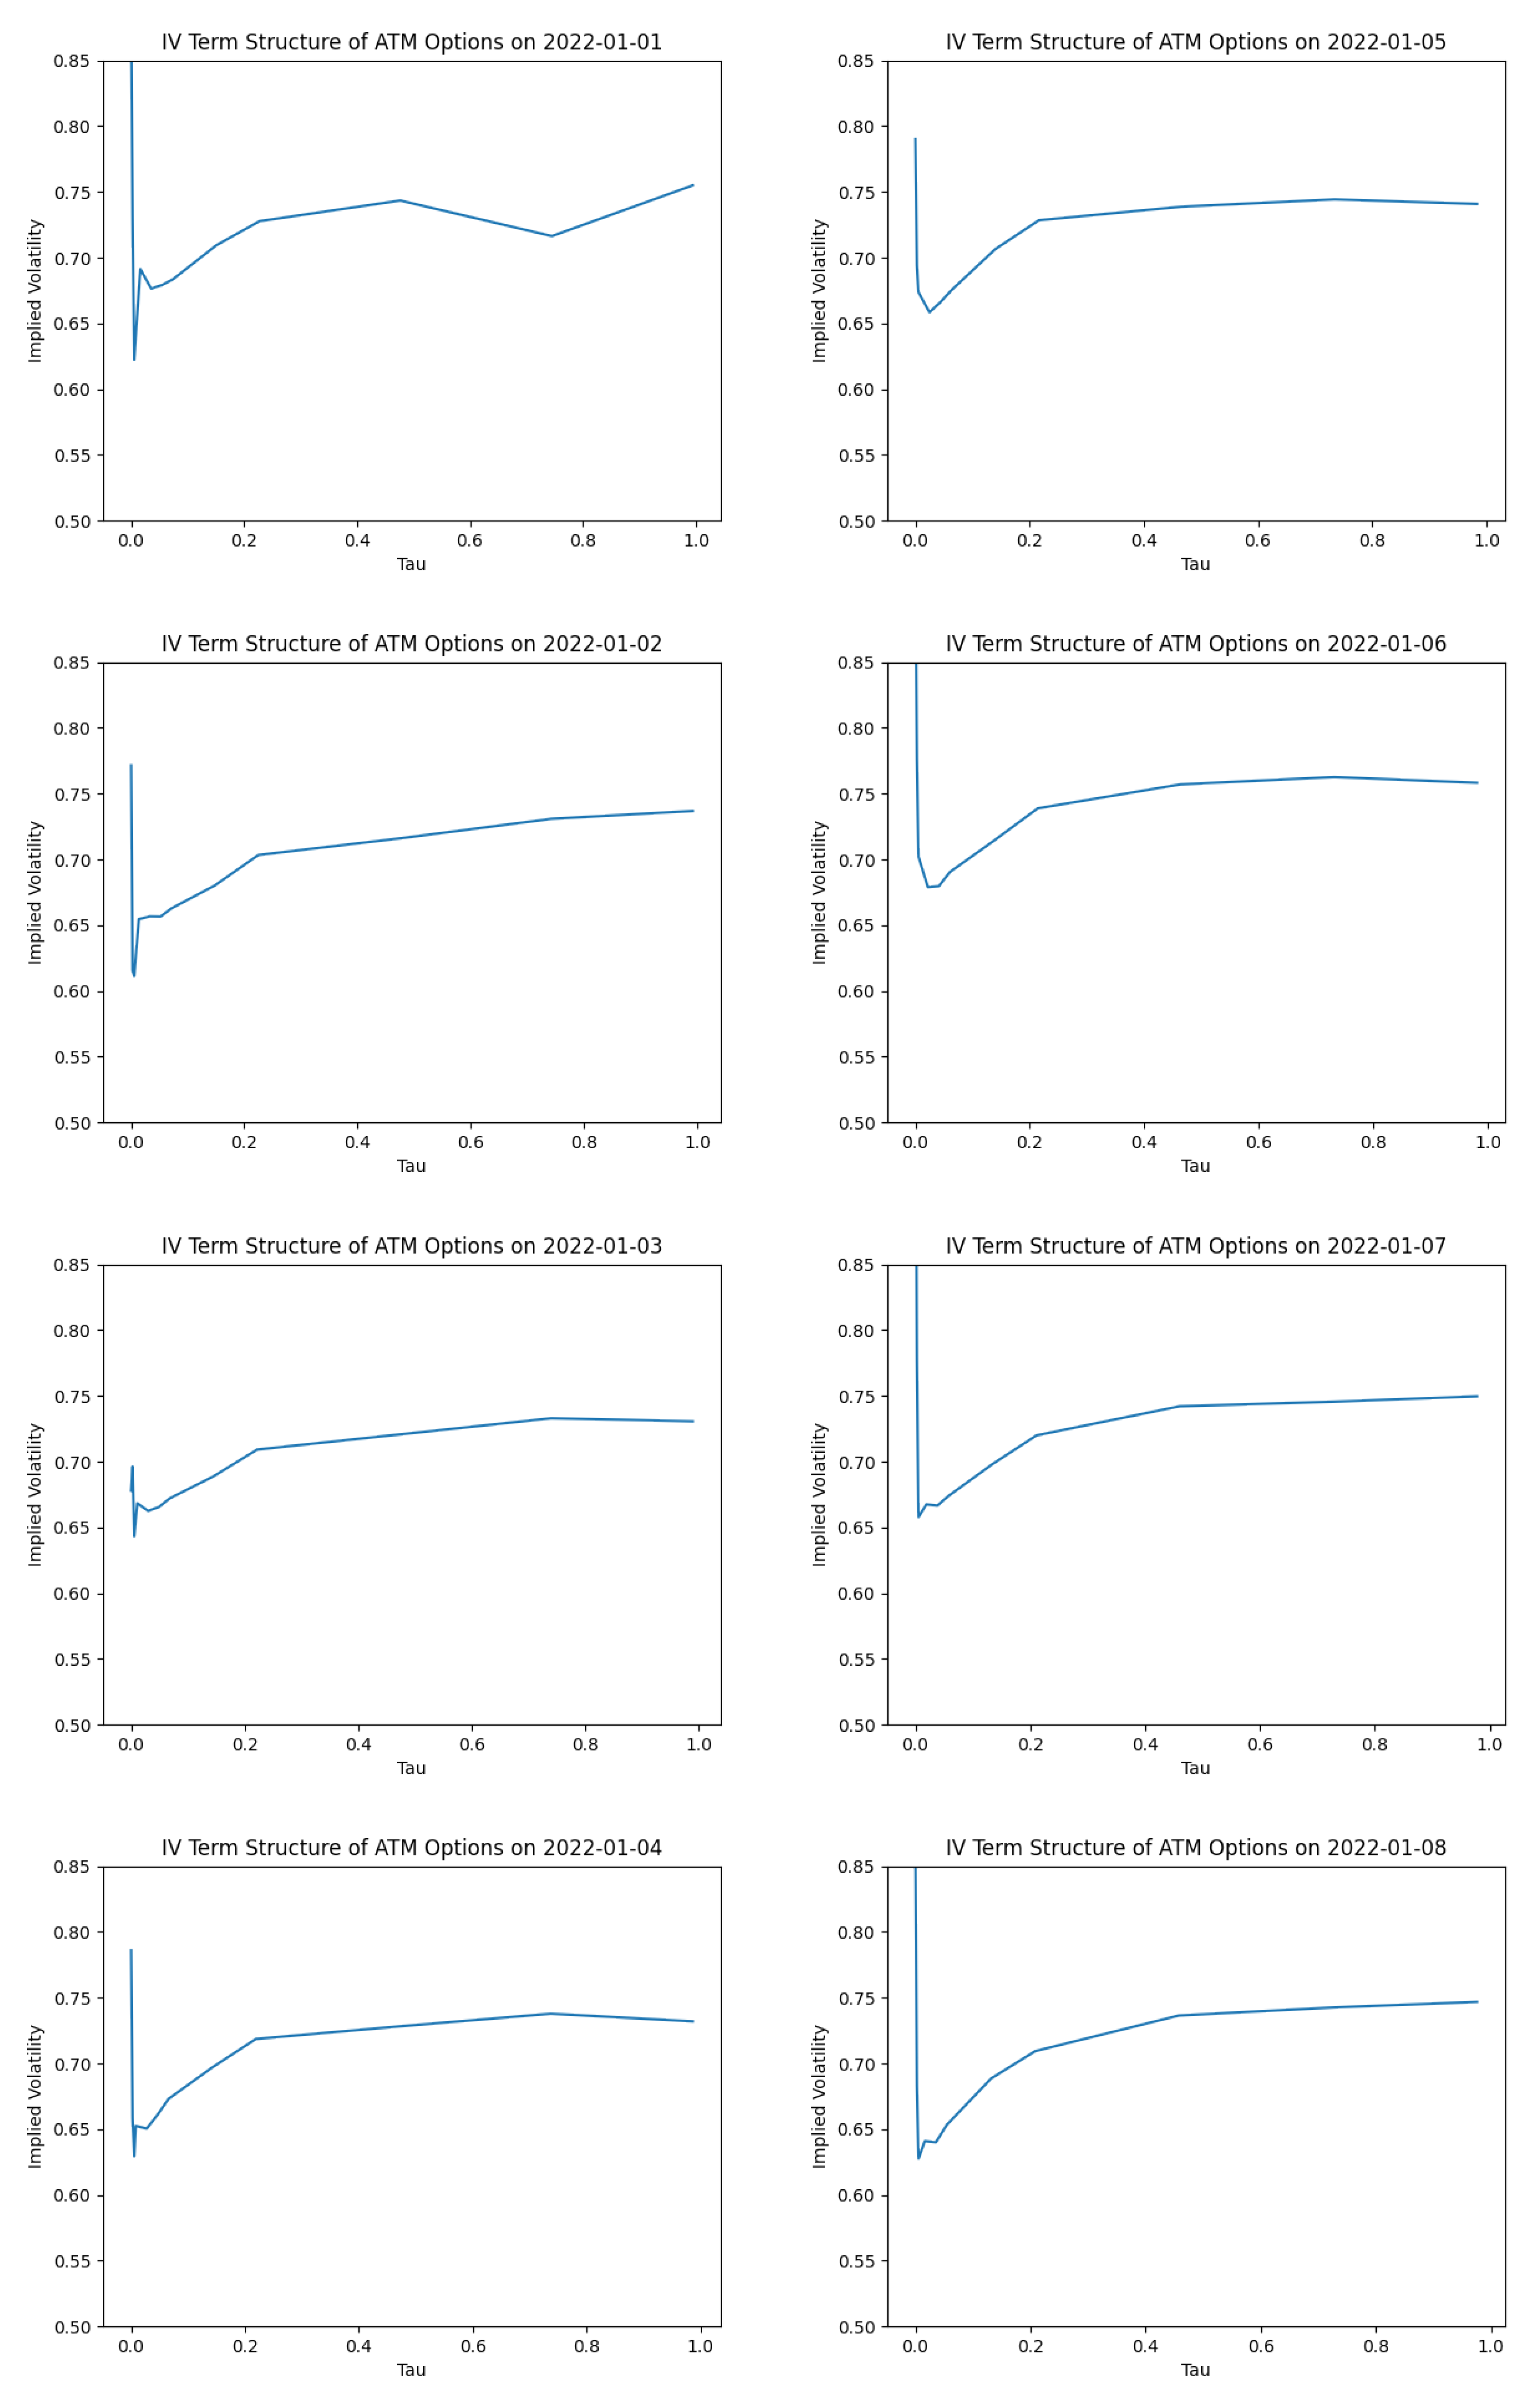
Figure 6.
Pricing Kernels with less than one Week to Expiration.

Figure 7.
Empirical Pricing Kernel—1 Week to Expiration.
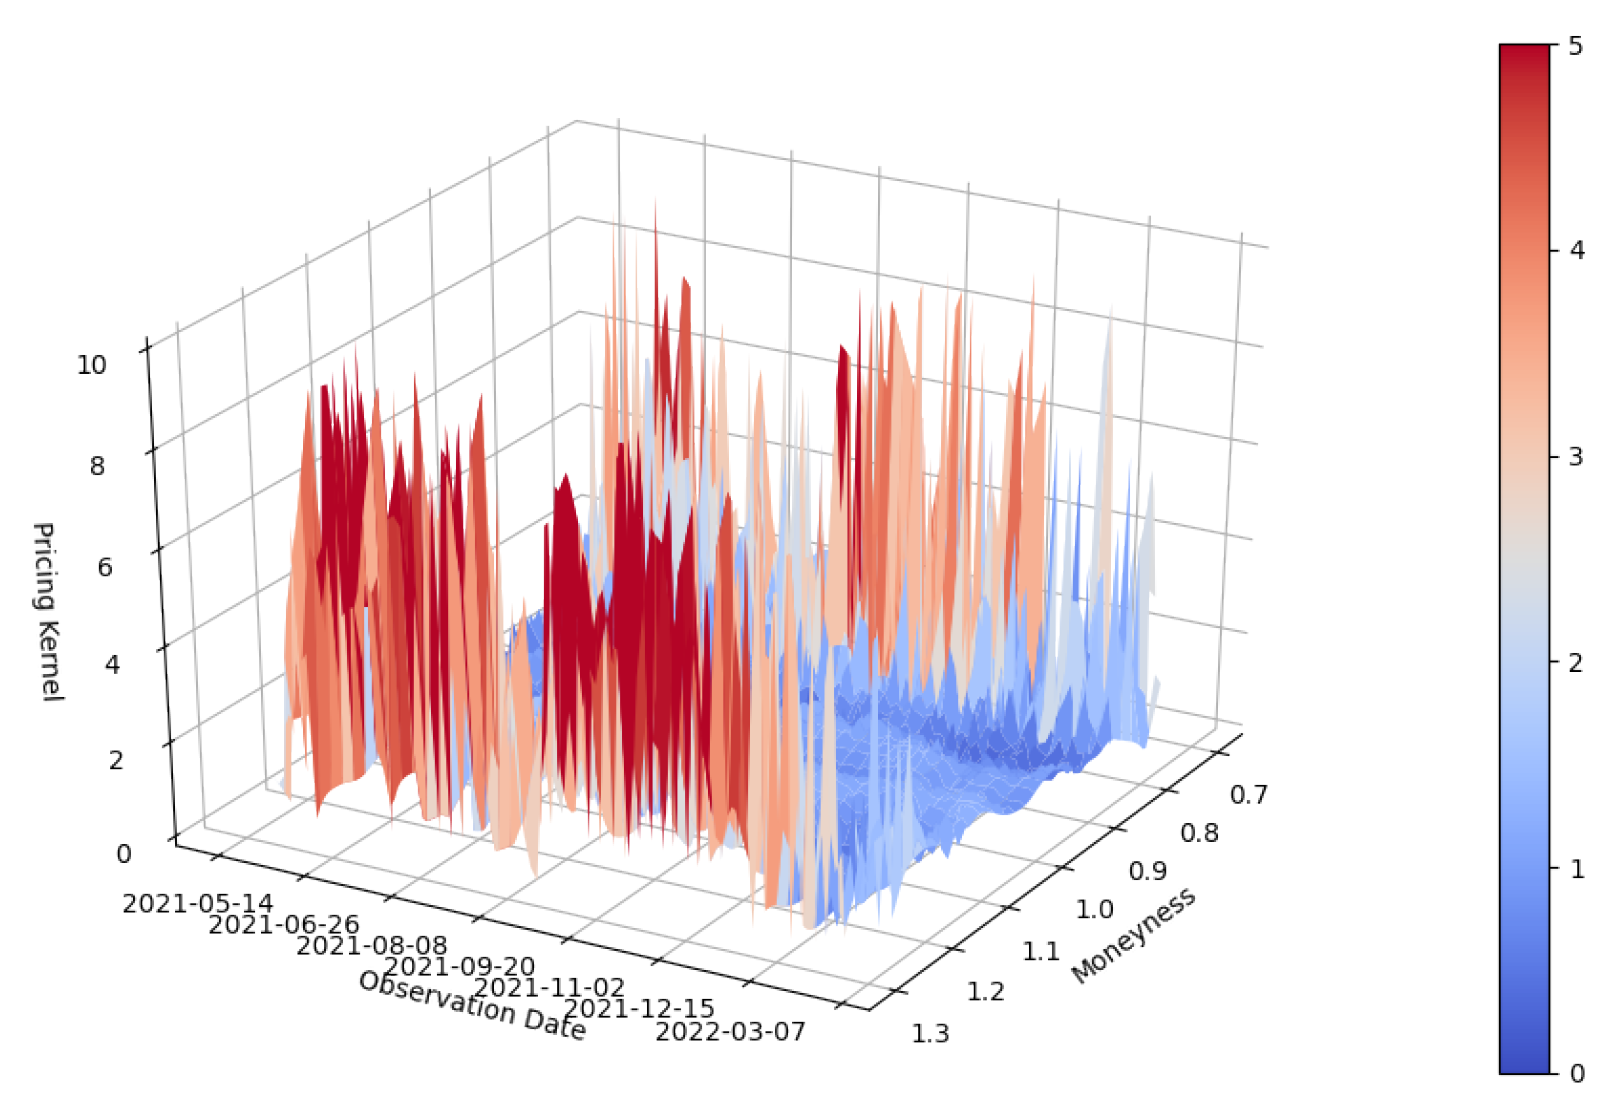
Figure 8.
Empirical Pricing Kernel—2 Weeks to Expiration.
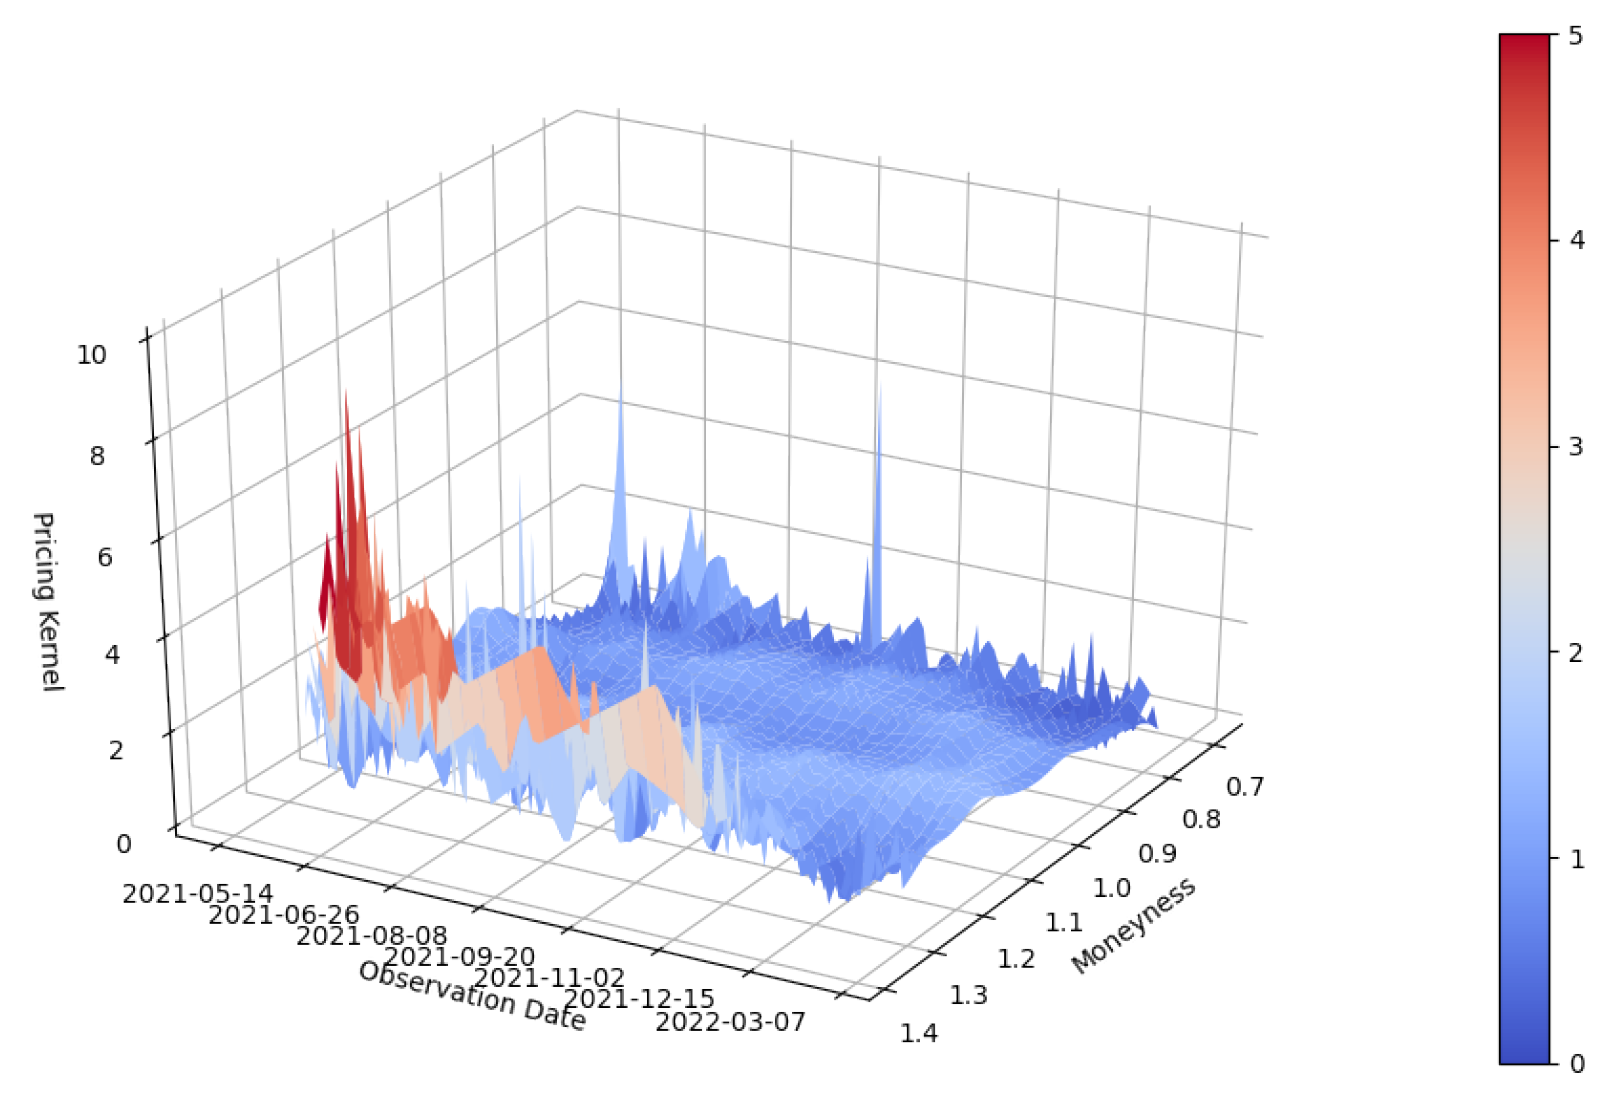
Figure 9.
Empirical Pricing Kernel—3 Weeks to Expiration.

Figure 10.
Empirical Pricing Kernel—4 Weeks to Expiration.

Figure 11.
Empirical Pricing Kernel—5–8 Weeks to Expiration.
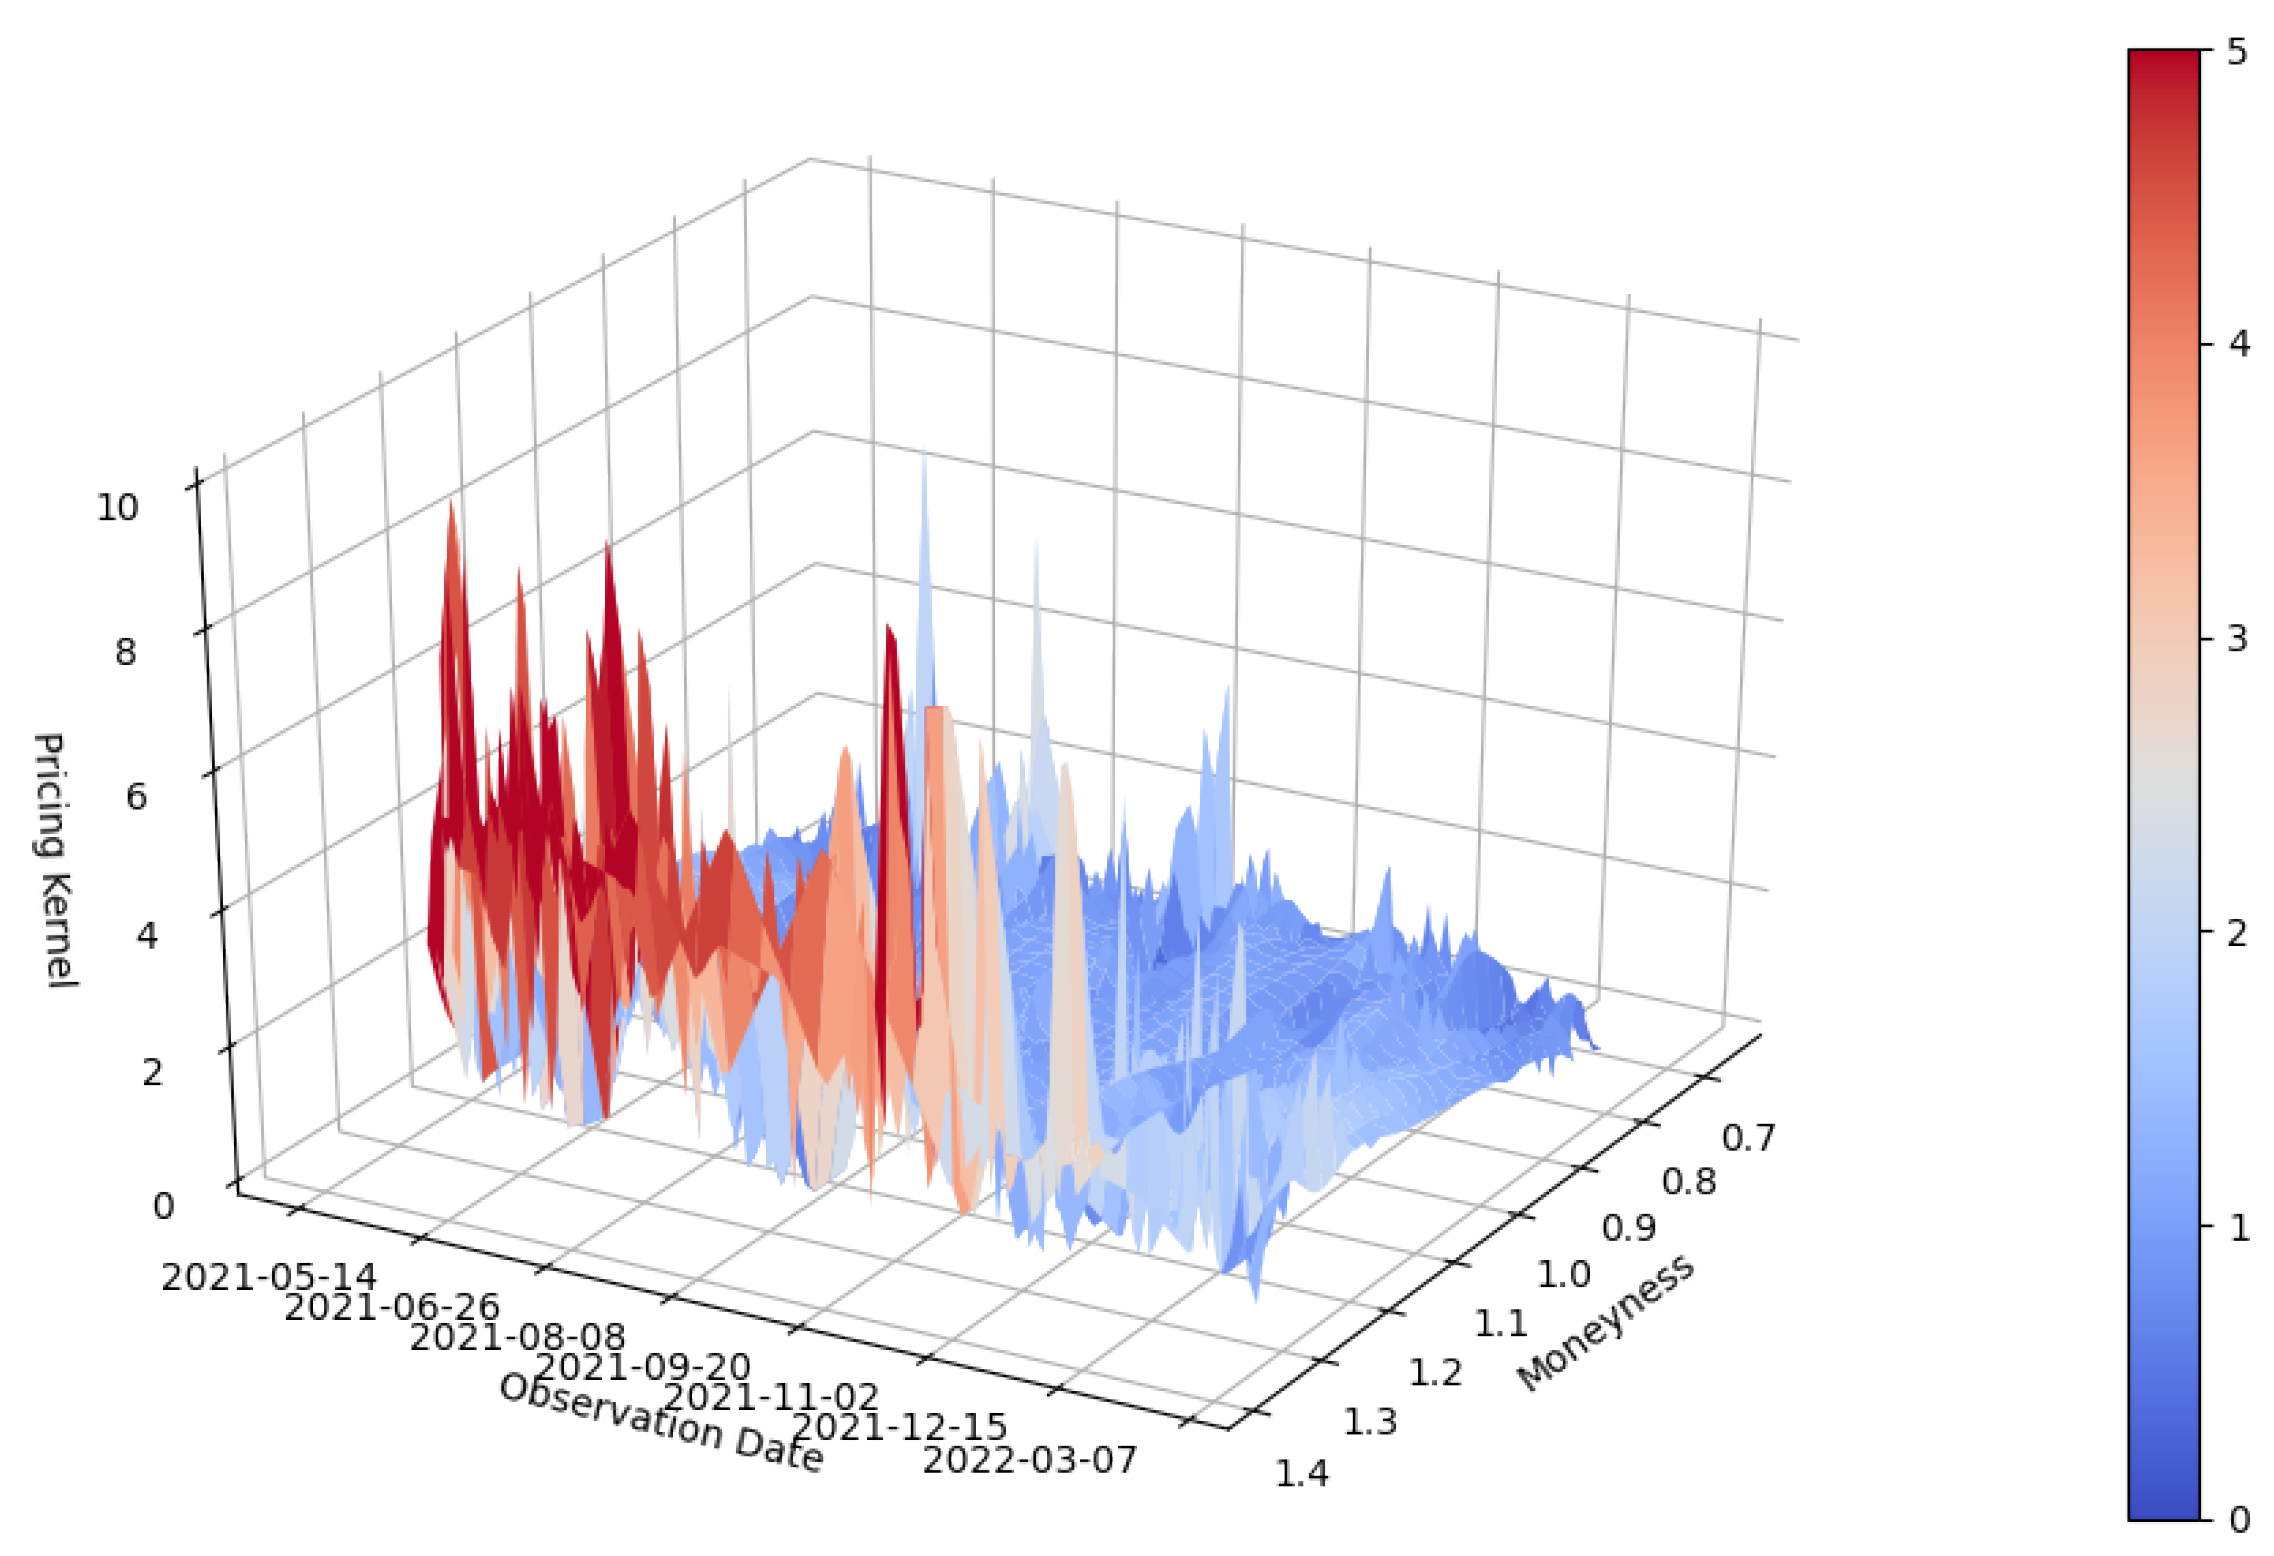
Figure 12.
2 Days to Maturity.
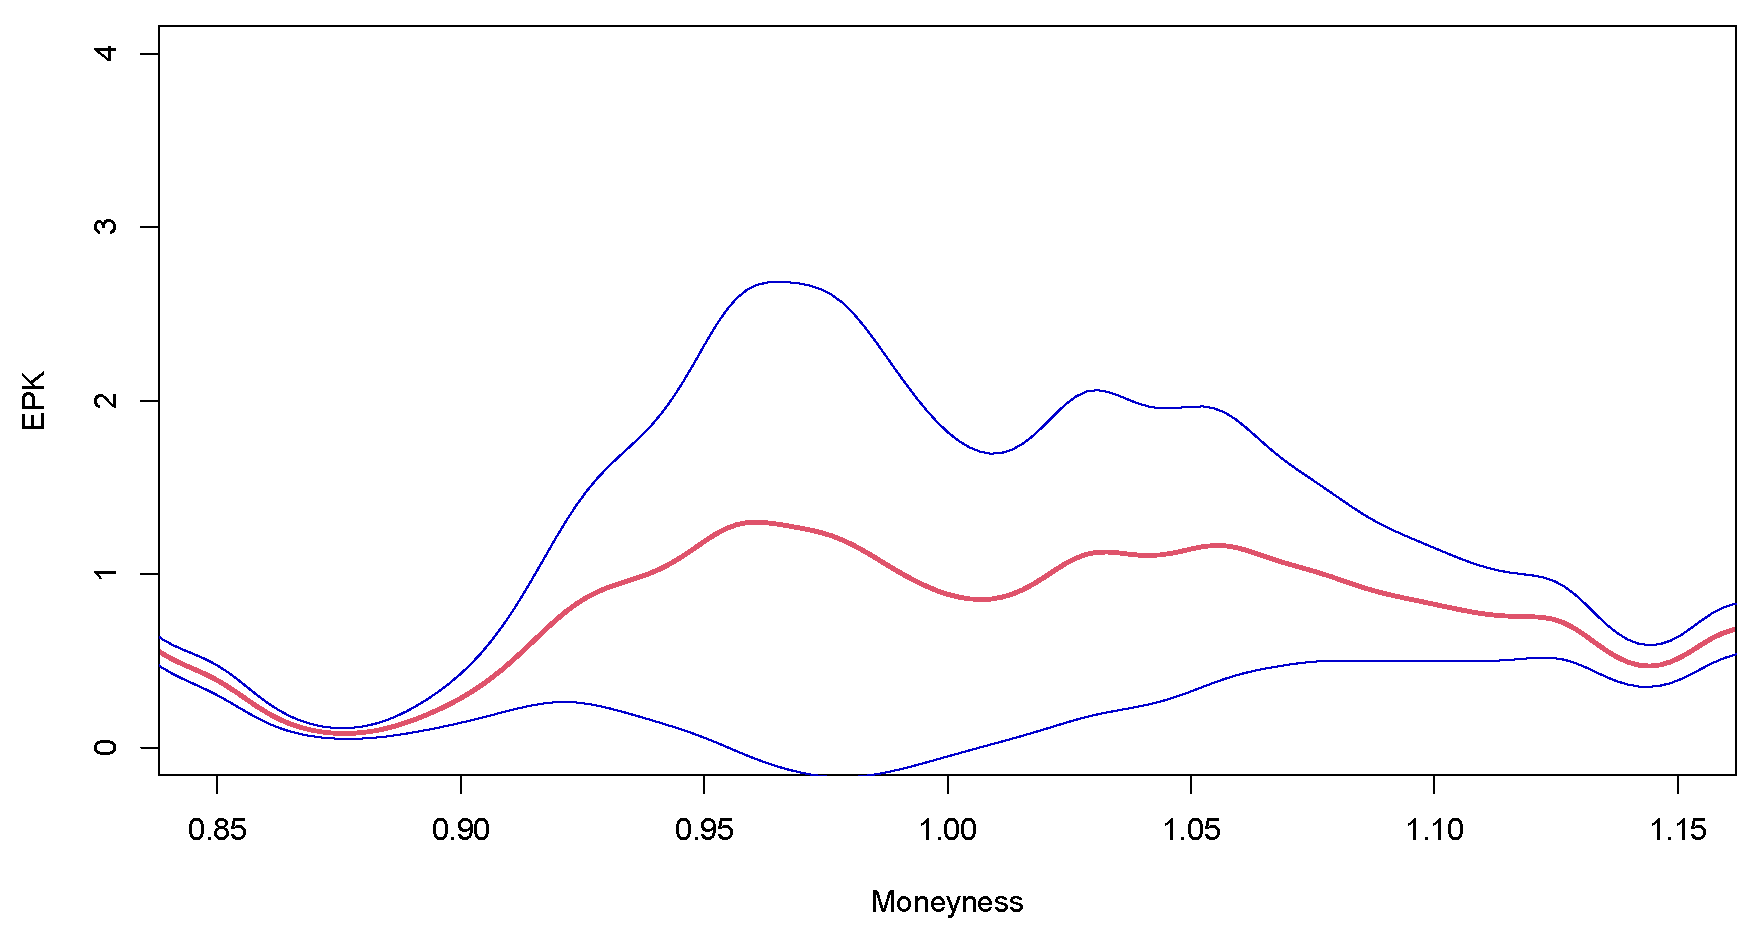
Figure 13.
7 Days to Maturity.
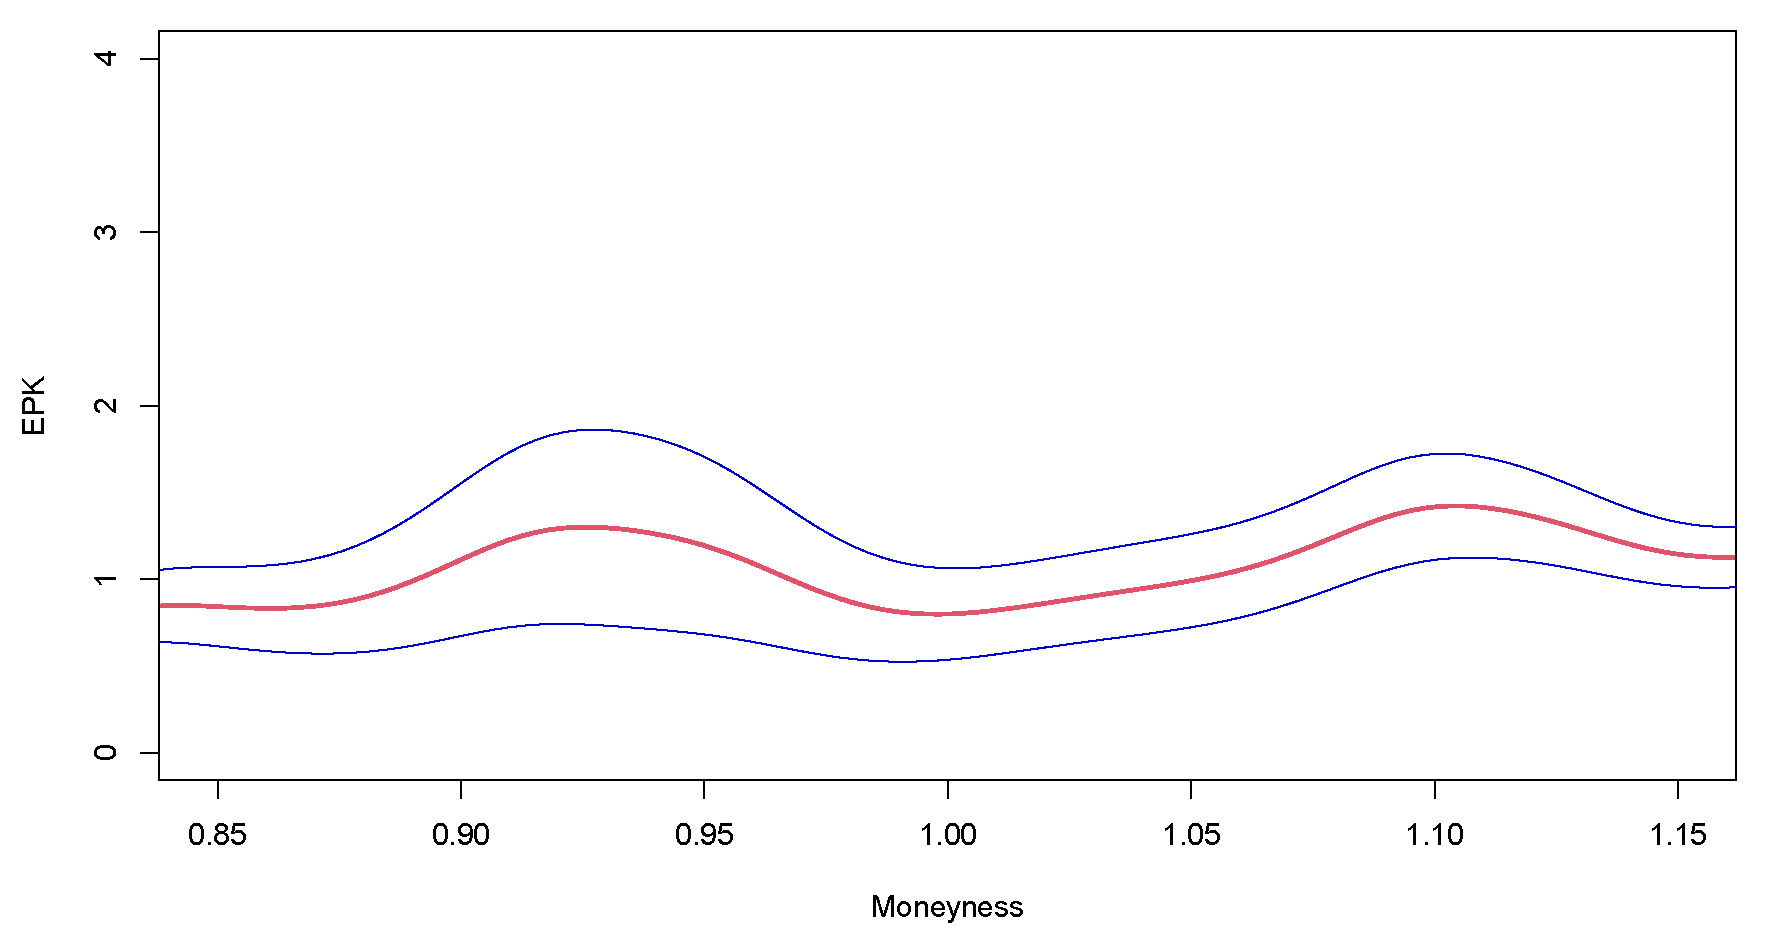
Figure 14.
14 Days to Maturity.

Figure 15.
21 Days to Maturity.

Figure 16.
28 Days to Maturity.
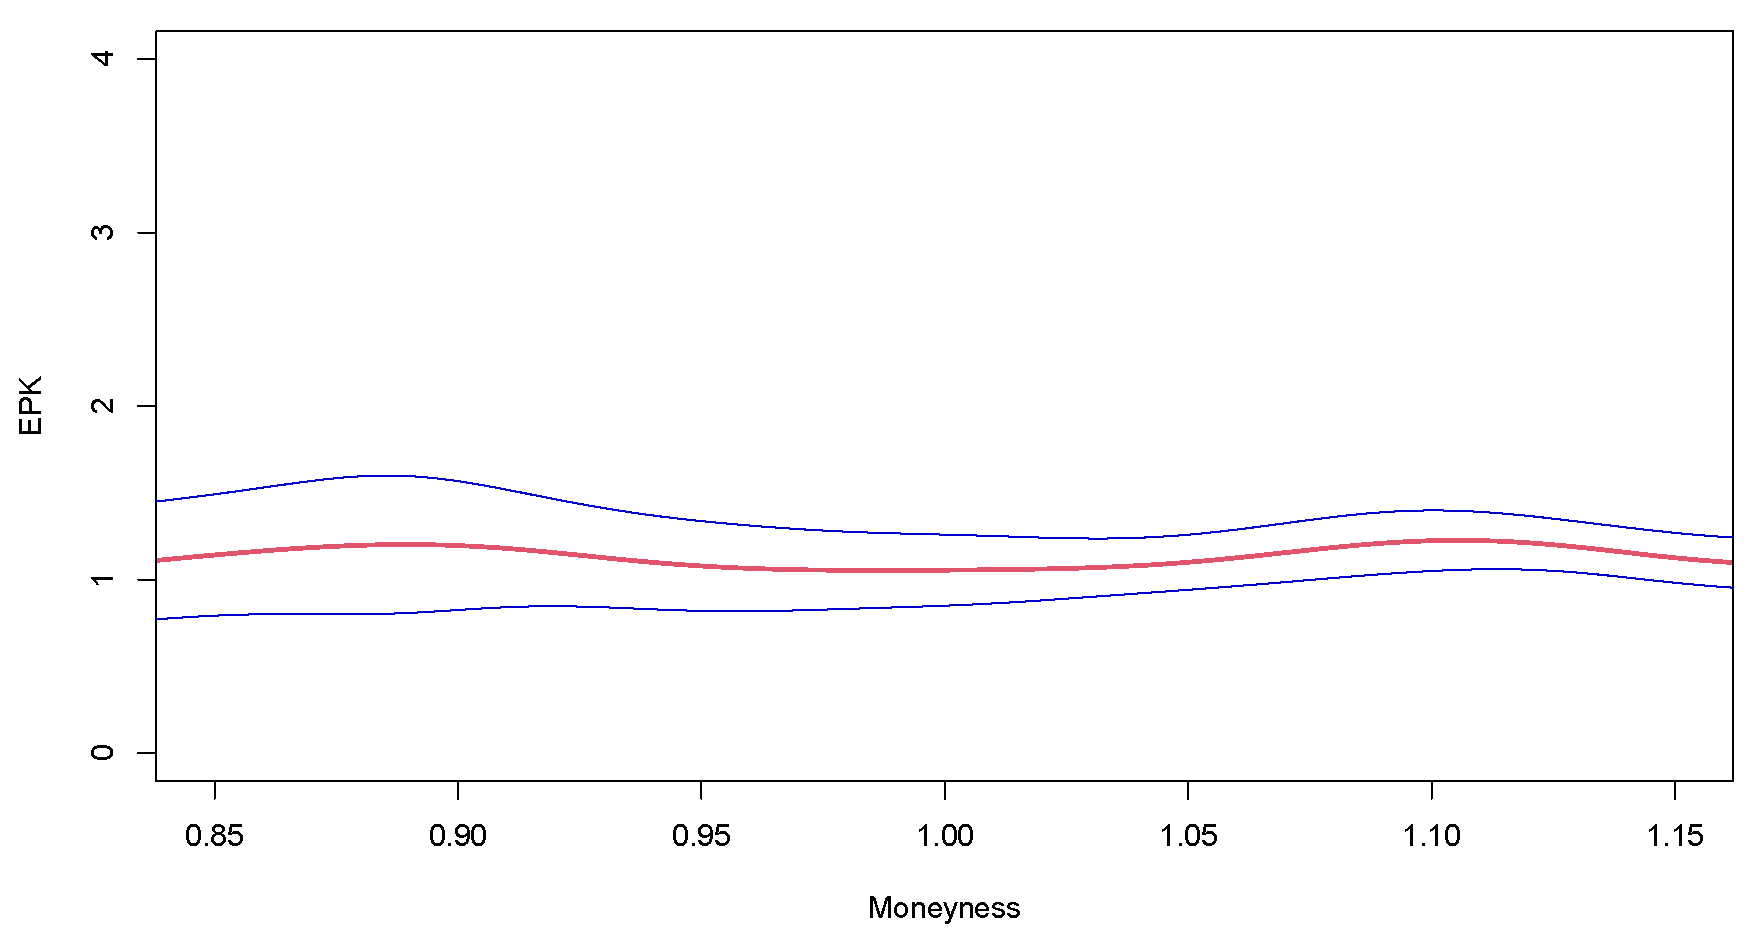
Figure 17.
56 Days to Maturity.
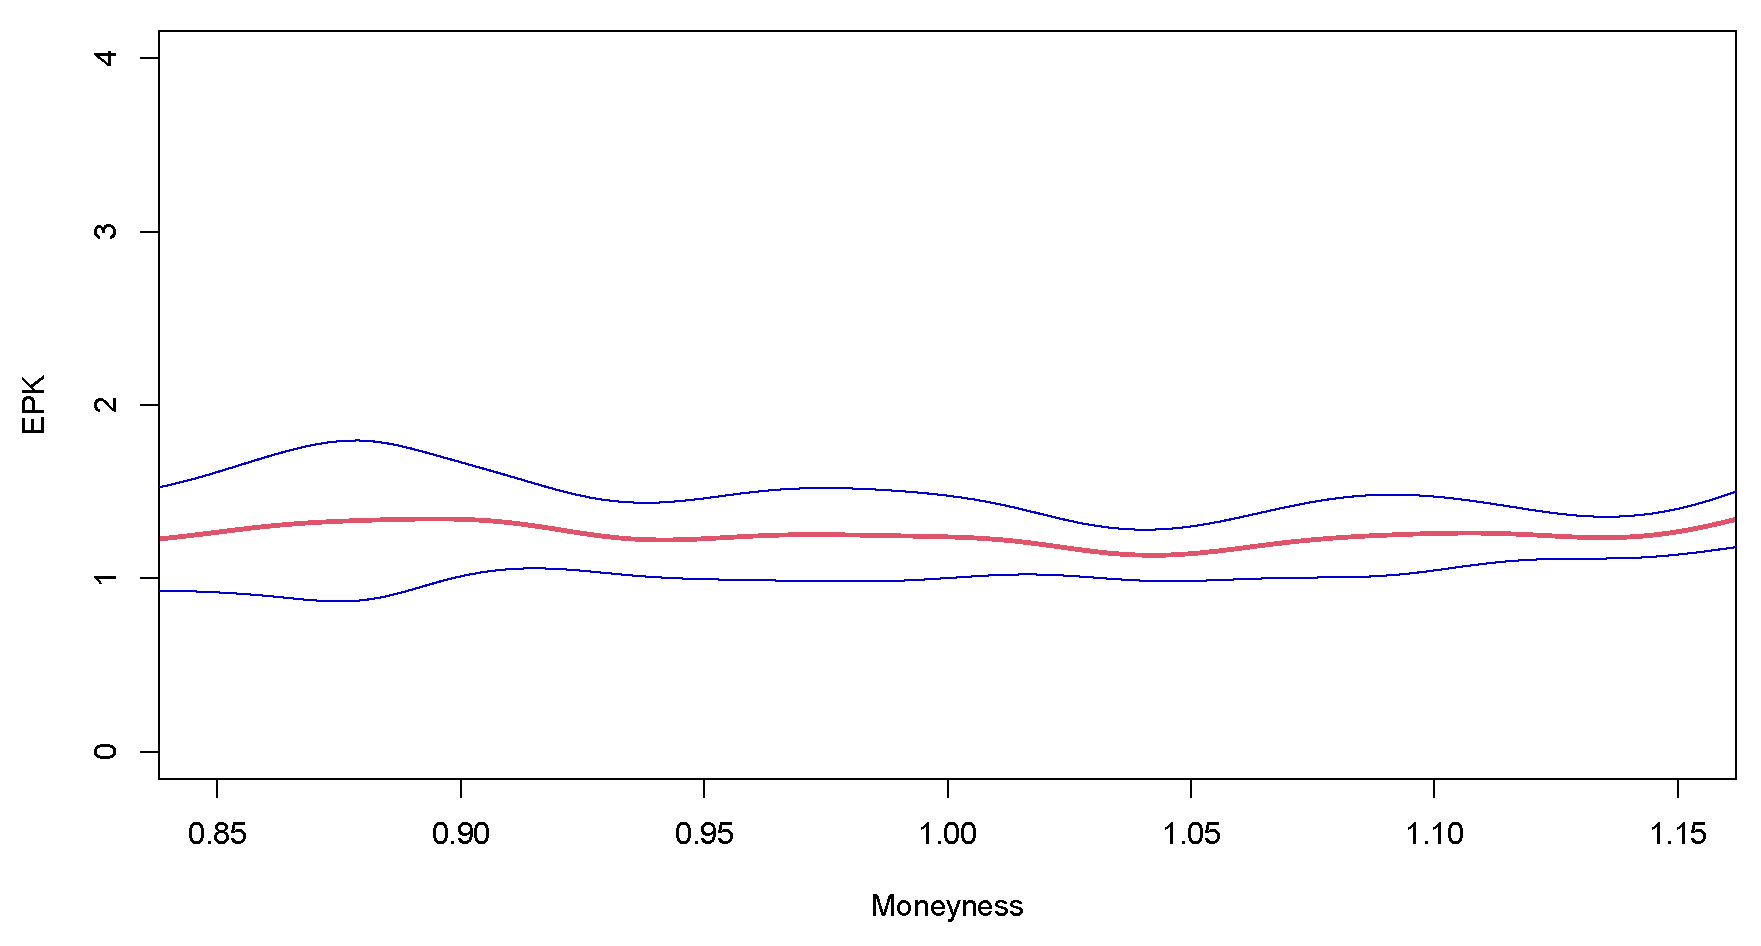
Figure 18.
84 Days to Maturity. Empirical Pricing Kernels with bootstrapped Confidence Bands on 2021-12-31.
Figure 18.
84 Days to Maturity. Empirical Pricing Kernels with bootstrapped Confidence Bands on 2021-12-31.
Disclaimer/Publisher’s Note: The statements, opinions and data contained in all publications are solely those of the individual author(s) and contributor(s) and not of MDPI and/or the editor(s). MDPI and/or the editor(s) disclaim responsibility for any injury to people or property resulting from any ideas, methods, instructions or products referred to in the content. |
© 2023 by the authors. Licensee MDPI, Basel, Switzerland. This article is an open access article distributed under the terms and conditions of the Creative Commons Attribution (CC BY) license (https://creativecommons.org/licenses/by/4.0/).
Share and Cite
MDPI and ACS Style
Winkel, J.; Härdle, W.K. Pricing Kernels and Risk Premia implied in Bitcoin Options. Risks 2023, 11, 85. https://doi.org/10.3390/risks11050085
AMA Style
Winkel J, Härdle WK. Pricing Kernels and Risk Premia implied in Bitcoin Options. Risks. 2023; 11(5):85. https://doi.org/10.3390/risks11050085
Chicago/Turabian StyleWinkel, Julian, and Wolfgang Karl Härdle. 2023. "Pricing Kernels and Risk Premia implied in Bitcoin Options" Risks 11, no. 5: 85. https://doi.org/10.3390/risks11050085
Note that from the first issue of 2016, this journal uses article numbers instead of page numbers. See further details here.