
Bonus-Malus Premiums Based on Claim Frequency and the Size of Claims
1
Department of Mathematics, Khon Kaen University, Khon Kaen 40002, Thailand
2
Department of Statistics, Khon Kaen University, Khon Kaen 40002, Thailand
*
Author to whom correspondence should be addressed.
Risks 2022, 10(9), 181; https://doi.org/10.3390/risks10090181
Submission received: 10 July 2022
/
Revised: 20 August 2022
/
Accepted: 5 September 2022
/
Published: 9 September 2022
Abstract
:The bonus-malus system (BMS) is one of the most widely used tools in merit-rating automobile insurance, with the primary goal of ensuring that fair premiums are paid by all policyholders. The traditional BMS is dependent only on the claim frequency. Thus, an insured person who makes a claim with a small severity is penalized unfairly compared to an individual who makes a large severity claim. This study proposes a model for estimating the bonus-malus premium by employing a limit value (monetary unit) which distinguishes claim size into small and large based on claim frequency and claim severity distributions. This assists in determining the penalties for policyholders with claim sizes falling above and below the limit value. The number of claims is assumed to follow a Poisson distribution, and the total number of claims with a size greater than the limit value is considered a binomial distribution. The underlying risk of each policyholder is assumed to follow a beta Lindley distribution and is referred to as the prior distribution. Each policyholder’s claim size is also assumed to follow a gamma distribution, with the Lindley distribution considered as the prior distribution. Bonus-malus premiums are calculated following the Bayesian method. Practical examples using an actual data set are provided, and the results generated are compared to those produced using the traditional Poisson binomial-exponential beta model. This methodology provides a more equitable mechanism for penalizing policyholders in the portfolio.
1. Introduction
One crucial actuarial task is designing a charge structure that fairly distributes the responsibility of claims among policyholders. This is computed using the best model available to determine insurance premiums. The bonus-malus system (BMS) adjusts the premiums according to individual claim history and is popularly used, especially in automobile insurance, to determine that fair premiums are paid by all policyholders. As a reward for accident-free driving, a bonus is offered as a discount, whereas a malus results in an increase in the premium. The introduction of a BMS that links the premium to the number of reported claims will cause a tendency for policyholders to shoulder small claims on their own and not report them to their company to avoid a premium increase. “Hunger for bonus” is the term used to describe this phenomenon (Lemaire 1985). Lemaire (1976, 1977) studied the hunger for bonus and proposed a dynamic programming algorithm to determine the optimal claiming behavior. The BMS is used by insurance companies for two main reasons. The first is to encourage insureds to drive more cautiously throughout the year to avoid claims, and the latter is to ensure that insureds pay premiums that are proportional to their risks based on their claim experiences (Bühlmann 1967). The basic principle of this system is that greater claim frequencies result in higher premiums. The traditional BMS was solely dependent on the random variable of number of claims (Déniz 2016). However, not all events result in the same claim amount for an insured person. Because of different claim sizes, it makes sense to design a BMS based on both claim frequency and claim severity.
Several methodologies under the BMS framework have been used to determine fair premiums paid by policyholders. One of the most popular ways to determine premiums is the Bayesian method. Each policyholder has a constant as an unequal underlying risk. This unknown constant is referred to as a risk parameter and is treated as a random variable, with a specific probability distribution known as a prior distribution or structure-function distribution. This method is useful for calculating premiums in the BMS based on specific transition rules that distinguish policyholders as a bonus or malus. By dividing a posterior mean of the parameter by a prior mean, the basic Bayesian tool is easily applied to Bayes’ theorem. This tool employs the net premium principle and provides an estimate of risk parameters to distinguish between low- and high-risk policyholders.
The Poisson distribution is normally used to explain an independent random event of claims in vehicle insurance and expresses the behavior probability of individual policyholders (Déniz 2016). However, it cannot adequately describe the number of claims in an insurance portfolio. The negative binomial distribution, a type of mixing distribution with a Poisson distribution and a gamma distribution, was studied by Greenwood and Yule (1920). This marked the start of the process of constructing mixed Poisson distributions. A mixed Poisson was proposed for claim frequency distribution by Tremblay (1992). He designed an optimal BMS by mixing the Poisson distribution with the inverse Gaussian distribution, which has a wide variety of applications in medicine, finance, business, survival analysis and even in the maximum durability problem of investment in the gold market (Moumeesri and Klongdee 2019). In the automobile insurance sector, the random number of claims was also assumed to be Poisson distributed, while the randomly expected inherent risks of each insured person followed an inverse Gaussian distribution. Here, the Bayesian method was applied to estimate the posterior portfolio distribution function for a scenario covering the past t years. The expected premium value was calculated based on the BMS principle. Several papers have discussed mixing other distributions to obtain an optimal bonus-malus premium for the claim frequency (Dionne and Vanasse 1992; Lemaire 1995; Walhin and Paris 1999; Tzougas and Frangos 2014; Tzougas et al. 2019; Tzougas 2020). However, premium payments based on the BMS show no difference between a claim made by a policyholder for a small loss and another with a big loss. This phenomenon is called “hunger for bonus” (Lemaire 1985). For instance, a claim of USD 50 by a policyholder should not be penalized by the same increase in premium as a claim of USD 500. Déniz (2016) and Hernawati et al. (2017) proposed a model to determine premiums based on a BMS that distinguished two types of claims: those less than the limit value and those that exceeded this value. The result was a fairer method of penalizing all policyholders in the portfolio. Déniz and Calderín-Ojeda (2018) further developed the proposal of Déniz (2016). They studied a trivariate model where claims were distinguished into three types, while Pongsart et al. (2022) proposed a model for computing Bayesian bonus-malus premiums by distinguishing different multiple types of claims.
Our analysis identified situations where this concept should not be regarded as the fairest approach for penalizing policyholders. These included cases where only a few claims were made but the claim amount was large, or where a policyholder made a higher number of claims but the total claim amount was small. Therefore, the premium calculation based on the BMS should also assess the total claim amount. An optimal method to determine the premium charged to an insured must take both frequency and severity components into account (Frangos and Vrontos 2001). Many studies have attempted to determine premiums based on the BMS by including more factors than using only claim frequency in a model (Frangos and Vrontos 2001; Mert and Saykan 2005; Ibiwoye et al. 2011; Ni et al. 2014; Tzougas et al. 2015, 2017, 2018; 2020; Santi et al. 2016; Oh et al. 2019; Moumeesri et al. 2020; Jacob and Wu 2020). They proposed a model in which claim frequency and claim severity were included jointly to compute the bonus-malus premiums. This model was constructed by multiplying the bonus-malus premium based only on the number of claims with the bonus-malus premium based on the individual claim size. In addition, there was the work done to integrate the BMS into the farm insurance product. Boucher (2022) suggested developing unique BMSs using recursive partitioning techniques to each type of insured.
Here, we propose a model in which claim frequency and claim severity are included jointly to determine bonus-malus premiums by distinguishing two types of claims: those below a limit value classified as small, and the rest classified as large. The number of claims was assumed to be Poisson distributed, while the total number of claims with claim size larger than the limit value was assumed to follow a binomial distribution. The underlying risk of each policyholder was taken to be Lindley and beta distributed for the prior distributions. For claim severity distribution, we assume that the claim size of each policyholder follows a gamma distribution. The prior distribution was introduced as a Lindley distribution. To calculate the posterior structure functions for claim frequency and claim severity distributions, we followed the Bayesian approach. The mean of these functions was used to calculate the premiums paid by a policyholder.
The remainder of this paper is structured as follows. Section 2 discusses the methodology, divided into two parts as claim frequency distribution and claim severity distribution. Mixing distributions, the Bayesian method and the premium calculation are also explained. Section 3 illustrates the numerical applications and discusses the results using real claim data separated as claim frequency components and claim severity components. The results obtained are compared with those derived from the traditional Poisson-Lindley model that does not distinguish the type of claims (see Moumeesri et al. 2020 for details), and those achieved under the Poisson binomial-exponential beta model (see Hernawati et al. 2017 for details). The conclusions drawn are presented in Section 4.
2. Methodology
We assumed that the claim frequency and severity of each policyholder were independent. Claim frequency and claim severity distributions were divided into subsections as described below.
2.1. Claim Frequency Distribution
2.1.1. Mixing Distribution
In vehicle insurance, the Poisson distribution is used to describe the random occurrence of claims and represents the probability of individual policyholder behavior. Assume that the number of claims of each policyholder, given the parameter , follows a Poisson distribution. Then, its probability mass function (pmf) can be represented as:
The expected value of the Poisson random variable is
When the th policyholder causes a total claim amount , this has a certain size, , that can be considered as a small or large claim. To distinguish the two types of claims, the limit value denoted by separates the two sub-events as follows.
Let be the random variable corresponding to the claim size over the limit values.
where is a positive real number and
is modeled as a mutually independent and identically distributed random variable (i.i.d.) with a parameter of and Bernoulli distribution. Then, its pmf can be given as follows:
We also assume that is the total number of claims with claim size larger than . Then, the remainder, , is the total number of claims with claim size below . Assume that has a binomial distribution. The conditional pmf of each can be provided in the following form:
The expected value of the binomial random variable is
Thus, the joint distribution of the number of claims and the number of claims corresponding to the limit value can be represented as:
where and This is the joint distribution of Poisson () and binomial ().
All policyholders have a constant representing their expected inherent risk. This is the mean of the number of claims of each insured, denoted by . The parameter in Equation (1) denotes the different underlying risks of each insured having an accident and varies from one individual to another. This parameter is assumed to be a random variable according to the Lindley distribution, with parameter . Then, the probability density function (pdf) of can be represented as:
The expected value of the Lindley random variable is
The parameter in Equation (2) varies from one individual to another and is assumed to be a random variable that follows a beta distribution, with parameters and Thus, its pdf can be represented as:
where is the beta function defined by , and is the gamma function defined as . The expected value of the beta random variable is
When the random variables and are assumed to be independent, then the joint prior distribution for two random variables can be given by:
The mixed Poisson binomial distribution in Equation (3) with Lindley beta distribution in Equation (4) leads to in the following equations:
where and
2.1.2. Bayesian Method
The bonus-malus premium calculation has been rigorously studied, with the Bayesian method being one of the most popular computing options (Déniz et al. 2014). The main purpose of this approach is to obtain the posterior distribution function. Bayesian methodology can be applied when data for all policyholders are available, either based on claims history or insured profiles.
Let be a sample, where is the sample size. Then, is the total number of claims that a policyholder made in years, is the number of claims that the policyholder made in the year , and represents the total number of claims where the claim size was larger than in years.
The posterior distribution function of random variables and can be considered according to Bayes’ theorem as proportional to the product of the prior distribution and the likelihood function.
The likelihood function considered by Equation (3) is proportional to
The prior distribution considered by Equation (4) is proportional to
We then obtain the posterior distribution function of and for a policyholder or a group of policyholders with claim history . Then, the posterior distribution function which is proportional to the product of the likelihood function in Equation (6) and the prior distribution in Equation (7) can be represented as
Consider
then
where is constant.
Let thus
then
Therefore, the posterior distribution function can be represented as the following equation:
2.1.3. Premium Calculation
Many principles are involved in pricing insurance premiums. In this study, the net premium is denoted by . This is the basic principle in the sense that premiums should cover the expected value of losses. The net premium is calculated by expected values or means of claims or the number of claims to be paid by the insurers.
A premium calculation principle is a rule for assigning a premium to an insurance risk. This principle also assigns any risk with probability density function , where takes values in the sample space and is considered a realization of a parameter space . A premium is a real number. Heilmann (1989), Landsman and Makov (1998) and Young (2000) introduced the net premium principle, which can be represented as
For the loss function , the risk function is given by
The number of claims made by a policyholder in a given period is assigned by two random variables with the pdf depending on an unknown risk parameter that has a prior distribution . In the actuarial field, an unknown premium , called the risk premium, is calculated by minimizing the expected loss Ef[L(g(k,z),)], where is a suitable function of the number of claims with claim size relating to the limit values and is the action space. If this experience is not available, then the collective premium is computed by minimizing the risk function Eπ(θ,p)[L(P(θ,p),)], where is the prior distribution of the unknown parameter . Conversely, if the experience is available, then the sample will be used by the actuary to estimate the unknown risk premium , called the Bayesian premium. Déniz et al. (2000) and Heilmann (1989) further developed the premium calculation principle as follows:
- The risk premium:
- The collective premium:
- The Bayesian premium:can be represented aswhere and are suitable weights related to the number of claims, with sizes above and below the limit value, respectively. We also assume that .
The risk premium can be obtained using the net premium principle as shown below:
The risk premium can be reduced to if , and considered under the net premium principle or the traditional model obtained by the mean of the Poisson distribution.
If the value of is known, then the premium is a fair amount to penalize a policyholder. However, these values cannot be observed in practice since the risk premium is a theoretical amount that cannot be determined exactly but must be estimated from the data. The average premium for all possible risk premiums is called a prior or collective premium. This can be represented by the equations below.
If all weights are set to be , then the collective premium calculated under the traditional distribution or net premium principle is , where is the mean of the Lindley distribution.
The posterior premium or Bayesian premium can be represented as the following equations:
where represents the total number of claims and represents claims with size larger than . Note that . Thus, the Bayesian premium in Equation (11) is similar to the prior premium in Equation (10) when no information is available.
If we assume that the initial premium or base premium at time is 100, then, at time , the Bayesian bonus-malus premium can be determined from the number of claims and expressed as:
i.e.,
2.2. Claim Severity Distribution
2.2.1. Mixing Distribution
Suppose that the amount is the claim size of each policyholder. We assume that the conditional distribution of the claim size, given by the parameter follows a gamma distribution. Its pdf can then be given by
The expected value of the gamma random variable is .
The parameter is not the same for all insureds. Therefore, our prior belief for in Equation (13) can be expressed in the form of a distribution. If the parameter is distributed according to the Lindley distribution with the parameter , then its pdf is provided by
The expected value of will be
Then, the unconditional distribution of claim size can be obtained as follows
where and . Figure 1 illustrates the pdf plots of gamma-Lindley distribution for the unconditional distribution of claim size .
2.2.2. Bayesian Method
Consider that an insured is in the portfolio for years and that the number of claims made in the year is denoted by . Let be the total number of claims that a policyholder made in years. Then, claim size history can be represented as vector . The total claim size over years made by a policyholder in the portfolio can be denoted by .
Bayes’ theorem can be applied to consider the likelihood function and the prior distribution to obtain the posterior distribution function of the parameter given the claim size history of the insured as follows:
The likelihood function is
The prior distribution is
The posterior distribution for a policyholder or a group of policyholders with claim history is proportional to the product of the likelihood function in Equation (15) and the prior distribution in Equation (16) and can be represented as:
Consider
then
where is a constant.
Let then
Hence,
Therefore, the posterior distribution function results in the following Equation (17).
2.2.3. Premium Calculation
Many principles are involved in pricing insurance premiums. In this article, we determined the net premium principle for both claim severity distribution and claim frequency distribution. The basic principle is that premiums should be the expected value of losses. The expected value of the posterior distribution function in Equation (17) for the gamma-Lindley distribution was
From then
Therefore,
The Bayesian bonus-malus premium that must be paid by a specific group of insureds will be equal to the product of the Bayesian premium based on the frequency component in Equation (11) and the severity component in Equation (18). This can be expressed by
The model was constructed considering only the frequency component to set the premium for each policyholder and considering the premium in the severity component as a constant. Therefore, this model was not fair when penalizing policyholders. For instance, a policyholder making a claim of AUD 100 should not be penalized by the same amount as other policyholders making claims of AUD 1000. The total amount of claims should be considered as the main factor for setting fair premiums for all policyholders. The model in Equation (19) offers fairer penalties to all policyholders than a model considering only the frequency component.
To determine the bonus-malus premiums that must be paid according to the proposed model, we need to know the number of claims, age of the policy and total claim amounts. All these values are generally shown in the portfolio.
The Bayesian bonus-malus premium at time is called the base premium. This is the initial premium paid by a new policyholder who joins the insurance scheme. The base premium is given by
3. Numerical Applications
3.1. Data
The data set used to calculate model premiums introduced in this paper was based on 1-year automobile insurance policies taken out in 2004 or 2005. This data set can be found on the website of the Faculty of Business and Economics, Macquarie University (Sydney, Australia), see also De Jong and Heller (2008). Out of 67,856 policies in the total portfolio, 4624 claims were made. Histograms of the data set and histograms in log scale are shown in Figure 2 and Figure 3, respectively. There were 4333 policyholders who made claims once, 271 twice, 18 three times and 2 four times. The limit value was taken as 500 monetary units, and data were derived from Déniz (2016) to distinguish between the two types of claims. The number of policyholders that made claims once with claim size above the limit value was 2615, 123 twice, 7 three times and 1 four times, as shown in Table 1.
3.2. Parameter Estimation and Data Fitting
3.2.1. Claim Frequency Distribution
Model parameters can be estimated after the prior distributions. The parameters were estimated from the data using the unconditional distribution of provided in Equation (5). Let be the vector of the parameters in Equation (5).
Let be a sample with observations taken from the pdf in Equation (5). A parameter estimation method for the frequency component, called the minimum chi-square estimator (MCSE), was used to minimize the statistical value of the chi-square goodness of fit test () for the frequency distribution. The advantage of this method is that it gives a better fit to the data set. The formula is defined by
where is the value of the chi-square goodness of fit test, is the observed frequency count for the level of the categorical variable and is the expected frequency count for the level of the categorical variable.
A randomized neighborhood search (RNS) technique was used to minimize the statistical value of . Let be the vector of the parameters for some iteration = 0, 1, 2, …. Let be the representative of the statistical value () corresponding to the parameter . The RNS process (see Pongsart et al. (2022) for detail) is explained by the following steps.
Step 1: Set the initial parameter and compute the statistical value with the parameter .
Step 2: Randomly change the parameter to :
where
Step 3: Compute the statistical value with the parameter .
Step 4: Compare and . If , then we set and go to Step 5. Else go to Step 2.
Step 5: If then the process is completed. Else go to Step 2.
MATLAB programming was used for parameter estimation.
Claim frequency distribution was applied using the Poisson binomial-Lindley beta distribution introduced in this article. The estimated parameter values of the Poisson binomial-Lindley beta distribution were 4.1061, 2.9352 and 14.5654 with chi-square goodness of fit test = 17.4035 and AIC = 42,582.3175. Values of observed claim frequency and expected frequency were compared in Table 2 between the traditional Poisson binomial-exponential beta distribution (Hernawati et al. 2017) and Poisson binomial-Lindley beta distribution. Results showed that our proposed Poisson binomial-Lindley beta distribution gave a better fit to the data than the traditional Poisson binomial-exponential beta distribution.
3.2.2. Claim Severity Distribution
The maximum likelihood estimation (MLE) is widely used for estimating the model parameters for claim severity distribution. The unconditional distribution of is provided in Equation (14).
Let be an identically independent observation for the gamma-Lindley distribution with pdf in Equation (14). To find the most likely value of the parameters and , we require maximizing the likelihood function where
Then, the log-likelihood function is
The estimators and of the parameters and respectively can be obtained by solving the equation:
where
and
The parameters and cannot be estimated in closed form and the numerical iteration technique is used to solve the equations above.
To evaluate whether a given distribution is suited to a data set, the Kolmogorov-Smirnov test (K-S test) represents the goodness of fit test for the claim severity distribution. The K-S test statistic is defined by
where is the theoretical cumulative distribution of claim severity distributions and is denoted by
where is the sample size.
The results gave the maximum likelihood estimators 1501.5620 and 0.8012, with D-value = 0.0339 and AIC = 82,083.9448. Figure 4 shows the P-P plot of the Gamma-Lindley distribution.
3.3. Bonus-Malus Premiums
3.3.1. Claim Frequency Component
The Bayesian bonus-malus premiums based only on the frequency component were determined and calculated from Equation (12), with results shown in Table 3. For comparison, a limit value was assumed to be 500 monetary units, with weights 0.8 and 1.
From the results in Table 3, a bonus with no claims in the first year represented 6.77% of the base premium. Policyholders who made one claim with a claim size below and above the limit value during the first year must pay a malus at 82.92% and 87.97%, respectively of the base premium. Premiums decrease if policyholders have a claim-free year and increase if claims occur. The Bayesian bonus-malus premiums achieved under the traditional Poisson-Lindley model were compared (see Moumeesri et al. 2020 for details). The bonus-malus premiums were the same as the bonus ( 0) and different for the remainder of the malus (). For these malus classes, policyholders with a claim size below the limit value are rewarded compared to those with premiums determined under the traditional Poisson-Lindley model. The remaining premiums may be larger or smaller than those obtained in this model. A comparison of premiums between the traditional Poisson-Lindley model and the proposed Poisson binomial-Lindley beta model in the first year for various numbers of claims is shown in Figure 5.
For comparative purposes, the Bayesian bonus-malus premiums achieved under the Poisson binomial-exponential beta model were computed (see Hernawati et al. 2017 for details), with the results shown in Table 4.
In Table 4, a policyholder with no claims from the first year to the seventh year is awarded by bonus classes that equal the premiums determined under the Poisson binomial-Lindley beta model. An insured who made one claim with a claim size below and above the limit value of during the first year must pay a malus at 83.15% and 88.79%, respectively of the base premium. The results in Table 4 show that malus values based on the Poisson binomial-Lindley beta model both below and above the limit value are less than those based on the Poisson binomial-exponential beta model.
The Bayesian bonus-malus premiums computed from the traditional Poisson binomial-exponential beta model were stricter for high-risk policyholders than the proposed Poisson binomial-Lindley beta model in the case of claim sizes both below and above the limit value. Premiums obtained from the traditional model were similar to the proposed model for low-risk policyholders.
3.3.2. Claim Frequency and Claim Severity Components
Bonus-malus premiums using the proposed model are shown in Equation (19). To find the bonus-malus premiums that must be paid, we need to know the number of claims made in these years, the number of claims corresponding to the limit value, the age of the policy and the total claim amount from a portfolio.
In some cases, the total claim amount corresponding to the limit value was equal to 400, 1500 and 2500. To better understand how the BMS operates, Table 5 shows the premiums that must be paid by the policyholder for various numbers of claims when the age of the policy is up to 7 years. The base premium, an initial premium paid by all new policyholders, is 80.52, and this decreases with a claim-free year. Conversely, after an accident with a claim size of 400 in the first year, the policyholder will pay 103.57.
If an accident occurs during the second year with a claim size of 1100, then a surcharge will be enforced and the insured will have to pay 160.54 as the premium for two accidents, with a claim amount that exceeds the limit value one time ( = 1) for a total claim size of 1500 in 2 years, as shown in Table 6.
If no accident occurs in the third year, then the premium will reduce with a claim-free year and the insured must pay 151.04, which is the premium for two accidents of total claim size 1500 in 3 years (see Table 6).
If two accidents occur during the fourth year with claim sizes 900 and 100, then a surcharge will be enforced of 194.88, which is the premium for four accidents with a claim amount that exceeds the limit value two times ( = 2) for total claim size 2500 in 4 years, as shown in Table 7.
The Bayesian bonus-malus premiums were compared under the traditional Poisson binomial-exponential beta distribution for the frequency component and the gamma-Lindley distribution for the severity component. The results are shown in Table 8, Table 9 and Table 10.
The base premiums and premiums with a claim-free year for low-risk policyholders are slightly different between the bonus-malus premiums proposed in Table 5, Table 6 and Table 7 and the traditional bonus-malus premiums in Table 8, Table 9 and Table 10. Moreover, the traditional bonus-malus premiums in Table 8, Table 9 and Table 10 are stricter for high-risk policyholders than premiums presented in Table 5, Table 6 and Table 7 when the total number of claims with claim size over the limit value is high. However, the traditional bonus-malus premiums in Table 8, Table 9 and Table 10 are more generous for high-risk policyholders than premiums presented in Table 5, Table 6 and Table 7 when the total number of claims with the claim size over the limit value is small.
Table 11 shows the premiums (malus) with Poisson binomial-Lindley beta for claim frequency distribution and gamma-Lindley for claim severity distribution that must be paid by policyholders during the first year of the policy, with the number of accidents ranging from 1 to 4, number of claims corresponding to the limit value and the aggregate claim amount of accidents ranging from AUD 100 to AUD 30,000. The results shown in Table 11 are depicted in Figure 6. Premiums were dependent on aggregate claim amount, number of claims and number of claims with claim size corresponding to the limit value.
4. Conclusions
A model was proposed to determine optimal bonus-malus premiums that considered both claim frequency and claim severity components by distinguishing two types of claims based on claim amounts beneath and above a threshold value. Two mixed distributions, the Poisson binomial with the Lindley beta distribution and a mixed gamma with Lindley distribution, were investigated and employed in the model as frequency distribution and severity distribution, respectively. The Bayesian method was applied in the model as a frequency component and a severity component. Both models were then integrated. The new model rewarded and penalized all policyholders in a fairer manner.
An example of real automobile insurance data was used to illustrate our model. Fitted results of claim frequency were better than the traditional Poisson binomial-exponential beta model. When claims occurred, high-risk policyholders were liable to more severe penalties under the traditional model. Our proposed model presents a reasonable alternative method for rewarding and penalizing both low- and high-risk policyholders. The obtained premiums could be used by insurers to gain market share in the highly competitive insurance industry.
To increase impartiality of assigning premium to all policyholders, further different types of claims could be distinguished as a topic for further research.
Author Contributions
Conceptualization, A.M. and T.P.; methodology, A.M. and T.P.; software, A.M.; validation, A.M. and T.P.; formal analysis, A.M. and T.P.; investigation, A.M. and T.P.; data curation, A.M.; writing—original draft preparation, A.M.; writing—review and editing, A.M. and T.P.; visualization, A.M.; supervision, T.P.; project administration, T.P.; funding acquisition, T.P. All authors have read and agreed to the published version of the manuscript.
Funding
This research was funded by Office of the Permanent Secretary, Ministry of Higher Education, Science, Research and Innovation, grant number RGNS 63-054.
Data Availability Statement
Not applicable.
Acknowledgments
The authors would like to express our heartfelt appreciation to Watcharin Klongdee for the initial idea and helpful advice in completing this paper successfully. The authors would like to thank the referees for their careful reading and numerous helpful suggestions that helped to improve this paper.
Conflicts of Interest
The authors declare no conflict of interest.
References
- Boucher, Jean-Philippe. 2022. Multiple Bonus–Malus Scale Models for Insureds of Different Sizes. Risks 10: 152. [Google Scholar] [CrossRef]
- Bühlmann, Hans. 1967. Experience Rating and Credibility. Astin Bulletin 4: 199–207. [Google Scholar] [CrossRef]
- De Jong, Piet, and Gillian Z. Heller. 2008. Generalized Linear Models for Insurance Data. Cambridge: Cambridge University Press. [Google Scholar]
- Déniz, E. Gómez, Francisco José Vázquez Polo, and A. Hernández Bastida. 2000. Robust Bayesian premium principles in actuarial science. Journal of the Royal Statistical Society Series D (The Statistician) 49: 241–52. [Google Scholar] [CrossRef]
- Déniz, Emilio. 2016. Bivariate credibility bonus malus premiums distinguishing between two types of claims. Insurance: Mathematics and Economics 70: 117–24. [Google Scholar]
- Déniz, Emilio, Agustín Hernández-Bastida, and M. Pilar Fernández-Sánchez. 2014. Computing credibility Bonus-Malus premiums using the total claim amount distribution. Hacetepe Journal of Mathematics and Statistics 43: 1047–61. [Google Scholar]
- Déniz, Emilio, and Enrique Calderín-Ojeda. 2018. Multivariate Credibility in Bonus-Malus Systems Distinguishing between Different Types of Claims. Risks 6: 34. [Google Scholar] [CrossRef]
- Dionne, Georges, and Charles Vanasse. 1992. Automobile Insurance Ratemaking in the Presence of Asymmetrical Information. Journal of Applied Econometrics 7: 149–65. [Google Scholar] [CrossRef]
- Frangos, Nicholas E., and Spyridon D. Vrontos. 2001. Design of optimal bonus-malus systems with a frequency and a severity component on an individual basis in automobile insurance. Astin Bulletin 31: 1–22. [Google Scholar] [CrossRef]
- Greenwood, Major, and G. Udny Yule. 1920. An Inquiry into the Nature of Frequency Distributions Representative of Multiple Happenings with Particular Reference to the Occurrence of Multiple Attacks of Disease or of Repeated Accidents. Journal of the Royal Statistical Society A 83: 255–79. [Google Scholar] [CrossRef]
- Heilmann, Wolf-Rüdiger. 1989. Decision theoretic foundations of credibility theory. Insurance: Mathematics and Economics 8: 77–95. [Google Scholar] [CrossRef]
- Hernawati, Lili, I. Gusti Putu Purnaba, and I. Wayan Mangku. 2017. Comparing bonus malus premiums of two types claim which is assessed using Bayesian method. Applied Mathematical Sciences 11: 1687–94. [Google Scholar] [CrossRef]
- Ibiwoye, Ade, I. A. Adeleke, and Sunday A. Aduloju. 2011. Quest for optimal bonus-malus in automobile insurance in developing economies. An Actuarial Perspective. International Business Research 4: 74–83. [Google Scholar] [CrossRef]
- Jacob, Azaare, and Zhao Wu. 2020. An Alternative Pricing System through Bayesian Estimates and Method of Moments in a Bonus-Malus Framework for the Ghanaian Auto Insurance Market. Journal of Risk and Financial Management 13: 143. [Google Scholar] [CrossRef]
- Landsman, Zinoviy M., and Udi E. Makov. 1998. Exponential dispersion models and credibility. Scandinavian Actuarial Journal 1: 89–96. [Google Scholar] [CrossRef]
- Lemaire, Jean. 1976. Driver versus company: Optimal behaviour of the policyholder. Scandinavian Actuarial Journal 4: 209–19. [Google Scholar] [CrossRef]
- Lemaire, Jean. 1977. La soif du bonus. Astin Bulletin 9: 181–90. [Google Scholar] [CrossRef]
- Lemaire, Jean. 1985. Analysis of the Hunger for Bonus. In Automobile Insurance. Huebner International Series on Risk, Insurance and Economic Security; New York and Dordrecht: Springer, pp. 183–74. [Google Scholar]
- Lemaire, Jean. 1995. Bonus-malus systems in automobile insurance. Insurance: Mathematics and Economics 3: 277. [Google Scholar]
- Mert, Mehmet, and Yasemin Saykan. 2005. On a bonus-malus system where the claim frequency distribution is geometric and the claim severity distribution is Pareto. Hacettepe Journal of Mathematics and Statistics 34: 75–81. [Google Scholar]
- Moumeesri, Adisak, and Watcharin Klongdee. 2019. The Maximum Durability Problem for Investing in Gold Market. WSEAS Transactions on Business and Economics 16: 68–77. [Google Scholar]
- Moumeesri, Adisak, Watcharin Klongdee, and Tippatai Pongsart. 2020. Bayesian Bonus-Malus Premium with Poisson-Lindley Distributed Claim Frequency and Lognormal-Gamma Distributed Claim Severity in Automobile Insurance. WSEAS Transactions on Mathematics 19: 443–51. [Google Scholar] [CrossRef]
- Ni, Weihong, Corina Constantinescu, and Athanasios Pantelous. 2014. Bonus–Malus systems with Weibull distributed claim severities. Annals of Actuarial Science 8: 217–33. [Google Scholar] [CrossRef]
- Oh, Rosy, Peng Shi, and Jae Youn Ahn. 2019. Bonus-Malus premiums under the dependent frequency-severity modeling. Scandinavian Actuarial Journal 2020: 172–95. [Google Scholar] [CrossRef]
- Pongsart, Tippatai, Adisak Moumeesri, Tidadeaw Mayureesawan, and Wikanda Phaphan. 2022. Computing Bayesian Bonus-Malus Premium Distinguishing Among Different Multiple Types of Claims. Lobachevskii Journal of Mathematics 43: 148–57. [Google Scholar] [CrossRef]
- Santi, D. N., I. G. P. Purnaba, and I. W. Mangku. 2016. Bonus-Malus System with the Claim Frequency Distribution is Geometric and the Severity Distribution is Truncated Weibull. IOP Conference Series: Earth and Environmental Science 31: 012006. [Google Scholar] [CrossRef]
- Tremblay, Luc. 1992. Using the Poisson inverse Gaussian in bonus-malus systems. Astin Bulletin 22: 97–106. [Google Scholar] [CrossRef] [Green Version]
- Tzougas, George. 2020. EM estimation for the Poisson-Inverse Gamma regression model with varying dispersion: An application to insurance ratemaking. Risks 8: 97. [Google Scholar] [CrossRef]
- Tzougas, George, and Nicholas Frangos. 2014. The Design of an Optimal Bonus-Malus System Based on the Sichel Distribution. Cham: Springer International Publishing. [Google Scholar]
- Tzougas, George, Dimitris Karlis, and Nicholas Frangos. 2017. Confidence intervals of the premiums of optimal Bonus Malus Systems. Scandinavian Actuarial Journal 2: 129–44. [Google Scholar]
- Tzougas, George, Spyridon Vrontos, and Nicholas Frangos. 2015. Optimal Bonus-Malus Systems using finite mixture models. Astin Bulletin 44: 417–44. [Google Scholar] [CrossRef]
- Tzougas, George, Spyridon Vrontos, and Nicholas Frangos. 2018. Bonus-Malus systems with two component mixture models arising from different parametric families. North American Actuarial Journal 22: 59–91. [Google Scholar] [CrossRef]
- Tzougas, George, Wei Li Hoon, and Jun Ming Lim. 2019. The negative binomial-inverse Gaussian regression model with an application to insurance ratemaking. European Actuarial Journal 9: 323–44. [Google Scholar] [CrossRef]
- Tzougas, George, Woo Hee Yik, and Muhammad Waqar Mustaqeem. 2020. Insurance ratemaking using the Exponential-Lognormal regression model. Annals of Actuarial Science 14: 42–71. [Google Scholar] [CrossRef]
- Walhin, Jean-François, and Jose Paris. 1999. Using mixed Poisson processes in connection with bonus-malus systems. Astin Bulletin 29: 81–99. [Google Scholar] [CrossRef]
- Young, Virginia R. 2000. Credibility using semiparametric models and a loss function with a constancy penalty. Insurance: Mathematics and Economics 26: 151–56. [Google Scholar] [CrossRef]
Figure 1.
Gamma-Lindley distribution density plots.

Figure 2.
Histogram of the data set.

Figure 3.
Histogram (log scale) of the data set.

Figure 4.
P-P plot of gamma-Lindley distribution.
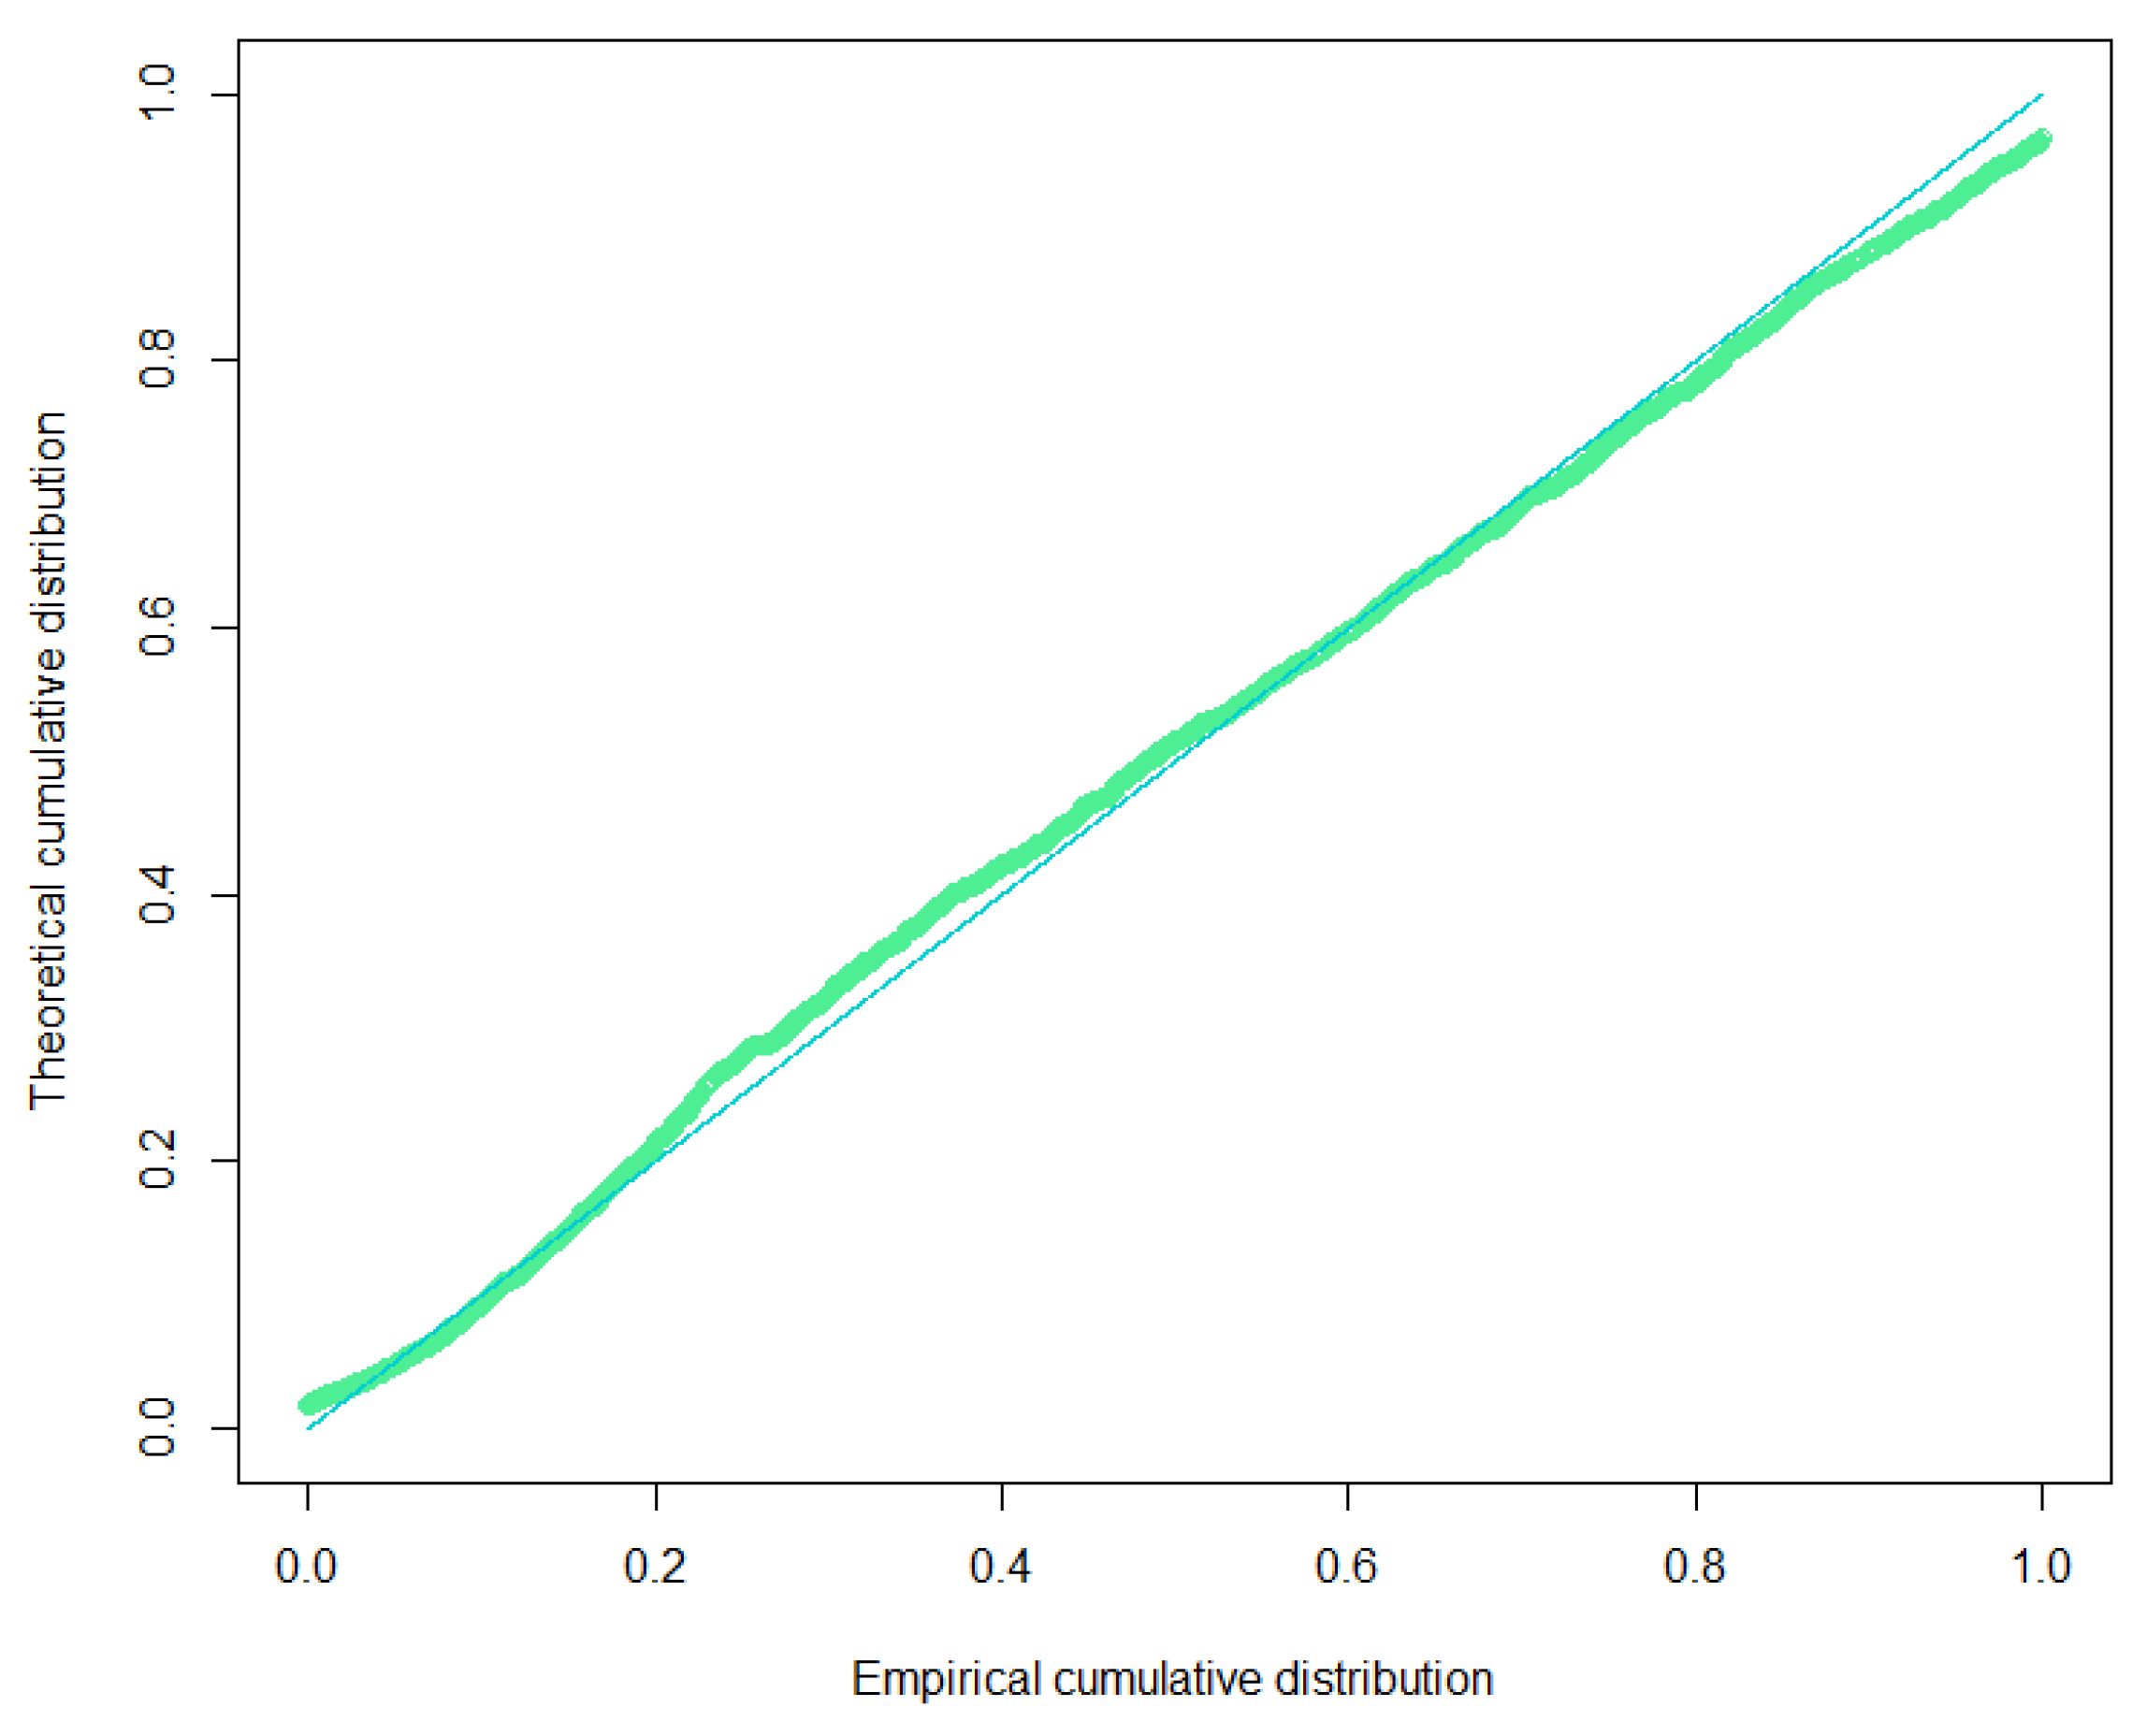
Figure 5.
Comparison of the premiums between the traditional Poisson-Lindley model and the proposed Poisson binomial-Lindley beta model in the first year.
Figure 5.
Comparison of the premiums between the traditional Poisson-Lindley model and the proposed Poisson binomial-Lindley beta model in the first year.
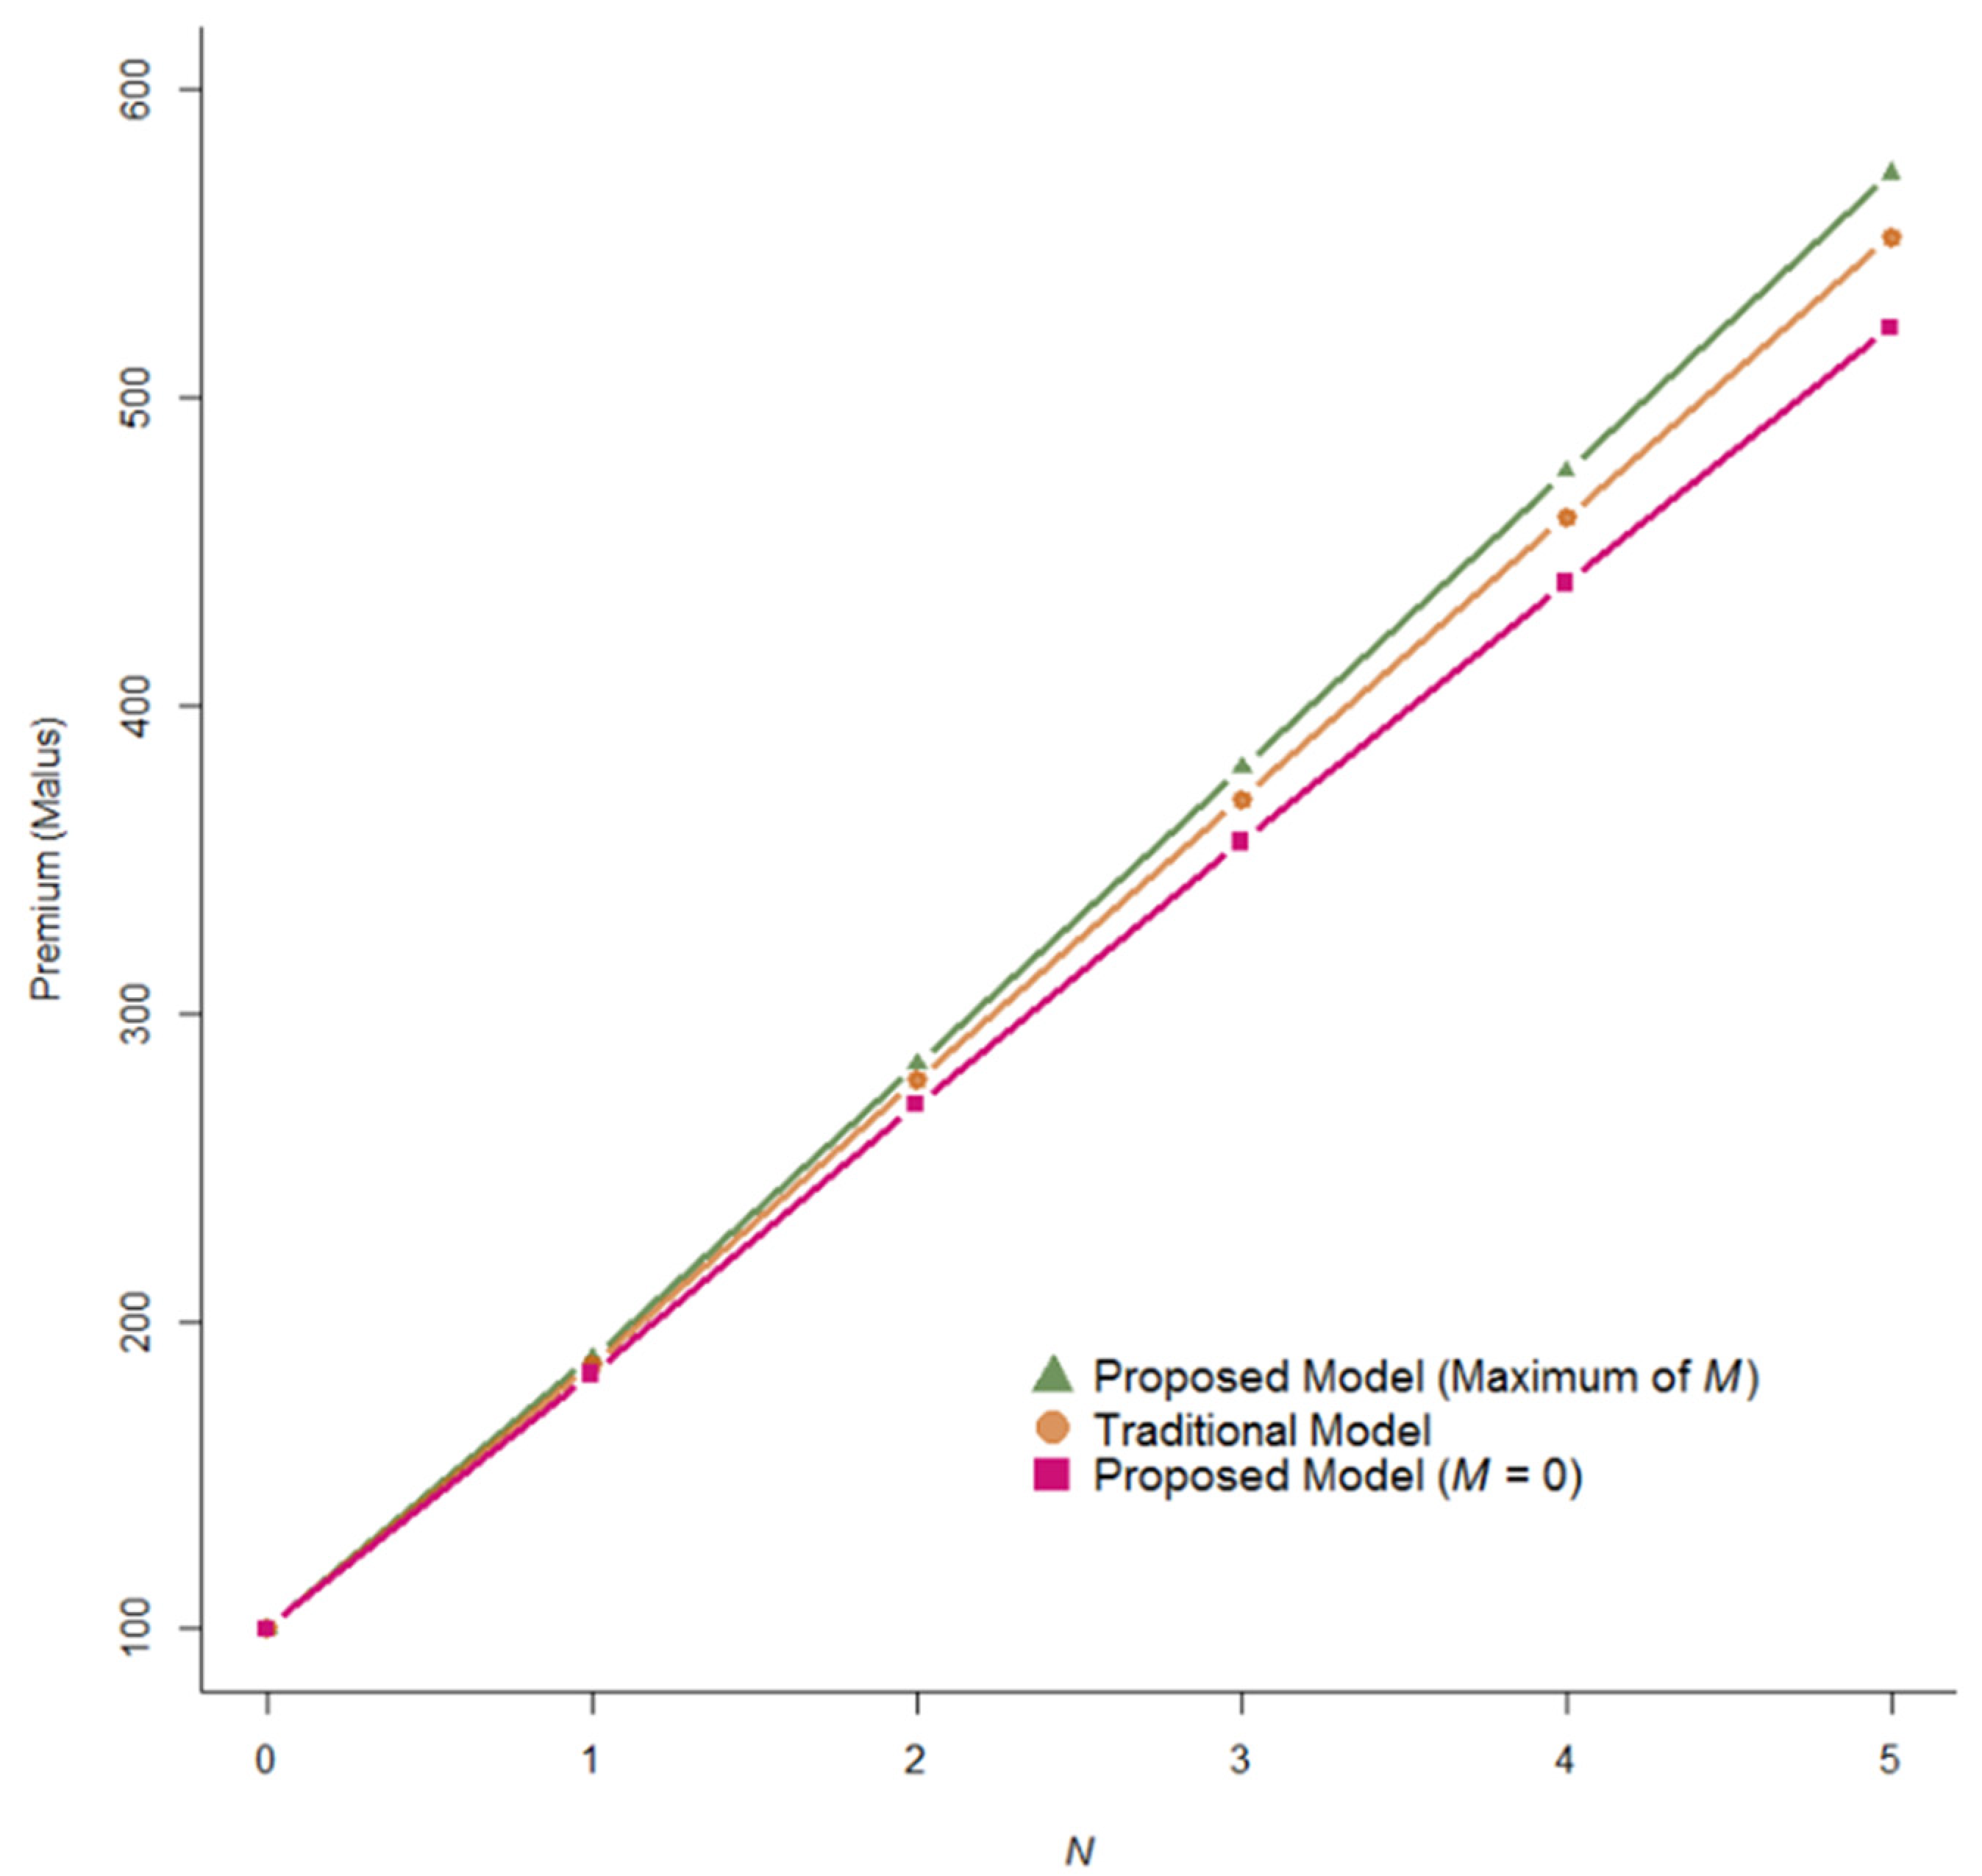
Figure 6.
The premiums based on Poisson binomial-Lindley beta for frequency distribution and gamma-Lindley for severity distribution with various number of claims and claim sizes in the first year.
Figure 6.
The premiums based on Poisson binomial-Lindley beta for frequency distribution and gamma-Lindley for severity distribution with various number of claims and claim sizes in the first year.


Table 1.
Observed claim frequency for the number of claims () and the total number of claims with claim size larger than a limit value () with = 500.
Table 1.
Observed claim frequency for the number of claims () and the total number of claims with claim size larger than a limit value () with = 500.
| Total | ||||||
|---|---|---|---|---|---|---|
| 0 | 1 | 2 | 3 | 4 | ||
| 0 | 63,232 | 63,232 | ||||
| 1 | 1840 | 2493 | 4333 | |||
| 2 | 37 | 117 | 117 | 271 | ||
| 3 | 1 | 5 | 5 | 7 | 18 | |
| 4 | 0 | 0 | 1 | 0 | 1 | 2 |
| Total | 65,110 | 2615 | 123 | 7 | 1 | 67,856 |
Table 2.
Observed frequency and expected frequency for estimated parameter values for the number of claims () and the total number of claims with claim size larger than a limit value () with = 500.
Table 2.
Observed frequency and expected frequency for estimated parameter values for the number of claims () and the total number of claims with claim size larger than a limit value () with = 500.
| Observed Frequency | Expected Frequency | |||
|---|---|---|---|---|
| Poisson Binomial-Exponential Beta | Poisson Binomial-Lindley Beta | |||
| 0 | 0 | 63,232 | 63,262.4760 | 63,234.5099 |
| 1 | 0 | 1840 | 1768.2668 | 1795.7044 |
| 1 | 1 | 2493 | 2514.2978 | 2512.0406 |
| 2 | 0 | 37 | 59.1654 | 59.6707 |
| 2 | 1 | 117 | 121.0755 | 124.5243 |
| 2 | 2 | 117 | 109.6681 | 108.3118 |
| 3 | 0 | 1 | 2.2262 | 2.2053 |
| 3 | 1 | 5 | 5.3370 | 5.5043 |
| 3 | 2 | 5 | 6.9573 | 7.1421 |
| 3 | 3 | 7 | 5.1049 | 4.9526 |
| 4 | 0 | 0 | 0.0910 | 0.0880 |
| 4 | 1 | 0 | 0.2387 | 0.2436 |
| 4 | 2 | 1 | 0.3645 | 0.3780 |
| 4 | 3 | 0 | 0.3849 | 0.3910 |
| 4 | 4 | 1 | 0.2493 | 0.2367 |
| Total | 67,856 | 67,856 | 67,856 | |
| Estimated parameter values | 3.6490 2.5663 13.7721 | 4.1061 2.9352 14.5654 | ||
| 18.0696 | 17.4035 | |||
| AIC | 42,586.2414 | 42,582.3175 | ||
Table 3.
Bonus-malus premiums based on the Poisson binomial-Lindley beta distribution for the frequency component where represents the total number of claims and represents those that the claim size is larger than 500.
Table 3.
Bonus-malus premiums based on the Poisson binomial-Lindley beta distribution for the frequency component where represents the total number of claims and represents those that the claim size is larger than 500.
| Number of Claims | |||||||||
|---|---|---|---|---|---|---|---|---|---|
| 0 | 1 | 2 | 3 | 4 | 5 | 6 | 7 | ||
| 0 | 0 | 100.00 | 93.23 | 87.32 | 82.11 | 77.49 | 73.35 | 69.64 | 66.28 |
| 1 | 0 | 182.92 | 171.38 | 161.20 | 152.16 | 144.07 | 136.80 | 130.22 | |
| 1 | 187.97 | 176.11 | 165.65 | 156.35 | 148.04 | 140.57 | 133.81 | ||
| 2 | 0 | 270.16 | 253.19 | 238.21 | 224.90 | 212.98 | 202.26 | 192.56 | |
| 1 | 276.87 | 259.48 | 244.13 | 230.48 | 218.27 | 207.28 | 197.35 | ||
| 2 | 283.58 | 265.77 | 250.04 | 236.07 | 223.56 | 212.31 | 202.13 | ||
| 3 | 0 | 355.63 | 333.37 | 313.72 | 296.24 | 280.59 | 266.50 | 253.76 | |
| 1 | 363.66 | 340.90 | 320.80 | 302.93 | 286.93 | 272.52 | 259.49 | ||
| 2 | 371.70 | 348.43 | 327.89 | 309.62 | 293.26 | 278.54 | 265.22 | ||
| 3 | 379.73 | 355.96 | 334.97 | 316.31 | 299.60 | 284.56 | 270.95 | ||
| 4 | 0 | 439.76 | 412.32 | 388.09 | 366.52 | 347.21 | 329.82 | 314.08 | |
| 1 | 448.87 | 420.87 | 396.13 | 374.12 | 354.41 | 336.66 | 320.59 | ||
| 2 | 457.98 | 429.41 | 404.17 | 381.71 | 361.60 | 343.49 | 327.10 | ||
| 3 | 467.09 | 437.95 | 412.21 | 389.30 | 368.79 | 350.32 | 333.60 | ||
| 4 | 476.20 | 446.49 | 420.25 | 396.89 | 375.98 | 357.16 | 340.11 | ||
Table 4.
Bonus-malus premiums based on the Poisson binomial-exponential beta distribution for the frequency component where represents the total number of claims and represents those that the claim size is larger than 500.
Table 4.
Bonus-malus premiums based on the Poisson binomial-exponential beta distribution for the frequency component where represents the total number of claims and represents those that the claim size is larger than 500.
| Number of Claims | |||||||||
|---|---|---|---|---|---|---|---|---|---|
| 0 | 1 | 2 | 3 | 4 | 5 | 6 | 7 | ||
| 0 | 0 | 100.00 | 93.23 | 87.32 | 82.11 | 77.49 | 73.36 | 69.65 | 66.30 |
| 1 | 0 | 183.15 | 171.54 | 161.31 | 152.24 | 144.13 | 136.84 | 130.25 | |
| 1 | 188.79 | 176.82 | 166.28 | 156.92 | 148.56 | 141.05 | 134.26 | ||
| 2 | 0 | 270.98 | 253.80 | 238.66 | 225.23 | 213.24 | 202.45 | 192.71 | |
| 1 | 278.40 | 260.75 | 245.20 | 231.40 | 219.08 | 208.00 | 197.98 | ||
| 2 | 285.82 | 267.70 | 251.74 | 237.57 | 224.92 | 213.54 | 203.26 | ||
| 3 | 0 | 357.38 | 334.72 | 314.77 | 297.06 | 281.23 | 267.01 | 254.15 | |
| 1 | 366.21 | 342.99 | 322.54 | 304.39 | 288.17 | 273.60 | 260.43 | ||
| 2 | 375.03 | 351.25 | 330.31 | 311.72 | 295.12 | 280.19 | 266.70 | ||
| 3 | 383.85 | 359.51 | 338.08 | 319.05 | 302.06 | 286.78 | 272.98 | ||
| 4 | 0 | 442.79 | 414.72 | 389.99 | 368.05 | 348.44 | 330.82 | 314.89 | |
| 1 | 452.74 | 424.03 | 398.75 | 376.31 | 356.27 | 338.25 | 321.97 | ||
| 2 | 462.69 | 433.35 | 407.51 | 384.58 | 364.10 | 345.68 | 329.04 | ||
| 3 | 472.63 | 442.67 | 416.27 | 392.85 | 371.92 | 353.11 | 336.11 | ||
| 4 | 482.58 | 451.99 | 425.04 | 401.12 | 379.75 | 360.55 | 343.19 | ||
Table 5.
Bonus-malus premiums based on Poisson binomial-Lindley beta distribution for the frequency component and gamma-Lindley distribution for the severity component with a total claim size of 400.
Table 5.
Bonus-malus premiums based on Poisson binomial-Lindley beta distribution for the frequency component and gamma-Lindley distribution for the severity component with a total claim size of 400.
| Number of Claims | |||||||||
|---|---|---|---|---|---|---|---|---|---|
| 0 | 1 | 2 | 3 | 4 | 5 | 6 | 7 | ||
| 0 | 0 | 80.52 | 75.07 | 70.31 | 66.12 | 62.39 | 59.06 | 56.07 | 53.37 |
| 1 | 0 | 103.57 | 97.04 | 91.27 | 86.15 | 81.57 | 77.46 | 73.73 | |
| 1 | 106.43 | 99.71 | 93.79 | 88.53 | 83.82 | 79.59 | 75.76 | ||
| 2 | 0 | 105.87 | 99.22 | 93.35 | 88.13 | 83.47 | 79.26 | 75.46 | |
| 1 | 108.50 | 101.69 | 95.67 | 90.32 | 85.54 | 81.23 | 77.34 | ||
| 2 | 111.13 | 104.15 | 97.99 | 92.51 | 87.61 | 83.20 | 79.21 | ||
| 3 | 0 | 106.56 | 99.89 | 94.00 | 88.76 | 84.08 | 79.85 | 76.04 | |
| 1 | 108.97 | 102.15 | 96.12 | 90.77 | 85.97 | 81.66 | 77.75 | ||
| 2 | 111.37 | 104.40 | 98.25 | 92.77 | 87.87 | 83.46 | 79.47 | ||
| 3 | 113.78 | 106.66 | 100.37 | 94.78 | 89.77 | 85.27 | 81.19 | ||
| 4 | 0 | 106.66 | 100.01 | 94.13 | 88.90 | 84.21 | 80.00 | 76.18 | |
| 1 | 108.87 | 102.08 | 96.08 | 90.74 | 85.96 | 81.65 | 77.76 | ||
| 2 | 111.08 | 104.15 | 98.03 | 92.58 | 87.70 | 83.31 | 79.34 | ||
| 3 | 113.29 | 106.22 | 99.98 | 94.42 | 89.45 | 84.97 | 80.91 | ||
| 4 | 115.50 | 108.29 | 101.93 | 96.26 | 91.19 | 86.63 | 82.49 | ||
Table 6.
Bonus-malus premiums based on Poisson binomial-Lindley beta distribution for the frequency component and gamma-Lindley distribution for the severity component with a total claim size of 1500.
Table 6.
Bonus-malus premiums based on Poisson binomial-Lindley beta distribution for the frequency component and gamma-Lindley distribution for the severity component with a total claim size of 1500.
| Number of Claims | |||||||||
|---|---|---|---|---|---|---|---|---|---|
| 0 | 1 | 2 | 3 | 4 | 5 | 6 | 7 | ||
| 0 | 0 | 80.52 | 75.07 | 70.31 | 66.12 | 62.39 | 59.06 | 56.07 | 53.37 |
| 1 | 0 | 163.52 | 153.20 | 144.10 | 136.02 | 128.79 | 122.29 | 116.40 | |
| 1 | 168.03 | 157.42 | 148.07 | 139.77 | 132.34 | 125.66 | 119.61 | ||
| 2 | 0 | 167.15 | 156.65 | 147.38 | 139.14 | 131.77 | 125.14 | 119.14 | |
| 1 | 171.30 | 160.54 | 151.04 | 142.60 | 135.05 | 128.25 | 122.10 | ||
| 2 | 175.45 | 164.43 | 154.70 | 146.06 | 138.32 | 131.36 | 125.06 | ||
| 3 | 0 | 168.23 | 157.71 | 148.41 | 140.14 | 132.74 | 126.07 | 120.04 | |
| 1 | 172.03 | 161.27 | 151.76 | 143.30 | 135.73 | 128.92 | 122.75 | ||
| 2 | 175.83 | 164.83 | 155.11 | 146.47 | 138.73 | 131.77 | 125.47 | ||
| 3 | 179.64 | 168.39 | 158.46 | 149.63 | 141.73 | 134.62 | 128.18 | ||
| 4 | 0 | 168.39 | 157.89 | 148.61 | 140.35 | 132.96 | 126.30 | 120.27 | |
| 1 | 171.88 | 161.16 | 151.69 | 143.26 | 135.71 | 128.91 | 122.76 | ||
| 2 | 175.37 | 164.43 | 154.76 | 146.16 | 138.46 | 131.53 | 125.25 | ||
| 3 | 178.86 | 167.70 | 157.84 | 149.07 | 141.22 | 134.15 | 127.74 | ||
| 4 | 182.35 | 170.97 | 160.92 | 151.98 | 143.97 | 136.76 | 130.24 | ||
Table 7.
Bonus-malus premiums based on Poisson binomial-Lindley beta distribution for the frequency component and gamma-Lindley distribution for the severity component with a total claim size of 2500.
Table 7.
Bonus-malus premiums based on Poisson binomial-Lindley beta distribution for the frequency component and gamma-Lindley distribution for the severity component with a total claim size of 2500.
| Number of Claims | |||||||||
|---|---|---|---|---|---|---|---|---|---|
| 0 | 1 | 2 | 3 | 4 | 5 | 6 | 7 | ||
| 0 | 0 | 80.52 | 75.07 | 70.31 | 66.12 | 62.39 | 59.06 | 56.07 | 53.37 |
| 1 | 0 | 218.01 | 204.26 | 192.13 | 181.35 | 171.71 | 163.04 | 155.20 | |
| 1 | 224.02 | 209.89 | 197.42 | 186.35 | 176.44 | 167.53 | 159.48 | ||
| 2 | 0 | 222.86 | 208.86 | 196.50 | 185.52 | 175.69 | 166.85 | 158.85 | |
| 1 | 228.39 | 214.04 | 201.38 | 190.12 | 180.05 | 170.99 | 162.79 | ||
| 2 | 233.93 | 219.23 | 206.26 | 194.73 | 184.42 | 175.13 | 166.73 | ||
| 3 | 0 | 224.30 | 210.26 | 197.87 | 186.84 | 176.97 | 168.09 | 160.05 | |
| 1 | 229.37 | 215.01 | 202.34 | 191.06 | 180.97 | 171.89 | 163.66 | ||
| 2 | 234.44 | 219.76 | 206.81 | 195.28 | 184.97 | 175.68 | 167.28 | ||
| 3 | 239.50 | 224.51 | 211.28 | 199.50 | 188.97 | 179.48 | 170.89 | ||
| 4 | 0 | 224.52 | 210.51 | 198.13 | 187.12 | 177.27 | 168.39 | 160.35 | |
| 1 | 229.17 | 214.87 | 202.24 | 191.00 | 180.94 | 171.88 | 163.67 | ||
| 2 | 233.82 | 219.23 | 206.34 | 194.88 | 184.61 | 175.37 | 167.00 | ||
| 3 | 238.47 | 223.59 | 210.45 | 198.75 | 188.28 | 178.85 | 170.32 | ||
| 4 | 243.12 | 227.95 | 214.55 | 202.63 | 191.96 | 182.34 | 173.64 | ||
Table 8.
Bonus-malus premiums based on Poisson binomial-exponential beta distribution for the frequency component and gamma-Lindley distribution for the severity component with a total claim size of 400.
Table 8.
Bonus-malus premiums based on Poisson binomial-exponential beta distribution for the frequency component and gamma-Lindley distribution for the severity component with a total claim size of 400.
| Number of Claims | |||||||||
|---|---|---|---|---|---|---|---|---|---|
| 0 | 1 | 2 | 3 | 4 | 5 | 6 | 7 | ||
| 0 | 0 | 80.09 | 74.67 | 69.93 | 65.76 | 62.06 | 58.76 | 55.78 | 53.10 |
| 1 | 0 | 103.14 | 96.60 | 90.84 | 85.73 | 81.17 | 77.06 | 73.35 | |
| 1 | 106.32 | 99.58 | 93.64 | 88.37 | 83.66 | 79.43 | 75.61 | ||
| 2 | 0 | 105.62 | 98.92 | 93.03 | 87.79 | 83.11 | 78.91 | 75.11 | |
| 1 | 108.51 | 101.63 | 95.57 | 90.20 | 85.39 | 81.07 | 77.17 | ||
| 2 | 111.41 | 104.34 | 98.12 | 92.60 | 87.67 | 83.23 | 79.23 | ||
| 3 | 0 | 106.51 | 99.76 | 93.81 | 88.53 | 83.81 | 79.58 | 75.74 | |
| 1 | 109.14 | 102.22 | 96.12 | 90.72 | 85.88 | 81.54 | 77.61 | ||
| 2 | 111.77 | 104.68 | 98.44 | 92.90 | 87.95 | 83.50 | 79.48 | ||
| 3 | 114.40 | 107.14 | 100.76 | 95.09 | 90.02 | 85.47 | 81.35 | ||
| 4 | 0 | 106.82 | 100.05 | 94.08 | 88.79 | 84.06 | 79.81 | 75.96 | |
| 1 | 109.22 | 102.29 | 96.19 | 90.78 | 85.95 | 81.60 | 77.67 | ||
| 2 | 111.62 | 104.54 | 98.31 | 92.78 | 87.83 | 83.39 | 79.38 | ||
| 3 | 114.02 | 106.79 | 100.42 | 94.77 | 89.72 | 85.18 | 81.08 | ||
| 4 | 116.42 | 109.04 | 102.54 | 96.77 | 91.61 | 86.98 | 82.79 | ||
Table 9.
Bonus-malus premiums based on Poisson binomial-exponential beta distribution for the frequency component and gamma-Lindley distribution for the severity component with a total claim size of 1500.
Table 9.
Bonus-malus premiums based on Poisson binomial-exponential beta distribution for the frequency component and gamma-Lindley distribution for the severity component with a total claim size of 1500.
| Number of Claims | |||||||||
|---|---|---|---|---|---|---|---|---|---|
| 0 | 1 | 2 | 3 | 4 | 5 | 6 | 7 | ||
| 0 | 0 | 80.09 | 74.67 | 69.93 | 65.76 | 62.06 | 58.76 | 55.78 | 53.10 |
| 1 | 0 | 162.84 | 152.52 | 143.42 | 135.35 | 128.14 | 121.66 | 115.80 | |
| 1 | 167.85 | 157.21 | 147.83 | 139.52 | 132.08 | 125.40 | 119.37 | ||
| 2 | 0 | 166.75 | 156.18 | 146.87 | 138.60 | 131.22 | 124.58 | 118.59 | |
| 1 | 171.32 | 160.46 | 150.89 | 142.40 | 134.81 | 128.00 | 121.83 | ||
| 2 | 175.89 | 164.73 | 154.91 | 146.20 | 138.41 | 131.41 | 125.08 | ||
| 3 | 0 | 168.15 | 157.49 | 148.10 | 139.77 | 132.32 | 125.63 | 119.58 | |
| 1 | 172.31 | 161.38 | 151.76 | 143.22 | 135.59 | 128.73 | 122.54 | ||
| 2 | 176.46 | 165.27 | 155.41 | 146.67 | 138.86 | 131.83 | 125.49 | ||
| 3 | 180.61 | 169.16 | 159.07 | 150.12 | 142.12 | 134.93 | 128.44 | ||
| 4 | 0 | 168.64 | 157.95 | 148.53 | 140.17 | 132.71 | 126.00 | 119.93 | |
| 1 | 172.43 | 161.50 | 151.87 | 143.32 | 135.69 | 128.83 | 122.62 | ||
| 2 | 176.22 | 165.05 | 155.21 | 146.47 | 138.67 | 131.66 | 125.32 | ||
| 3 | 180.01 | 168.59 | 158.54 | 149.62 | 141.65 | 134.49 | 128.01 | ||
| 4 | 183.80 | 172.14 | 161.88 | 152.77 | 144.63 | 137.32 | 130.71 | ||
Table 10.
Bonus-malus premiums based on Poisson binomial-exponential beta distribution for the frequency component and gamma-Lindley distribution for the severity component with a total claim size of 2500.
Table 10.
Bonus-malus premiums based on Poisson binomial-exponential beta distribution for the frequency component and gamma-Lindley distribution for the severity component with a total claim size of 2500.
| Number of Claims | |||||||||
|---|---|---|---|---|---|---|---|---|---|
| 0 | 1 | 2 | 3 | 4 | 5 | 6 | 7 | ||
| 0 | 0 | 80.09 | 74.67 | 69.93 | 65.76 | 62.06 | 58.76 | 55.78 | 53.10 |
| 1 | 0 | 217.11 | 203.35 | 191.22 | 180.46 | 170.85 | 162.21 | 154.40 | |
| 1 | 223.79 | 209.60 | 197.10 | 186.01 | 176.10 | 167.20 | 159.15 | ||
| 2 | 0 | 222.32 | 208.23 | 195.81 | 184.80 | 174.95 | 166.10 | 158.11 | |
| 1 | 228.41 | 213.93 | 201.18 | 189.86 | 179.74 | 170.65 | 162.44 | ||
| 2 | 234.50 | 219.64 | 206.54 | 194.92 | 184.53 | 175.20 | 166.77 | ||
| 3 | 0 | 224.20 | 209.98 | 197.46 | 186.35 | 176.42 | 167.50 | 159.44 | |
| 1 | 229.73 | 215.16 | 202.34 | 190.95 | 180.78 | 171.64 | 163.37 | ||
| 2 | 235.26 | 220.35 | 207.21 | 195.55 | 185.13 | 175.77 | 167.31 | ||
| 3 | 240.80 | 225.53 | 212.08 | 200.15 | 189.49 | 179.90 | 171.24 | ||
| 4 | 0 | 224.84 | 210.59 | 198.03 | 186.89 | 176.93 | 167.99 | 159.90 | |
| 1 | 229.90 | 215.32 | 202.48 | 191.09 | 180.91 | 171.76 | 163.49 | ||
| 2 | 234.95 | 220.05 | 206.93 | 195.29 | 184.88 | 175.53 | 167.08 | ||
| 3 | 240.00 | 224.78 | 211.38 | 199.49 | 188.86 | 179.31 | 170.68 | ||
| 4 | 245.05 | 229.51 | 215.83 | 203.69 | 192.83 | 183.08 | 174.27 | ||
Table 11.
Comparison of premiums for various number of claims and claim sizes in the first year.
| Claim Size | Number of Claims | |||||||||||||
|---|---|---|---|---|---|---|---|---|---|---|---|---|---|---|
| N = 1 | N = 2 | N = 3 | N = 4 | |||||||||||
| M = 0 | M = 1 | M = 0 | M = 1 | M = 2 | M = 0 | M = 1 | M = 2 | M = 3 | M = 0 | M = 1 | M = 2 | M = 3 | M = 4 | |
| 100 | 87 | 90 | 89 | 91 | 94 | 90 | 92 | 94 | 96 | 90 | 92 | 94 | 95 | 97 |
| 1000 | 136 | 140 | 139 | 143 | 146 | 140 | 143 | 147 | 150 | 140 | 143 | 146 | 149 | 152 |
| 5000 | 354 | 364 | 362 | 371 | 380 | 364 | 373 | 381 | 389 | 365 | 372 | 380 | 387 | 395 |
| 10,000 | 627 | 644 | 641 | 657 | 672 | 645 | 659 | 674 | 689 | 645 | 659 | 672 | 686 | 699 |
| 20,000 | 1172 | 1204 | 1198 | 1227 | 1257 | 1205 | 1233 | 1260 | 1287 | 1207 | 1232 | 1257 | 1282 | 1307 |
| 30,000 | 1717 | 1764 | 1755 | 1798 | 1842 | 1766 | 1806 | 1846 | 1886 | 1768 | 1804 | 1841 | 1878 | 1914 |
Publisher’s Note: MDPI stays neutral with regard to jurisdictional claims in published maps and institutional affiliations. |
© 2022 by the authors. Licensee MDPI, Basel, Switzerland. This article is an open access article distributed under the terms and conditions of the Creative Commons Attribution (CC BY) license (https://creativecommons.org/licenses/by/4.0/).
Share and Cite
MDPI and ACS Style
Moumeesri, A.; Pongsart, T. Bonus-Malus Premiums Based on Claim Frequency and the Size of Claims. Risks 2022, 10, 181. https://doi.org/10.3390/risks10090181
AMA Style
Moumeesri A, Pongsart T. Bonus-Malus Premiums Based on Claim Frequency and the Size of Claims. Risks. 2022; 10(9):181. https://doi.org/10.3390/risks10090181
Chicago/Turabian StyleMoumeesri, Adisak, and Tippatai Pongsart. 2022. "Bonus-Malus Premiums Based on Claim Frequency and the Size of Claims" Risks 10, no. 9: 181. https://doi.org/10.3390/risks10090181
Note that from the first issue of 2016, this journal uses article numbers instead of page numbers. See further details here.