
On the Diversification of Fixed Income Assets

Department of Economics and Finance, Emlyon Business School, 23, Avenue Guy de Collongue, CEDEX, 69134 Ecully, France
Risks 2022, 10(2), 31; https://doi.org/10.3390/risks10020031
Submission received: 20 December 2021
/
Revised: 25 January 2022
/
Accepted: 26 January 2022
/
Published: 1 February 2022
(This article belongs to the Special Issue Credit Risk Management)
Abstract
:This article introduces a new approach for dealing with the diversification/concentration risk of fixed income assets. Because Government bonds, corporate bonds, and mortgage backed securities constitute a large proportion of the assets of institutional investors in most countries, it is important to be able to determine the number of lines/issuers of such assets, not only for portfolio management but also for risk management purposes. The approach that I introduce shows the dependence of the critical number of lines of fixed income assets on the main interest rate risk and credit risk drivers. Specifically, I examine the importance of volatility risk, force of mean reversion, default risk, recovery risk, and default dependence risk on the critical number of assets in a fixed income portfolio. The methodology in this paper relies on the use of the coefficient of variation for the computation of the critical number of credit-sensitive securities in a fixed income portfolio. To the best of my knowledge, this paper is the first to develop such an approach.
1. Introduction
While a lot of finance research contributions have addressed, since the seminal work of Markowitz (1952), the question of the diversification of stock portfolios, far fewer research papers have examined the diversification of fixed income portfolios. Because a large proportion of the assets of institutional investors are comprised of fixed income securities in the U.S., in Europe, and in other developed economies, it turns out that a large part of the diversification/concentration risk of these companies is related to fixed income assets. The diversification of fixed income assets (bonds, shares of MBSs, and so on) involves, at least, the diversification of interest rate risk and of credit risk. This paper deals with the diversification of these two risks, excluding potential additional contributions, such as the diversification of prepayment risk.
One of the outputs of this paper is the construction of management tools that can help investors to determine the minimum number of fixed income issuers that should be included into their portfolios. Being able to reduce the number of lines in portfolios is particularly useful in the sense that it reduces the amount of financial analysis that is required to build these portfolios. This study also allows investors to develop a sensitivity approach, namely to vary the number of lines in their bond portfolios depending on the evolution of the main credit or interest rate factors.
In the general finance literature, recent papers have put forward strong arguments justifying that it may not be optimal to fully diversify stock portfolios. For instance, Mitton and Vorkink (2007) show that considering higher order moments (more specifically skewness in the case of their paper) can lead to more concentrated portfolios. Uppal and Wang (2003) justify the construction of concentrated portfolios by the presence of uncertainty in the modeling of stock dynamics, while Van Nieuwerburgh and Veldkamp (2010) justify the same effect by the high informational costs associated with the monitoring of stock portfolios. None of these papers extend their analysis to the case of fixed income assets.
Papers directly dealing with credit diversification include Varotto (2003), who conducts an empirical analysis of the Eurobond market, Levy and Lerman (1988), who examine general efficient frontiers for portfolios made of stocks and bonds, Dynkin et al. (2002), who deal with the empirical link between credit diversification and rating changes, Peta (1993), who constructs an empirical analysis of international bond and stock diversification, and Hunter and Simon (2004), who provide an international empirical analysis.
In the quantitative finance literature, it is possible to refer to the papers of Hofmann and Platen (2000) and of Cerreia-Vioglio et al. (2011), who propose a general treatment of diversification risk. The paper of Jarrow et al. (2005) deals with the diversification of default risk based on a general modeling of the intensity of default.
Even in the recent literature, it is difficult to find references directly dealing with the problem examined in this article. However, the reader interested in recent references can consider the work of Saardchom (2018), which consists in an actuarial model dealing with the aggregate loss distribution. The paper of Wu and Wu (2018), which puts forward the interest of partially diversifying a portfolio of credit default swaps, is equally interesting. See the work of Kurtz et al. (2018), as well, which deals with sectorial concentration, or the paper of Konstantinov (2017), which deals with factorial concentration. Finally, take a look at the paper of Heckel et al. (2020), which examines the use of factor models in a fixed income context.
To construct a general framework for the diversification of credit risk, it is first necessary to choose between a structural or a reduced approach to this risk. Structural models rely on a modeling of the dynamics of the assets of a company. Starting with the work of Merton (1974), they were expanded, e.g., by Longstaff and Schwartz (1995), who also take into account interest rate risk, or by Leland and Toft (1996), who relies on an optimization of the value of the company. These contributions do not allow us to deal with the optimal level of diversification of a bond portfolio, contrary to the Vasicek structural approach (see, for instance, Vasicek (1987, 1991, 2002)). However, the Vasicek approach shares with other structural approaches the following weaknesses: the difficulty to calibrate in a robust way the parameters of the asset process from stock and bond data, the even greater difficulty to expand this procedure at the level of correlated assets, the reliance on Gaussian assumptions for the modeling of credit risk, the difficulty to produce a market-consistent framework, the lack of explaining power because factors are introduced in an ad hoc manner, and the impossibility to produce formulas showing the link between the optimal number of lines in the fixed income portfolio and the driving interest rate risk and credit risk parameters.
Given the drawbacks of structural models, the approach that is used in this paper is reduced, which means that a modeling of the assets of bond issuers is not attempted. On the contrary, I rely on quoted bond prices information and model the main constituents of interest rate risk and credit risk, including recovery and dependence aspects. The risk indicator that is constructed in this paper is market-consistent, or risk-neutral, to be able to incorporate it in a more general solvency framework and for consistency with arbitrage valuation procedures.
It is possible to make the following comparisons between this paper and previous papers co-written with other authors. The paper of Allali et al. (2018) deals with the computation of credit Solvency Capital Requirements in a Solvency 2 approach, but does not consider diversification issues and does not make use of an interest rate model. The paper of Le Courtois et al. (2021) provides interesting elements on the limits of market-consistent approaches but, again, does not deal with diversification issues. Finally, the book of Le Courtois and Walter (2014) provides a general treatment of extreme risks and discusses diversification issues in the case of equity risk, but not of credit risk.
The only Gaussian assumptions that are made in this paper are for the interest rate risk, where I use the Vasicek (1977) model, which has the advantages of relying on a parsimonious number of intuitive parameters, of being easy to implement, and of incorporating negative interest rates. This paper shows that the force of mean reversion that appears in the Vasicek model, but also in other interest rate models, is a key driver of the diversification risk of fixed income portfolios.
The risk indicator that is used in this paper is the coefficient of variation of the portfolio’s discounted payoff. This risk indicator has the advantage of being independent of size/price effects. It converges to zero for an asymptotically high number of bonds when risk is fully diversifiable and to a non-null constant when interest rate risk or credit risk cannot be fully diversified away from the portfolio. Our paper provides the asymptotic value of this risk indicator as a function of the main interest rate and credit drivers. I also examine the dependence of the resulting critical number of fixed income assets on the main financial variables.
The paper is organized as follows. First, I study the diversification of interest rate risk, that is, I consider a situation where only interest rate risk is present. Next, I extend this study to the case of the diversification of corporate bonds, that is, to the case where both interest rate risk and credit risk are present. The final section provides a general formula for the critical number of fixed income assets and analyzes the dependence of this indicator on the main interest rate (force of mean reversion, volatility) and credit (survival/default probability, recovery, dependence) variables.
2. Diversification of Interest Rate Risk
Let us start by a study of the diversification of interest rate risk, that is, of Government bond portfolios. This preliminary study is important for the study of the diversification of general bond portfolios because it is not possible to study the diversification of credit risk without first taking into account the pure interest rate component, as examined in detail in the forthcoming part devoted to the study of the diversification of credit risk.
2.1. Notation
Let denote the (random) discounted payoff of a zero-coupon bond that matures at time T. Thus,
where the random variable equals:
The price of this bond is computed in the risk-neutral world as the risk-neutral expectation of the discounted payoff:
Let us also define:
Finally, the risk-neutral variance of the discounted payoff is
where it is possible to denote
2.2. Portfolio of Independent Government Bonds
Let us start by considering a portfolio of N independent Government bonds issued by a variety of countries. Let us also assume that all of these bonds have independent and identically distributed discounted payoffs. The discounted payoff associated with the total portfolio is
where is the weight of bond i in the total portfolio.
Let us classically assume that
and let us define:
Note that, when all the weights are identical, so, when for all i, then, .
The risk-neutral expectation of the discounted payoff of the aggregate portfolio is equal to
because discounted payoffs are assumed to be identically distributed.
Therefore,
Next, let us compute the risk-neutral variance of the discounted payoff:
Thus,
Equipped with the expressions of the mean and variance of the discounted payoff, it is possible to compute the coefficient of variation of the discounted payoff. I use this quantity as a risk indicator because it is independent of the size of the portfolio. Indeed, this quantity expressions the amount of fluctuation per unit of risk. An additional advantage of using the coefficient of variation in the case of bond portfolios is that it allows us to analyze risk independently of pricing considerations because the denominator of the coefficient of variation is precisely the price of the bond portfolio.
In addition, note that the coefficient of variation is computed in the risk-neutral world but not in the historical world. Indeed, it may be interesting to plug these results into a, e.g., Basle or Solvency 2 procedure, where market consistent (that is risk-neutral) valuations of the institutional investor may be required, and where it could be required to simulate in the risk-neutral world the asset portfolio of the company with an adequate number of issuers. More generally, situations where the company invests in products with embedded options or in interest rate options may prevail. In such situations, the natural world for conducting analyzes is the risk-neutral world.
Clearly, all the results that are shown below in the risk-neutral world can be readily rewritten in the historical world. For brevity, I do not report the formulas that can be derived in this alternate situation, and I leave this modification to the reader. Further, it can be readily shown that the same heuristics (dependency of the optimal number of issuers based on the credit quality, for instance, studied in the forthcoming sections) are obtained in both worlds.
Based on the previous elements, it is possible to derive the coefficient of variation as follows:
When all the weights are identical, this expression becomes:
where this quantity is inversely dependent on the square root of the number N of bonds.
At the limit, it is possible to show that
This result is important: it confirms that a portfolio of independent Government bonds is fully diversifiable. Indeed, for an asymptotically high number of Government bonds, risk, as measured by the coefficient of variation, completely disappears.
It is now possible to compute the critical number of lines/issuers of Government bonds in which an institutional investor should invest. Let us compute this critical number of issuers by ensuring that the risk indicator remains below a critical threshold.
Specifically, let be the critical value, chosen by the investor, of . The goal is to compute the critical number of issuers that is associated with . To achieve this goal, let us compute the smallest integer such that
From the previous equation, it is possible to deduce:
where an upper rounding indicator is used to guarantee that is an integer.
The interpretation is as follows: for any number of bonds superior or equal to , the coefficient of variation of the discounted payoff remains inferior to . Here, it appears that, ceteris paribus, a higher number of issuers is necessary to keep portfolio risk unchanged if interest rate risk (as measured by v) is higher. Next, let us examine how the above results are modified when Government bond analytics become dependent, as is the case in practice.
Let us finally note that the risk indicator retained in this paper, which is the coefficient of variation, allows us to measure the risk per unit of price of the fixed income portfolio. The goal of this approach is to compare the risks of portfolios that are identically costly. Alternatively, one could simply consider the variance of the average discounted payoff of the portfolio, where this alternative indicator also measures the risk per unit of size of the portfolio (although not anymore per unit of price).
Specifically, it is possible to define as the critical value, chosen by the investor, of . In this alternative approach, the goal is to compute the critical number of bonds that is associated with . That is, the goal is to compute the smallest integer such that
From this equation, one can deduce
whose interpretation is as follows: for any number of bonds superior or equal to , the variance of the average discounted payoff remains inferior to .
2.3. Portfolio of Dependent Government Bonds
Let us now consider a portfolio of N dependent Government bonds issued by a variety of countries. Discounted payoffs are still assumed identically distributed, but now they are dependent, and the same amount of dependence holds between any two issuers. Let, again, the discounted payoff of the bond portfolio be
It can be readily checked that, similar to the independent case:
The risk-neutral variance of the average discounted payoff satisfies:
so that
or
because of assumptions.
Let us denote the risk-neutral covariance of any two discounted payoffs as follows:
and let us also define:
Equipped with these definitions, let us write:
When all the weights are identical, one can readily check that . Therefore, in this situation,
Next, one can compute
which yields
It appears that, in the dependent case, interest rate risk cannot be fully diversified away by investing in an asymptotically high number of investors because the limit in the above expression is strictly positive. Not surprisingly, a higher residual (or systemic) amount of risk remains when the dependence indicator is higher between any two issuers.
Finally, the goal is to compute the smallest integer such that
One obtains1:
3. Joint Diversification of Interest Rate and Credit Risks
Let us now examine the diversification of portfolios of corporate bonds, which include an important credit risk component, in addition to a classic interest rate risk component. For simplicity, I assume that all of the corporate bonds are issued in the same currency. As in the previous section, all bonds are zero-coupon bonds with an identical maturity, which can be viewed as a proxy of a coupon bond duration. This allows us to derive closed-form formulas that are useful for understanding the dependence of the critical level of credit risk diversification on the main interest rate and credit risk parameters.
General Results
The discounted payoff of a credit-risky zero-coupon bond (the upperscript “i” is for the bond, while the upperscript “c” is for “Credit”) can be written as follows:
where is the random default time of issuer “i”, is its recovery rate, and we assume that the recovery amount is paid at the initially planned maturity in case of default2. For a portfolio of defaultable bonds,
Therefore,
or, equivalently,
I use a Cox process approach, where the default intensity of bond “i” is a stochastic process that may depend on r and on the default intensities of other bonds.
Let us denote by the filtration that incorporates information about the interest rate process r, the credit intensity processes s, and the recovery rates s. Conditionally on , the intensity process becomes a deterministic function of time, and the default time becomes the time of the first jump of an inhomogenous Poisson process.
Specifically, the following two important results (see, for instance, Schönbucher (2003)) prevail:
and
where one defines:
Using the tower property of conditional expectations, it is possible to rewrite Equation (37) as follows3:
or, equivalently, as follows:
When interest rate risk and credit risk are independent, it is possible to simplify Equation (41) as follows:
If one further assumes that the recovery rates are constant,
Let us further denote
so that
Next, let us come to the study of the variance of the aggregate fixed income portfolio. Thus, let us first write4:
which is equivalent to
The tower property of conditional expectations allows us to rewrite Equation (48) as follows:
Because is known conditional on the information , it is also possible to write:
Developing the inner terms, one obtains:
Because the recovery rates, s, are known conditional on the information , and because a variance (covariance) is unchanged when its argument (one of its arguments) is shifted by a constant amount, it is also possible to write:
The inner conditional expectation in Equation (52) is already known and equal to
Finally, the inner conditional covariance term in Equation (52) can be computed as follows:
or
where C is a copula that relates the two default Cox processes (see, for instance, Jouanin et al. (2001)).
Using the above developments, let us rewrite the risk-neutral variance of the fixed income portfolio as follows:
I now assume that the interest rate process r is independent from all of the sources of credit risk and that the recovery rates, s, are constant. However, the s may still be stochastic and inter-dependent. Equation (59) becomes
where the derivation of the third term in the right-hand-side of Equation (59) is provided in Appendix A and where the following definitions are used:
and
and also
where .
The above developments illustrate how risk indicators can be computed in a general interest rate and credit framework. For instance, the coefficient of variation, which is used in the subsequent illustrations, can be obtained by computing the ratio of the variance shown in Equation (60) to the expectation shown in Equation (46). The derivation of higher order moments is also possible but tedious in a fully closed-form way. Computing the skewness and kurtosis of a fixed income portfolio in a nearly fully closed-form way can be achieved by mixing the approach shown in this section with the use of tensor products (see, for instance, Le Courtois and Walter (2014), for an illustration of the use of tensor products in the case of equity portfolios).
4. Analysis and Illustration
In this section, I examine the situation where the portfolio is iso-weighted and where the default intensities are constant and identical. The recovery rates are also assumed constant and identical. These assumptions allow us to illustrate a situation where credit risk is decomposed into three components: survival probability, inter-default dependence, and recovery risk. I postulate a Vasicek interest rate model and analyze the effect of the main interest rate and credit drivers on the diversification of a fixed income portfolio.
4.1. Framework
Let us assume that the default intensity is a constant that is identical between issuers. In this situation, the risk-neutral survival probability is also identical between issuers and can be expressed as follows:
where i can refer to any issuer. Based on this simplification and using Equation (46), the price of an iso-weighted portfolio becomes
Next,
One readily derives:
Using the above simplifications, it is possible to rewrite Equation (60) as follows:
More simply,
It appears that the amount of risk that remains after diversifying away the individual risk contributions is a function of interest rate quantities (E, , and v) and of credit-related quantities (q, R, ).
Finally, the goal is to compute the smallest integer such that
One obtains the critical number of issuers , which keeps the risk indicator below the critical threshold , as the following quantity7:
Again, this expression is a function of interest rate quantities (E, , and v) and of credit-related quantities (q, R, ). The next section analyzes in detail the effects of interest rate risk and credit risk on the diversification of bond portfolios.
4.2. Vasicek Parametrization
Equation (77) above is general and can be used with a variety of interest rate models. However, one needs to provide a specification for the parameters E, , and v, where the latter two quantities are not quoted quantities that can be easily retrieved from financial databases.
I choose to implement a Vasicek model because it is simple, little-parametrized, its parameters are financially intuitive, and the model allows for the possibility of negative interest rates. As shown below, the main interest rate quantities that need to be calibrated by actuaries to feed the formulas are the volatility and the force of mean reversion a of the short term rate. These quantities can be easily calibrated using the Vasicek formula for the yield curve, together with, e.g., Bloomberg data.
Let us model the short-term interest rate as follows:
This model depends on four parameters: the initial value of the interest rate , the mean-reversion (long term) level of interest rates b, the force of mean reversion a, and the volatility of the short rate .
First of all, recall that the risk-neutral distribution of is Gaussian and characterized by the following mean:
and variance:
For diversification calculations, it is necessary to compute moments related to the integral of the short-term rate but not to the rate itself. , being an integral of Gaussian contributions, is also Gaussian. It is characterized by the following mean:
and variance:
where
It is now possible to compute
or
Additionally,
or
Finally,
or
Equation (77) becomes:
where the interest rate quantity depends on and a, but not on and b, as can be seen in Equations (82) and (83).
Therefore, it appears that the critical number of issuers depends on three credit risk parameters and on two interest rate risk parameters: the volatility and mean reversion parameters (but not on interest rate parameters that reflect constant levels, such as and b).
The next subsection examines the sensitivity of the critical number of issuers to these five risk parameters, as well as the sensitivity to the maturity and critical threshold values.
4.3. Sensitivities
This section illustrates the sensitivity of the critical number of issuers, computed using Equation (90) to the main driving parameters. For all of the figures of this subsection, except when the parameters are allowed to vary in the abscissa of these figures, I make the following assumptions8: the survival probability is equal to , the correlation between the survival indicators is , the recovery rate is , the confidence looseness parameter is , the force of mean reversion is , the volatility of short term rates is , and the mean maturity of bonds is .
Figure 1 shows how the solution to Equation (90), namely the critical number of issuers, varies with the confidence looseness parameter . This graph shows that, if one wants to increase safety, that is, if one wants to reduce the confidence looseness parameter, then, it is necessary to sharply increase the minimum number of issuers. Thus, achieving a high level of safety can be expensive because investing in a high number of issuers implies an important amount of monitoring or information recovery-related costs.
Let us now examine the impact of the mean bond maturity on the diversification of credit risk. Figure 2 shows how the critical number of issuers depends on the maturity of corporate bonds. This figure exhibits that the diversification of credit risk is more easily achieved, i.e., is achieved with a smaller number of issuers, when the mean maturity of corporate bonds is low.
Let us now study the impact of the risk-free interest rate parameters. First, Figure 3 shows the variation of the critical number of issuers with respect to the volatility of the short term interest rate. This figure illustrates that the diversification of credit risk is more easily achieved, i.e., achieved with a smaller number of issuers, when the volatility of the short term interest rate is low. This feature is reasonable: it should be easier to diversify away a risk that is smaller, all else being kept equal.
Next, Figure 4 shows how the critical number of issuers varies with the second key risk-free interest rate parameter: the force of mean reversion. This figure illustrates that the diversification of credit risk is more easily achieved, i.e., achieved with a smaller number of issuers, when the force of mean reversion is high.
Note that the force of mean reversion could be interpreted as the force of central bank intervention. Indeed, the greater the frequency at which a central bank changes its target rate or the greater its injections/retrievals of cash into/out of the economy, the more market rates are likely to revert to an average level.
Interestingly, Figure 4 tells us that the diversification of fixed income portfolios is easier in an economy that is more monitored by central banks. At the limit, when the economy is completely under control and when interest rates do not vary, the question of the diversification of fixed income portfolios completely vanishes.
Next, let us examine the impact of credit parameters on the diversification of fixed income assets. Figure 5 shows how the critical number of issuers varies with the survival probability q of issuers. This figure shows that the diversification of credit risk is more easily achieved, i.e., achieved with a smaller number of issuers, when the survival probability is high.
Then, Figure 6 shows how the critical number of issuers varies with another key credit risk driver: the correlation between survival indicators. This figure tells us that the diversification of credit risk is more easily achieved, i.e., achieved with a smaller number of issuers, when the dependence between survival indicators (or, equivalently, the dependence between credits) is high.
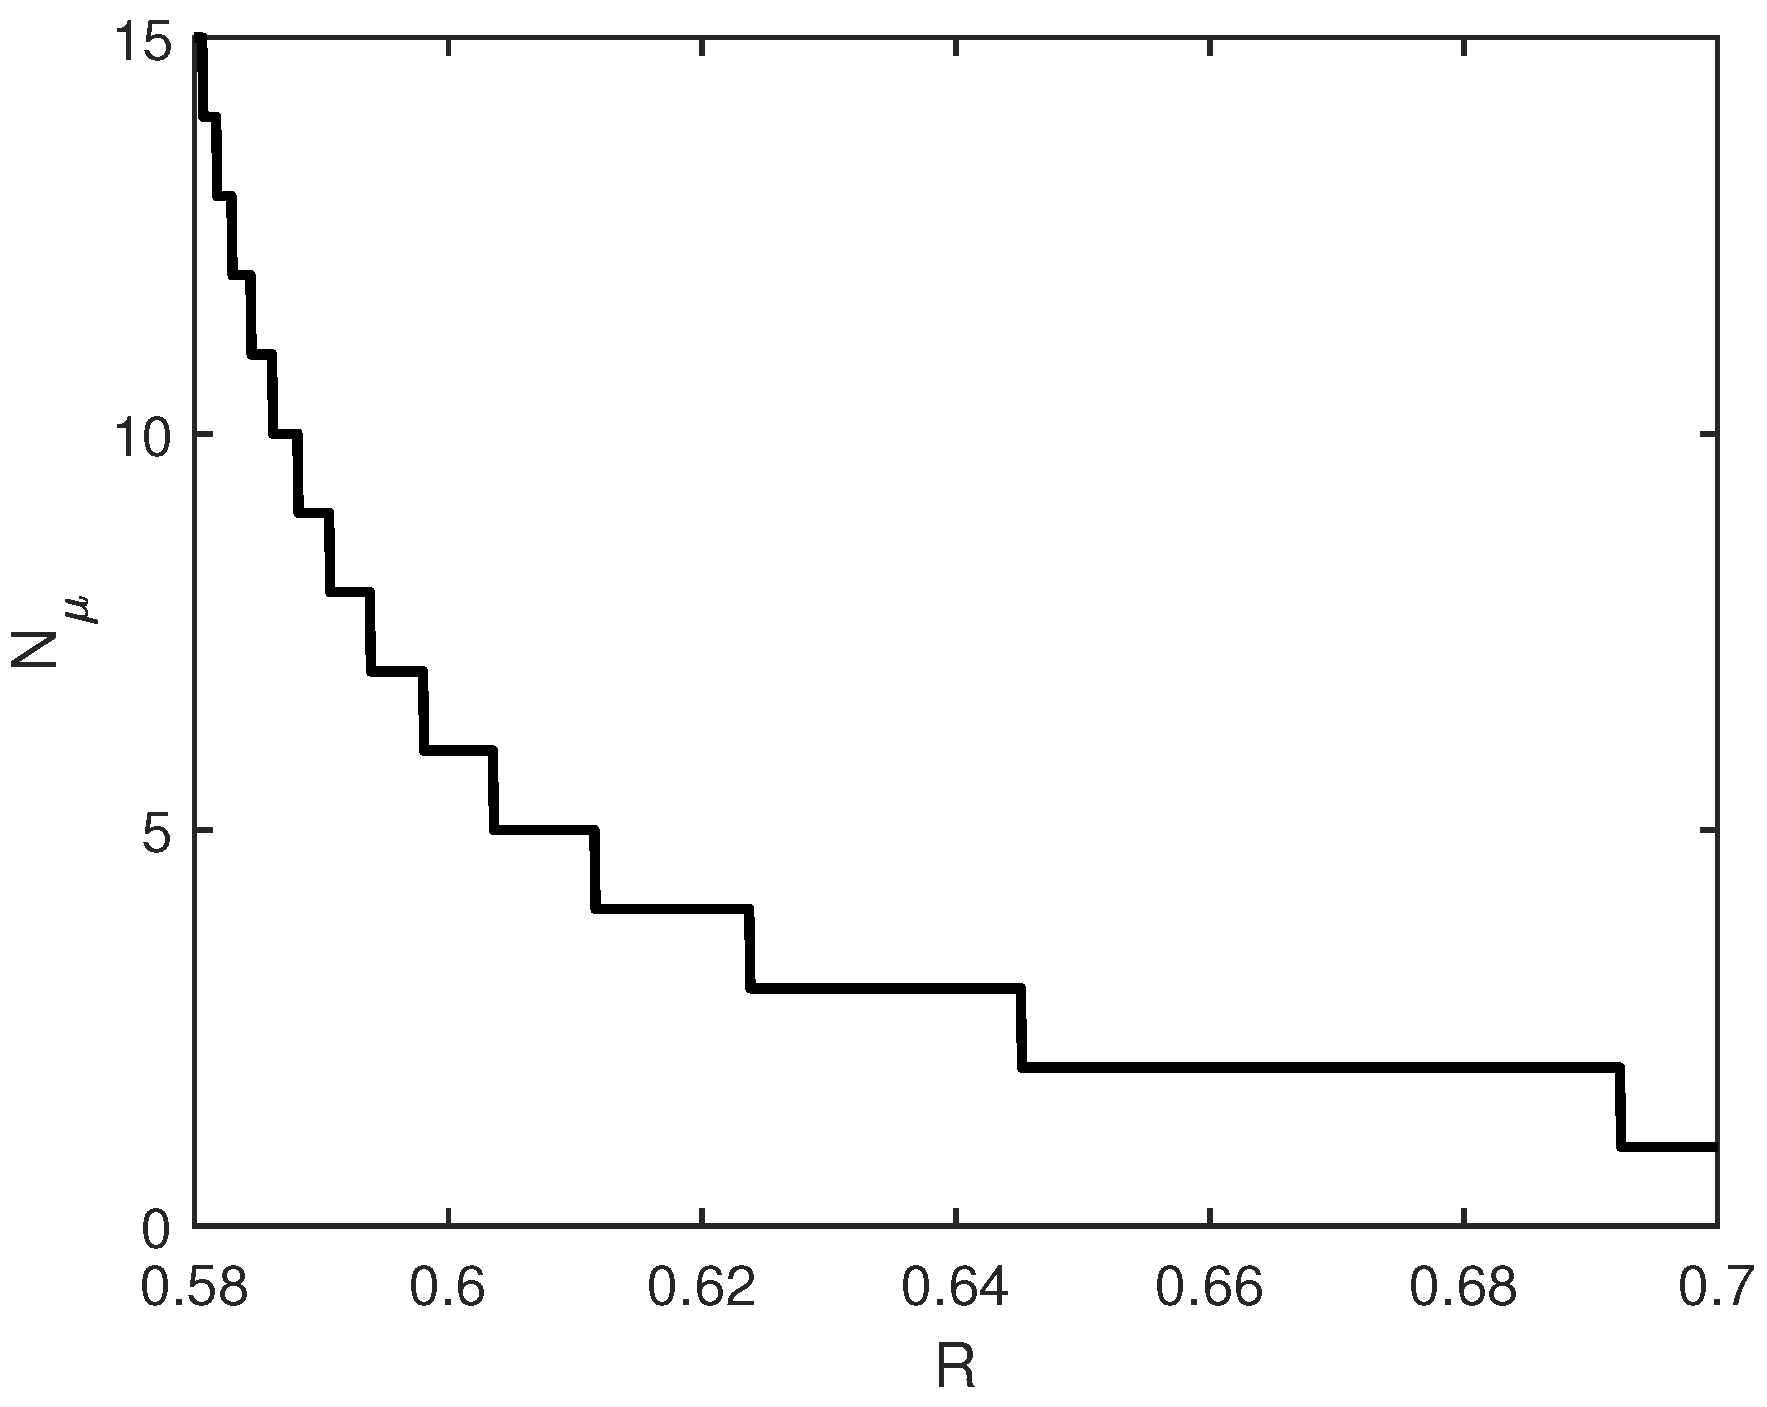
Further, Figure 7 shows how the critical number of issuers varies with the third key credit risk driver considered in this note: the recovery rate. This figure illustrates that the diversification of credit risk is more easily achieved, i.e., achieved with a smaller number of issuers, when the recovery rate is high.
I conclude this study with Table 1, which summarizes the main dependencies that can be derived from Equation (90) and that are exhibited in the figures. While a higher confidence looseness parameter, force of mean reversion, recovery rate, correlation of survival indicators, or survival probability all have a decreasing effect on the critical number of bonds, a higher volatility of interest rates or mean maturity of the portfolio has an opposite effect, namely leading to an increase in the critical number of bonds. The table recalls that both the initial level of interest rates and the mean-reversion level have no effect on the concentration/diversification of fixed income portfolios.
5. Conclusions and Extensions
This article provides a new framework for determining the critical number of lines that should constitute the fixed income portfolio of an institutional investor. It also analyzes the sensitivity of this critical number of lines with respect to some of the main interest rate risk and credit risk determinants. An important conclusion that arises from this study is that the concentration risk of defaultable assets cannot be analyzed without also considering interest rate risk. Then, within interest rate risk, the force of mean reversion component, which can be related to the force of central bank intervention, plays a critical role. As far as credit risk is concerned, it appears that more diversification is needed in the presence of lower recovery rates, correlations, or survival probabilities.
Investors can benefit from this study in several ways. First, investors can use this research to produce management tools providing them indications of the minimum number of fixed income issuers that should be included into their portfolios. Investing in ten or fifty different bonds does not involve the same amount of market analysis and bond portfolio manager time. Thus, algorithms that scientifically ground a reduction of the number of lines in portfolios are useful in the sense that they reduce management time. Then, this study is also useful in the sense that it provides tools to adapt investment strategies to the credit or interest rate situation prevailing on the market. Indeed, equipped with our results, it is possible to deduce whether one should increase or decrease the number of lines of bond portfolios, depending on the evolution of the main credit or interest rate factors.
Limitations of our study naturally arise from the interest rate risk and credit risk approaches that are retained. Thus, our study can be complemented by using a more sophisticated interest rate model and by taking into account more credit risk aspects. One could, for example, consider a model with two correlated factor rather than a simple Vasicek model to represent the dynamics of interest rates. Further, a broader consideration of credit risk could be introduced to include, for instance, ranking effects. For instance, it could be interesting to check whether a higher level of diversification is necessary for bonds with a lower rating.
Another possible extension of this paper could consist in the study of potential links between the negative rates that are considered in the Vasicek model and diversification risk. Further, one could consider portfolios of corporate bonds issued in a variety of currencies and with a variety of maturities. Finally, incorporating this diversification framework into a broader market-consistent framework for computing capital requirements could also be interesting for providing a better understanding of the risk management of institutional investors.
While the risk indicator considered in this paper is the coefficient of variation, other risk indicators that focus on distribution tails can be chosen. An extension of this paper could consist in examining the diversification of fixed income portfolios when the risk indicator is the Value-at-Risk or the Tail Value-at-Risk. Without additional assumptions, the computations in this framework will be purely numerical. However, a semi-numerical approach could be developed by assuming the comonotonicity of the stochastic contributions (see, for instance, Dhaene et al. (2006)). In this case, the Value-at-Risk of the fixed income portfolio can be written as follows:
while the expression of the Tail VaR is
where in these formulas the recovery payments can be made early and each bond is allowed to have a distinct maturity. The computation of these formulas can be achieved, for instance, by using Monte Carlo simulations, where the goal is to examine the impact of the number of bonds on the value of the risk indicator. Let us finally note that all the bonds considered in this paper are zero-coupon bonds. However, this is not at all a restricting assumption because any coupon bond can be decomposed into a series of zero-coupon bonds via stripping.
Funding
This research did not receive academic grants.
Acknowledgments
This article was produced following deep discussions with members of the SMA Group. The author wishes to thank Philippe Desurmont, Eric Leblond, Mohamed Majri, and Christian Walter for their comments on this research. The author is also thankful to Jérémy Allali, Anthony Floryszczak, François-Xavier de Lauzon, and Hubert Rodarie for broader discussions on related topics.
Conflicts of Interest
The author declares no conflict of interest.
Appendix A
Derivation of the third term in the right-hand-side of Equation (59).
Let us start by recalling that, for any two independent random variables X and Y,
Therefore,
or, because the recovery rates are constant in this setting,
Next, let us compute:
where it is possible to recognize
Finally,
| 1 | The reader interested in computing the smallest integer such that
|
| 2 | This simplifying assumption can be justified by the fact that, due to the timing of legal procedures, the recovery amount is not paid at time , but later on. A subsequent footnote explains how it is possible to deal with the situation where the recovery amount is paid at the time of default. |
| 3 | When the recovery amount is paid at the time of default, it is possible to modify Equation (36) as follows:
|
| 4 | When recovery payments are made early, the expression of the variance becomes
|
| 5 | Given the current set of hypotheses, the tower property of conditional variance, which usually states that the variance equals the expectation of the conditional variance plus the variance of the conditional expectation, simplifies to the variance being equal to the expectation of the conditional variance. Indeed, because the conditional expectation is a function of the intensity and because the intensity is now constant, the variance of the conditional expectation is null. |
| 6 | For this equation, it is possible to observe that, given the current set of hypotheses, the covariance reduces to the expectation of the conditional covariance. |
| 7 | The reader interested in computing the smallest integer such that
|
| 8 | Note that, while the confidence looseness parameter is arbitrarily chosen by the investor, the credit risk parameters can be calibrated using, e.g., data from Moody’s, the interest rate risk parameters can be calibrated using, e.g., data from Bloomberg, and the mean maturity of bonds is directly known from the portfolio of bonds owned by the investor. |
References
- Allali, Jeremy, Olivier Le Courtois, and Mohamed Majri. 2018. Credit risk and solvency capital requirements. European Actuarial Journal 8: 487–515. [Google Scholar] [CrossRef]
- Cerreia-Vioglio, Simone, Fabio Maccheroni, Massimo Marinacci, and Luigi Montrucchio. 2011. Risk measures: Rationality and diversification. Mathematical Finance 21: 743–74. [Google Scholar] [CrossRef]
- Dhaene, Jan, Steven Vanduffel, Marc J. Goovaerts, Rob Kaas, Qihe Tang, and David Vyncke. 2006. Risk measures and comonotonicity: A review. Stochastic Models 22: 573–606. [Google Scholar] [CrossRef] [Green Version]
- Dynkin, Lev, Jay Hyman, and Vadim Konstantinovsky. 2002. Sufficient diversification in credit portfolios. Journal of Portfolio Management 29: 89–114. [Google Scholar] [CrossRef]
- Heckel, Thomas, Zine Amghar, Isaac Haik, Olivier Laplénie, and Raul Leote de Carvalho. 2020. Factor Investing in Corporate Bond Markets: Enhancing Efficacy Through Diversification and Purification! Journal of Fixed Income 29: 6–21. [Google Scholar] [CrossRef]
- Hofmann, Norbert, and Eckhard Platen. 2000. Approximating large diversified portfolios. Mathematical Finance 10: 77–88. [Google Scholar] [CrossRef]
- Hunter, Delroy M., and David P. Simon. 2004. Benefits of international bond diversification. Journal of Fixed Income 13: 57–72. [Google Scholar] [CrossRef]
- Jarrow, Robert A., David Lando, and Fan Yu. 2005. Default risk and diversification: Theory and empirical implications. Mathematical Finance 15: 1–26. [Google Scholar] [CrossRef]
- Jouanin, Jean-Frédéric, Grégory Rapuch, Gaël Riboulet, and Thierry Roncalli. 2001. Modeling Dependence for Credit Derivatives with Copulas. Working Paper. Rochester: SSRN. [Google Scholar]
- Konstantinov, Gueorgui. 2017. On the Dynamics of EMU Bond Portfolios: Is the Diversification of Risk Factors Driving to Convergence of Fund Exposure? Journal of Investing 26: 91–101. [Google Scholar] [CrossRef]
- Kurtz, Cornelius, Eva Lütkebohmert, and Julian Sester. 2018. Calculating capital charges for sector concentration risk. Journal of Credit Risk 10: 35–67. [Google Scholar] [CrossRef]
- Le Courtois, Olivier, Mohamed Majri, and Li Shen. 2021. Utility-consistent valuation schemes for the own risk and solvency assessment of life insurance companies. Asia-Pacific Journal of Risk and Insurance 15: 47–79. [Google Scholar]
- Le Courtois, Olivier, and Christian Walter. 2014. Extreme Financial Risks and Asset Allocation. London: Imperial College Press. [Google Scholar]
- Leland, Hayne E., and Klaus Bjerre Toft. 1996. Optimal capital structure, endogenous bankruptcy, and the term structure of credit spreads. Journal of Finance 51: 987–1019. [Google Scholar] [CrossRef]
- Levy, Haim, and Zvi Lerman. 1988. The benefits of international diversification in bonds. Financial Analysts Journal 44: 56–64. [Google Scholar] [CrossRef]
- Longstaff, Francis A., and Eduardo S. Schwartz. 1995. A simple approach to valuing risky fixed and floating rate debt. Journal of Finance 50: 789–820. [Google Scholar] [CrossRef]
- Markowitz, Harry. 1952. Portfolio Selection. Journal of Finance 7: 77–91. [Google Scholar]
- Merton, Robert C. 1974. On the pricing of corporate debt: The risk structure of interest rates. Journal of Finance 29: 449–70. [Google Scholar]
- Mitton, Todd, and Keith Vorkink. 2007. Equilibrium underdiversification and the preference for skewness. Review of Financial Studies 20: 1255–88. [Google Scholar] [CrossRef]
- Peta, John L. 1993. International bond diversification. Journal of Fixed Income 3: 37–46. [Google Scholar] [CrossRef]
- Saardchom, Narumon. 2018. Credit Risk Diversification as an Incentive for Japanese Bank Mergers. Academy of Strategic Management Journal 17: 1–17. [Google Scholar]
- Schönbucher, Philipp J. 2003. Credit Derivatives Pricing Models. Hoboken: Wiley Finance. [Google Scholar]
- Uppal, Raman, and Tan Wang. 2003. Model misspecification and underdiversification. Journal of Finance 58: 2465–81. [Google Scholar] [CrossRef]
- Van Nieuwerburgh, Stijn, and Laura Veldkamp. 2010. Information acquisition and under-diversification. Review of Economic Studies 77: 779–805. [Google Scholar] [CrossRef] [Green Version]
- Varotto, Simone. 2003. Credit Risk Diversification: Evidence from the Eurobond Market. Working Paper No 199. London: Bank of England. [Google Scholar]
- Vasicek, Oldrich Alfons. 1977. An equilibrium characterization of the term structure. Journal of Financial Economics 5: 177–88. [Google Scholar] [CrossRef]
- Vasicek, Oldrich Alfons. 1987. Probability of Loss on Loan Portfolio. Hoboken: Wiley, pp. 143–46. [Google Scholar]
- Vasicek, Oldrich Alfons. 1991. Limiting loan loss probability distribution. In Finance, Economics, and Mathematics. Hoboken: Wiley, pp. 147–48. [Google Scholar]
- Vasicek, Oldrich Alfons. 2002. The distribution of loan portfolio value. Risk 15: 160–62. [Google Scholar]
- Wu, Dexiang, and Desheng Dash Wu. 2018. Credit Risk Control and Management using Limited Diversification. Journal of Risk Research 24: 1–14. [Google Scholar] [CrossRef] [Green Version]
Figure 1.
Minimum number of bonds w.r.t. confidence looseness ().
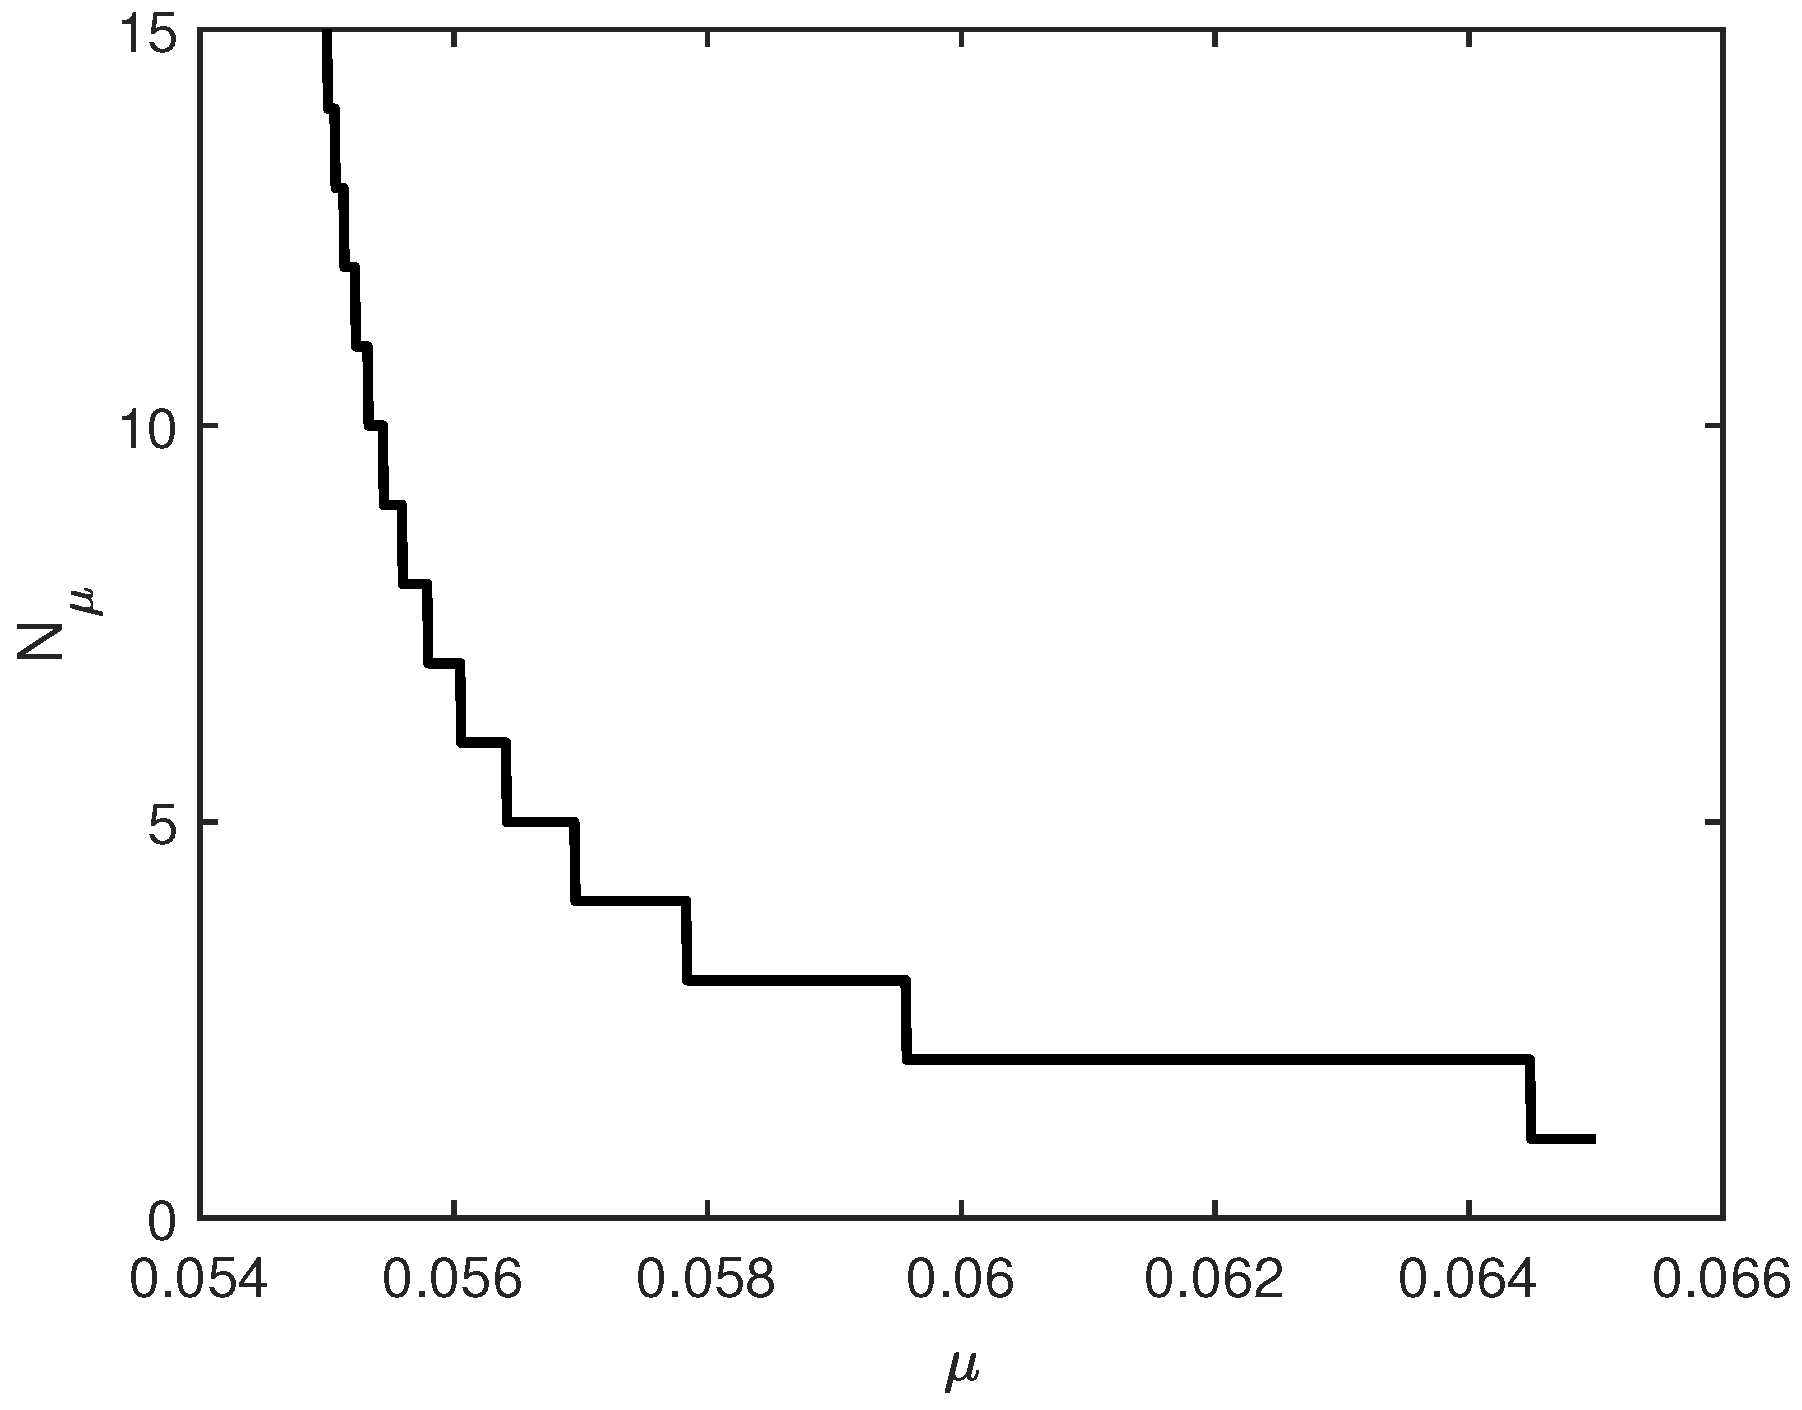
Figure 2.
Minimum number of bonds w.r.t. mean maturity (T).

Figure 3.
Minimum number of bonds w.r.t. short term rate volatility ().

Figure 4.
Minimum number of bonds w.r.t. force of mean reversion (a).

Figure 5.
Minimum number of bonds w.r.t. survival probability (q).

Figure 6.
Minimum number of bonds w.r.t. correlation of survival indicators ().

Figure 7.
Minimum number of bonds w.r.t. recovery rate (R).

Table 1.
Effect of main parameters on diversification.
| Effect of | on |
|---|---|
| (Confidence Looseness) | ↘ |
| (Initial Value of Risk-Free Rate) | → |
| b (Mean Reversion Value of Risk-Free Rate) | → |
| a (Force of Mean Reversion of Risk-Free Rate) | ↘ |
| (Vol of Short-Term Risk-Free Rate) | ↗ |
| T (Mean Maturity of Portfolio) | ↗ |
| R (Recovery Rate) | ↘ |
| (Correlation of Survival Indicators) | ↘ |
| q (Survival Probability) | ↘ |
Publisher’s Note: MDPI stays neutral with regard to jurisdictional claims in published maps and institutional affiliations. |
© 2022 by the author. Licensee MDPI, Basel, Switzerland. This article is an open access article distributed under the terms and conditions of the Creative Commons Attribution (CC BY) license (https://creativecommons.org/licenses/by/4.0/).
Share and Cite
MDPI and ACS Style
Le Courtois, O. On the Diversification of Fixed Income Assets. Risks 2022, 10, 31. https://doi.org/10.3390/risks10020031
AMA Style
Le Courtois O. On the Diversification of Fixed Income Assets. Risks. 2022; 10(2):31. https://doi.org/10.3390/risks10020031
Chicago/Turabian StyleLe Courtois, Olivier. 2022. "On the Diversification of Fixed Income Assets" Risks 10, no. 2: 31. https://doi.org/10.3390/risks10020031
Note that from the first issue of 2016, this journal uses article numbers instead of page numbers. See further details here.