
Effects on Bone and Muscle upon Treadmill Interval Training in Hypogonadal Male Rats
 , , ,
, , ,
Abstract
:1. Introduction
2. Materials and Methods
2.1. Experimental Setup and Groups
2.2. Castration and Sham Castration
2.3. Training Protocol
2.4. Muscle Force Measurement
2.5. X-ray Micro-Computed Tomography (µCT)
2.6. Biomechanical Analysis for the Tibia
2.7. Collagen Deposition
2.8. Muscle Fiber Diameter
2.9. Muscle Fiber Coverage
2.10. Serum Testosterone Enzyme-Linked Immunosorbent Assay (ELISA)
2.11. Statistical Analysis
3. Results
3.1. General Observation
3.2. Serum Testosterone
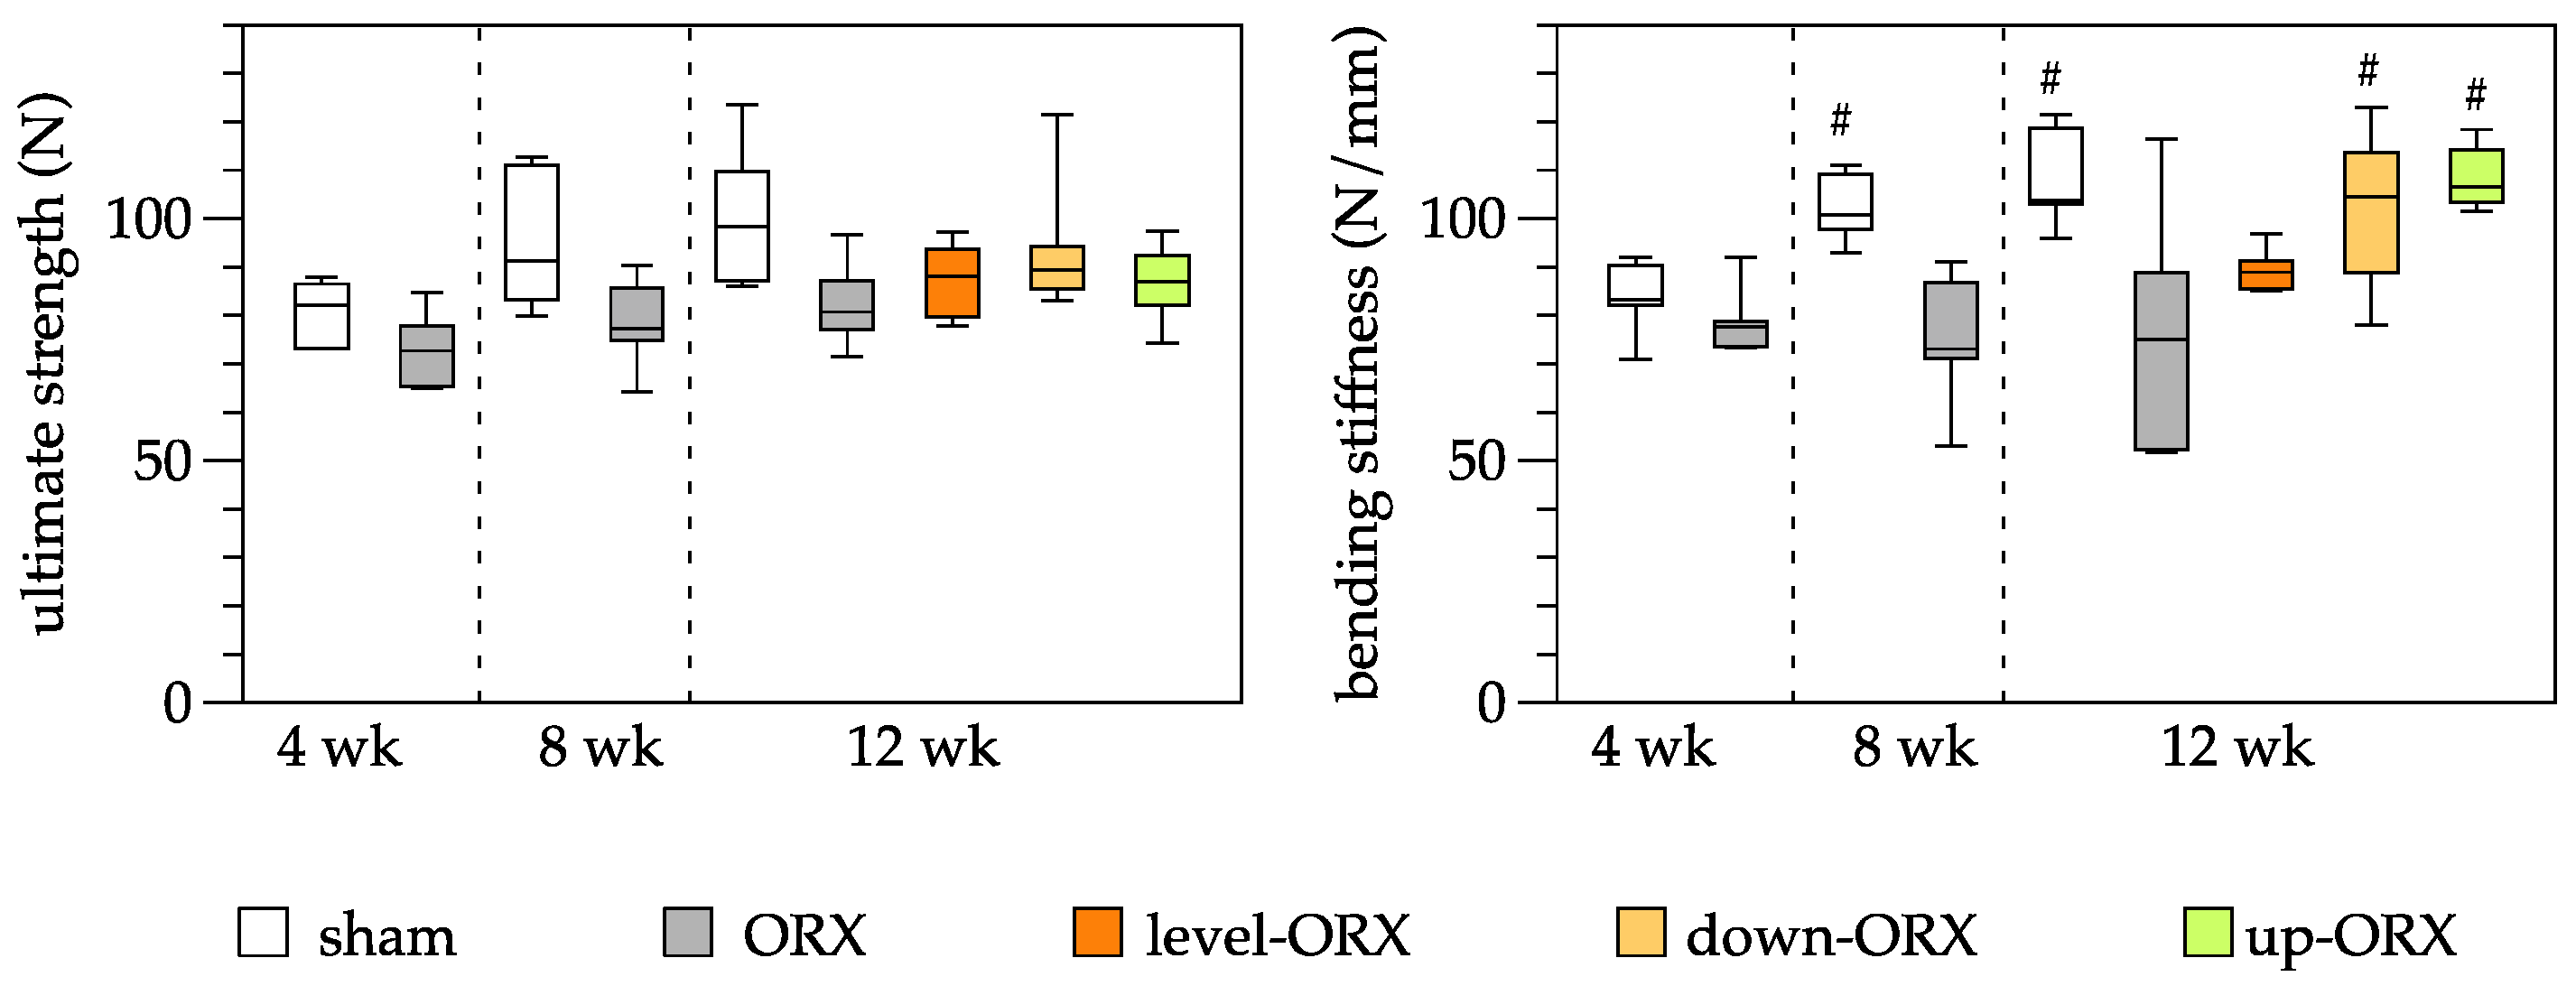
3.3. Bone
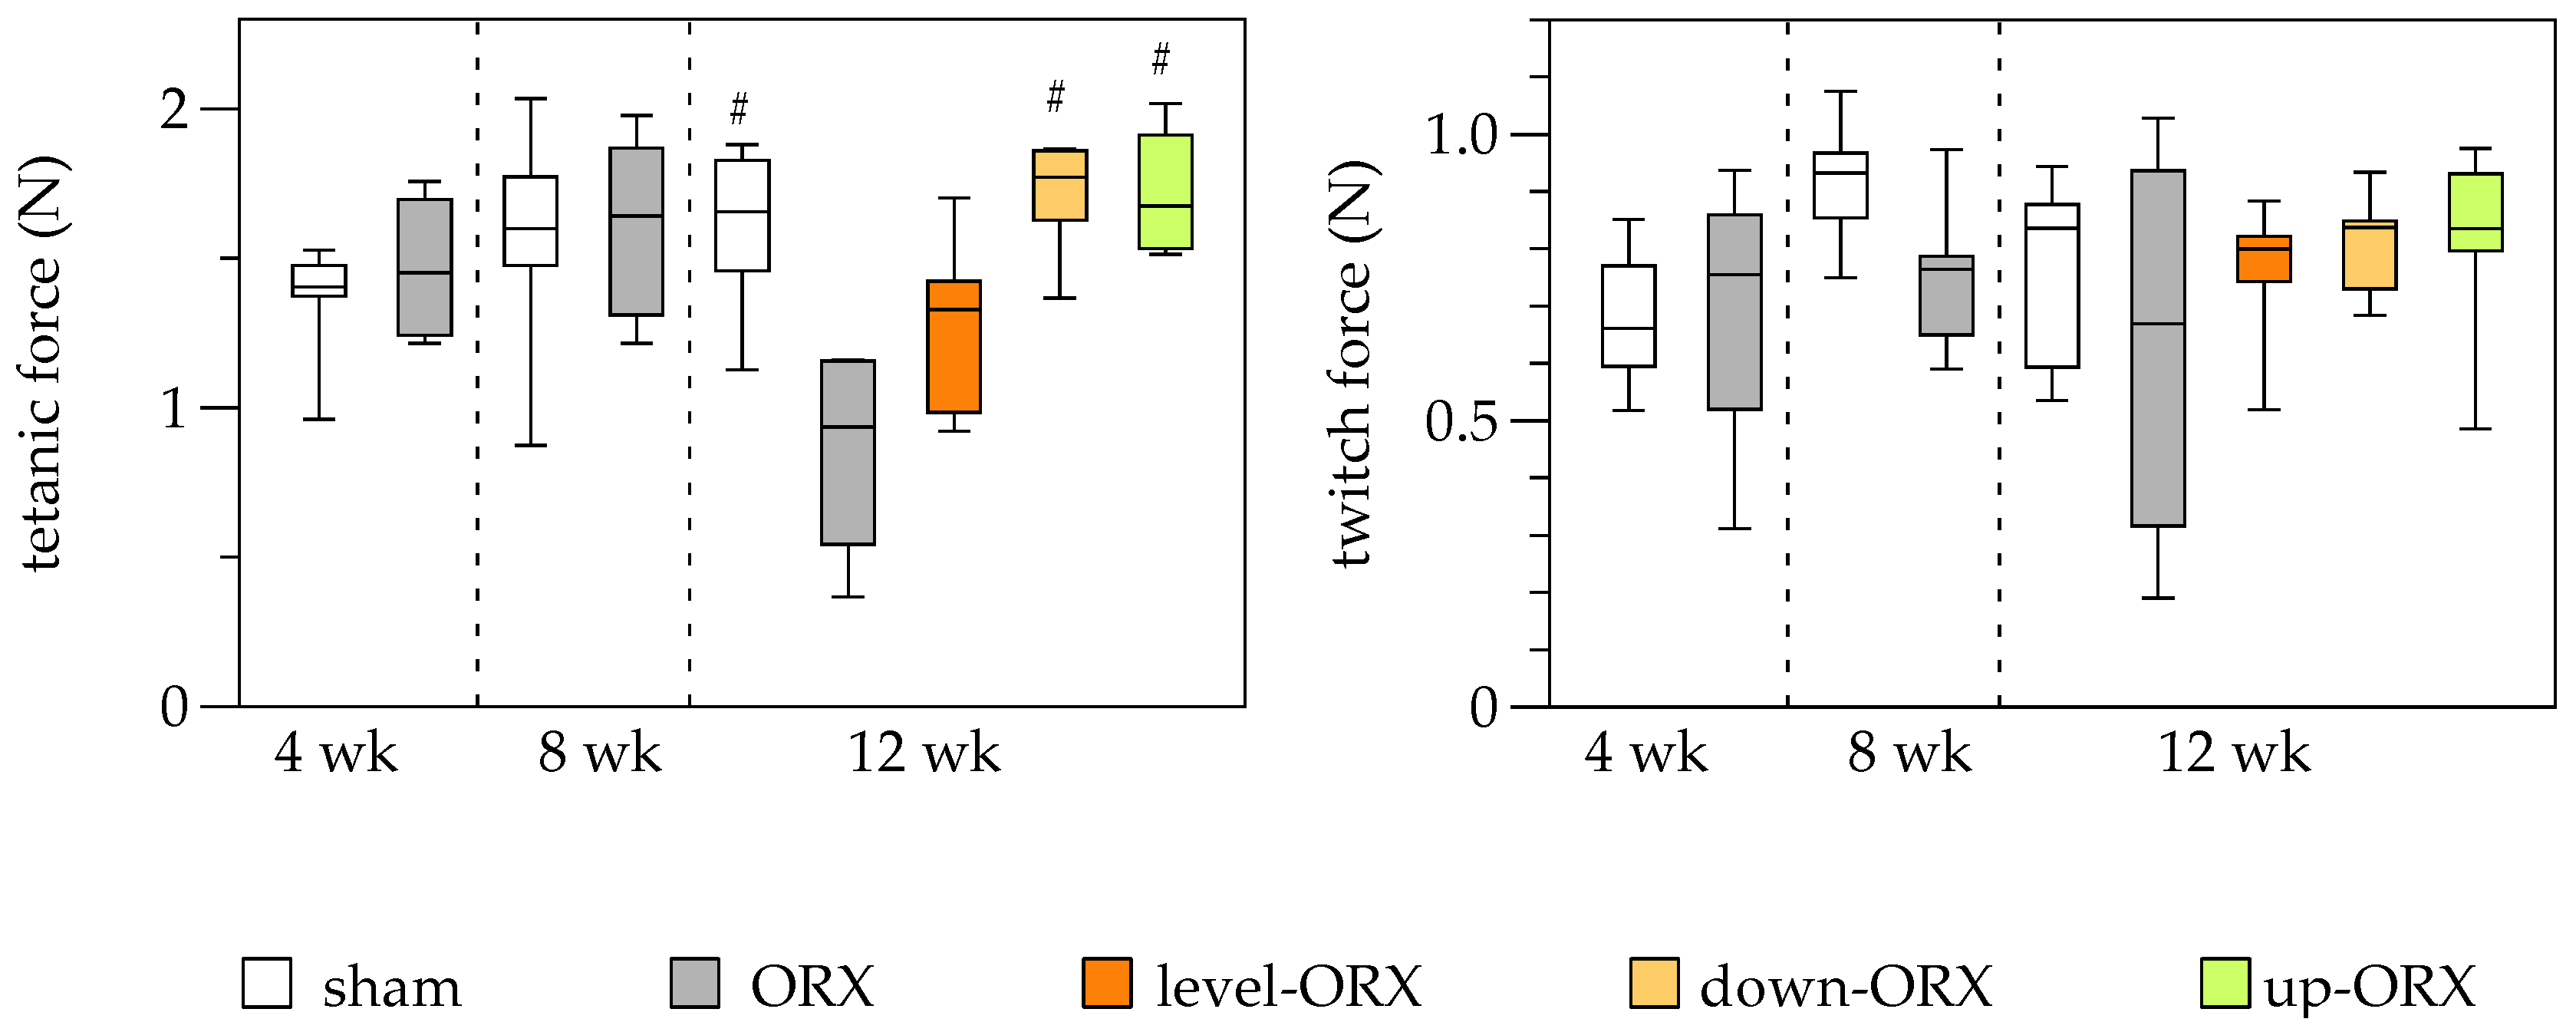
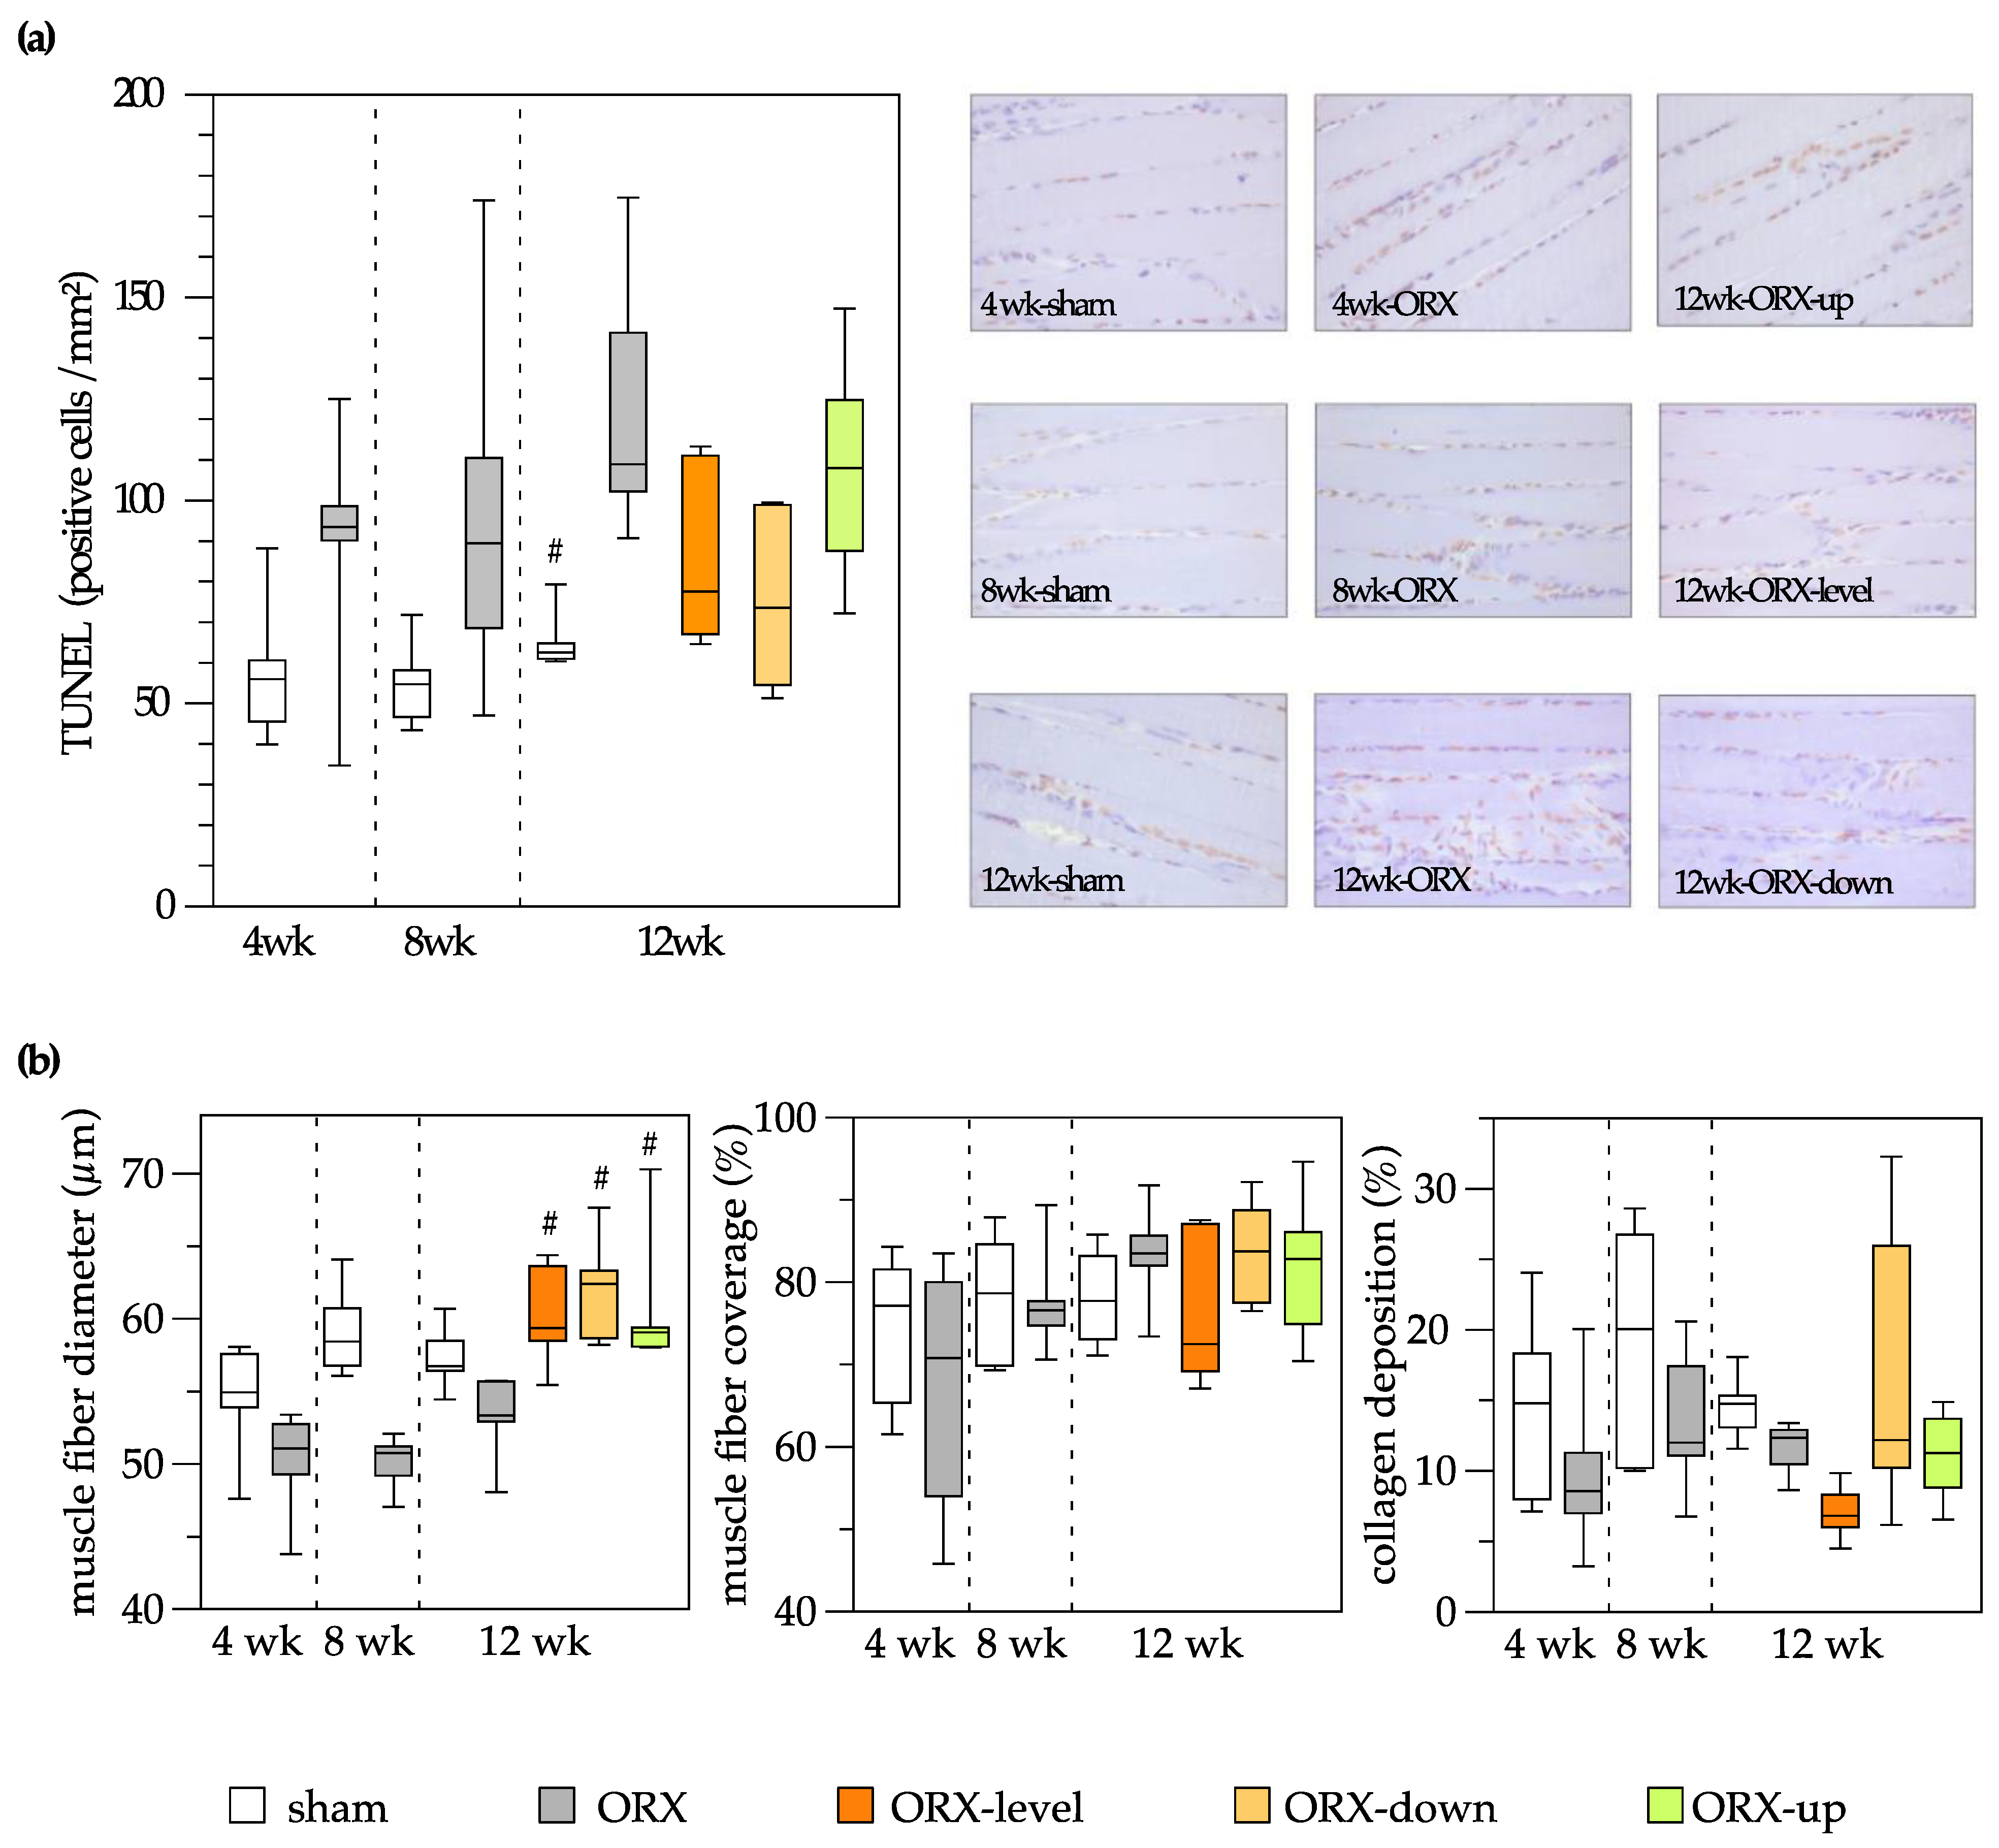
3.4. Muscle
3.5. Bone and Muscle
4. Discussion
5. Conclusions
Author Contributions
Funding
Institutional Review Board Statement
Informed Consent Statement
Data Availability Statement
Conflicts of Interest
References
- Kumar, P.; Kumar, N.; Thakur, D.S.; Patidar, A. Male hypogonadism: Symptoms and treatment. J. Adv. Pharm. Technol. Res. 2010, 1, 297–301. [Google Scholar] [CrossRef] [PubMed]
- Yeo, S.; Holl, K.; Penaherrera, N.; Wissinger, U.; Anstee, K.; Wyn, R. Burden of Male Hypogonadism and Major Comorbidities, and the Clinical, Economic, and Humanistic Benefits of Testosterone Therapy: A Narrative Review. Clinicoecon. Outcomes Res. 2021, 13, 31–38. [Google Scholar] [CrossRef] [PubMed]
- Anaissie, J.; DeLay, K.J.; Wang, W.; Hatzichristodoulou, G.; Hellstrom, W.J. Testosterone deficiency in adults and corresponding treatment patterns across the globe. Transl. Androl. Urol. 2017, 6, 183–191. [Google Scholar] [CrossRef] [PubMed]
- Saad, F.; Rohrig, G.; von Haehling, S.; Traish, A. Testosterone Deficiency and Testosterone Treatment in Older Men. Gerontology 2017, 63, 144–156. [Google Scholar] [CrossRef] [PubMed]
- Ketchem, J.M.; Bowman, E.J.; Isales, C.M. Male sex hormones, aging, and inflammation. Biogerontology 2023, 24, 1–25. [Google Scholar] [CrossRef] [PubMed]
- Aguirre, L.E.; Colleluori, G.; Dorin, R.; Robbins, D.; Chen, R.; Jiang, B.; Qualls, C.; Villareal, D.T.; Armamento-Villareal, R. Hypogonadal Men with Higher Body Mass Index have Higher Bone Density and Better Bone Quality but Reduced Muscle Density. Calcif. Tissue Int. 2017, 101, 602–611. [Google Scholar] [CrossRef]
- Santos, H.O.; Cadegiani, F.A.; Forbes, S.C. Nonpharmacological Interventions for the Management of Testosterone and Sperm Parameters: A Scoping Review. Clin. Ther. 2022, 44, 1129–1149. [Google Scholar] [CrossRef]
- Park, J.H.; Moon, J.H.; Kim, H.J.; Kong, M.H.; Oh, Y.H. Sedentary Lifestyle: Overview of Updated Evidence of Potential Health Risks. Korean J. Fam. Med. 2020, 41, 365–373. [Google Scholar] [CrossRef]
- Maimoun, L.; Sultan, C. Effects of physical activity on bone remodeling. Metabolism 2011, 60, 373–388. [Google Scholar] [CrossRef]
- Burr, D.B. Muscle strength, bone mass, and age-related bone loss. J. Bone Miner. Res. 1997, 12, 1547–1551. [Google Scholar] [CrossRef]
- Vogt, M.; Hoppeler, H.H. Eccentric exercise: Mechanisms and effects when used as training regime or training adjunct. J. Appl. Physiol. 2014, 116, 1446–1454. [Google Scholar] [CrossRef] [PubMed]
- Rodio, A.; Fattorini, L. Downhill walking to improve lower limb strength in healthy young adults. Eur. J. Sport Sci. 2014, 14, 806–812. [Google Scholar] [CrossRef] [PubMed]
- Hamann, N.; Kohler, T.; Muller, R.; Bruggemann, G.P.; Niehoff, A. The effect of level and downhill running on cortical and trabecular bone in growing rats. Calcif. Tissue Int. 2012, 90, 429–437. [Google Scholar] [CrossRef]
- Dewolf, A.H.; Penailillo, L.E.; Willems, P.A. The rebound of the body during uphill and downhill running at different speeds. J. Exp. Biol. 2016, 219, 2276–2288. [Google Scholar] [CrossRef]
- Barry, D.W.; Kohrt, W.M. BMD decreases over the course of a year in competitive male cyclists. J. Bone Miner. Res. 2008, 23, 484–491. [Google Scholar] [CrossRef]
- Stratos, I.; Behrendt, A.K.; Anselm, C.; Gonzalez, A.; Mittlmeier, T.; Vollmar, B. Inhibition of TNF-alpha Restores Muscle Force, Inhibits Inflammation, and Reduces Apoptosis of Traumatized Skeletal Muscles. Cells 2022, 11, 2397. [Google Scholar] [CrossRef]
- Almeida, M.; Laurent, M.R.; Dubois, V.; Claessens, F.; O’Brien, C.A.; Bouillon, R.; Vanderschueren, D.; Manolagas, S.C. Estrogens and Androgens in Skeletal Physiology and Pathophysiology. Physiol. Rev. 2017, 97, 135–187. [Google Scholar] [CrossRef]
- Shigehara, K.; Izumi, K.; Kadono, Y.; Mizokami, A. Testosterone and Bone Health in Men: A Narrative Review. J. Clin. Med. 2021, 10, 530. [Google Scholar] [CrossRef]
- Vanderschueren, D.; Laurent, M.R.; Claessens, F.; Gielen, E.; Lagerquist, M.K.; Vandenput, L.; Borjesson, A.E.; Ohlsson, C. Sex steroid actions in male bone. Endocr. Rev. 2014, 35, 906–960. [Google Scholar] [CrossRef]
- Carson, J.A.; Manolagas, S.C. Effects of sex steroids on bones and muscles: Similarities, parallels, and putative interactions in health and disease. Bone 2015, 80, 67–78. [Google Scholar] [CrossRef] [PubMed]
- Ryu, S.J.; Ryu, D.S.; Kim, J.Y.; Park, J.Y.; Kim, K.H.; Chin, D.K.; Kim, K.S.; Cho, Y.E.; Kuh, S.U. Bone Mineral Density Changes after Orchiectomy using a Scrotal Approach in Rats. Korean J. Spine 2015, 12, 55–59. [Google Scholar] [CrossRef] [PubMed]
- Ip, T.Y.; Peterson, J.; Byrner, R.; Tou, J.C. Bone responses to body weight and moderate treadmill exercising in growing male obese (fa/fa) and lean Zucker rats. J. Musculoskelet. Neuronal Interact. 2009, 9, 155–166. [Google Scholar] [PubMed]
- Joo, Y.I.; Sone, T.; Fukunaga, M.; Lim, S.G.; Onodera, S. Effects of endurance exercise on three-dimensional trabecular bone microarchitecture in young growing rats. Bone 2003, 33, 485–493. [Google Scholar] [CrossRef] [PubMed]
- Huang, T.H.; Chang, F.L.; Lin, S.C.; Liu, S.H.; Hsieh, S.S.; Yang, R.S. Endurance treadmill running training benefits the biomaterial quality of bone in growing male Wistar rats. J. Bone Miner. Metab. 2008, 26, 350–357. [Google Scholar] [CrossRef]
- Warner, S.E.; Shea, J.E.; Miller, S.C.; Shaw, J.M. Adaptations in cortical and trabecular bone in response to mechanical loading with and without weight bearing. Calcif. Tissue Int. 2006, 79, 395–403. [Google Scholar] [CrossRef]
- Okubo, R.; Sanada, L.S.; Castania, V.A.; Louzada, M.J.; de Paula, F.J.; Maffulli, N.; Shimano, A.C. Jumping exercise preserves bone mineral density and mechanical properties in osteopenic ovariectomized rats even following established osteopenia. Osteoporos. Int. 2017, 28, 1461–1471. [Google Scholar] [CrossRef]
- Hagihara, Y.; Fukuda, S.; Goto, S.; Iida, H.; Yamazaki, M.; Moriya, H. How many days per week should rats undergo running exercise to increase BMD? J. Bone Miner Metab. 2005, 23, 289–294. [Google Scholar] [CrossRef]
- Hawkins, S.A.; Schroeder, E.T.; Wiswell, R.A.; Jaque, S.V.; Marcell, T.J.; Costa, K. Eccentric muscle action increases site-specific osteogenic response. Med. Sci. Sports Exerc. 1999, 31, 1287–1292. [Google Scholar] [CrossRef]
- Schroeder, E.T.; Hawkins, S.A.; Jaque, S.V. Musculoskeletal adaptations to 16 weeks of eccentric progressive resistance training in young women. J. Strength Cond. Res. 2004, 18, 227–235. [Google Scholar] [CrossRef]
- Oner, J.; Oner, H.; Sahin, Z.; Demir, R.; Ustunel, I. Melatonin is as effective as testosterone in the prevention of soleus muscle atrophy induced by castration in rats. Anat. Rec. 2008, 291, 448–455. [Google Scholar] [CrossRef]
- Roghani, T.; Torkaman, G.; Movasseghe, S.; Hedayati, M.; Goosheh, B.; Bayat, N. Effects of short-term aerobic exercise with and without external loading on bone metabolism and balance in postmenopausal women with osteoporosis. Rheumatol. Int. 2013, 33, 291–298. [Google Scholar] [CrossRef] [PubMed]
- Gunendi, Z.; Ozyemisci-Taskiran, O.; Demirsoy, N. The effect of 4-week aerobic exercise program on postural balance in postmenopausal women with osteoporosis. Rheumatol. Int. 2008, 28, 1217–1222. [Google Scholar] [CrossRef] [PubMed]
- Chien, M.Y.; Wu, Y.T.; Hsu, A.T.; Yang, R.S.; Lai, J.S. Efficacy of a 24-week aerobic exercise program for osteopenic postmenopausal women. Calcif. Tissue Int. 2000, 67, 443–448. [Google Scholar] [CrossRef] [PubMed]
- Petroianu, A.; Veloso, D.F.; Alberti, L.R.; Figueiredo, J.A.; Rodrigues, F.H. Is there a relationship between physical performance and orchiectomy? Andrologia 2010, 42, 302–304. [Google Scholar] [CrossRef]
- Takahashi, K.; Kitaoka, Y.; Hatta, H. Effects of endurance training on metabolic enzyme activity and transporter protein levels in the skeletal muscles of orchiectomized mice. J. Physiol. Sci. 2022, 72, 14. [Google Scholar] [CrossRef]
- Uth, J.; Hornstrup, T.; Schmidt, J.F.; Christensen, J.F.; Frandsen, C.; Christensen, K.B.; Helge, E.W.; Brasso, K.; Rorth, M.; Midtgaard, J.; et al. Football training improves lean body mass in men with prostate cancer undergoing androgen deprivation therapy. Scand. J. Med. Sci. Sports 2014, 24 (Suppl. 1), 105–112. [Google Scholar] [CrossRef]
- Nilsen, T.S.; Thorsen, L.; Fossa, S.D.; Wiig, M.; Kirkegaard, C.; Skovlund, E.; Benestad, H.B.; Raastad, T. Effects of strength training on muscle cellular outcomes in prostate cancer patients on androgen deprivation therapy. Scand. J. Med. Sci. Sports 2016, 26, 1026–1035. [Google Scholar] [CrossRef]
- Kim, J.S.; Lee, Y.H.; Yi, H.K. Gradual downhill running improves age-related skeletal muscle and bone weakness: Implication of autophagy and bone morphogenetic proteins. Exp. Physiol. 2016, 101, 1528–1540. [Google Scholar] [CrossRef]
- Kim, J.S.; Jeon, J.; An, J.J.; Yi, H.K. Interval running training improves age-related skeletal muscle wasting and bone loss: Experiments with ovariectomized rats. Exp. Physiol. 2019, 104, 691–703. [Google Scholar] [CrossRef]
- Augat, P.; Schorlemmer, S. The role of cortical bone and its microstructure in bone strength. Age Ageing 2006, 35 (Suppl. 2), ii27–ii31. [Google Scholar] [CrossRef]
- Maurel, D.B.; Boisseau, N.; Pallu, S.; Rochefort, G.Y.; Benhamou, C.L.; Jaffre, C. Regular exercise limits alcohol effects on trabecular, cortical thickness and porosity, and osteocyte apoptosis in the rat. Jt. Bone Spine 2013, 80, 492–498. [Google Scholar] [CrossRef] [PubMed]
- Turner, C.H.; Robling, A.G. Mechanisms by which exercise improves bone strength. J. Bone Miner. Metab. 2005, 23 (Suppl. S1), 16–22. [Google Scholar] [CrossRef] [PubMed]
- Van der Linden, J.C.; Weinans, H. Effects of microarchitecture on bone strength. Curr. Osteoporos. Rep. 2007, 5, 56–61. [Google Scholar] [CrossRef] [PubMed]
- Notomi, T.; Okazaki, Y.; Okimoto, N.; Tanaka, Y.; Nakamura, T.; Suzuki, M. Effects of tower climbing exercise on bone mass, strength, and turnover in orchidectomized growing rats. J. Appl. Physiol. 2002, 93, 1152–1158. [Google Scholar] [CrossRef]
- Notomi, T.; Lee, S.J.; Okimoto, N.; Okazaki, Y.; Takamoto, T.; Nakamura, T.; Suzuki, M. Effects of resistance exercise training on mass, strength, and turnover of bone in growing rats. Eur. J. Appl. Physiol. 2000, 82, 268–274. [Google Scholar] [CrossRef]
- Horcajada, M.; Coxam, V.; Davicco, M.; Gaumet, N.; Pastoureau, P.; Leterrier, C.; Culioli, J.; Barlet, J. Influence of treadmill running on femoral bone in young orchidectomized rats. J. Appl. Physiol. 1997, 83, 129–133. [Google Scholar] [CrossRef]
- Horcajada-Molteni, M.N.; Davicco, M.J.; Coxam, V.; Lebecque, P.; Dominguez, B.; Ritz, P.; Culioli, J.; Barlet, J.P. Treadmill running starting 3 months after orchidectomy restores femoral bone mass in rats. Eur. J. Appl. Physiol. Occup. Physiol. 1999, 79, 251–259. [Google Scholar] [CrossRef]


| 4. Week Sham | 4. Week ORX | 8. Week Sham | 8. Week ORX | 12. Week Sham | 12. Week ORX | 12. Week Level-ORX | 12. Week Down-ORX | 12. Week Up-ORX | |
|---|---|---|---|---|---|---|---|---|---|
| Cortical bone | |||||||||
| T.Ar | 11.52 ± 0.14 | 10.80 ± 0.88 | 12.40 ± 0.44 | 11.09 ± 0.84 | 12.53 ± 0.75 | 11.32 ± 1.19 | 10.82 ± 1.09 * | 11.81 ± 0.62 | 11.50 ± 1.19 |
| B.Ar | 7.63 ± 0.32 | 7.09 ± 0.39 | 8.33 ± 0.24 | 7.60 ± 0.56 | 8.98 ± 0.42 | 8.17 ± 0.7 | 7.80 ± 0.57 * | 8.26 ± 0.68 | 8.02 ± 0.52 * |
| B.Ar/T.Ar | 66.20 ± 2.24 | 65.80 ± 2.20 | 67.23 ± 0.74 | 68.5 ± 1.57 | 71.70 ± 2.42 | 72.33 ± 2.58 | 72.27 ± 2.24 | 69.88 ± 2.56 | 70.13 ± 5.13 |
| Trabecular bone | |||||||||
| Bv | 14.85 ± 2.09 | 9.05 ± 3.20 | 17.29 ± 2.51 | 6.70 ± 1.42 * | 13.21 ± 3.71 | 7.31 ± 5.44 | 11.32 ± 5.26 | 12.03 ± 5.13 | 9.88 ± 3.10 |
| Tv | 74.01 ± 5.78 | 66.54 ± 12.91 | 79.64 ± 5.66 | 59.99 ± 10.55 | 71.49 ± 11.96 | 62.47 ± 15.96 | 62.81 ± 14.29 | 66.67 ± 10.80 | 61.78 ± 10.83 |
| Bv/Tv | 20.12 ± 2.79 | 13.27 ± 2.4 | 21.66 ± 2.48 | 11.17 ± 1.36 * | 18.39 ± 4.17 | 11.11 ± 6.03 | 17.52 ± 5.13 | 17.49 ± 4.98 | 15.89 ± 3.03 |
| Tb.N | 1.77 ± 0.16 | 1.22 ± 0.21 | 1.87 ± 0.17 | 0.94 ± 0.11 * | 1.52 ± 0.35 | 0.95 ± 0.52 | 1.45 ± 0.51 | 1.44 ± 0.54 | 1.25 ± 0.20 |
| Tb.Th | 0.12 ± 0.01 | 0.11 ± 0.01 | 0.12 ± 0.01 | 0.12 ± 0.01 | 0.13 ± 0.01 | 0.12 ± 0.01 | 0.13 ± 0.02 | 0.13 ± 0.02 | 0.13 ± 0.01 |
| Tb.Sp | 0.72 ± 0.15 | 1.10 ± 0.21 | 0.43 ± 0.05 | 1.14 ± 0.19 * | 0.61 ± 0.17 | 1.21 ± 0.44 * | 0.77 ± 0.34 | 0.78 ± 0.38 | 0.91 ± 0.26 |
| DA | 0.66 ± 0.03 | 0.68 ± 0.03 | 0.6 ± 0.02 | 0.61 ± 0.06 | 0.6 ± 0.05 | 0.59 ± 0.03 | 0.56 ± 0.05 | 0.57 ± 0.06 | 0.55 ± 0.08 |
| SMI | 1.43 ± 0.13 | 1.84 ± 0.17 | 1.64 ± 0.17 | 2.02 ± 0.13 * | 1.80 ± 0.24 | 2.06 ± 0.31 | 1.78 ± 0.15 | 1.84 ± 0.18 | 1.82 ± 0.09 |
| Conn.D | 48.39 ± 4.19 | 31.77 ± 4.92 | 49.50 ± 5.12 | 21.92 ± 3.46 * | 36.34 ± 10.99 | 22.97 ± 12.48 | 35.82 ± 16.13 | 31.84 ± 15.48 | 27.58 ± 6.18 |
| Twitch Force of the Soleus Muscle | Tetanic Force of the Soleus Muscle | ||
|---|---|---|---|
| Ultimate strength (N) of the tibia | Pearson’s r | 0.259 | 0.275 + |
| p-value | 0.064 | 0.046 | |
| Bending stiffness (N/mm) of the tibia | Pearson’s r | 0.319 + | 0.477 + |
| p-value | 0.021 | <0.001 |
Disclaimer/Publisher’s Note: The statements, opinions and data contained in all publications are solely those of the individual author(s) and contributor(s) and not of MDPI and/or the editor(s). MDPI and/or the editor(s) disclaim responsibility for any injury to people or property resulting from any ideas, methods, instructions or products referred to in the content. |
© 2023 by the authors. Licensee MDPI, Basel, Switzerland. This article is an open access article distributed under the terms and conditions of the Creative Commons Attribution (CC BY) license (https://creativecommons.org/licenses/by/4.0/).
Share and Cite
Stratos, I.; Rinas, I.; Schröpfer, K.; Hink, K.; Herlyn, P.; Bäumler, M.; Histing, T.; Bruhn, S.; Müller-Hilke, B.; Menger, M.D.; et al. Effects on Bone and Muscle upon Treadmill Interval Training in Hypogonadal Male Rats. Biomedicines 2023, 11, 1370. https://doi.org/10.3390/biomedicines11051370
Stratos I, Rinas I, Schröpfer K, Hink K, Herlyn P, Bäumler M, Histing T, Bruhn S, Müller-Hilke B, Menger MD, et al. Effects on Bone and Muscle upon Treadmill Interval Training in Hypogonadal Male Rats. Biomedicines. 2023; 11(5):1370. https://doi.org/10.3390/biomedicines11051370
Chicago/Turabian StyleStratos, Ioannis, Ingmar Rinas, Konrad Schröpfer, Katharina Hink, Philipp Herlyn, Mario Bäumler, Tina Histing, Sven Bruhn, Brigitte Müller-Hilke, Michael D. Menger, and et al. 2023. "Effects on Bone and Muscle upon Treadmill Interval Training in Hypogonadal Male Rats" Biomedicines 11, no. 5: 1370. https://doi.org/10.3390/biomedicines11051370