
Association of Plasma Methylglyoxal Increase after Myocardial Infarction and the Left Ventricular Ejection Fraction

 , ,
, , 
Abstract
:1. Introduction
1.1. Background
1.2. Objectives
2. Materials and Methods
2.1. Trial Design
2.2. Participants, Setting and Recruitment
2.3. Interventions
2.4. Outcomes
2.5. Safety Considerations
2.6. Sample Size
2.7. Randomization and Blinding
2.8. Methylglyoxal Measurements
2.9. Statistical Methods
3. Results
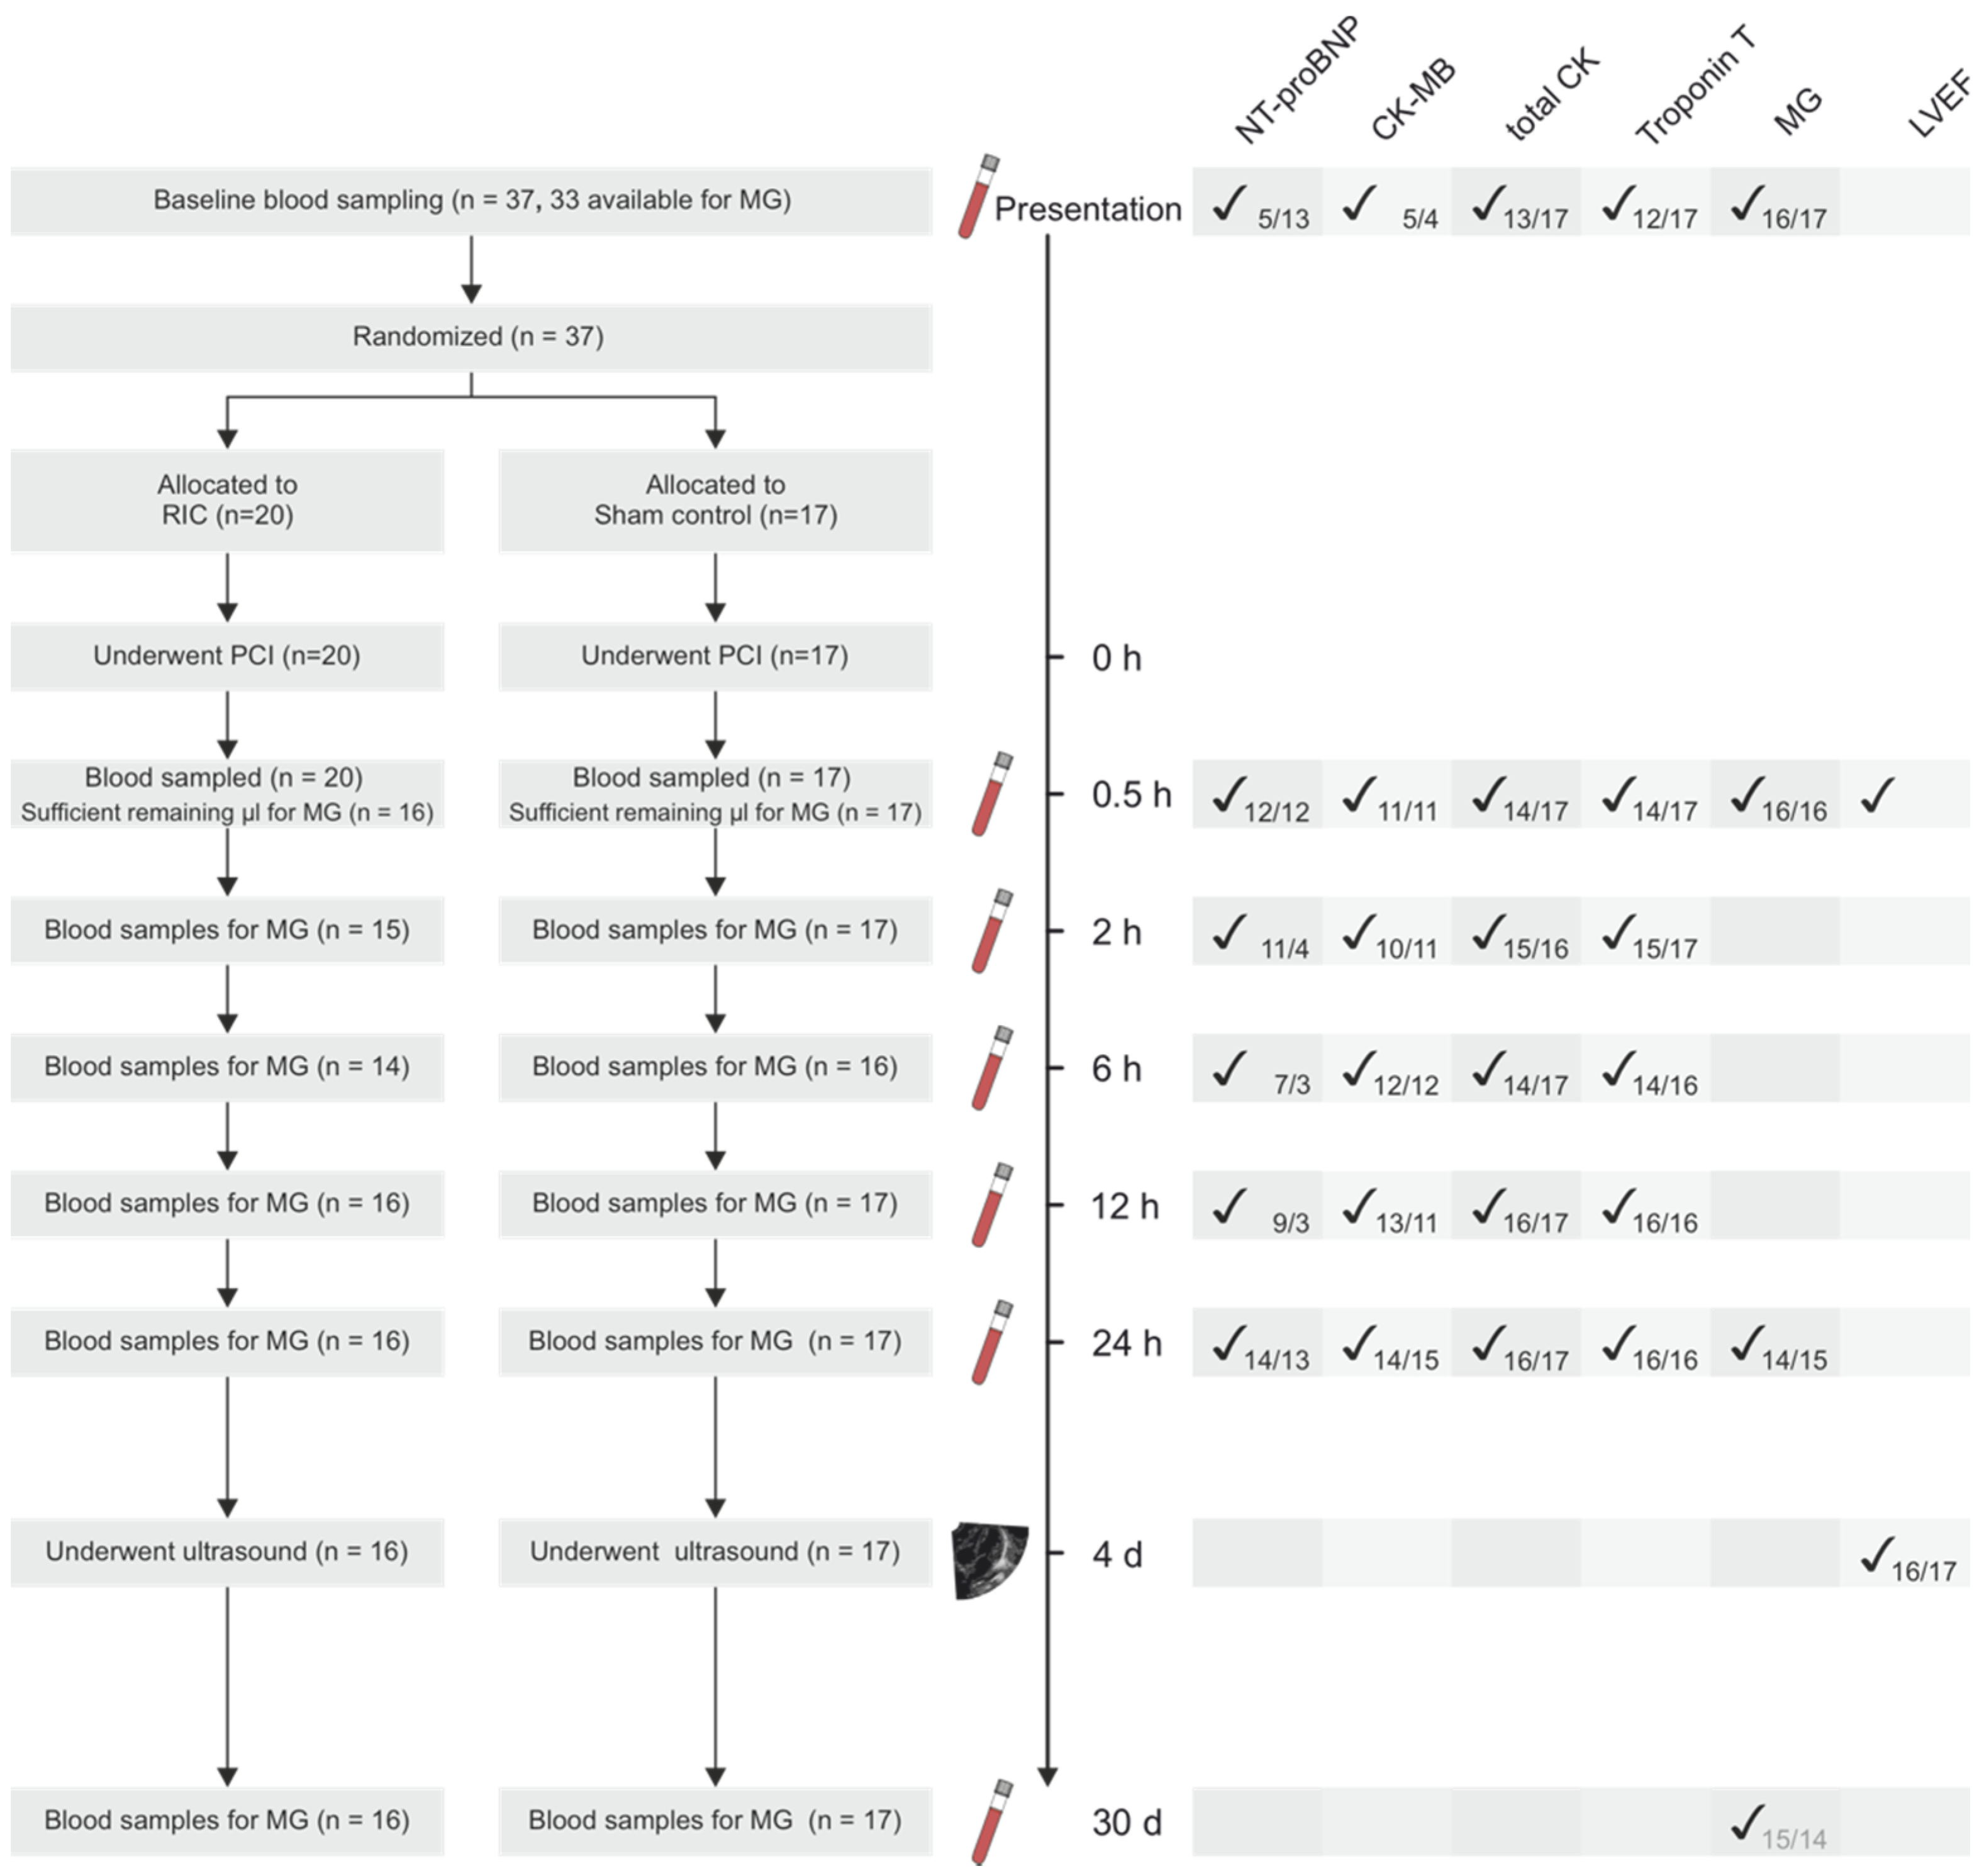
3.1. Participants
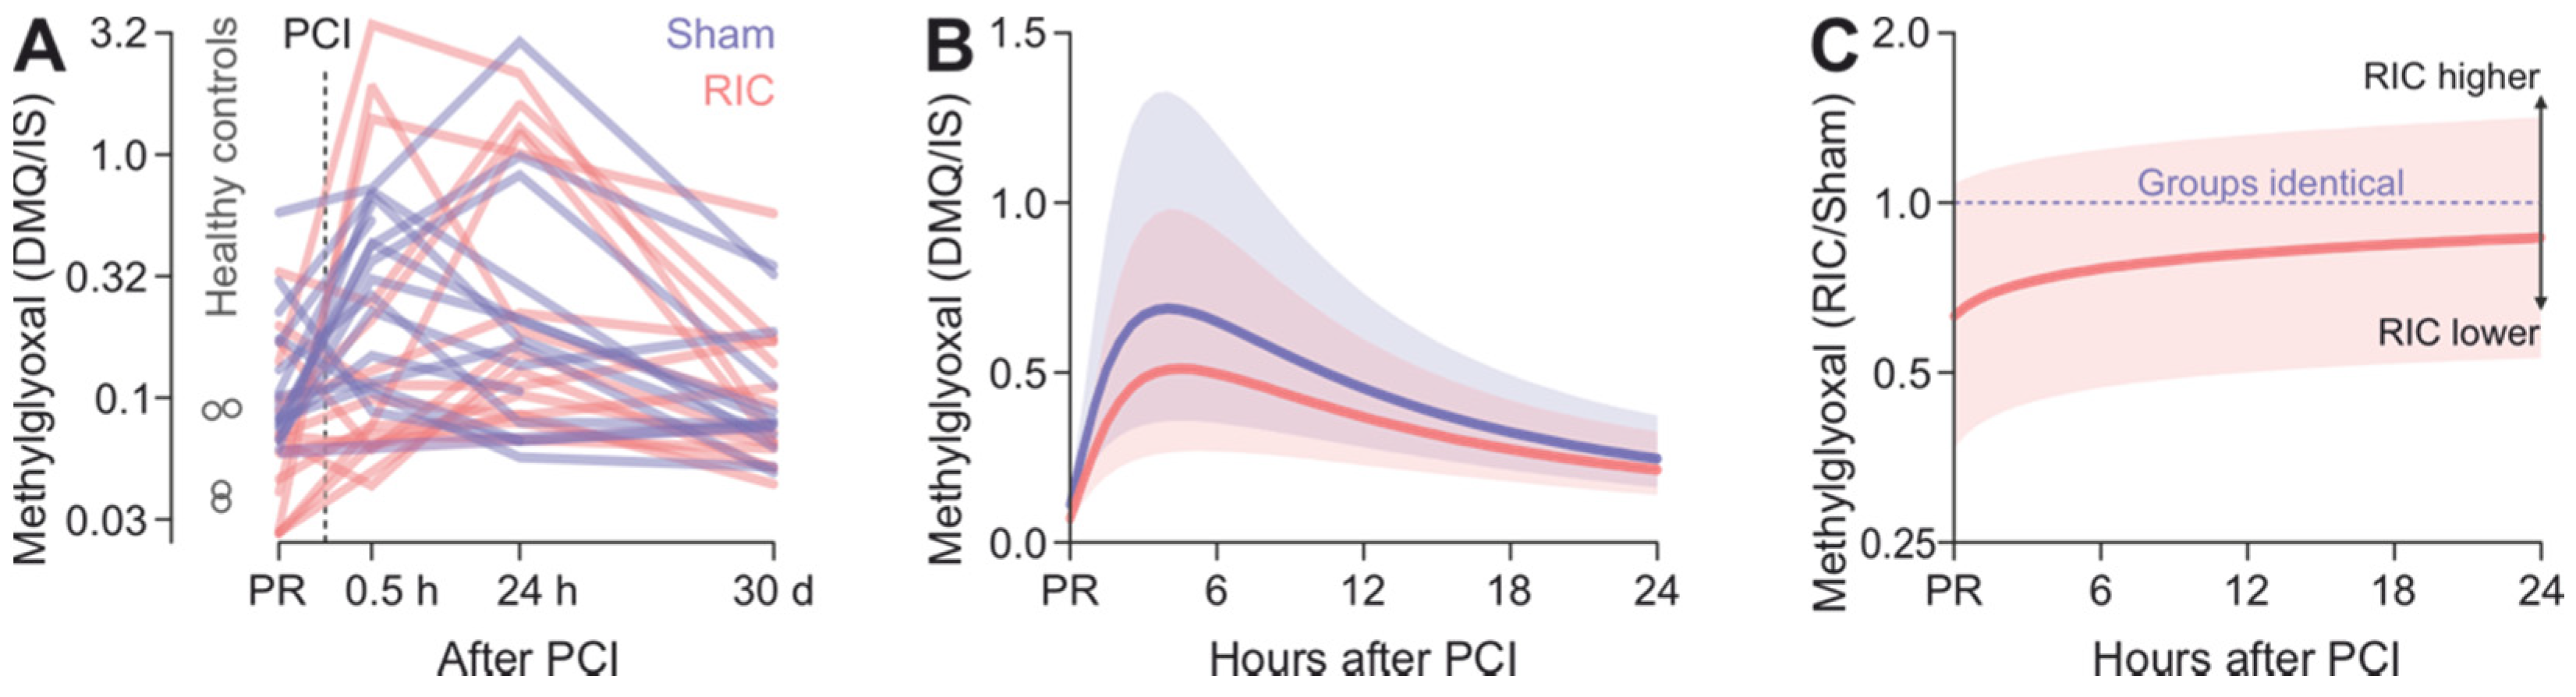
3.2. Myocardial Infarction Is Associated with a Transient Increase in Plasma Methylglyoxal Levels Independent of RIC
3.3. Release of Enzymes Indicative of Myocardial Damage or Dysfunction Is Not Reduced by RIC after Myocardial Infarction
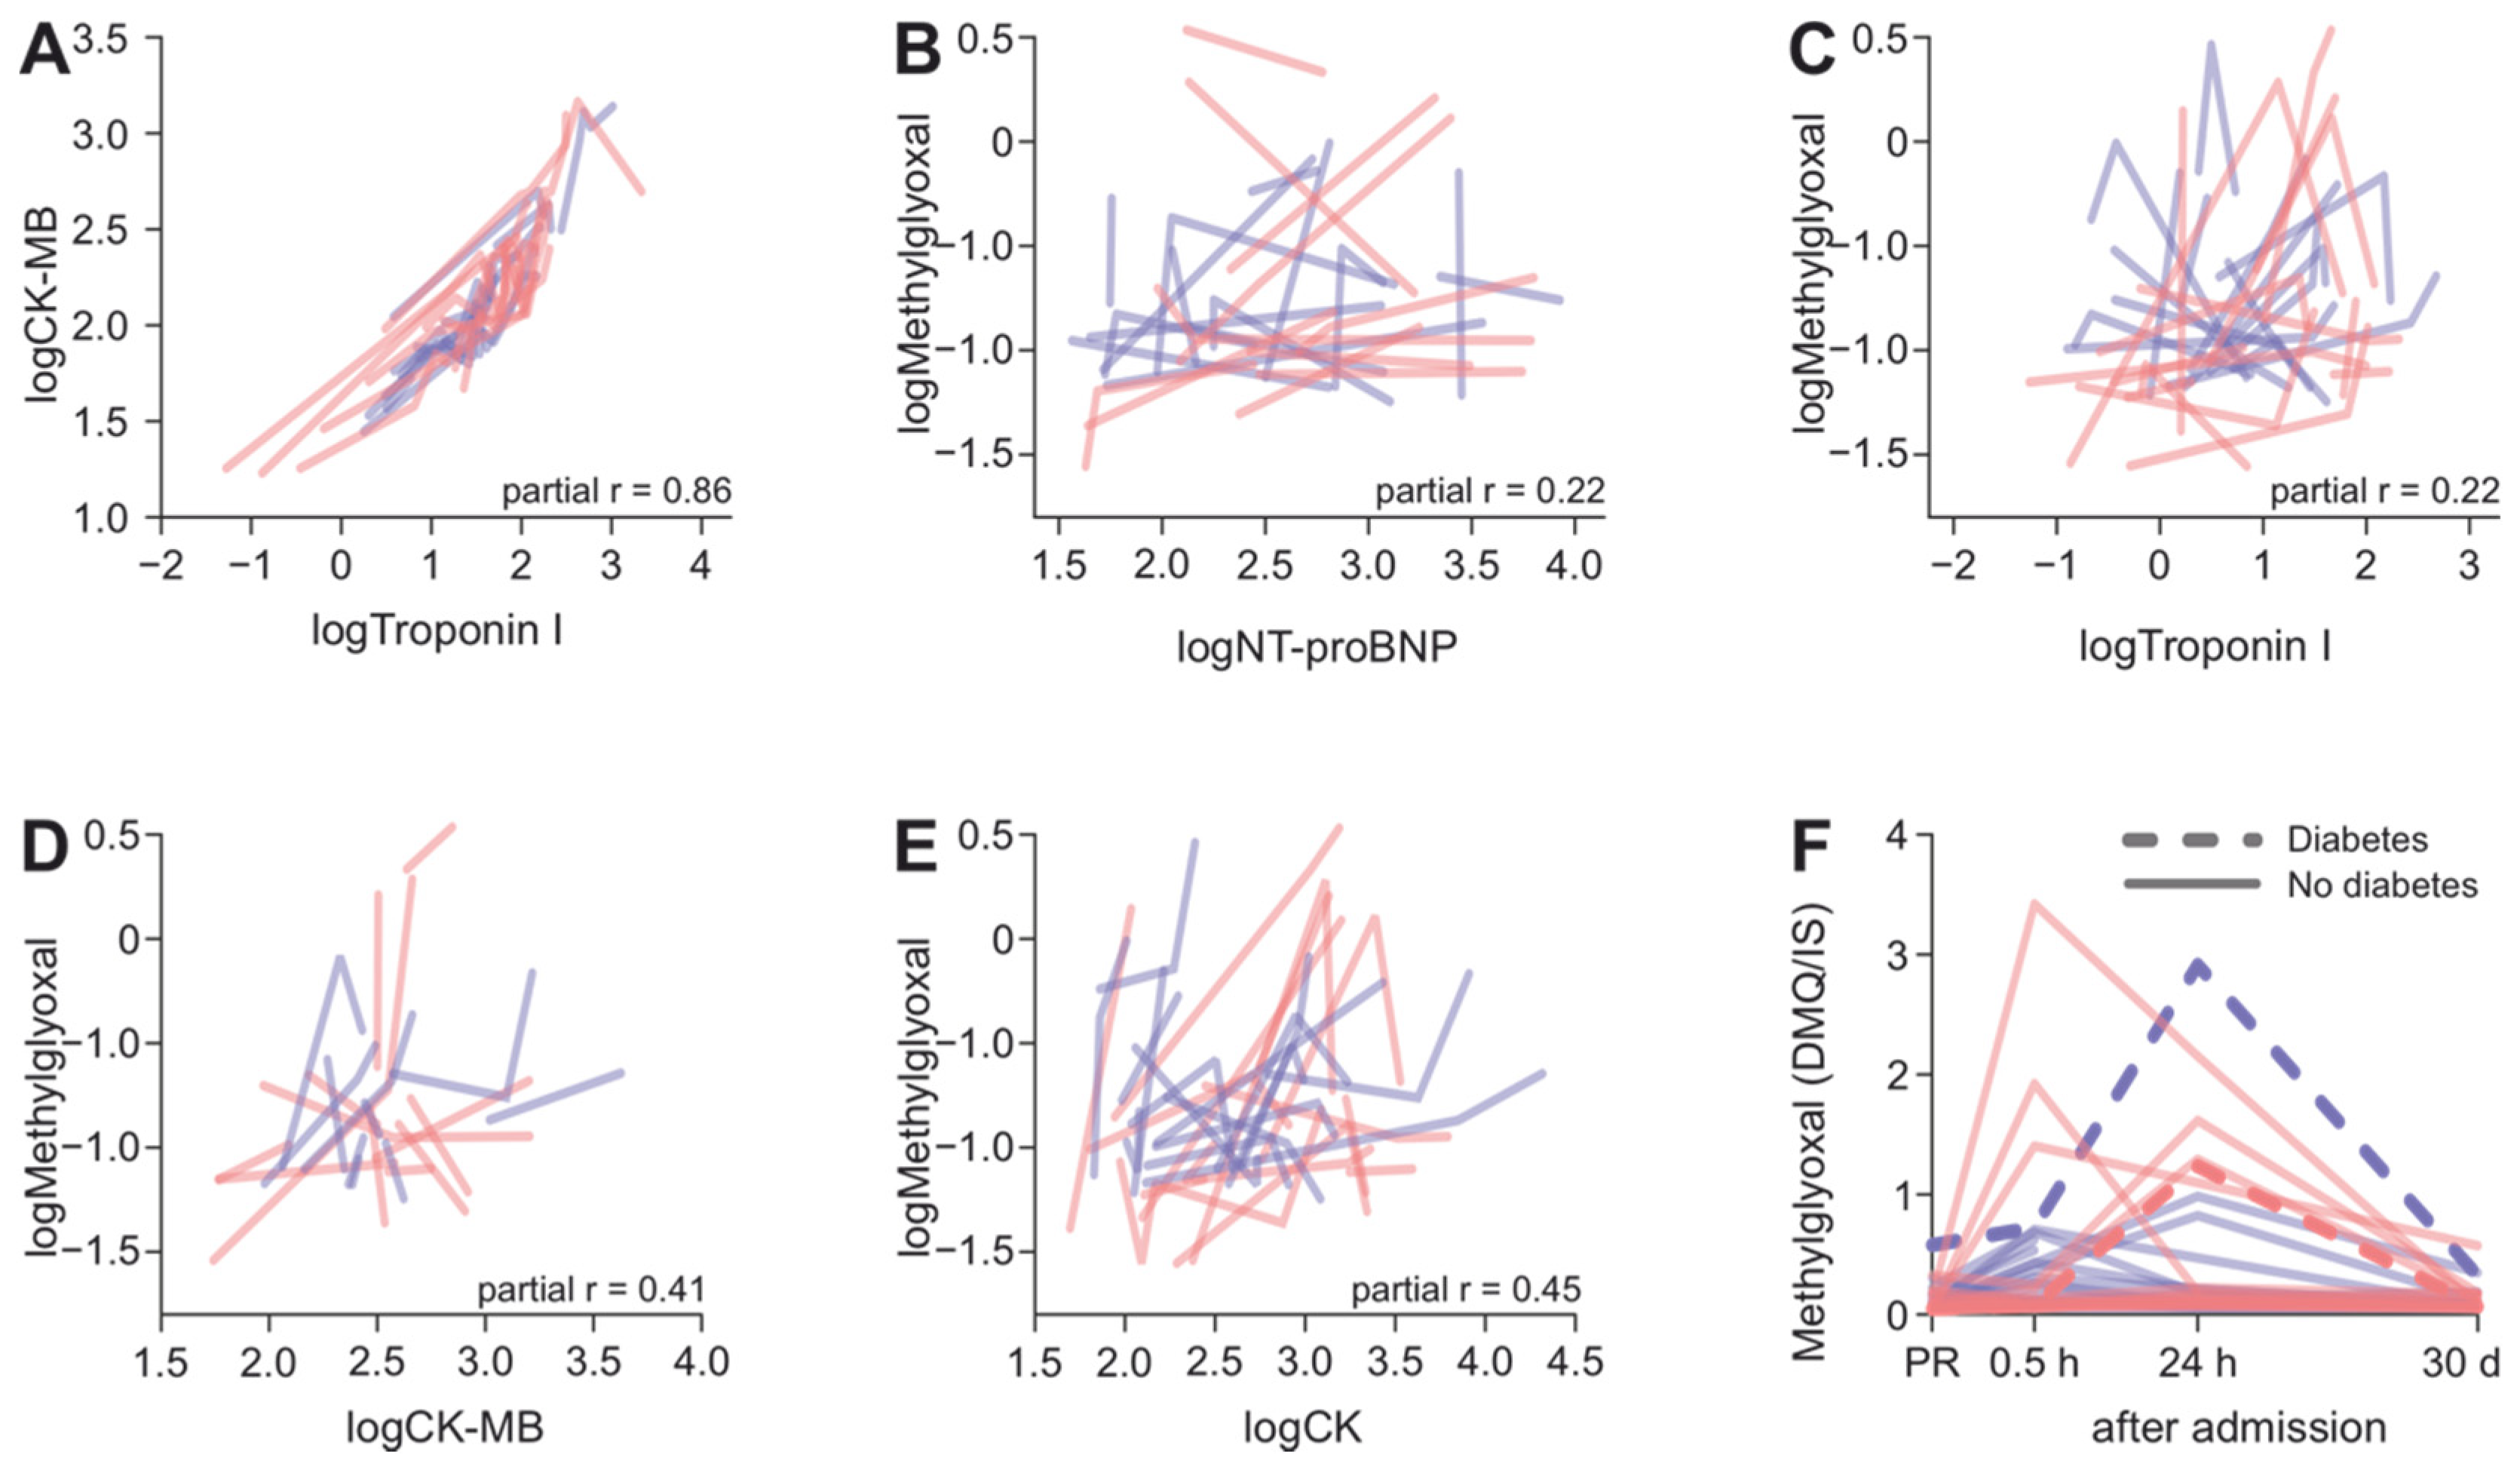
3.4. Changes in MG Levels after AMI Are Only Weakly Dependent on Changes in CK, CK-MB, TnI or NT-proBNP, but Might Be Affected by Diabetes
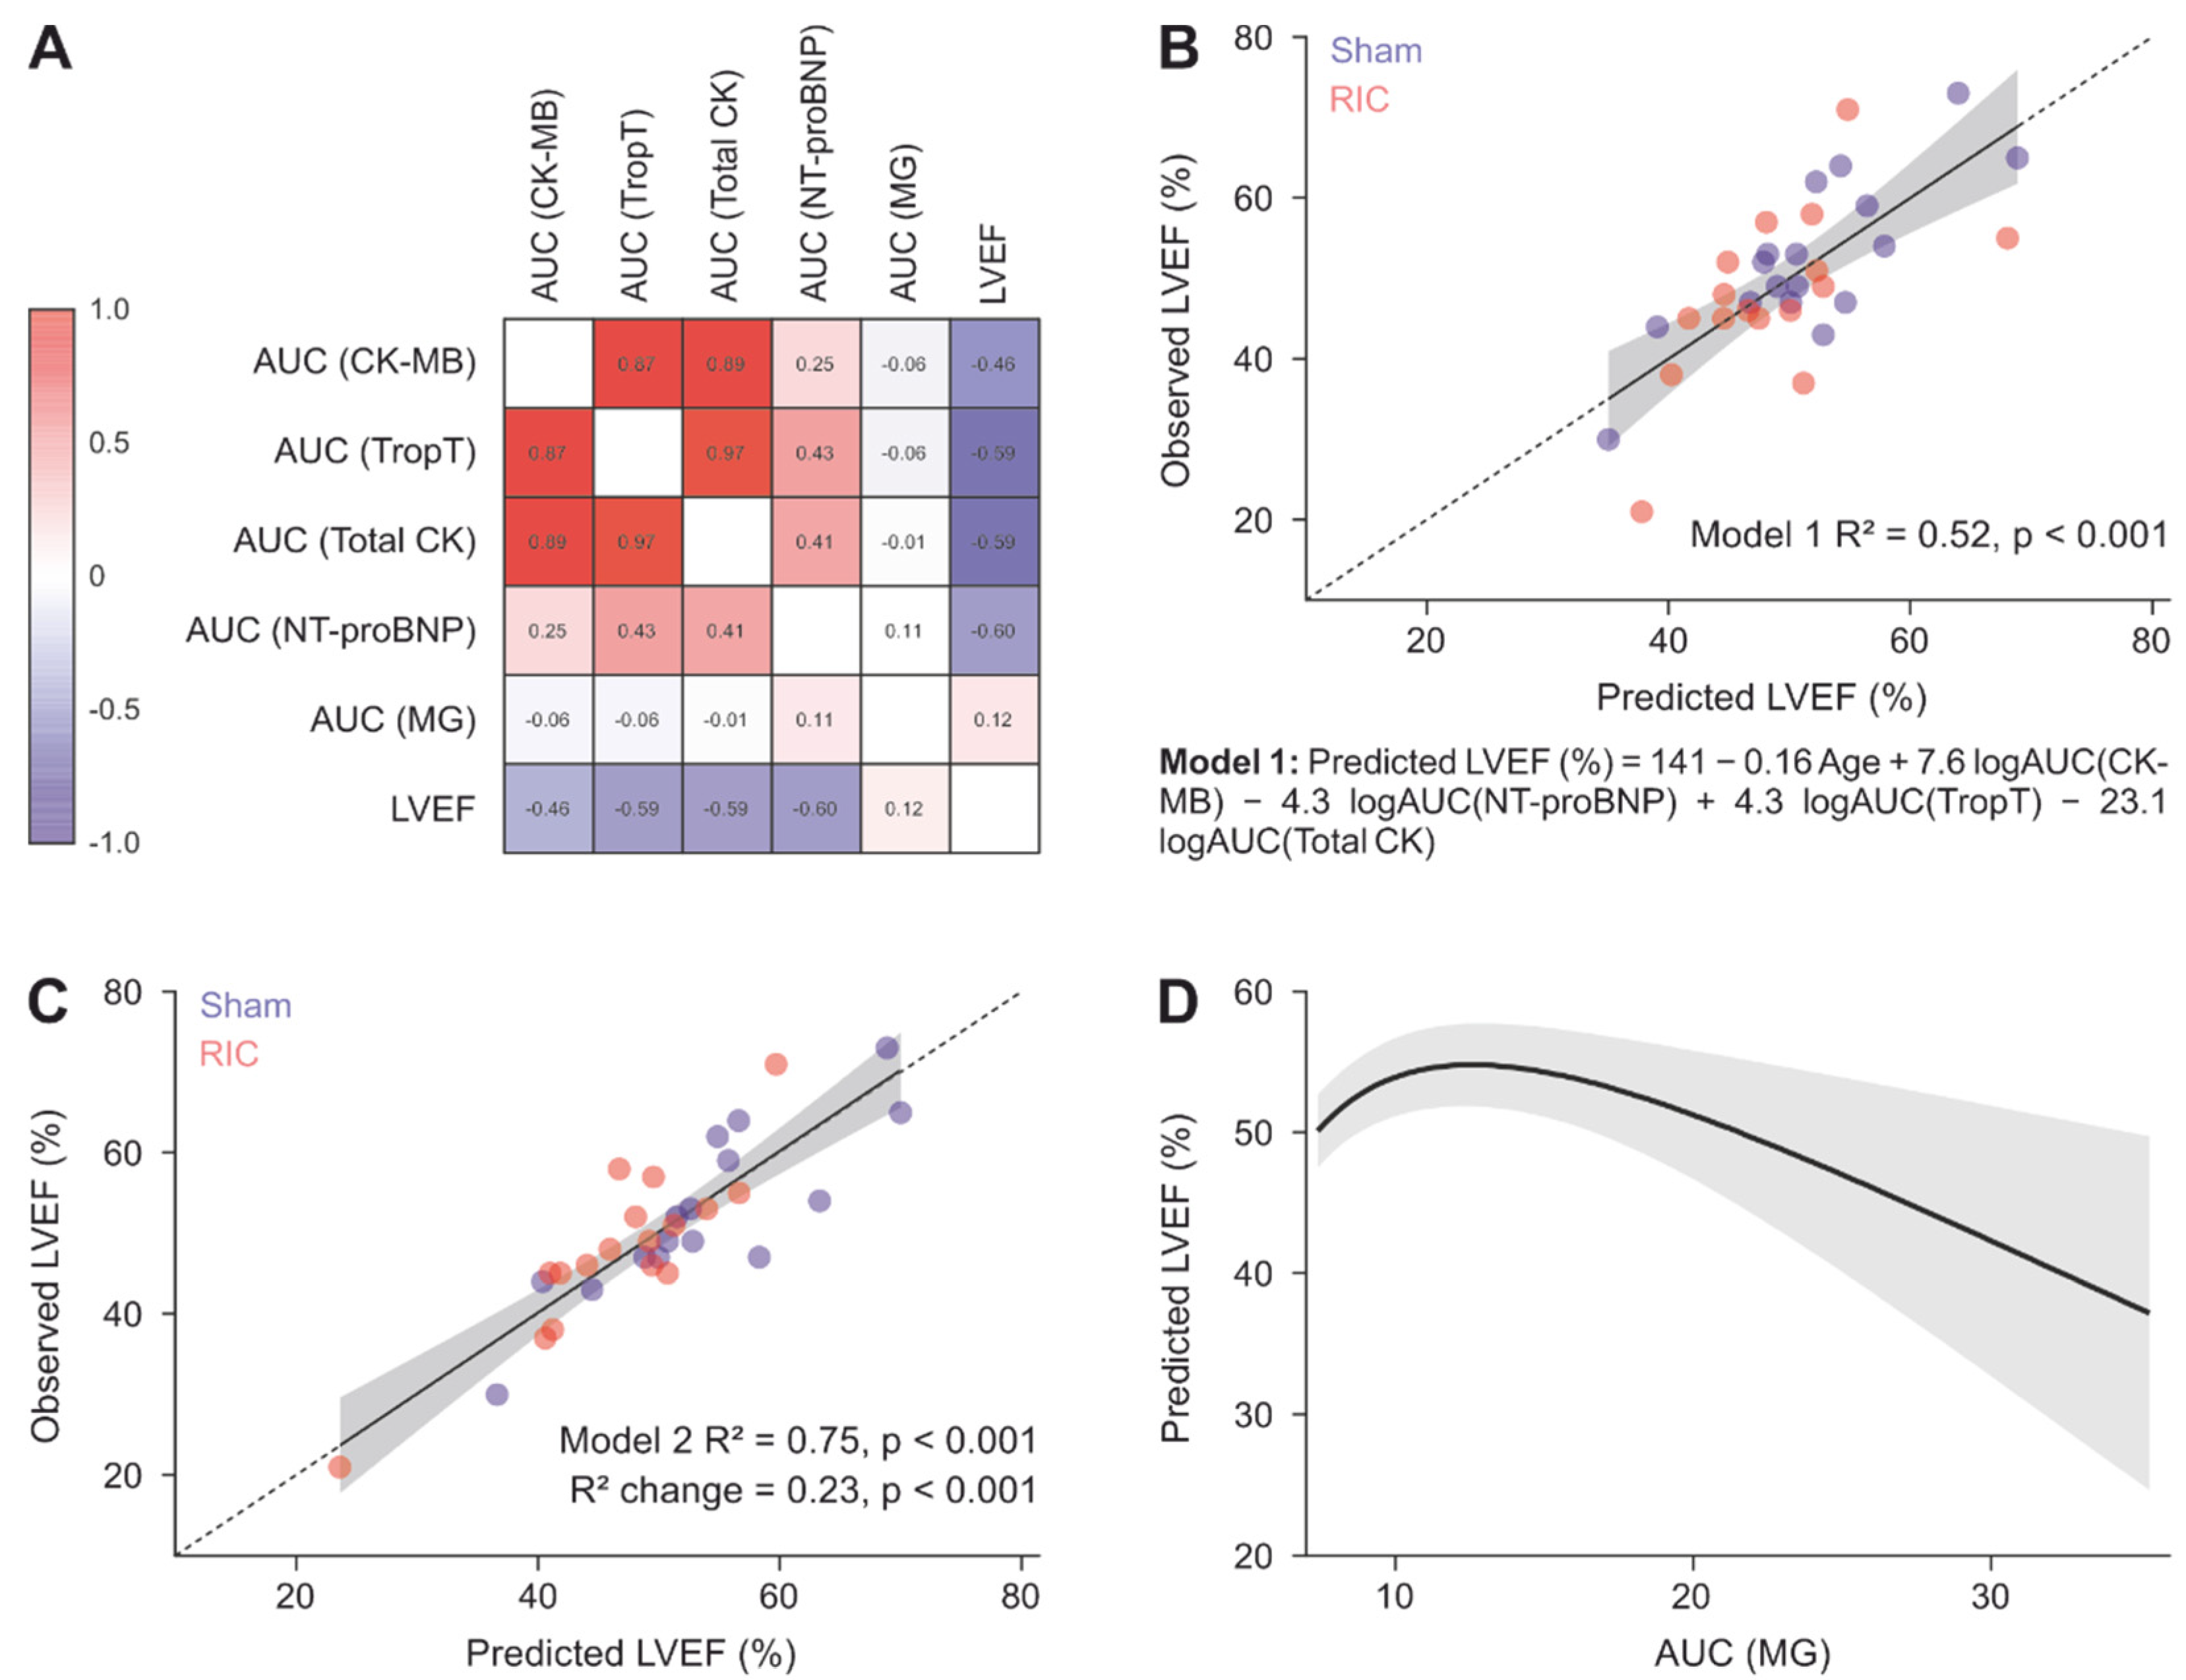
3.5. Association of Methylglyoxal Levels within 24 h after AMI with the Myocardial Function after 4 Days
3.6. Harms
4. Discussion
Limitations and Generalizability
5. Conclusions
Author Contributions
Funding
Institutional Review Board Statement
Informed Consent Statement
Data Availability Statement
Acknowledgments
Conflicts of Interest
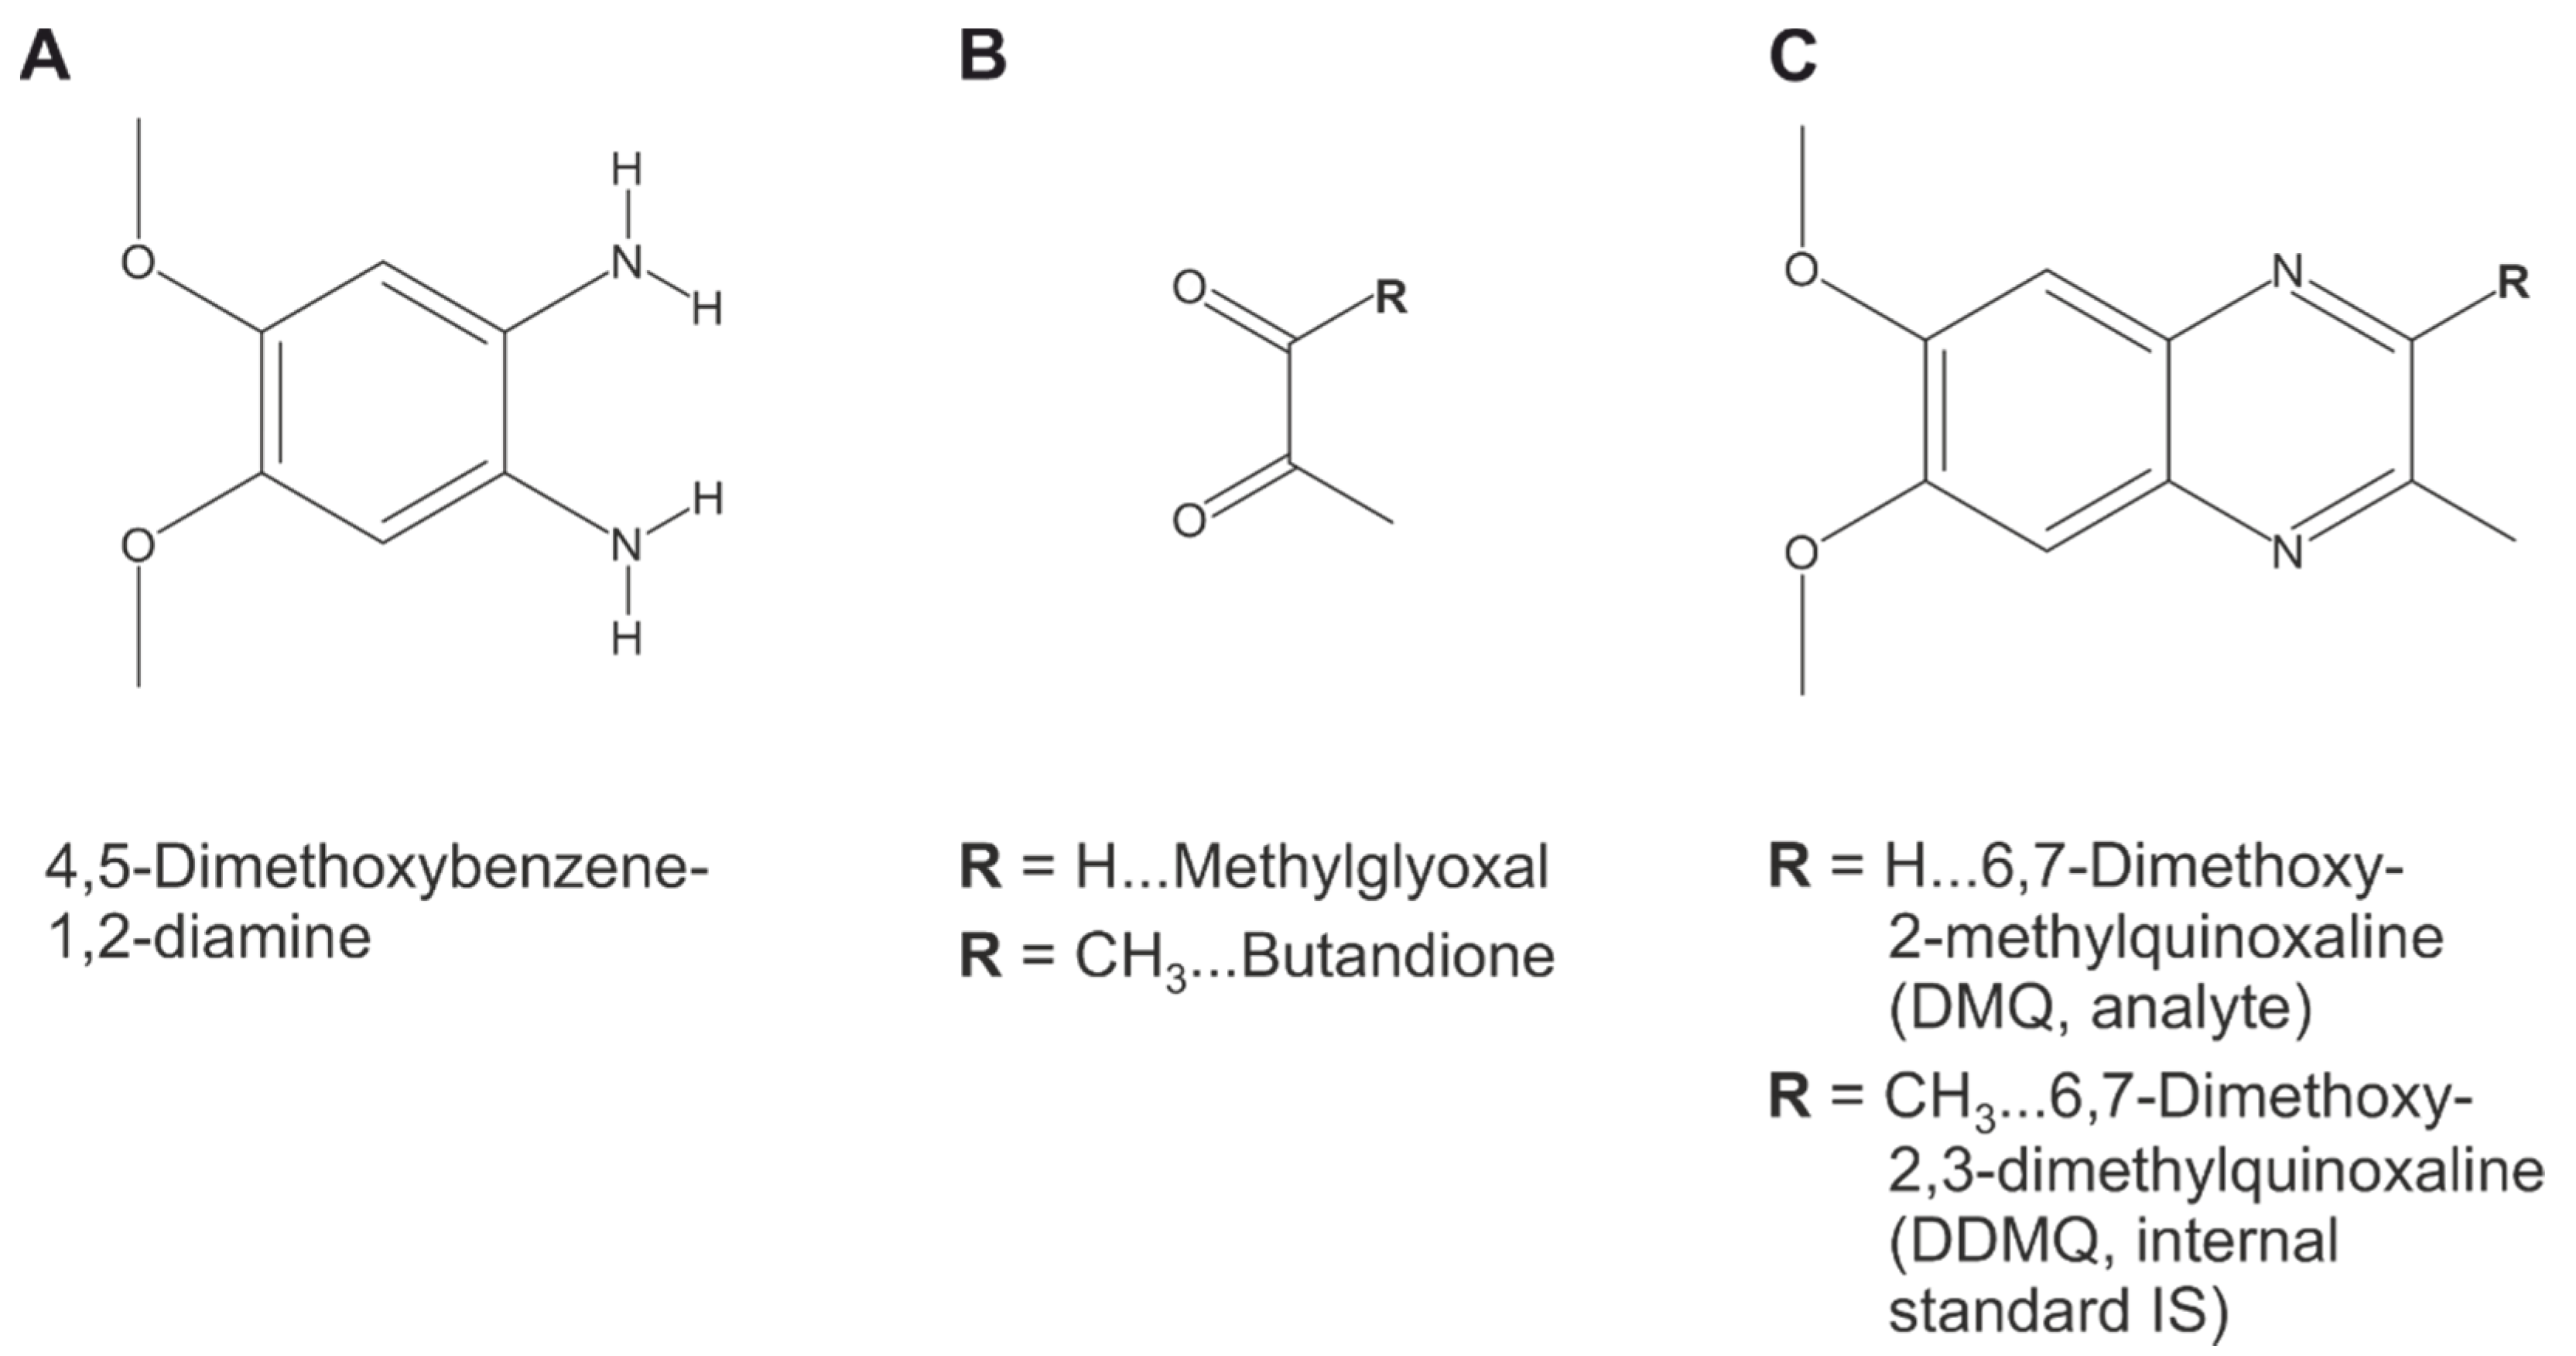
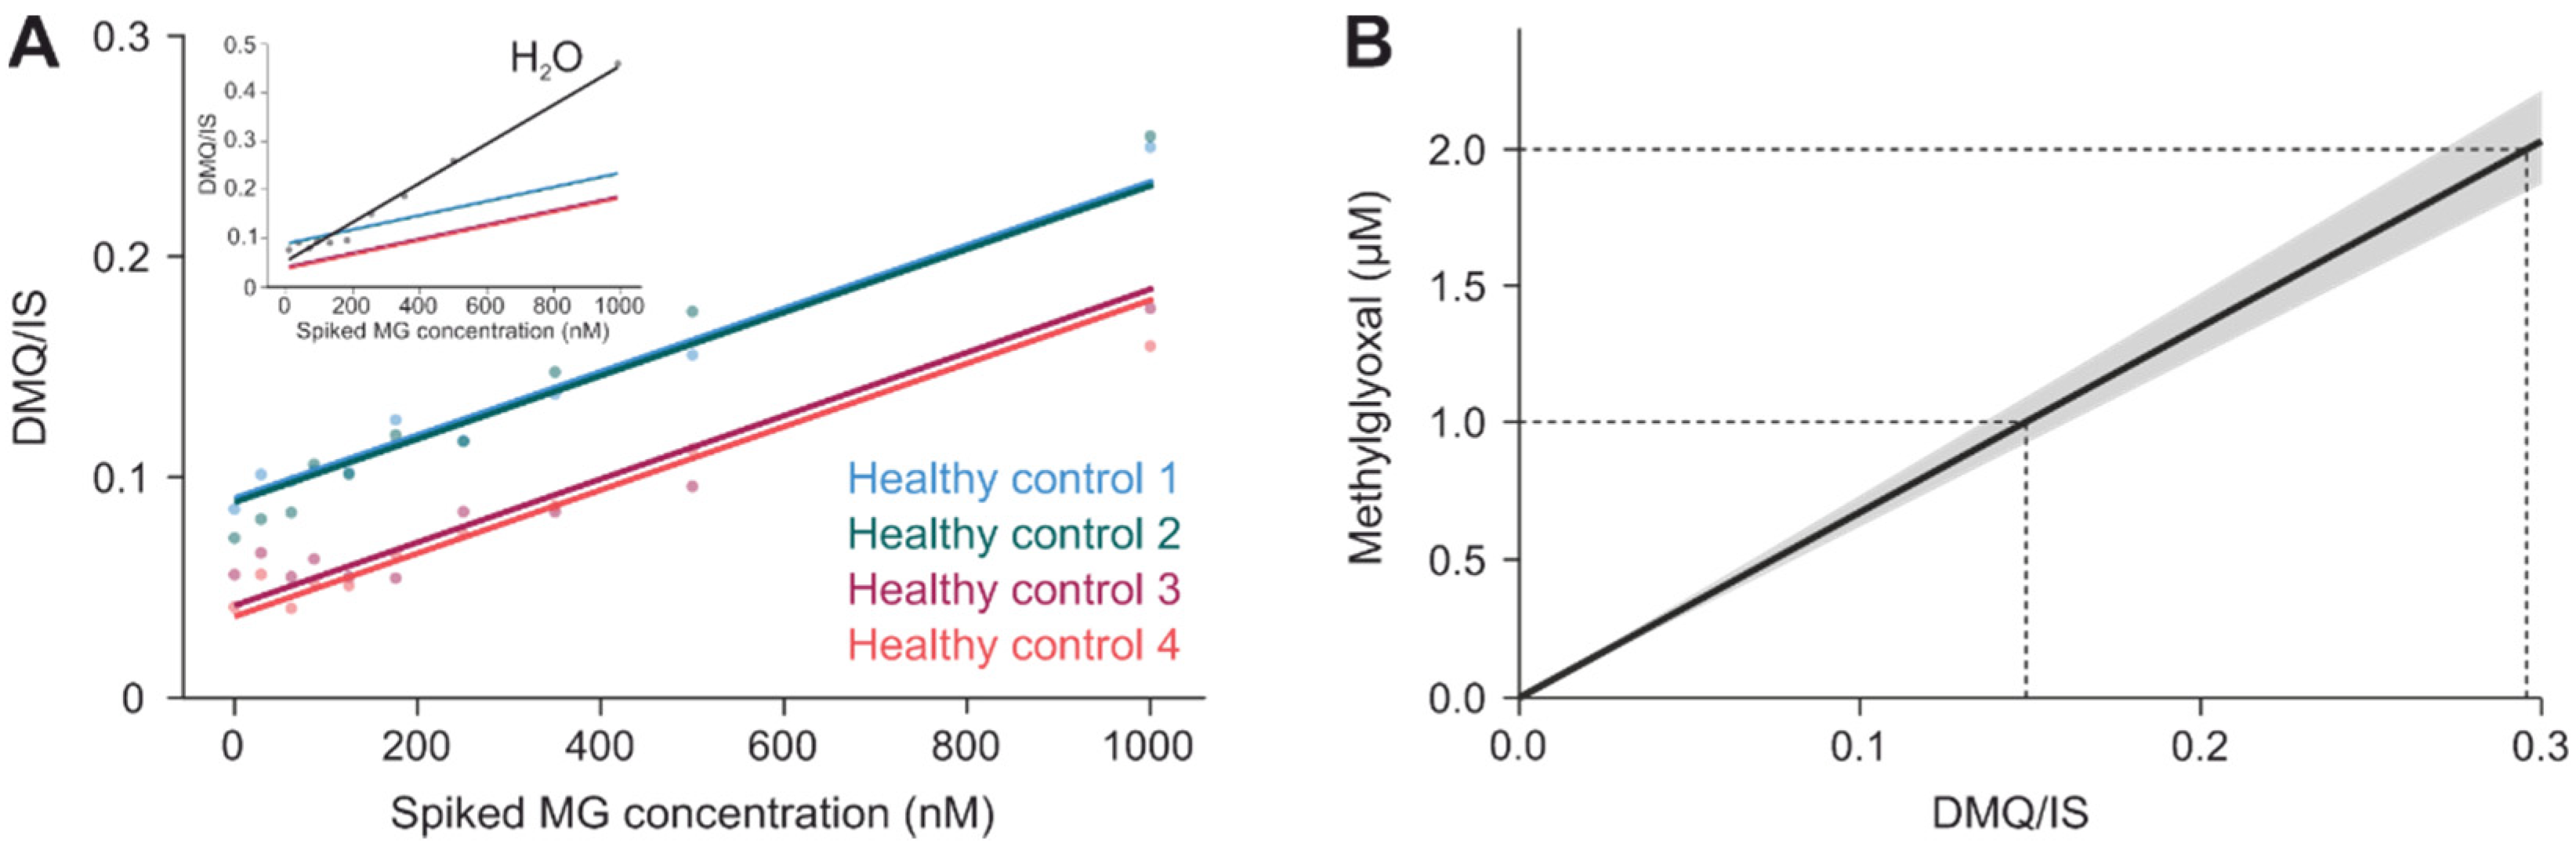
Appendix A. Quantification of Methylglyoxal in Plasma Samples

Appendix B. Supplemental Statistical Methods
Appendix B.1. Assessment of Treatment-Specific Time Courses
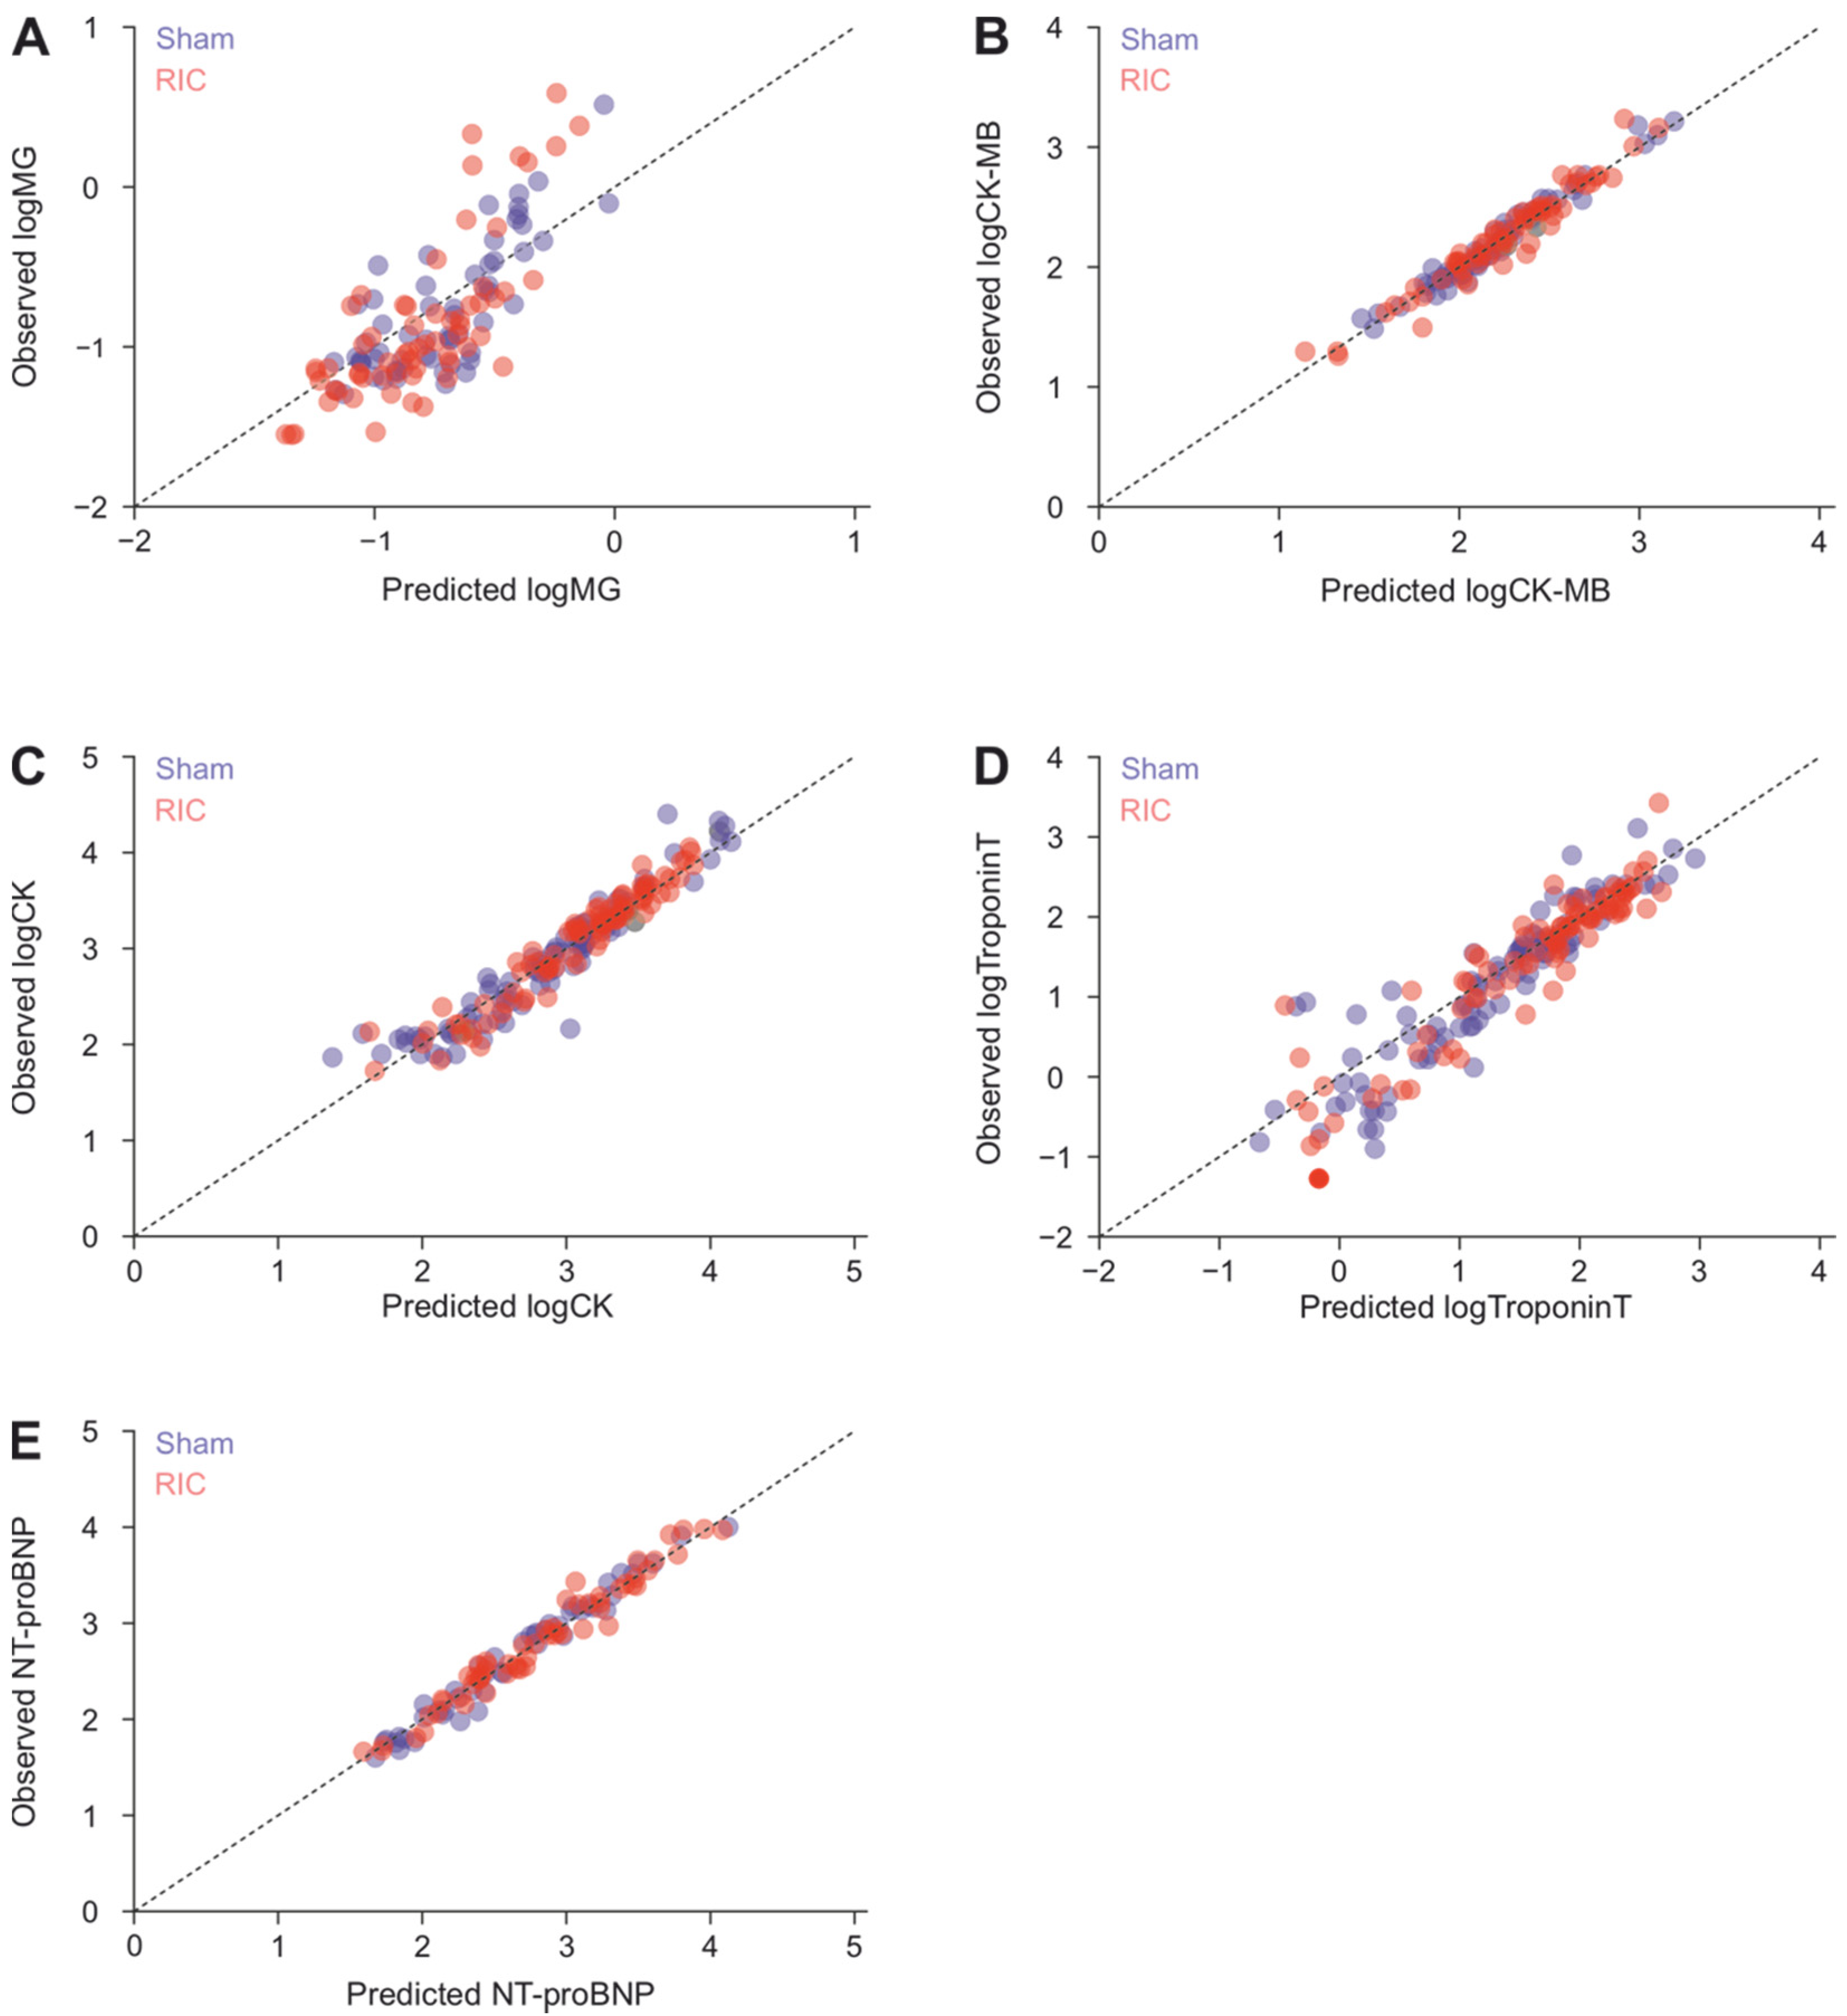
Appendix B.2. Correlation between Intraindividual Changes in Methylglyoxal with Intraindividual Changes in Cardiac Enzymes and NT-proBNP
Appendix B.3. Association of Methylglyoxal Levels with the Myocardial Function
Appendix B.4. Estimation of Methylglyoxal Levels in Healthy Subjects
Appendix B.5. Additional Outcomes
Appendix B.6. TnI Sensitivity Analysis

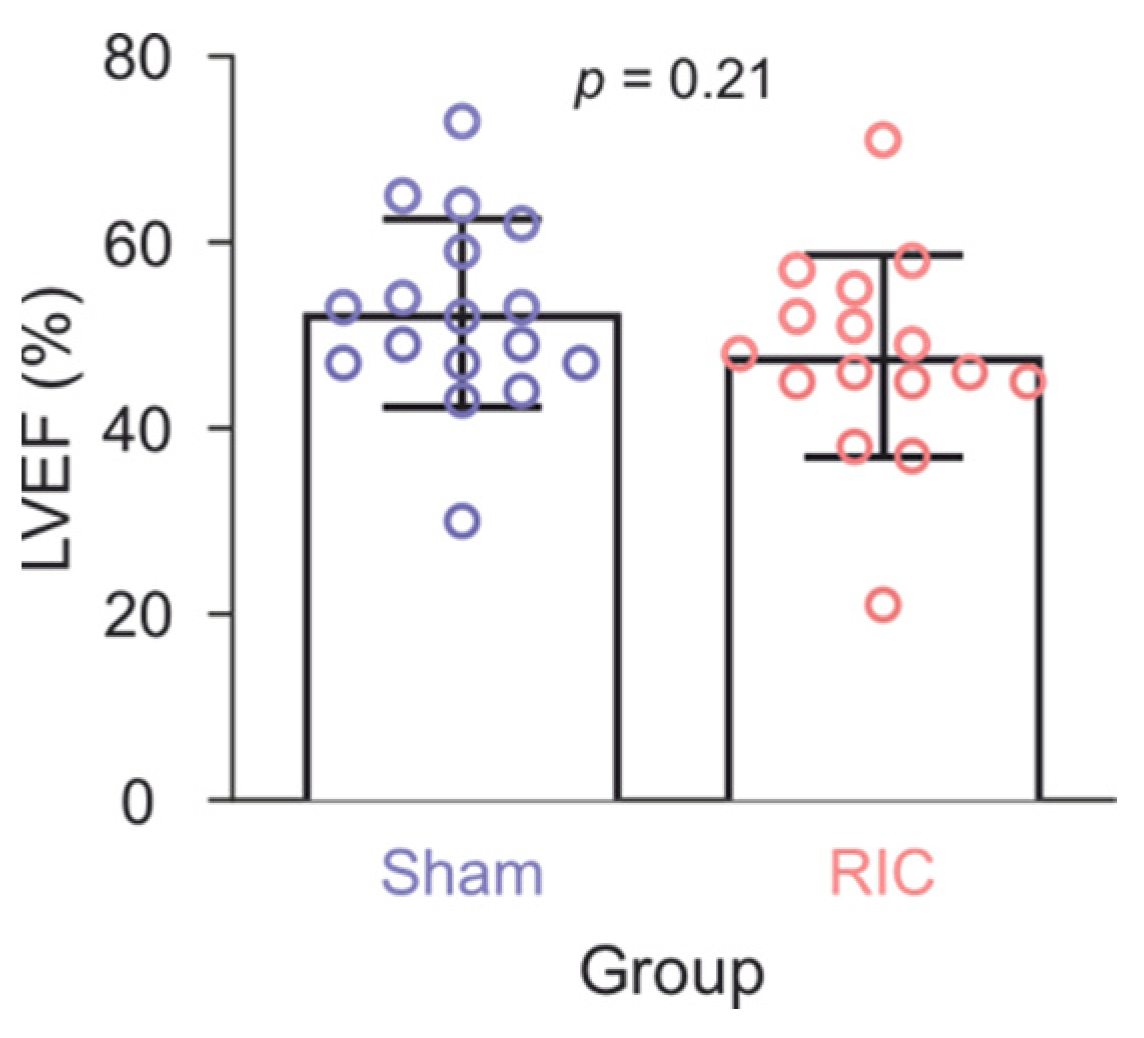
Appendix B.7. No Relevant Effect of RIC on the Ejection Fraction
References
- Neumann, J.T.; Gossling, A.; Sorensen, N.A.; Blankenberg, S.; Magnussen, C.; Westermann, D. Temporal trends in incidence and outcome of acute coronary syndrome. Clin. Res. Cardiol. 2020, 109, 1186–1192. [Google Scholar] [CrossRef] [PubMed]
- Heusch, G.; Gersh, B.J. The pathophysiology of acute myocardial infarction and strategies of protection beyond reperfusion: A continual challenge. Eur. Heart J. 2017, 38, 774–784. [Google Scholar] [CrossRef] [PubMed]
- Ibanez, B.; James, S.; Agewall, S.; Antunes, M.J.; Bucciarelli-Ducci, C.; Bueno, H.; Caforio, A.L.P.; Crea, F.; Goudevenos, J.A.; Halvorsen, S.; et al. 2017 ESC Guidelines for the management of acute myocardial infarction in patients presenting with ST-segment elevation: The Task Force for the management of acute myocardial infarction in patients presenting with ST-segment elevation of the European Society of Cardiology (ESC). Eur. Heart J. 2018, 39, 119–177. [Google Scholar] [CrossRef] [PubMed] [Green Version]
- Heusch, G.; Botker, H.E.; Przyklenk, K.; Redington, A.; Yellon, D. Remote ischemic conditioning. J. Am. Coll. Cardiol. 2015, 65, 177–195. [Google Scholar] [CrossRef] [PubMed] [Green Version]
- Hausenloy, D.J.; Yellon, D.M. Ischaemic conditioning and reperfusion injury. Nat. Rev. Cardiol. 2016, 13, 193–209. [Google Scholar] [CrossRef] [PubMed]
- Bromage, D.I.; Pickard, J.M.; Rossello, X.; Ziff, O.J.; Burke, N.; Yellon, D.M.; Davidson, S.M. Remote ischaemic conditioning reduces infarct size in animal in vivo models of ischaemia-reperfusion injury: A systematic review and meta-analysis. Cardiovasc. Res. 2017, 113, 288–297. [Google Scholar] [CrossRef] [PubMed] [Green Version]
- Hausenloy, D.J.; Kharbanda, R.K.; Møller, U.K.; Ramlall, M.; Aarøe, J.; Butler, R.; Bulluck, H.; Clayton, T.; Dana, A.; Dodd, M.; et al. Effect of remote ischaemic conditioning on clinical outcomes in patients with acute myocardial infarction (CONDI-2/ERIC-PPCI): A single-blind randomised controlled trial. Lancet 2019, 394, 1415–1424. [Google Scholar] [CrossRef] [Green Version]
- Haller, P.M.; Vargas, K.G.; Haller, M.C.; Piackova, E.; Wojta, J.; Gyöngyösi, M.; Gersh, B.J.; Kiss, A.; Podesser, B.K.; Huber, K. Remote ischaemic conditioning for myocardial infarction or elective PCI: Systematic review and meta-analyses of randomised trials. Eur. Heart J. Acute Cardiovasc. Care 2020, 9, 82–92. [Google Scholar] [CrossRef] [PubMed] [Green Version]
- Stone, G.W.; Selker, H.P.; Thiele, H.; Patel, M.R.; Udelson, J.E.; Ohman, E.M.; Maehara, A.; Eitel, I.; Granger, C.B.; Jenkins, P.L.; et al. Relationship Between Infarct Size and Outcomes Following Primary PCI: Patient-Level Analysis From 10 Randomized Trials. J. Am. Coll. Cardiol. 2016, 67, 1674–1683. [Google Scholar] [CrossRef] [PubMed]
- Westman, P.C.; Lipinski, M.J.; Luger, D.; Waksman, R.; Bonow, R.O.; Wu, E.; Epstein, S.E. Inflammation as a Driver of Adverse Left Ventricular Remodeling After Acute Myocardial Infarction. J. Am. Coll. Cardiol. 2016, 67, 2050–2060. [Google Scholar] [CrossRef] [PubMed]
- Heusch, G.; Libby, P.; Gersh, B.; Yellon, D.; Böhm, M.; Lopaschuk, G.; Opie, L. Cardiovascular remodelling in coronary artery disease and heart failure. Lancet 2014, 383, 1933–1943. [Google Scholar] [CrossRef] [Green Version]
- Blackburn, N.J.R.; Vulesevic, B.; McNeill, B.; Cimenci, C.E.; Ahmadi, A.; Gonzalez-Gomez, M.; Ostojic, A.; Zhong, Z.; Brownlee, M.; Beisswenger, P.J.; et al. Methylglyoxal-derived advanced glycation end products contribute to negative cardiac remodeling and dysfunction post-myocardial infarction. Basic Res. Cardiol. 2017, 112, 57. [Google Scholar] [CrossRef] [PubMed]
- Hartog, J.W.; Voors, A.A.; Schalkwijk, C.G.; Scheijen, J.; Smilde, T.D.; Damman, K.; Bakker, S.J.; Smit, A.J.; van Veldhuisen, D.J. Clinical and prognostic value of advanced glycation end-products in chronic heart failure. Eur. Heart J. 2007, 28, 2879–2885. [Google Scholar] [CrossRef] [PubMed]
- Haller, P.M.; Jager, B.; Piackova, E.; Sztulman, L.; Wegberger, C.; Wojta, J.; Gyongyosi, M.; Kiss, A.; Podesser, B.K.; Spittler, A.; et al. Changes in Circulating Extracellular Vesicles in Patients with ST-Elevation Myocardial Infarction and Potential Effects of Remote Ischemic Conditioning-A Randomized Controlled Trial. Biomedicines 2020, 8, 218. [Google Scholar] [CrossRef] [PubMed]
- White, S.K.; Frohlich, G.M.; Sado, D.M.; Maestrini, V.; Fontana, M.; Treibel, T.A.; Tehrani, S.; Flett, A.S.; Meier, P.; Ariti, C.; et al. Remote ischemic conditioning reduces myocardial infarct size and edema in patients with ST-segment elevation myocardial infarction. JACC Cardiovasc. Interv. 2015, 8, 178–188. [Google Scholar] [CrossRef] [PubMed] [Green Version]
- Kong, X.; Ma, M.Z.; Huang, K.; Qin, L.; Zhang, H.M.; Yang, Z.; Li, X.Y.; Su, Q. Increased plasma levels of the methylglyoxal in patients with newly diagnosed type 2 diabetes 2. J. Diabetes 2014, 6, 535–540. [Google Scholar] [CrossRef] [PubMed]
- Brings, S.; Fleming, T.; De Buhr, S.; Beijer, B.; Lindner, T.; Wischnjow, A.; Kender, Z.; Peters, V.; Kopf, S.; Haberkorn, U.; et al. A scavenger peptide prevents methylglyoxal induced pain in mice. Biochim. Biophys. Acta 2017, 1863, 654–662. [Google Scholar] [CrossRef] [PubMed]
- McLellan, A.C.; Thornalley, P.J. Synthesis and chromatography of 1,2-diamino-4,5-dimethoxybenzene, 6,7-dimethoxy-2-methylquinoxaline and 6,7-dimethoxy-2,3-dimethylquinoxaline for use in a liquid chromatographic fluorimetric assay of methylglyoxal. Analytica Chimica Acta 1992, 263, 137–142. [Google Scholar] [CrossRef]
- Nemet, I.; Varga-Defterdarović, L.; Turk, Z. Preparation and quantification of methylglyoxal in human plasma using reverse-phase high-performance liquid chromatography. Clin. Biochem. 2004, 37, 875–881. [Google Scholar] [CrossRef] [PubMed]

Publisher’s Note: MDPI stays neutral with regard to jurisdictional claims in published maps and institutional affiliations. |
© 2022 by the authors. Licensee MDPI, Basel, Switzerland. This article is an open access article distributed under the terms and conditions of the Creative Commons Attribution (CC BY) license (https://creativecommons.org/licenses/by/4.0/).
Share and Cite
Heber, S.; Haller, P.M.; Kiss, A.; Jäger, B.; Huber, K.; Fischer, M.J.M. Association of Plasma Methylglyoxal Increase after Myocardial Infarction and the Left Ventricular Ejection Fraction. Biomedicines 2022, 10, 605. https://doi.org/10.3390/biomedicines10030605
Heber S, Haller PM, Kiss A, Jäger B, Huber K, Fischer MJM. Association of Plasma Methylglyoxal Increase after Myocardial Infarction and the Left Ventricular Ejection Fraction. Biomedicines. 2022; 10(3):605. https://doi.org/10.3390/biomedicines10030605
Chicago/Turabian StyleHeber, Stefan, Paul M. Haller, Attila Kiss, Bernhard Jäger, Kurt Huber, and Michael J. M. Fischer. 2022. "Association of Plasma Methylglyoxal Increase after Myocardial Infarction and the Left Ventricular Ejection Fraction" Biomedicines 10, no. 3: 605. https://doi.org/10.3390/biomedicines10030605