3.3. Reliability
The Chronbach α coefficient to assess internal consistency for the questionnaire overall in a normal population was 0.86. The split half coefficient was 0.88 for the normal population. The questionnaire had similar values for Chronbach α and split half for the SBO patient population with values of 0.86 and 0.94, respectively. This demonstrates a reliable tool over two different populations, where values for Chronbach α over 0.7 and split half of 0.6 are the minimum acceptable values.
Chronbach α and split half were calculated for each group after conversion to domain scores. The normal population demonstrated good internal consistency with values of 0.77 for Chronbach α and 0.73 for split half; the SBO patient population also demonstrated acceptable internal consistency with values of 0.81 for Chronbach α and 0.99 for split half analysis.
Table 1.
Demographics of normal population subjects included in this study.
Table 1.
Demographics of normal population subjects included in this study.
| Variable | Answer | N | % |
|---|
| Gender | Male | 72 | 48.3 |
| Female | 76 | 51.0 |
| Not answered | 1 | 0.7 |
| Race/Ethnicity | White | 129 | 86.6 |
| African American or black | 11 | 7.4 |
| Asian | 4 | 2.7 |
| Multiple Races | 3 | 2.0 |
| Other | 1 | 0.7 |
| Not answered | 1 | 0.7 |
| Marital Status | Married/Long-term relationship | 99 | 66.4 |
| Single | 28 | 18.8 |
| Divorced/widowed | 21 | 14.1 |
| Not answered | 1 | 0.7 |
| Education | Did not complete high school | 2 | 1.3 |
| High School Graduate/GED | 39 | 26.2 |
| 1–3 years college | 46 | 30.9 |
| 4 years college | 34 | 22.8 |
| Some graduate school | 5 | 3.4 |
| Completed graduate school | 21 | 14.1 |
| Not answered | 2 | 1.3 |
| Household Income | $0–$24,999 | 27 | 18.1 |
| $25,000–$49,999 | 36 | 24.2 |
| $50,000–$74,999 | 33 | 22.1 |
| $75,000–$99,999 | 23 | 15.4 |
| over $100,000 | 29 | 19.5 |
| Refused to answer | 1 | 0.7 |
Table 2.
Demographics for small bowel obstruction (SBO) patients included in this study.
Table 2.
Demographics for small bowel obstruction (SBO) patients included in this study.
| Variable | Answer | N | % |
|---|
| Gender | Male | 7 | 70.0 |
| Female | 3 | 30.0 |
| Race/Ethnicity | White | 7 | 70.0 |
| African American or black | 2 | 20.0 |
| Asian | 1 | 10.0 |
| Marital Status | Married/Long-term relationship | 7 | 70.0 |
| Single | 3 | 30.0 |
| Education | Did not complete high school | 0 | 0.0 |
| High School Graduate/GED | 0 | 0.0 |
| 1–3 years college | 0 | 0.0 |
| 4 years college | 2 | 20.0 |
| Some graduate school | 0 | 0.0 |
| Completed graduate school | 1 | 10.0 |
| Not answered | 6 | 60.0 |
Table 3.
Normal population basics statistics for the domains in the SBO QOL questionnaire. CI = confidence interval.
Table 3.
Normal population basics statistics for the domains in the SBO QOL questionnaire. CI = confidence interval.
| Domain | Mean | Median | One Standard Deviation | Two Standard Deviation | −95%CI | +95%CI | Score Range |
|---|
| Diet | 15.1342 | 16 | 1.9475 | 3.8950 | 14.8215 | 15.4469 | 0 to 16 |
| Pain | 4.8792 | 4 | 5.2547 | 10.5094 | 3.9968 | 5.7616 | 0 to 40 |
| Medication | 0.6779 | 0 | 1.0583 | 2.1165 | 0.4592 | 0.8965 | 0 to 4 |
| GI Symptoms | 3.0134 | 2 | 3.0388 | 6.0775 | 2.4031 | 3.6237 | 0 to 44 |
| QOL | 0.5772 | 0 | 1.0456 | 2.0911 | 0.3462 | 0.8082 | 0 to 28 |
| Average Pain Level | 1.2617 | 0 | 1.7972 | 3.5944 | 0.9069 | 1.6166 | 0 to 10 |
| Maximum Pain Level | 1.5772 | 0 | 2.3986 | 4.7973 | 1.1577 | 1.9967 | 0 to 10 |
| Minimum Pain Level | 0.9396 | 0 | 1.5185 | 3.0371 | 0.6255 | 1.2537 | 0 to 10 |
| Duration of Pain | 1.2282 | 0 | 1.4743 | 2.9485 | 0.9935 | 1.4629 | 0 to 5 |
The test-retest reliability was determined by calculation of Pearson’s correlations for all normal subjects that completed the questionnaire twice using the SurveyMonkey platform. The correlation for the entire questionnaire was 0.93; and 0.93 for the calculated domains for this group of 72 normal subjects, demonstrating good reliability for this instrument and the established domains.
3.4. Validity
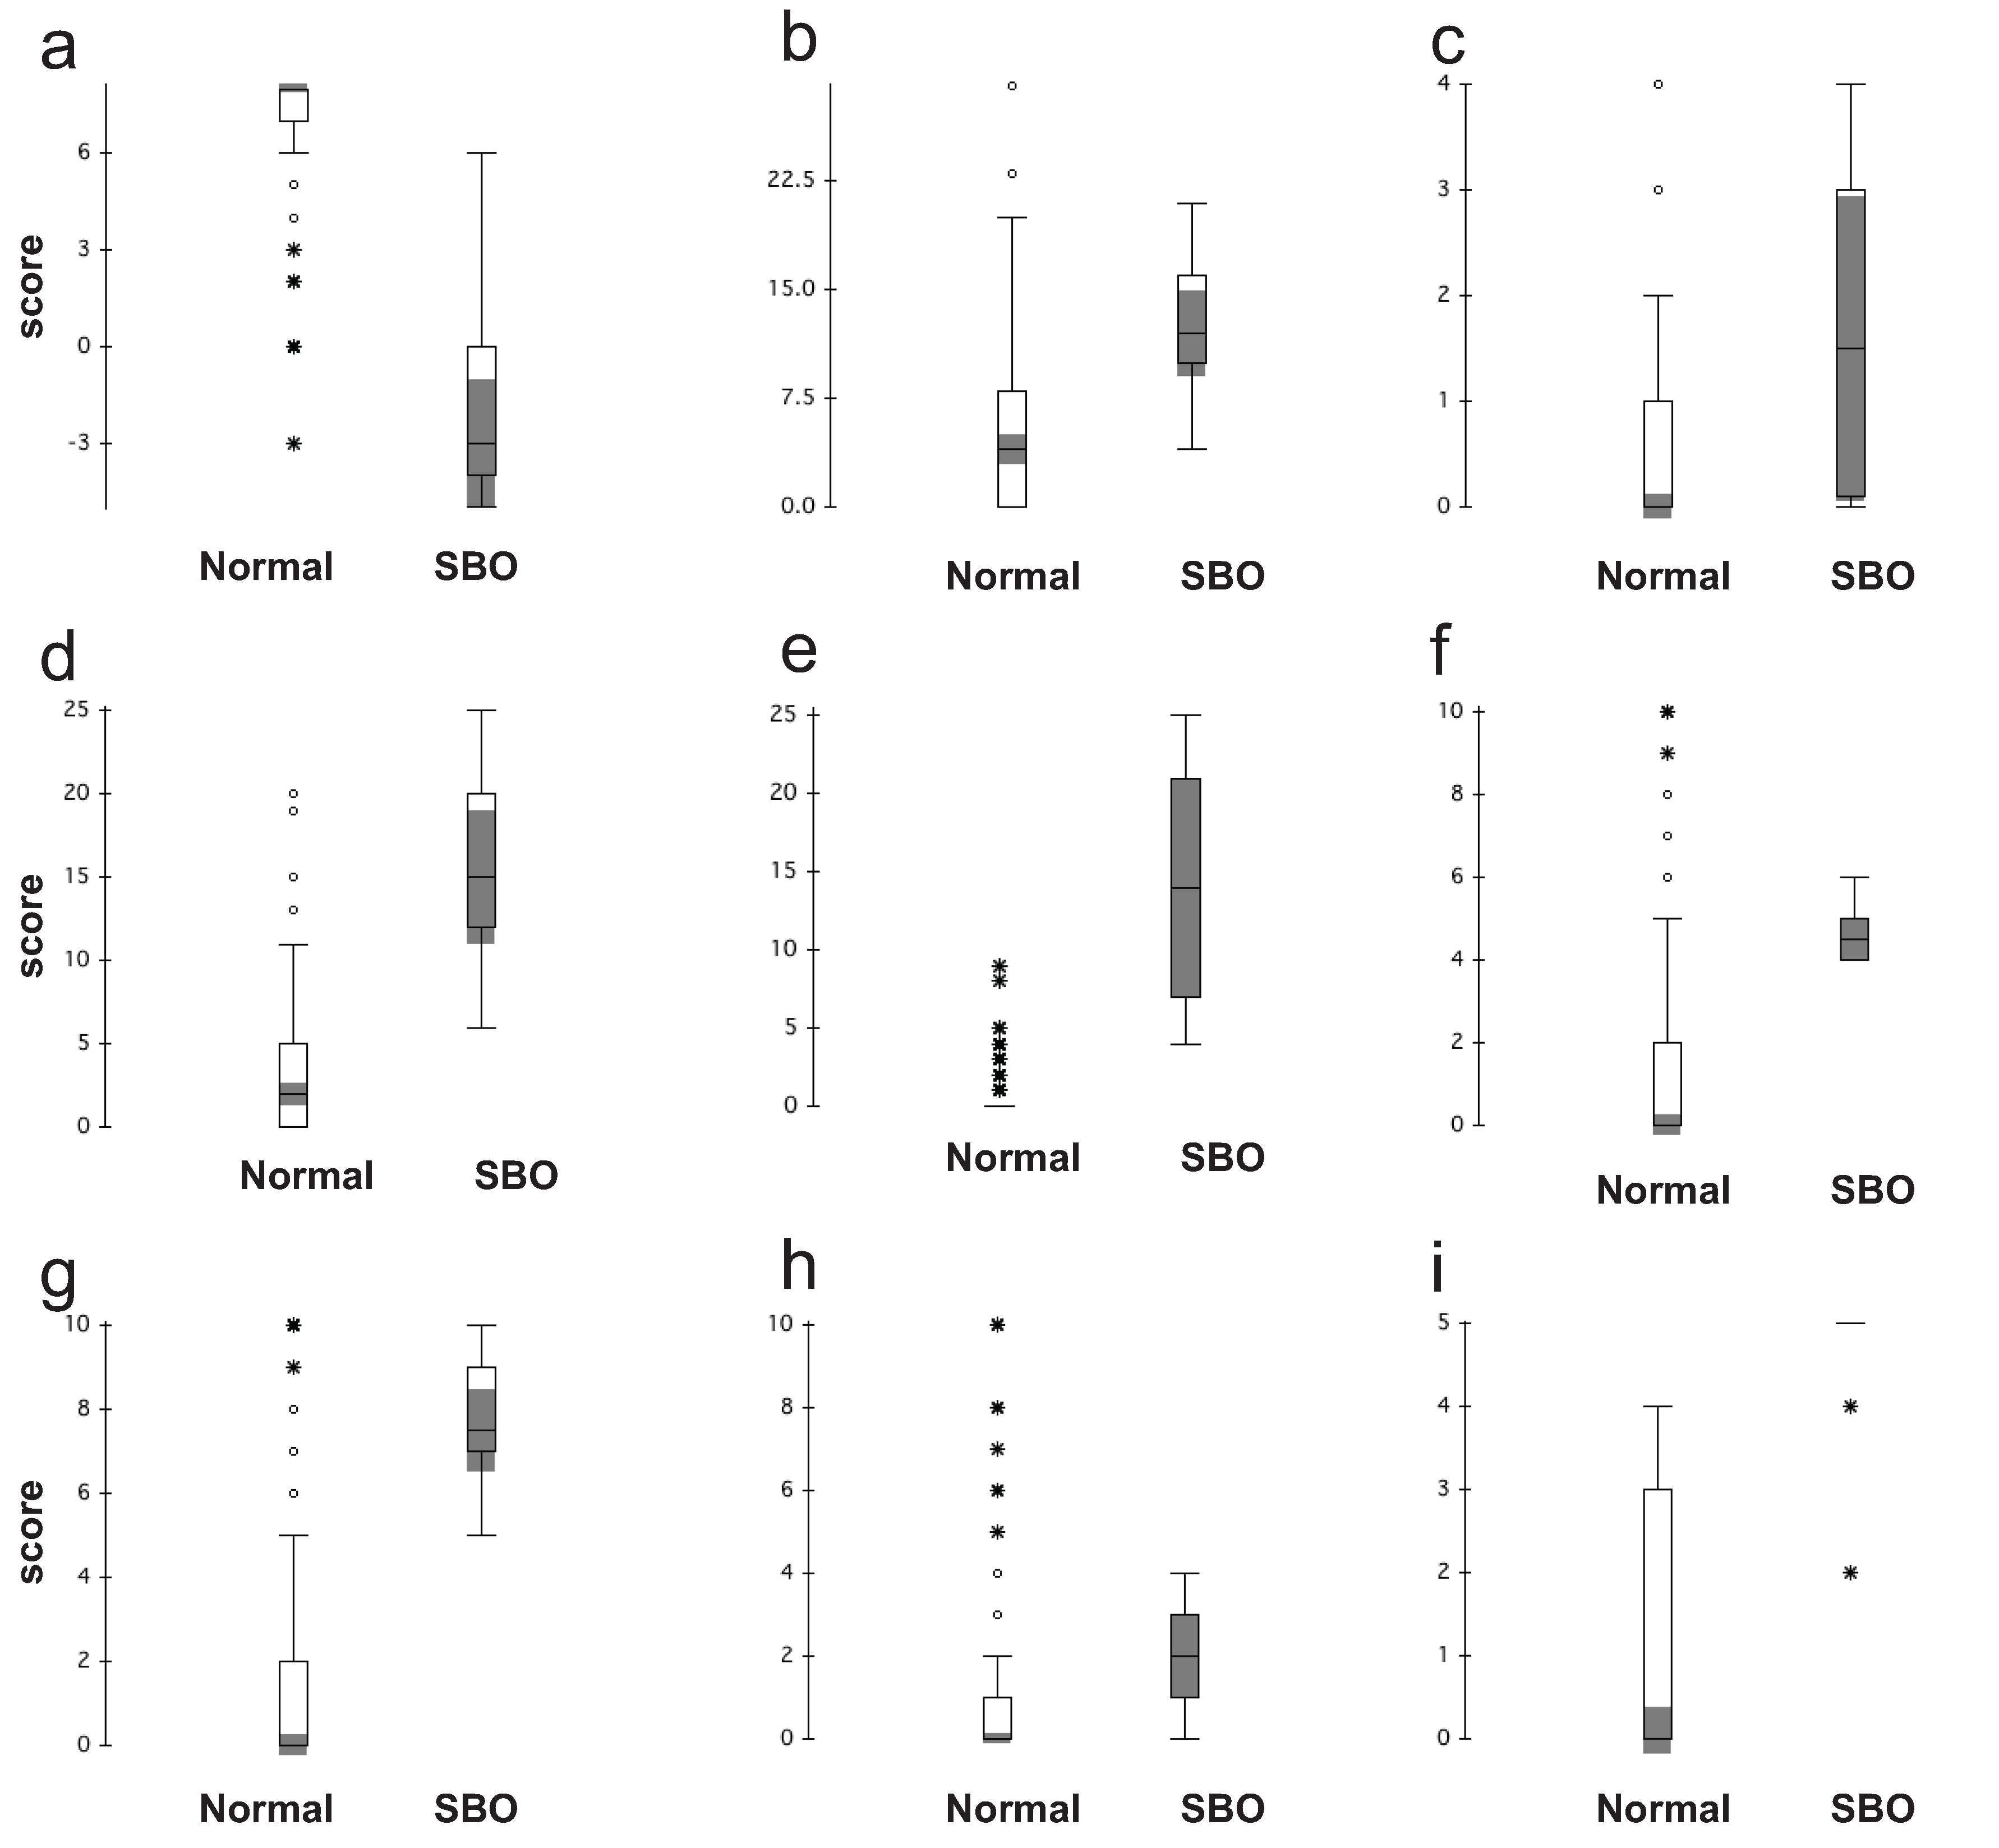
Discriminate validity was assessed by comparing the calculated sum-mean values for each of the domains for the normal and SBO patient populations to demonstrate that each population was distinct. Box and whisker plots showing the ranges for responses in each group are located in
Figure 1. There were clear differences between the two groups in all domains except pain and medication, which was to be expected, based upon published studies outlying the large percentage of the normal population with chronic pain [
18,
19,
20].
Table 4 shows multiplicity adjusted
p-values for comparing mean scores between the normal and SBO population, across all domains. All the cumulative quality of life domains (diet, pain, GI symptoms and QOL) showed a significant difference. Single question domains (medication, pain duration and pain scores) were more variable, however significant differences were observed in the duration and level of pain reported by the subjects with the SBO population reporting more severe, sustained pain.
3.5. Establishment of Normative Values for Domains
Normative ranges for each domain were determined based upon the 25–50–75 percentiles for each domain score ranges, while ensuring clinical relevance (See
Table 5). The prescribed ranges were supported in the standard deviation for the respective domains in the normal subject population (
Table 3). There are four distinct ranges for each domain: no impact, mild impact, moderate impact, and severe impact shown in
Table 6. The normative values for medication usage were assigned based upon clinical relevance; where it was determined to be clinically significant for any subject to require medication more than 10 days a month for this instrument.
Figure 1.
Box and whisker plots for normal and SBO populations for each domain in the SBO survey. Each domain is represented separately: (a) diet; (b) pain; (c) medication; (d) gastrointestinal symptom; (e) quality of life; (f) average pain on the pain scale; (g) maximum level of pain on the pain scale; (h) minimum level of pain on the pain scale; and (i) duration of pain. The box represents the 25% to 75% percentile values; the horizontal line is the median. The whiskers on the box show the main data while extreme outliers are denoted by open circles and very extreme outliers are denoted by a starburst. The shading shows the 95% confidence interval around the median.
The ranges for pain duration and intensity are not cumulative and are represented in this questionnaire as single items to assess the change of pain experienced over time, in line with other validated questionnaires in use for various other conditions. No single range was identified as “normal” or “no impact” due to the variability in these measures that have been reported by others and the overall design for this questionnaire to be used as a tool to monitor change and/or improvements with treatment. A significant improvement or change in reported pain scores is accepted as a 2 point change per the FDA guidelines and large published studies, therefore a change in the visual analog pain scale of 2 points or greater is considered a significant change [
21,
22].
Based upon our assigned ranges for all the domains, it was observed that 89.3% of the normal population fell within the defined no impact category for diet while only 10% of SBO subjects reported no impact in their diet. Within the pain domain, 83.2% of normal subjects reported composite scores within the no impact range, compared to 30% of the SBO subjects. The normal population scores fell within the no impact range for QOL and GI symptoms 98.6% and 96.6% respectively; the SBO subjects’ scores for no impact QOL was 30% and 20% for GI symptoms. The definition of a normal population was quite broad for this study, excluding only subjects with a history of bowel obstruction, cancer, chemotherapy, radiation or surgery. Given these exclusionary criteria, it was expected that 10%–30% of the respondents would have a chronic pain, gastrointestinal disease or other contributory condition shifting their composite score for a domain outside of the no impact range that would be expected in a normal population [
17,
18,
19,
20,
23].
Table 4.
Comparison of the normal population and SBO groups for condition specific validity for all domains measured in the SBO QOL questionnaire.
Table 4.
Comparison of the normal population and SBO groups for condition specific validity for all domains measured in the SBO QOL questionnaire.
| Group | Domain Mean(SD) Scores | T-Test | Bonferroni Adjusted |
|---|
| Diet |
| SBO | 5.4(4.3) | <0.0001 | <0.0009 |
| Normal | 15.13(1.9) | | |
| Pain |
| SBO | 12.4(4.7) | 0.0006 | 0.0052 |
| Normal | 4.88(5.5) | | |
| Medication |
| SBO | 1.7(1.49) | 0.0615 | 0.5533 |
| Normal | 0.68(1.4) | | |
| GI Symptoms |
| SBO | 15.4(6.4) | 0.0002 | 0.0014 |
| Normal | 3.01(3.8) | | |
| QOL |
| SBO | 14.3(7.7) | 0.0003 | 0.0029 |
| Normal | 0.58(1.43) | | |
| Average Pain Level |
| SBO | 4.7(0.8) | <0.0001 | <0.0009 |
| Normal | 1.26(2.21) | | |
| Maximum Pain Level |
| SBO | 7.8(1.7) | <0.0001 | <0.0009 |
| Normal | 1.6(2.6) | | |
| Minimum Pain Level |
| SBO | 1.9(1.2) | 0.0369 | 0.3320 |
| Normal | 0.94(1.96) | | |
| Duration of Pain |
| SBO | 4.6(0.97) | <0.0001 | <0.0009 |
| Normal | 1.2(1.5) | | |
Table 5.
Domain quartiles for each measured domain in the SBO QOL questionnaire based upon one standard deviation in a normal population.
Table 5.
Domain quartiles for each measured domain in the SBO QOL questionnaire based upon one standard deviation in a normal population.
| Domain | Minimum | 25% | 50% | 75% | Maximum |
|---|
| Diet | 0 | 4 | 8 | 12 | 16 |
| Pain | 0 | 10 | 20 | 30 | 40 |
| Medication | 0 | 1 | 2 | 3 | 4 |
| GI Symptoms | 0 | 11 | 22 | 33 | 44 |
| QOL | 0 | 7 | 14 | 21 | 28 |
Table 6.
Grouping of degree of impact on quality of life for each measured domain. The sum of the domain scores is used to determine the classification in the degree of impact on the patient’s quality of life for that domain. No impact is defined for this questionnaire as the expected values in a normal healthy individual.
| Domain | No Impact | Slight Impact | Moderate Impact | Severe Impact |
|---|
| Diet | 13–16 | 9–12 | 5–8 | 0–4 |
| Pain | 0–9 | 10–19 | 20–29 | 30–40 |
| GI symptoms | 0–10 | 11–21 | 22–32 | 33 to 44 |
| QOL | 0–7 | 8–14 | 15–21 | 22–28 |
| Medication | 0–1 | 2 | 3 | 4 |

