Article

Burden and Trend of Macrosomia and Large-for-Gestational-Age Neonates Attributable to High Pre-Pregnancy Body Mass Index in China, 2013–2017: A Population-Based Retrospective Cohort Study

1
Institute of Epidemiology and Statistics, School of Public Health, Lanzhou University, Lanzhou 730000, China
2
National Research Institute for Family Planning, Beijing 100081, China
3
National Human Genetic Resources Centre, Beijing 100035, China
4
Graduate School of Peking Union Medical College, Beijing 100730, China
5
Department of Maternal and Child Health, National Health Commission of the PRC, Beijing 100044, China
*
Authors to whom correspondence should be addressed.
These authors contributed equally to this work.
Healthcare 2023, 11(3), 331; https://doi.org/10.3390/healthcare11030331
Submission received: 14 December 2022 / Revised: 15 January 2023 / Accepted: 19 January 2023 / Published: 22 January 2023
(This article belongs to the Special Issue Health Disparities in Perinatal Epidemiology and Access to Healthcare)

Abstract

:
Background: The world is transitioning to an obese future, but few studies have measured the burden of increased maternal body mass index (BMI) on pathological fetal overgrowth, especially the trends in this burden and its heterogeneity in populations with different characteristics. Methods: A population-based retrospective cohort study was conducted with 7,998,620 Chinese females who had participated in the National Free Pre-Pregnancy Check-ups Project and became pregnant during 2013–2017. The proportions of macrosomic and LGA neonates attributable to high BMI (population attributable fraction, PAF) and annual percent change of yearly PAFs were estimated. Results: We found that the burden of macrosomic and LGA (large-for-gestational-age) neonates attributable to high pre-pregnancy BMI increased among Chinese females with planned pregnancies during 2013–2017. The PAF of macrosomia attributable to high BMI increased from 3.16% (95% confidence interval: 2.97–3.35%) to 7.11% (6.79–7.42%) by 23.60% (16.76–30.85%) annually, and the PAF of LGA increased from 2.35% (2.21–2.48%) to 5.00% (4.79–5.21%) by 21.98% (16.14–28.11%) annually. Our study identified that participants with disadvantaged socioeconomic status (including those without higher education, living in provinces with GDP per capita < 40,000 CNY, tier IV, and tier V cities) and residing in northern and southwestern China were at high risk of a rapidly expanding burden. Conclusions: Government authorities should control pre-pregnancy BMI through nationwide intervention programs and direct more resources to focus on the unfair burden on females with disadvantaged socioeconomic status.

1. Introduction

Pathological fetal overgrowth, including macrosomia and large-for-gestational-age (LGA), is a clinically important reproductive health problem and has long-lasting metabolic impacts on the next generation [1,2,3]. The prevalence of macrosomia and LGA is approximately 1–20% and 4–22% worldwide and 3–14% and 7–22% in China, respectively [4,5,6,7]. The risk of macrosomia and LGA in neonates could be effectively reduced by blood sugar management, exercise, weight gain management, and lifestyle intervention before conception and during gestation [8].
Established evidence has concluded a clear causal relationship between maternal high pre-pregnancy body mass index (BMI) and the risk of increased birth weight; maintaining a healthy pre-pregnancy BMI level could significantly reduce the risk of macrosomia and LGA in offspring [9]. The world is still transitioning to an obese future and high BMI is clearly not well controlled worldwide [10]. In China, overweight and obesity defined by WHO BMI cut-offs in adult women have increased dramatically from 24.6% and 3.7% in 2004 to 36.7% and 7.2% in 2018, respectively, making a growing number of reproductive-aged women at risk of giving birth to macrosomic and LGA neonates [11]. Additionally, high pre-pregnancy BMIs are found to play a crucial role in the epidemic of metabolic diseases in the next generation, burdening global public health [2,3]. Compared with increasing numbers of studies on high pre-pregnancy BMI and the risk of birth weight and LGA, only a few international studies have assessed the trend and burden of macrosomia and LGA attributable to high pre-pregnancy BMI. Especially in China, a country with a rapidly rising high BMI problem, there is a lack of sufficient evidence to guide public health practice.
In this retrospective cohort study, we aimed to characterize the trend and burden of macrosomic and LGA neonates attributable to high pre-pregnancy BMI in mainland China during 2013–2017.

2. Materials and Methods

2.1. Study Setting

The current study is based on data from the National Free Pre-Pregnancy Check-ups Project (NFPCP) in China, which was launched in pilot counties by the National Health Commission and the Ministry of Finance in 2010. The NFPCP is intended to provide free pre-pregnancy health examination and counselling services for couples planning to become pregnant in the next six months. The NFPCP became nationally representative after the project expanded to all counties in 2013.
In brief, NFPCP includes preconception examination, early pregnancy follow-up, and outcome follow-up. At the preconception examination, a face-to-face structured questionnaire, physical examination, and laboratory tests were applied by trained healthcare workers to obtain the baseline characteristics of the participants. After the completion of the preconception examination, participants will be followed up via telephone at trimester intervals to determine whether they have successfully conceived. Once pregnancy events are recorded, participants will be asked to undergo ultrasonography to confirm the conception. Pregnancy participants will be recontacted for pregnancy outcomes within 1 year of the completion of early-pregnancy follow-up. Detailed design, implementation, and quality control can be found elsewhere [12].

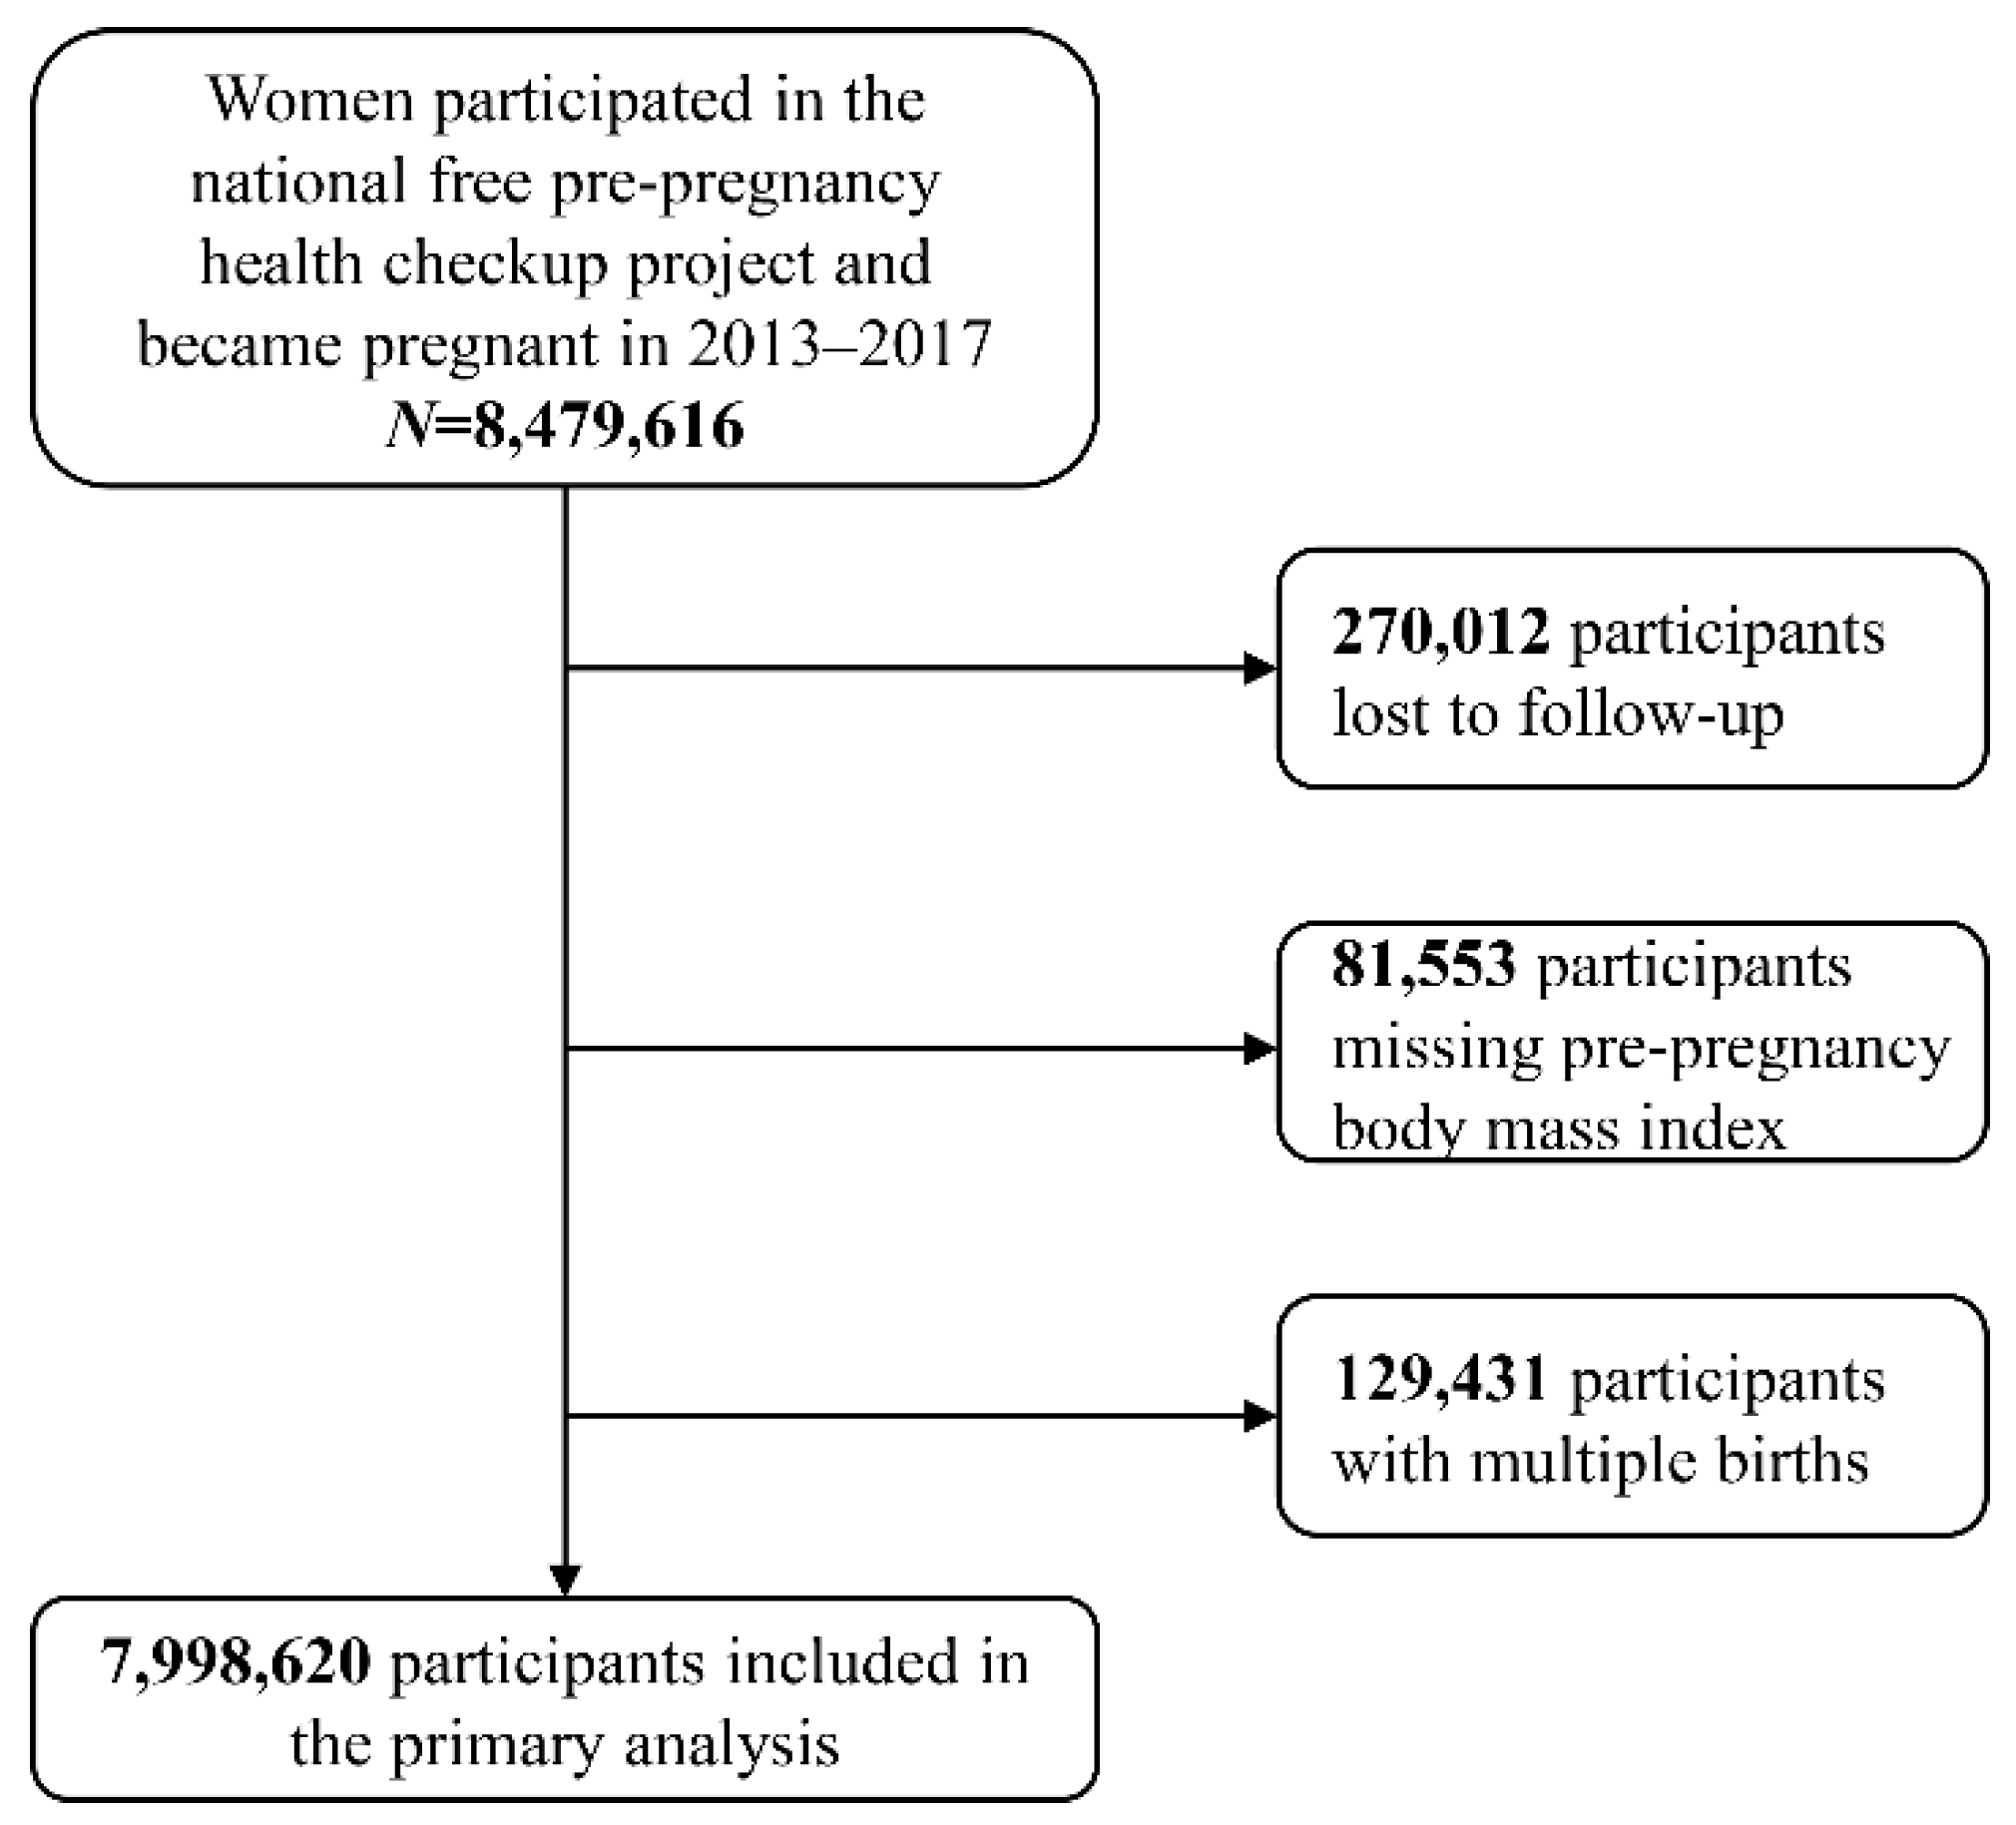
2.2. Study Population

In the current study, a total of 8,479,616 NFPCP participants who became pregnant from January 2013 to December 2017 were included. After excluding participants who were lost to follow-up, with missing BMI, and multiple births, 7,998,620 participants were included in the final analysis (Figure 1).

2.3. Exposure and Outcomes

Maternal high pre-pregnancy BMI is regarded as the main exposure, defined as the pre-pregnancy weight divided by the square of the height (kilograms/square meters) ≥ 25.0 kg/m2 using World Health Organization (WHO) criteria [13]. Height and weight measurements were performed indoors, with participants barefoot and wearing light clothing, and were measured using instruments that met national standards.
Both macrosomia and LGA are regarded as the main outcomes. Macrosomia is defined as a birth weight of >4000 g, and LGA is determined by having a birth weight greater than the 90th percentile for all NFPCP deliveries of the same sex and gestational age [14,15].

2.4. Covariates

Covariates used in the current study include maternal and paternal age (20–24, 25–29, 30–34, and ≥35 years), higher education (education ≥ 10 years, categorized into no and yes), nationality (Han and minority (including the remaining 55 ethnic groups), the ethnic Han are the ethnic majority in China, while the ethnic minority account for less than 9% of the population, household registration (rural and urban), smoking (no and yes), secondhand smoking (no, 1–14, and ≥ 15 min/day), alcohol drinking (no and yes), parity (nulliparous and parous), infant sex (male and female), gross domestic product (GDP) per capita (<40,000, 40,000–, 50,000–, and 70,000– CNY) [16], city tier (tier I (4 cities), new tier I (15 cities), tier II (30 cities), tier III (70 cities), tier IV (90 cities), and tier V (128 cities)), and region (northeast, north, northwest, east, central, south, and southwest). The city tier is based on the standard classification of the official Chinese media, a comprehensive classification system that reflects the concentration of resources, political and economic development, lifestyle diversity, and future development prospects of cities in mainland China [17].
Only maternal age, paternal age, higher education, nationality, household registration, smoking, secondhand smoking, alcohol consumption, parity, infant sex, and region were considered as confounders in multivariate analyses. Because the substantial influence of infant sex on the outcomes and levels of service may vary across the entire nation, we also additionally adjusted for infant sex and the region of provinces.

2.5. Statistical Analysis

We used numbers (n) and percentages (%) to describe the baseline characteristics of participants, and we applied χ2 tests to determine differences in baseline characteristics across the last menstrual period (LMP) years.
Yearly multivariate-adjusted relative risks (RRs), along with the prevalence of higher BMI, incidence of macrosomia and LGA were calculated. RRs and their 95% corresponding confident intervals (CIs) were estimated using a log-binomial regression model with the adjustment of maternal age, paternal age, higher education, nationality, household registration, smoking, secondhand smoking, alcohol consumption, parity, infant sex, and region. We used the normal weight defined by WHO criteria (18.5–24.9 kg/m2) as the reference group when estimating RRs.
The population attributable fraction (PAF) was used to measure the burden of macrosomia and LGA attributable to high BMI among the study population. Both crude and confounders-adjusted PAFs and their 95% CIs were calculated. The corresponding formulas are listed below:
C r u d e   P A F = p   ( R R 1 ) 1 + p   ( R R 1 ) C o n f o u n d e r s - a d j u s t e d   P A F = p d   ( R R 1 R R )
where p is the proportion of the population exposed to high BMI, pd is the proportion of macrosomic or LGA neonates exposed to higher BMI, RR is the crude RR for crude PAF and multivariate-adjusted RR for confounders-adjusted PAF [18].
We used annual percent change (APC), estimated using a log-linear model, to measure the temporal trends of indices, including prevalence of high BMI, incidences of macrosomia and LGA, RRs of macrosomia and LGA with high BMI, PAFs of macrosomia and LGA attributable to high BMI.
We used subgroup analyses based on baseline characteristics to explore the within-population heterogeneity of burden and trends of macrosomia and LGA attributable to high BMI, and simple linear regression was used to fit trends in PAF and APC for each subgroup.
Statistical analyses were performed using R (version 4.0.4). Graphs were plotted using GraphPad Prism (version 9.4.0). A two-sided p value of <0.05 was considered statistically significant.

3. Results

The baseline characteristics of the participants by LMP years are presented in Table 1. The proportions of participants with maternal age ≥30 years (17.17% to 32.51%), paternal age ≥30 years (28.71% to 43.78%), higher education (33.80% to 42.14%), and urban residency (6.13% to 12.93%) increased during 2013–2017, and the proportions of participants who were nullipara (70.51% to 49.24%) decreased. Most participants did not smoke or drink alcohol daily and were not exposed to secondhand smoke.
The prevalence of high BMI, incidence of macrosomia and LGA, and RRs of macrosomia and LGA with high BMI significantly changed during the study period (Table 2). The prevalence of high BMI increased from 8.78% in 2013 to 12.91% in 2017, with an APC of 11.56% (5.36–18.13%). The incidence of macrosomia and LGA decreased from 4.79% and 9.31% to 3.32% and 8.08%, respectively, with annual declines of 7.89% (3.15–12.40%) and 3.15% (1.26–5.01%), respectively. RRs of macrosomia and LGA with high BMI increased from 1.34 (1.31–1.37) and 1.25 (1.23–1.27) in 2013 to 1.54 (1.50–1.58) and 1.37 (1.35–1.39) in 2017 by 3.51% (2.39–4.64%) and 2.29% (1.74–2.84%) annually, respectively (p for trend < 0.01).
Table 3 describes PAFs of macrosomia and LGA attributable to high BMI from 2013 to 2017. After adjustment for potential confounders, we found that the PAF of macrosomia attributable to high BMI increased from 3.16% (2.97–3.35%) in 2013 to 7.11% (6.79–7.42%) in 2017 by 23.60% (16.76–30.85%) annually (p for trend < 0.01), and the PAF of LGA increased from 2.35% (2.21–2.48%) to 5.00% (4.79–5.21%) by 21.98% (16.14–28.11%) annually (p for trend < 0.01). Sensitivity analyses after excluding participants with pre-pregnancy diabetes, hypertension or thyroid disease showed consistent results (Tables S1–S3).
Consistent results can be found in subgroup analyses (Figure 2). In general, subgroups with higher PAFs have lower APCs, and vice versa. The two subgroups of higher education and region (only in macrosomia) have reversed trends. Macrosomic and LGA neonates attributable to high BMI among participants without higher education were comparable to participants with higher education but had a considerably higher growth rate (APCs: 24.58% vs. 20.86% for macrosomia and 22.47% vs. 20.32% for LGA neonates). Participants living in provinces with GDP per capita < 40,000 CNY have a relatively higher burden and rapid growth of macrosomia (PAF: 5.21%; APC: 29.60%) and LGA neonates (PAF: 3.83%; APC: 30.20%) attributable to higher BMI. A similar situation could be observed in participants living in tier IV and tier V cities. In terms of subgroup analyses according to region, participants in northern China and southwestern China have remarkable expansion of macrosomic (PAF: 7.46% and 7.41%; APC: 36.54% and 25.49%) and LGA neonates (PAF: 4.46% and 5.67%; APC: 34.04% and 26.51%) attributable to higher BMI.

4. Discussion

In the current population-based retrospective cohort study of 7,998,620 planned pregnancies in mainland China, we measured the burden of macrosomic and LGA neonates attributable to high pre-pregnancy BMI during 2013–2017, and for the first time identified an increasing trend in this burden, as well as identifying populations at high risk of the burden. Our findings provide solid support for public health practitioners and policy-makers to employ targeted strategies and interventions on reproduction health equity promotion.
Trends of macrosomic and LGA neonates attributable to high pre-pregnancy BMI are easily neglected problems in public health practice. As the prevalence of high BMI is still climbing steadily worldwide, the growing body of macrosomic and LGA neonates attributable to high BMI is not surprising. Despite the decreased prevalence of macrosomia and LGA, trends of macrosomic and LGA neonates attributable to high BMI outpaced the increasing rate of high BMI. Additionally, compared to 23.4% of macrosomic and 9.0% of LGA neonates in Australia during 2010–2014, 24.3% of macrosomia in Nova Scotia in Canada during 2004–2010, 13.7% of LGA in Amsterdam during 2003–2004, 24.87% of macrosomia and 17.36% of LGA (re-estimated for comparison) in Japan during 2010–2019, 13.18% of macrosomia(re-estimated for comparison) in Korea during 2013–2017, and 13.08% of LGA(re-estimated for comparison) in Korea during 2007–2009, the burdens of macrosomia (4.44%) and LGA (3.33%) attributable to high BMI were lower in the current population [19,20,21,22,23,24]. However, macrosomia and LGA attributable to high BMI in the current study had annual growth rates of 23.60% and 21.98%, respectively, which were far beyond 1.43% and 1.57% (recalculated for comparison) in Australia during 1990–2014 [19]. Alternatively, if we change the definition of high BMI to the Chinese domestic standard of ≥24.0 kg/m2, the growth rates were not substantially changed (Table S4). A growing burden of macrosomia and LGA attributable to high BMI in mainland China is expected in the coming decade, accelerating adverse impacts on the metabolic health of the next generation.
All the increased prevalence of high BMI, the decreased prevalence of macrosomic and LGA neonates, and the increased association magnitude of high BMI with the risk of macrosomia and LGA contributed to the growing burden. With increased exposure to the obesogenic environments of unhealthy dietary patterns and reduced physical activity, the increased trend of high BMI in the current population was identical to the trend in the general population [11,25,26]. However, the magnitude of growth greatly exceeded growth rates (3.55% during 2000–2018 and 1.05% during 2013–2018) recalculated using data from the China Chronic Disease and Risk Factors Surveillance (CCDRFS) [11]. Because of the younger age structure in NFPCP participants, the prevalence of high BMI was well below that of adult females (43.9%) in 2018 in mainland China [11]. In addition, the decreased prevalence of macrosomia and LGA could be mainly attributable to intensive antenatal care services for successful gestational weight gain control [27]. Control of modifiable risk factors for macrosomia and LGA during gestation would increase PAF attributed to pre-pregnancy modifiable risk factors, including BMI in the current study. We also acknowledged the lower RRs for macrosomia and LGA with pre-pregnancy BMI when compared to the results from the Western population, which could be attributed to the different BMI levels in two kinds of high BMI populations [19,20,28]. The reason could also be applied to explain the increased magnitude of RRs in the current study, where the mean BMI levels were increased in high BMI participants. When comparing the results with those of Japan and Korea, even using the same high BMI criterion (≥25 kg/m2), their high pre-pregnancy BMI ORs for macrosomia and LGA were more than 1.75 and 2.15 times higher than those of China, respectively, and it is speculated that the RR values in China have a tendency to further approach those of Japan, Korea, and Western countries, and further studies are needed for this phenomenon [23,24].
It is also imperative to explore the within-population heterogeneity and identify high-risk populations to guide public health practitioners and policy-makers to appropriately allocate healthcare resources to lower the growing burden. In China, after decades of health legislation and investment in health resources, the government has constructed a system of free preconception screening, maternal and child health management, and newborn screening. Hospitals above the second level with sufficient obstetricians and maternal and child health institutions are primarily responsible for delivery, while primary institutions and community health services focus on prenatal care and high-risk pregnancy screening, making a significant contribution to improving maternal and newborn health [29,30]. However, inequalities in maternal health rights occur due to the vast size of China, large differences in economic, medical, and healthcare resources between regions, an inadequate health insurance system for the mobile population, and a lower density of maternal and child health workers in primary care facilities than internationally recommended [31]. The growing burden of macrosomic and LGA neonates attributable to high pre-pregnancy BMI consisted of nearly all subgroups, which implied universal insufficiency of high pre-pregnancy BMI prevention, and more public health resources should be invested in the field. Here, we also identified that participants without higher education and living in provinces with GDP per capita < 40,000 CNY, cities of tier IV and tier V, and northern and southwestern China were at high risk of a rapidly expanding burden of macrosomia and LGA attributable to high pre-pregnancy BMI. These identified high-risk populations potentially shared similar disadvantages in socioeconomics, including awareness of sufficient knowledge on pre-pregnancy health promotion, accessibility of qualified reproduction health services, and adequate antenatal care.
Our study also has significant public health implications. The nationwide growing burden calls for an urgent need to stay alert to metabolic pressure from the current generation and preventing high pre-pregnancy BMI. The central role of women with pregnancy intentions in transgenerational metabolic diseases among public health policy-makers and practitioners should be acknowledged. Practical ways include strengthening health counselling services focusing on healthy BMIs and adverse impacts of higher BMIs on the two generations in premarital check-ups, preconception check-ups, and fertility clinics [32,33]. The heterogeneity also highlights the inequitable growing burden in high-risk females with low socioeconomic status, and more healthcare resources should be mobilized to discontinue adverse transitions in socioeconomically disadvantaged communities.
In addition to using a retrospective cohort study based on a large sample size to measure the burden of macrosomic and LGA neonates attributable to high pre-pregnancy BMI in mainland China, our study has the advantage of identifying, for the first time, the rate and direction of change in this burden and the high-risk populations that are under threat in this variation, leading to better targeting of resources for policy.
Our study has some limitations. Firstly, our study has insufficient ability to measure central obesity-associated macrosomic and LGA neonates. Secondly, factors such as weight gain during pregnancy, reproductive assisted technology, and blood glucose have been reported to affect the birth weight of newborns [34,35,36]. However, the present study was unable to control for confounding factors, including maternal weight gain, infertility treatment, glycaemia control, macrosomia and LGA in previous pregnancies when estimating RRs, because relevant data were not collected. It would overestimate the burden of macrosomic and LGA neonates attributed to high pre-pregnancy BMI but has limited impacts on the trends of burden. The results in nulliparous participants and participants excluding pre-pregnancy diabetes, hypertension, or thyroid disease (Tables S1–S3) can alternatively assess the uncontrolled bias caused by these factors. Thirdly, unwanted pregnancies are not covered in the current study, which may lower the generalizability of our study. According to a survey published in 2013 of sexually active unmarried youth in Shanghai, China, less than 9.5% of unintended pregnancies continue, so we believe our results are still generalizable to the whole of pregnancies in mainland China [37]. Lastly, the study has limited power to determine long-term temporal trends of the burden, but the findings are still of public health value to shed light on high pre-pregnancy BMI control of the next decade.

5. Conclusions

In conclusion, the findings from this cohort study suggest that the growing body of high pre-pregnancy BMI should be comprehensively controlled and resources for reproductive health services should be directed towards socioeconomically disadvantaged communities to lessen the burden of macrosomic and LGA neonates.

Supplementary Materials

The following supporting information can be downloaded at: https://www.mdpi.com/article/10.3390/healthcare11030331/s1, Table S1: Table S1. Confounders-adjusted Burden and Trends of Macrosomia and LGA Neonates Attributed to High Body Mass Index in China From 2013 to 2017 After Excluding Participants With Pre-pregnancy Diabetes; Table S2. Confounders-adjusted Burden and Trends of Macrosomia and LGA Neonates Attributed to High Body Mass Index in China From 2013 to 2017 After Excluding Participants With Pre-pregnancy Hypertension; Table S3. Confounders-adjusted Burden and Trends of Macrosomia and LGA Neonates Attributed to High Body Mass Index in China From 2013 to 2017 After Excluding Participants With Pre-pregnancy Thyroid Disease; Table S4. Burden and Trends of Macrosomia and LGA Neonates Attributed to High Body Mass Index in China During 2013-2017 According to the Chinese BMI Classification Standard.

Author Contributions

X.M. and L.W. designed the study, provided overall guidance, and revised the manuscript. S.Z. and Y.Y. conducted the study, analyzed the data, interpreted the results, and were major contributors to writing the manuscript. S.Z., Y.Y., and L.W. have full access to the data and take responsibility for the data integrity and the accuracy of data analysis. C.H., R.M., Y.D., X.L., W.X., J.H., and S.W. revised the manuscript. Y.Z. (Ya Zhang), H.Z., Y.H., Z.P., Y.W., H.S., Q.W., Y.Z. (Yiping Zhang), and D.Y. collected the data. All authors have read and agreed to the published version of the manuscript.

Funding

This work was supported by the National Key Research and Development Program of China (grant number 2021YFC2700705), the National Natural Science Foundation of China (grant number 82003472), and the Excellent Graduate student “Innovation Star” project of education department of Gansu province (grant number 2021CXZX-158).

Institutional Review Board Statement

The study was approved by the Institutional Research Review Board of the National Institute of Health and Family Planning, People’s Republic of China (No. IRB201001). All participants signed informed consent forms prior to NFPCP participation.

Informed Consent Statement

Informed consent was obtained from all subjects involved in the study.

Data Availability Statement

NFPCP data contained sensitive data and cannot be shared via public deposition because of information governance restrictions in place to protect individuals’ confidentiality. Access to data for external researchers (not affiliated with the National Research Institute for Family Planning) requires researchers to be physically based in the institute. Access to data is available only once approval has been obtained through the individual constituent entities controlling access to the data.

Acknowledgments

We thank the participants of this study, the investigators from maternal and child healthcare facilities, and the development and management team of this project based in Beijing.

Conflicts of Interest

The authors declare no conflict of interest.

Abbreviations

LGALarge-for-gestational-age
BMIBody mass index
NFPCPNational Free Pre-Pregnancy Check-ups Project
WHOWorld Health Organization
LMPLast menstrual period
RRRelative risk
CIConfidence interval
PAFPopulation attributable fraction
APCAnnual percent change
CCDRFSChina Chronic Disease and Risk Factors Surveillance

References

  1. Viswanathan, S.; McNelis, K.; Makker, K.; Calhoun, D.; Woo, J.G.; Balagopal, B. Childhood obesity and adverse cardiometabolic risk in large for gestational age infants and potential early preventive strategies: A narrative review. Pediatr. Res. 2021, 92, 653–661. [Google Scholar] [CrossRef] [PubMed]
  2. Warrington, N.M.; Beaumont, R.N.; Horikoshi, M.; Day, F.R.; Helgeland, Ø.; Laurin, C.; Bacelis, J.; Peng, S.; Hao, K.; Feenstra, B.; et al. Maternal and fetal genetic effects on birth weight and their relevance to cardio-metabolic risk factors. Nat. Genet. 2019, 51, 804–814. [Google Scholar] [CrossRef]
  3. Pirkola, J.; Pouta, A.; Bloigu, A.; Hartikainen, A.-L.; Laitinen, J.; Järvelin, M.-R.; Vääräsmäki, M. Risks of overweight and abdominal obesity at age 16 years associated with prenatal exposures to maternal prepregnancy overweight and gestational diabetes mellitus. Diabetes Care 2010, 33, 1115–1121. [Google Scholar] [CrossRef] [Green Version]
  4. Koyanagi, A.; Zhang, J.; Dagvadorj, A.; Hirayama, F.; Shibuya, K.; Souza, J.P.; Gülmezoglu, A.M. Macrosomia in 23 developing countries: An analysis of a multicountry, facility-based, cross-sectional survey. Lancet 2013, 381, 476–483. [Google Scholar] [CrossRef] [PubMed]
  5. Orskou, J.; Kesmodel, U.; Henriksen, T.B.; Secher, N.J. An increasing proportion of infants weigh more than 4000 grams at birth. Acta Obstet. Gynecol. Scand. 2001, 80, 931–936. [Google Scholar]
  6. Harvey, L.; van Elburg, R.; van der Beek, E.M. Macrosomia and large for gestational age in Asia: One size does not fit all. J. Obstet. Gynaecol. Res. 2021, 47, 1929–1945. [Google Scholar] [CrossRef] [PubMed]
  7. Henriksen, T. The macrosomic fetus: A challenge in current obstetrics. Acta Obstet. Gynecol. Scand. 2008, 87, 134–145. [Google Scholar] [CrossRef] [PubMed]
  8. Garmendia, M.L.; Casanello, P.; Flores, M.; Kusanovic, J.P.; Uauy, R. The effects of a combined intervention (docosahexaenoic acid supplementation and home-based dietary counseling) on metabolic control in obese and overweight pregnant women: The MIGHT study. Am. J. Obstet. Gynecol. 2021, 224, 526.e1–526.e25. [Google Scholar] [CrossRef]
  9. Poston, L.; Caleyachetty, R.; Cnattingius, S.; Corvalan, C.; Uauy, R.; Herring, S.; Gillman, M.W. Preconceptional and maternal obesity: Epidemiology and health consequences. Lancet Diabetes Endocrinol. 2016, 4, 1025–1036. [Google Scholar] [CrossRef]
  10. Bluher, M. Obesity: Global epidemiology and pathogenesis. Nat. Rev. Endocrinol. 2019, 15, 288–298. [Google Scholar] [CrossRef]
  11. Wang, L.; Zhou, B.; Zhao, Z.; Yang, L.; Zhang, M.; Jiang, Y.; Li, Y.; Zhou, M.; Wang, L.; Huang, Z.; et al. Body-mass index and obesity in urban and rural China: Findings from consecutive nationally representative surveys during 2004–2018. Lancet 2021, 398, 53–63. [Google Scholar] [CrossRef] [PubMed]
  12. Zhang, S.; Wang, Q.; Shen, H. [Design of the national free proception health examination project in China]. Zhonghua Yi Xue Za Zhi 2015, 95, 162–165. [Google Scholar] [PubMed]
  13. World Health Organization. Obesity and Overweight. 2021. Available online: https://www.who.int/news-room/fact-sheets/detail/obesity-and-overweight (accessed on 9 June 2021).
  14. Delpapa, E.H.; Mueller-Heubach, E. Pregnancy outcome following ultrasound diagnosis of macrosomia. Obstet. Gynecol. 1991, 78, 340–343. [Google Scholar] [PubMed]
  15. McGrath, R.T.; Glastras, S.J.; Hocking, S.L.; Fulcher, G.R. Large-for-Gestational-Age Neonates in Type 1 Diabetes and Pregnancy: Contribution of Factors Beyond Hyperglycemia. Diabetes Care 2018, 41, 1821–1828. [Google Scholar] [CrossRef] [Green Version]
  16. China Statistical Yearbook 2016. Available online: http://www.stats.gov.cn/tjsj/ndsj/2016/indexeh.htm(accessed on 2016).
  17. China Business Network. Ranking of Cities’ Business Attractiveness in China 2020. Available online: https://www.yicai.com/brief/100648804.html (accessed on 29 May 2020).
  18. Rockhill, B.; Newman, B.; Weinberg, C. Use and misuse of population attributable fractions. Am. J. Public Health 1998, 88, 15–19. [Google Scholar] [CrossRef] [Green Version]
  19. Cheney, K.; Farber, R.; Barratt, A.L.; McGeechan, K.; de Vries, B.; Ogle, R.; Black, K. Population attributable fractions of perinatal outcomes for nulliparous women associated with overweight and obesity, 1990–2014. Med. J. Aust. 2018, 208, 119–125. [Google Scholar] [CrossRef]
  20. MacInnis, N.; Woolcott, C.G.; McDonald, S.; Kuhle, S. Population Attributable Risk Fractions of Maternal Overweight and Obesity for Adverse Perinatal Outcomes. Sci. Rep. 2016, 6, 22895. [Google Scholar] [CrossRef] [Green Version]
  21. Djelantik, A.A.A.M.J.; Kunst, A.E.; van der Wal, M.F.; Smit, H.A.; Vrijkotte, T.G.M. Contribution of overweight and obesity to the occurrence of adverse pregnancy outcomes in a multi-ethnic cohort: Population attributive fractions for Amsterdam. BJOG-Int. J. Obstet. Gynecol. 2012, 119, 283–290. [Google Scholar] [CrossRef]
  22. Sugimura, R.; Kohmura-Kobayashi, Y.; Narumi, M.; Furuta-Isomura, N.; Oda, T.; Tamura, N.; Uchida, T.; Suzuki, K.; Sugimura, M.; Kanayama, N.; et al. Comparison of three classification systems of Prepregnancy Body Mass Index with Perinatal Outcomes in Japanese Obese Pregnant Women: A retrospective study at a single center. Int. J. Med. Sci. 2020, 17, 2002–2012. [Google Scholar] [CrossRef]
  23. Choi, H.; Lim, J.Y.; Lim, N.K.; Ryu, H.M.; Kwak, D.W.; Chung, J.H.; Park, H.J.; Park, H.-Y. Impact of pre-pregnancy body mass index and gestational weight gain on the risk of maternal and infant pregnancy complications in Korean women. Int. J. Obes. 2022, 46, 59–67. [Google Scholar] [CrossRef]
  24. Choi, S.K.; Park, I.Y.; Shin, J.C. The effects of pre-pregnancy body mass index and gestational weight gain on perinatal outcomes in Korean women: A retrospective cohort study. Reprod. Biol. Endocrinol. 2011, 9, 6. [Google Scholar] [CrossRef] [PubMed]
  25. Lu, J.; Bi, Y.; Ning, G. Curbing the obesity epidemic in China. Lancet Diabetes Endocrinol. 2016, 4, 470–471. [Google Scholar] [CrossRef]
  26. Araujo Júnior, E.; Peixoto, A.B.; Zamarian, A.C.P.; Elito Júnior, J.; Tonni, G. Macrosomia. Best Pract. Res. Clin. Obstet. Gynaecol. 2017, 38, 83–96. [Google Scholar] [CrossRef] [PubMed]
  27. Lin, S.; Chai, J.; Li, J.; Shang, X.; Pei, L.; Jiang, L.; Zhang, J.; Sun, P.; Dong, W.; Wang, Y.; et al. Incidence of Macrosomia in Rural Areas—Henan Province, China, 2013–2017. China CDC Wkly 2021, 3, 788–792. [Google Scholar] [CrossRef] [PubMed]
  28. McDonald, S.D.; Woolcott, C.; Chapinal, N.; Guo, Y.F.; Murphy, P.; Dzakpasu, S. Interprovincial variation in pre-pregnancy body mass index and gestational weight gain and their impact on neonatal birth weight with respect to small and large for gestational age. Can. J. Public Health 2018, 109, 527–538. [Google Scholar] [CrossRef]
  29. Gao, Y.; Zhou, H.; Singh, N.S.; Powell-Jackson, T.; Nash, S.; Yang, M.; Guo, S.; Fang, H.; Alvarez, M.M.; Liu, X.; et al. Progress and challenges in maternal health in western China: A Countdown to 2015 national case study. Lancet Glob. Health 2017, 5, e523–e536. [Google Scholar] [CrossRef] [Green Version]
  30. Guo, Y.; Bai, J.; Na, H. The history of China’s maternal and child health care development. Semin. Fetal Neonatal Med. 2015, 20, 309–314. [Google Scholar] [CrossRef]
  31. Zhang, H.; Liu, X.; Penn-Kekana, L.; Ronsmans, C. A systematic review of the profile and density of the maternal and child health workforce in China. Hum. Resour. Health 2021, 19, 125. [Google Scholar] [CrossRef]
  32. van der Windt, M.; van Zundert, S.K.M.; Schoenmakers, S.; Jansen, P.W.; van Rossem, L.; Steegers-Theunissen, R.P.M. Effective psychological therapies to improve lifestyle behaviors in (pre)pregnant women: A systematic review. Prev. Med. Rep. 2021, 24, 101631. [Google Scholar] [CrossRef]
  33. Dean, S.V.; Lassi, Z.S.; Imam, A.M.; Bhutta, Z.A. Preconception care: Nutritional risks and interventions. Reprod. Health 2014, 11 (Suppl. 3), S3. [Google Scholar] [CrossRef] [Green Version]
  34. Goldstein, R.F.; Abell, S.K.; Ranasinha, S.; Misso, M.; Boyle, J.A.; Black, M.H.; Li, N.; Hu, G.; Corrado, F.; Rode, L.; et al. Association of Gestational Weight Gain with Maternal and Infant Outcomes: A Systematic Review and Meta-analysis. JAMA 2017, 317, 2207–2225. [Google Scholar] [CrossRef] [PubMed]
  35. Maheshwari, A.; Pandey, S.; Amalraj Raja, E.; Shetty, A.; Hamilton, M.; Bhattacharya, S. Is frozen embryo transfer better for mothers and babies? Can cumulative meta-analysis provide a definitive answer? Hum. Reprod. Update 2018, 24, 35–58. [Google Scholar] [CrossRef] [PubMed] [Green Version]
  36. Ye, W.; Luo, C.; Huang, J.; Li, C.; Liu, Z.; Liu, F. Gestational diabetes mellitus and adverse pregnancy outcomes: Systematic review and meta-analysis. BMJ 2022, 377, e067946. [Google Scholar] [CrossRef]
  37. He, H.; Blum, R.W. Prevalence of unintended pregnancy and its associated factors among sexually active never-married youth in Shanghai. J. Paediatr. Child. Health 2013, 49, 912–918. [Google Scholar] [CrossRef] [PubMed]
Figure 1. Flow chart for included participants.
Healthcare 11 00331 g001
Figure 2. Within-Population Heterogenicity of Burden and Trends of Macrosomic and LGA Neonates Attributable to High Pre-pregnancy Body Mass Index. Legend: (A) = maternal age; (B) = paternal age; (C) = higher education; (D) = nationality; (E) = household registration; (F) = parity; (G) = GDP per capita; (H) = city tier; and (I) = region. The straight and dashed lines are the linear approximation of macrosomia and LGA, respectively. Hollow symbols represent annual percent change of nonstatistical significance (p > 0.05).
Healthcare 11 00331 g002
Table 1. Baseline characteristics of the included participants across LMP years.
Characteristics2013
(n = 1,724,140)
2014
(n = 1,669,015)
2015
(n = 1,611,623)
2016
(n = 1,753,983)
2017
(n = 1,239,859)
p
Maternal Age, years <0.001
20–24657,608 (38.14)556,039 (33.32)482,719 (29.95)382,674 (21.82)268,003 (21.62)
25–29770,482 (44.69)806,810 (48.34)822,139 (51.01)797,620 (45.47)568,804 (45.88)
30–34233,108 (13.52)234,462 (14.05)231,734 (14.38)361,927 (20.63)273,983 (22.10)
≥3562,942 (3.65)71,704 (4.30)75,031 (4.66)211,762 (12.07)129,069 (10.41)
Paternal Age, years <0.001
20–24382,952 (22.40)310,199 (18.72)260,441 (16.28)191,515 (11.01)139,167 (11.32)
25–29836,016 (48.89)849,644 (51.28)847,755 (52.98)776,783 (44.65)551,839 (44.90)
30–34353,500 (20.67)350,423 (21.15)346,579 (21.66)448,080 (25.76)338,981 (27.58)
≥35137,437 (8.04)146,568 (8.85)145,423 (9.09)323,215 (18.58)199,136 (16.20)
Missing382,952 (22.40)310,199 (18.72)260,441 (16.28)191,515 (11.01)139,167 (11.32)
Higher Education <0.001
No1,095,682 (63.55)1,017,974 (60.99)897,629 (55.70)955,085 (54.45)652,205 (52.60)
Yes582,745 (33.80)601,619 (36.05)651,372 (40.42)721,426 (41.13)522,423 (42.14)
Missing45,713 (2.65)49,422 (2.96)62,622 (3.89)77,472 (4.42)65,231 (5.26)
Nationality <0.001
Han1,578,694 (91.56)1,525,842 (91.42)1,473,028 (91.40)1,607,399 (91.64)1,128,913 (91.05)
Minority122,942 (7.13)121,164 (7.26)115,491 (7.17)123,645 (7.05)91,925 (7.41)
Missing22,504 (1.31)22,009 (1.32)23,104 (1.43)22,939 (1.31)19,021 (1.53)
Household Registration <0.001
Rural1,618,453 (93.87)1,544,734 (92.55)1,451,580 (90.07)1,537,184 (87.64)1,078,553 (86.99)
Urban105,675 (6.13)124,274 (7.45)160,013 (9.93)216,293 (12.33)160,366 (12.93)
Missing12 (0.00)7 (0.00)30 (0.00)506 (0.03)940 (0.08)
Smoking <0.001
No1,713,054 (99.36)1,659,213 (99.41)1,602,495 (99.43)1,743,897 (99.42)1,233,200 (99.46)
Yes4342 (0.25)3221 (0.19)3087 (0.19)3408 (0.19)2738 (0.22)
Missing6744 (0.39)6581 (0.39)6041 (0.37)6678 (0.38)3921 (0.32)
Secondhand smoking, min/day <0.001
No1,624,386 (94.21)1,597,278 (95.70)1,551,638 (96.28)1,689,288 (96.31)1,194,750 (96.36)
1–1460,250 (3.49)42,586 (2.55)34,271 (2.13)37,916 (2.16)26,129 (2.11)
≥ 1532,971 (1.91)22,311 (1.34)19,573 (1.21)20,042 (1.14)15,118 (1.22)
Missing6533 (0.38)6840 (0.41)6141 (0.38)6737 (0.38)3862 (0.31)
Alcohol Consumption <0.001
No1,666,488 (96.66)1,615,724 (96.81)1,560,839 (96.85)1,698,200 (96.82)1,201,907 (96.94)
Yes14,748 (0.86)10,486 (0.63)10,208 (0.63)11,117 (0.63)8575 (0.69)
Missing42,904 (2.49)42,805 (2.56)40,576 (2.52)44,666 (2.55)29,377 (2.37)
Parity <0.001
Nulliparous1,215,682 (70.51)1,108,008 (66.39)1,045,340 (64.86)826,378 (47.11)610,468 (49.24)
Parous502,904 (29.17)555,377 (33.28)561,148 (34.82)922,259 (52.58)626,471 (50.53)
Missing5554 (0.32)5630 (0.34)5135 (0.32)5346 (0.30)2920 (0.24)
Infant sex
Male865,840 (50.22)832,099 (49.86)801,885 (49.76)870,408 (49.62)636,012 (51.30)
Female784,004 (45.47)765,036 (45.84)742,513 (46.07)810,032 (46.18)585,914 (47.26)
Missing74,296 (4.31)71,800 (4.31)67,222 (4.17)73,543 (4.19)17,933 (1.45)
GDP per Capita, CNY <0.001
< 40,000344,350 (19.97)333,020 (19.95)327,431 (20.32)386,462 (22.03)318,536 (25.69)
40,000-319,547 (18.53)283,217 (16.97)232,499 (14.43)290,782 (16.58)231,688 (18.69)
50,000-720,995 (41.82)708,109 (42.43)708,664 (43.97)695,313 (39.64)381,478 (30.77)
70,000-339,248 (19.68)344,669 (20.65)343,029 (21.28)381,426 (21.75)308,157 (24.85)
Tier of City <0.001
Tier I35,130 (2.04)30,359 (1.82)36,677 (2.28)56,102 (3.20)49,858 (4.02)
New Tier I98,620 (5.72)89,916 (5.39)100,667 (6.25)116,104 (6.62)96,719 (7.80)
Tier II140,210 (8.13)135,160 (8.10)134,108 (8.32)147,960 (8.44)112,844 (9.10)
Tier III682,936 (39.61)670,257 (40.16)648,702 (40.25)689,582 (39.32)490,974 (39.60)
Tier IV516,935 (29.98)512,303 (30.69)473,324 (29.37)504,166 (28.74)292,385 (23.58)
Tier V250,309 (14.52)231,020 (13.84)218,145 (13.54)240,069 (13.69)197,079 (15.90)
Region <0.001
Northeast20,090 (1.17)16,195 (0.97)15,965 (0.99)17,251 (0.98)16,320 (1.32)
North126,775 (7.35)99,636 (5.97)99,900 (6.20)107,196 (6.11)80,621 (6.50)
Northwest100,965 (5.86)97,468 (5.84)97,497 (6.05)108,909 (6.21)111,583 (9.00)
East425,148 (24.66)405,644 (24.30)373,960 (23.20)451,801 (25.76)339,895 (27.41)
Central646,124 (37.48)652,856 (39.12)647,695 (40.19)618,365 (35.25)346,283 (27.93)
South265,665 (15.41)256,281 (15.36)241,381 (14.98)280,430 (15.99)230,803 (18.62)
Southwest139,373 (8.08)140,935 (8.44)135,225 (8.39)170,031 (9.69)114,354 (9.22)
Note: Data are presented as n (%).
Table 2. Proportions of exposure and outcomes and their relative risks across LMP years.
YearHigh BMI (%)Macrosomia (%)LGA (%)RR (95% CI)
MacrosomiaLGA
Total849,174 (10.62)336,701 (4.21)691,656 (8.65)1.40 (1.39–1.41)1.29 (1.29–1.30)
2013151,362 (8.78)82,613 (4.79)160,490 (9.31)1.34 (1.31–1.37)1.25 (1.23–1.27)
2014153,023 (9.17)74,088 (4.44)146,860 (8.80)1.37 (1.34–1.40)1.27 (1.25–1.29)
2015162,678 (10.09)67,672 (4.20)135,508 (8.41)1.41 (1.38–1.44)1.30 (1.28–1.32)
2016222,054 (12.66)71,112 (4.05)148,576 (8.47)1.46 (1.43–1.49)1.32 (1.31–1.34)
2017160,057 (12.91)41,216 (3.32)100,222 (8.08)1.54 (1.50–1.58)1.37 (1.35–1.39)
p trend<0.05<0.01<0.05<0.01<0.01
APC, %11.56 (5.36–18.13)−7.89 [−12.40–(−3.15)]−3.15 [−5.01–(−1.26)]3.51 (2.39–4.64)2.29 (1.74–2.84)
APC = annual percentage change; CI = confidence interval; LGA = large-for-gestational-age; RR = relative risk. Proportions of exposure and outcomes are presented as n (%). Multivariate-adjusted RRs are presented, adjusted for maternal age, paternal age, higher education, nationality, household registration, smoking, secondhand smoking, alcohol consumption, parity, infant sex, and region.
Table 3. Burden and Trends of Macrosomia and LGA Neonates Attributed to High Body Mass Index in China From 2013 to 2017.
YearMacrosomiaLGA
Crude PAF, %Adjusted PAF, %Crude PAF, %Adjusted PAF, %
Total4.76 (4.63–4.89)4.44 (4.33–4.54)3.87 (3.79–3.96)3.33 (3.26–3.40)
20133.54 (3.31–3.77)3.16 (2.97–3.35)2.82 (2.66–2.98)2.35 (2.21–2.48)
20144.10 (3.85–4.36)3.64 (3.43–3.84)3.31 (3.14–3.49)2.70 (2.55–2.84)
20154.55 (4.27–4.83)4.32 (4.09–4.53)3.65 (3.46–3.84)3.20 (3.04–3.36)
20166.41 (6.10–6.73)5.99 (5.74–6.23)5.00 (4.79–5.20)4.33 (4.15–4.50)
20177.40 (6.98–7.83)7.11 (6.79–7.42)5.59 (5.34–5.85)5.00 (4.79–5.21)
p trend< 0.01< 0.01< 0.01< 0.01
APC, %21.19 (13.26–29.68)23.60 (16.76–30.85)19.49 (12.72–26.65)21.98 (16.14–28.11)
Crude PAFs were estimated by crude model; adjusted PAFs were estimated by multivariate-adjusted model, adjusted for maternal age, paternal age, higher education, nationality, household registration, smoking, secondhand smoking, alcohol consumption, parity, infant sex, and region. LGA = large-for-gestational-age; PAF = population attributable fraction; APC = annual percentage change.
Disclaimer/Publisher’s Note: The statements, opinions and data contained in all publications are solely those of the individual author(s) and contributor(s) and not of MDPI and/or the editor(s). MDPI and/or the editor(s) disclaim responsibility for any injury to people or property resulting from any ideas, methods, instructions or products referred to in the content.

