
Application of Mathematical Models to Assess the Impact of the COVID-19 Pandemic on Logistics Businesses and Recovery Solutions for Sustainable Development

Faculty of Economics, Thu Dau Mot University, Number 6, Tran Van On Street, Phu Hoa Ward, Thu Dau Mot 590000, Vietnam
Mathematics 2021, 9(16), 1977; https://doi.org/10.3390/math9161977
Submission received: 20 July 2021
/
Revised: 12 August 2021
/
Accepted: 14 August 2021
/
Published: 18 August 2021
(This article belongs to the Special Issue Control, Optimization, and Mathematical Modeling of Complex Systems)
Abstract
:The logistics industry can be considered as the economic lifeline of each country because of its role in connecting production and business activities of enterprises and promoting socio-economic development between regions and countries. However, the COVID-19 pandemic, which began at the end of 2019, has seriously affected the global supply chain, causing heavy impacts on the logistics service sector. In this study, the authors used the Malmquist productivity index to assess the impact of the pandemic on logistics businesses in Vietnam. Moreover, the authors used a super-slack-based model to find strategic alliance partners for enterprises. The authors also used the Grey forecasting model to forecast the business situation for enterprises during the period 2021–2024, in order to provide the leaders of these enterprises with a complete picture of their partners as a solid basis for making decisions to implement alliances that will help logistics enterprises in Vietnam to develop sustainably. The results have found that the alliance between LO7 and LO10 is the most optimal, as this alliance can exploit freight in the opposite direction and reduce logistics costs, creating better competitiveness for businesses.
1. Introduction
According to the General Statistics Office of Vietnam’s logistics industry, in the first 10 months of 2020, 4513 transport and warehousing enterprises were newly established (down 5.5% compared to 2019). A total of 2366 transport and warehousing enterprises dissolved. Cargo transport reached 1.43 billion tons of goods, (down 7.5% compared to 2019) [1]. The COVID-19 pandemic had many negative effects on businesses, industries, countries, and the whole world. Specifically, when the COVID-19 pandemic occurred, infected workers had to take leaves of absence for treatment, which affected the production and business situation of factories that were halted. In addition, the most impactful factor is the social distancing orders of localities. This complicated the situation of transporting goods and materials in factories, causing supply chain disruptions and breach of contracts with partners, seriously affecting the logistics industry of countries.
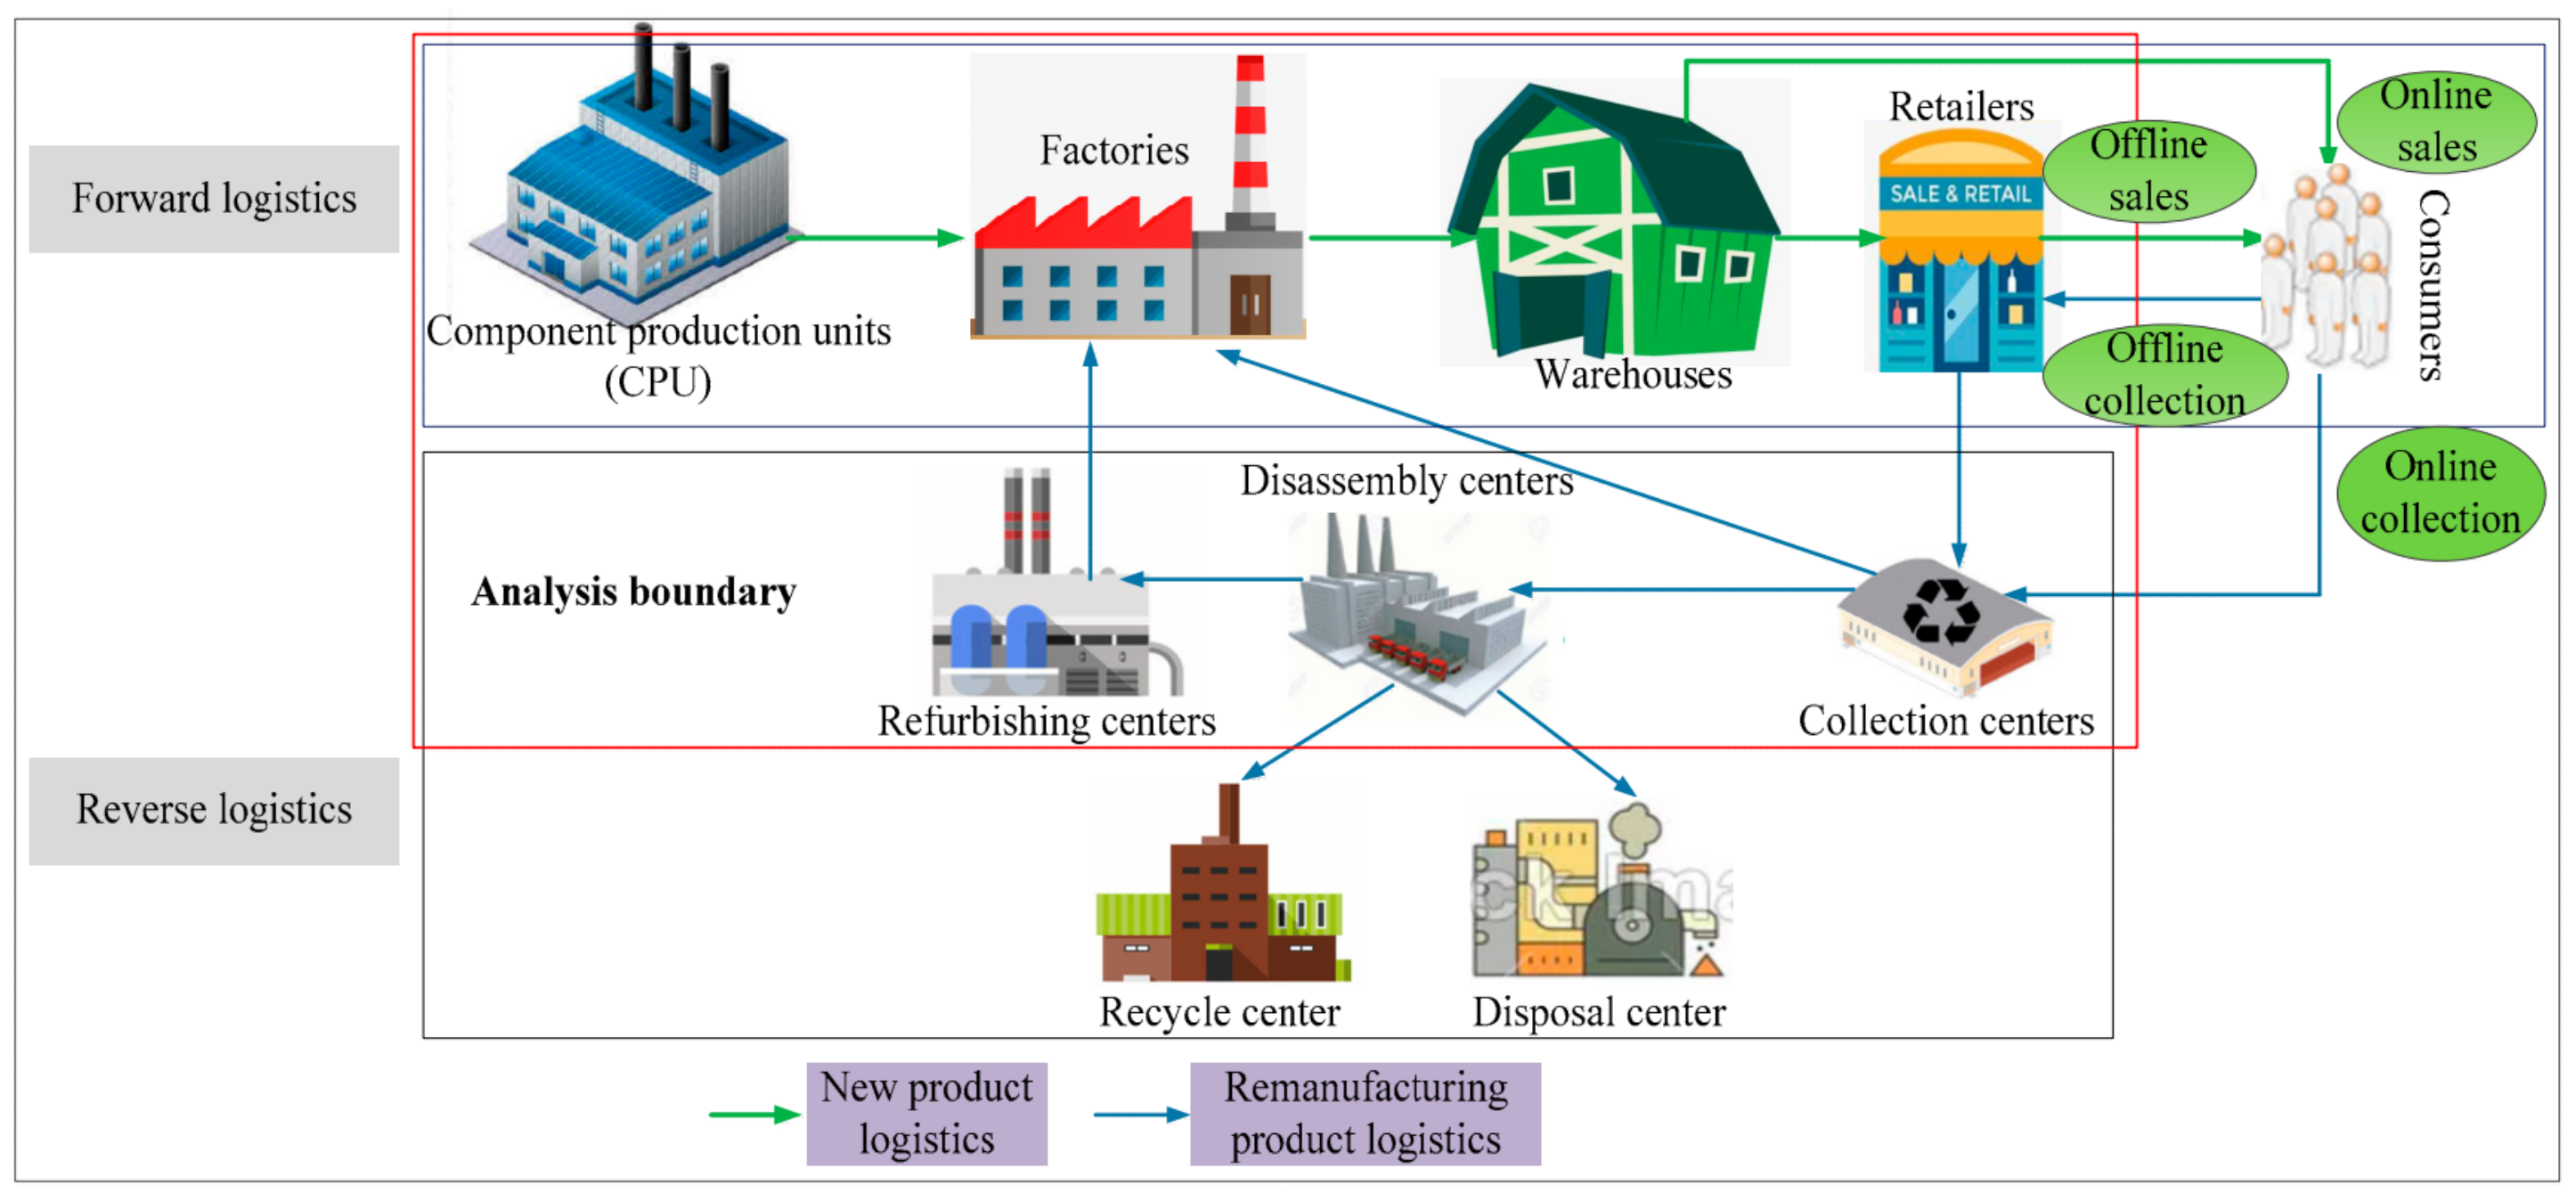
The logistics chain involves sea transport, rail transport, water transport, and road transport; and activities in transportation, loading, unloading, forwarding, and storage (shown in Figure 1) [2]. If managers can come up with solutions to reduce these costs by maximizing both directions of routes and improving the occupancy rate at warehouses, it will help businesses improve results. Considering those problems, the questions are: How does the COVID-19 pandemic affect the business situation of logistics enterprises in Vietnam? The pandemic affects which areas in logistics activities? Are there any solutions to help logistic businesses grow after the pandemic? Are there any cost-saving solutions for logistics businesses? In this context, the authors realize that it is necessary to specifically assess the impact of the pandemic on the business performance of logistics enterprises, and it is necessary to find solutions to limit the risks of the epidemic to all stakeholders. It is necessary to research and propose solutions to help logistics enterprises in Vietnam restore and stabilize their business situations, help businesses ensure reasonable growth, stabilize jobs for employees, and create a foundation for rapid and sustainable economic growth.
2. Materials and Methods
2.1. Overview of Vietnam’s Logistics
Vietnam’s logistics industry has been heavily affected by the pandemic in all forms of transport: road, sea, rail, and especially air.
Road traffic: According to the Directorate for Roads of Vietnam, currently more than 1800 km of expressways are in operation; 16,000 km of roads and nearly 600,000 km of national highways. The system of rural roads has been built, upgraded, and expanded [3]. This helps meet the needs of the freight transport of domestic and foreign enterprises, promoting production and business development and, thereby, improving competitiveness of the economy (proportion of road types shown in Figure 2) [4].
In Vietnam, domestic road freight transport still accounts for the highest proportion of all modes of transport (76.8% in 2019) (weight of goods transported by road shown in Figure 3). Meanwhile, the cost of transporting goods by road is still high, because about 70–75% of vehicles carry only one-way goods; the high costs of road use and fuel increase logistics costs dramatically [4].
Railway transport: The railway system in Vietnam includes 7 main lines and 12 branch lines with a total length of 3143 km, stretching across 34 provinces and cities. The railway system includes 277 stations, including 3 types of gauges: 1000 mm gauge (85%), 1435 mm gauge (6%), and cage gauges of 1000 mm and 1435 mm (accounting for 9%). The railway density is about 7.9 km/1000 km2. Vietnam’s railway system was built a long time ago. The infrastructure is outdated with no modern technology; the trains are loud and of low service quality. Therefore, the proportion of passenger and freight transport by rail is lower than that of other forms of transport (weight of goods transported by railway shown in Figure 4) [4]. The railway industry has not kept up with the development of other modes of transport. The railway industry focuses on exploiting short segments, from 800 km to 1200 km, and places where it has more advantages than sea routes [4].
Sea transport: With the advantage of geographical location, Vietnam is located on an important sea route for continents and regions in the world. This favorable condition for domestic and international transportation of goods has led to development of the shipping industry to promote economic development. In 2019, the transport volume reached 49.2 million tons of goods (weight of goods transported by seaway shown in Figure 5); 43,150 ferry boats used seaports and inland waterways and average growth rate of goods reached 204% (from July 2014 to 2019) [4].
Inland waterway transport: In 2019, inland waterway freight transport in Vietnam reached 303.4 million tons with an increase of 5.6%. In the first 9 months of 2020, inland waterway cargo transport reached 238.1 million tons with a decrease of 7.6% over the same period in 2019 (weight of goods transported by inland waterways shown in Figure 6). As of 2020, there are a total of 1786 VR-SB-class vehicles in operation, of which 839 are cargo vehicles with a tonnage of 1,742,834 tons, accounting for 0.5% of inland waterway vehicles [4].
Air traffic: As of 2020, there are a total of 22 airports in Vietnam with civil aviation operations, including 11 international airports and 11 domestic airports. According to the Civil Aviation Authority of Vietnam, as of the first quarter of 2020, Vietnam has 235 registered civil aircraft and 32 helicopters [4].
Although air transport only accounts for a small part of the total volume of goods transported in Vietnam (0.23%), it accounts for 25% of the total export value of the country (weight of goods transported by airline shown in Figure 7) [4]. This is a feature that should be taken into account when planning development. It is necessary to orient investment in aviation infrastructure to increase the service capacity of airports and shorten the time for cargo services.
2.2. Literature Review
Data envelopment analysis (DEA) is a linear programming method for measuring the performance of multiple industry players (DMUs) when a production process presents a structure of multiple inputs and multiple outputs. DEA has been widely applied by many scientists in many different scientific disciplines [5,6,7,8]. Chowdhury et al., (2011) used the Malmquist productivity index to evaluate the performance of hospitals in Ontario between 2003–2006 [9]. In that study, the authors did an in-depth analysis of the efficiency of technical and technological investment in hospitals in Ontario. The researchers pointed out the limitations of technical and technology investment in these hospitals, and proposed solutions to improve the efficiency of technology investment. Abbas et al., (2015) used the Malmquist productivity index to evaluate and compare the performance of Islamic banks and conventional commercial banks [10]. The results show that Islamic banks have higher operational efficiency than conventional commercial banks. The reason is that, in Muslim countries, Islamic banks are sponsored.
Bahrini et al., (2015) used the Malmquist productivity index to evaluate the performance of 33 Islamic banks in 10 countries around the world for the period 2006–2011 [11]. The results show that Islamic banks were hit hard by the 2008 global financial crisis. In that study, the researchers also proposed solutions to help Islamic commercial banks’ recovery and growth. Lee et al., (2017) used DEA models to evaluate the performance of 18 banks in Korea in three categories: National Bank, Regional Bank, and Special Bank [12]. The authors found that special banks have the highest business efficiency compared to other types of banks. Wang et al., (2017) used DEA models to evaluate the performance of infrastructure investment and development companies in Vietnam [13]. The authors evaluated and selected good investors and suggested that the Vietnamese government establish appropriate policies when selecting contractors for infrastructure investment projects to achieve good results on time and on budget.
Grey system theory was introduced by Professor Julong Deng in 1982 [14]. Grey prediction theory is a multidisciplinary forecasting science that has been applied in almost all sciences. Since its introduction, it has been applied by scientific works around the world [15,16,17,18,19]. Fan et al., (2018) used a Grey forecasting model to forecast natural gas demand in China [20]. The results of that research helped the Chinese government to develop and issue energy policies to ensure a stable supply of natural gas for production and daily life. Nguyen (2020) used the super-slack-based model to select partners for construction companies in Vietnam [21]. After selecting an alliance partner, the author used two forecasting methods, the Grey forecasting model and ARIMA model, to forecast the business situation of construction companies. Wang et al., (2021) used the Grey forecasting model to predict the number of railway passengers by quarter (period 2020–2022) in China. This result helps railway management companies create plans to meet the travel needs of customers.
In this study, the Malmquist productivity index (MPI) is used to evaluate the business performance of logistics enterprises in Vietnam from 2017 to 2020. The authors continue to use the super-slack-based model to select optimal partners to enter strategic alliances with businesses to help businesses recover and develop sustainably after the pandemic. In addition, in this study, the authors used the Grey forecasting model simultaneously to forecast and provide a post-pandemic picture of businesses participating in the alliance, giving managers a solid basis when making decisions about implementing alliances.
2.3. Theoretical Fundamentals
2.3.1. Research Development
The authors found that the COVID-19 pandemic negatively impacted most businesses, sectors, and industries in Vietnam’s economy [1]. In particular, the logistics industry was most affected because localities and countries implemented social distancing orders to limit the movement of people and goods. Therefore, the author realizes that it is necessary to assess the impacts of the epidemic on logistics enterprises and propose solutions to help businesses recover and develop. The research process is carried out by the authors according to the steps shown in Figure 8 below:
After determining the research objectives, the authors selected enterprises to conduct the research. These enterprises must use the same operations in the logistics industry, have similarity of scale, and have appropriate geographical locations to ensure feasible transportation.
After selecting businesses that fulfill the conditions to carry out the research objectives, the authors selected factors to analyze the business situations of logistics enterprises before and during the pandemic. Then, the authors checked the correlation of these factors to ensure the appropriateness of the data included in analysis and processing.
After examining the correlation between the factors used in the study, the authors used the Malmquist productivity index to assess the impact of the pandemic on the business situation of Vietnamese logistics enterprises for the period 2017–2020. Then, the authors used a super-slack-based model to rank these enterprises, as a basis for choosing the optimal alliance partner to improve business efficiency for logistics enterprises in the future.
After evaluating and ranking the logistics enterprises, the authors used the rankings to make alliances for enterprises. Then, the authors used the Grey forecasting model (GFM) to forecast the business situation of enterprises in the alliance. This forecast aims to provide managers with a complete picture of their alliances as a solid basis for decision making to enable sustainable development.
2.3.2. Research Methods
Malmquist Productivity Index
DEA is a linear programming method for measuring the effectiveness of multiple decision-making units (DMUs) when a production process presents a structure of multiple inputs and outputs. This method relies on the past business data of the enterprise to construct the production boundary in the non-parametric plane (the production boundary). In which, the Malmquist index (MI) evaluates the efficiency of a business at and . This efficiency is assessed through the catch-up (CU) and frontier-shift (FS) indicators of that business [22].
A specific example of evaluating the effectiveness of an element in the above model is shown in Figure 9:
Super-Slack-Based Model
In 2001, Tone introduced the slack-based measure model to evaluate the production and business efficiency of enterprises based on changes in production factors causing changes in corporate profits. The introduction is described as follows [24,25]:
shows the relative business performance of the enterprise. If this reflects that the enterprise is not operating efficiently. If it reflects that the enterprise is relatively efficient. However, there are many businesses in the same business field that achieve relative efficiency. Therefore, to evaluate and rank these enterprises, Tone introduced the super-slack-based model to evaluate the ranking of enterprises in the same industry. The super-slack-based model is described as follows:
Grey Forecasting Model
GFM was first introduced by Professor Julong Deng in 1982. GFM focuses on the study of uncertain information systems and incomplete data sources in decision making. Grey system theory can perform research with a small sample size data set. Therefore, Grey system theory overcomes the inherent disadvantages of other forecasting methods. The authors used Grey system theory to conduct this study. After being introduced and published in the journal System & Control Letters, GFM has been successfully applied by many scientists around the world in most fields of economy and society. The process of calculating the GM (1, 1) model of GFM is shown in 6 steps in Figure 10 below:
Correlation Coefficient and Error
As mentioned, the authors used 4 inputs and 2 outputs to assess the impact of the pandemic on the business situation of logistics companies in Vietnam in the period 2017–2020. To test the correlation between factors, the authors used Pearson correlation coefficient (r). Testing the correlation coefficient through (r) is the best method to measure the relationship between factors used in the study because it is based on the covariance method. (r) is calculated by following formula [27]:
The authors used the GM (1, 1) model to forecast the business situation of logistic enterprises in the period of 2021–2024. To evaluate the quality and fit of the GM (1, 1) model used in this study, the authors used MAPE to calculate error. MAPE is calculated according to the following formula [28]:
2.4. Data
The authors selected typical logistic enterprises that are suitable for this research objective. Specifically, the enterprises must fulfill the following conditions: they are of appropriate size; they have geographical concordance to exploit potential customers of partners and save the cost of reverse traffic; and they must be in the same industry and field of operation to optimize available infrastructure, technical support, and transportation without having to invest in any additional equipment. Based on those conditions, the authors selected enterprises summarized in Table 1 below [29].
To assess the impact of the COVID-19 pandemic on the business situation of logistics enterprises in Vietnam, the authors used four input factors and two output factors:
- Equity is the total net assets of the business; these assets are owned by shareholders.
- Total asset is the entire set of assets and valuable papers of an enterprise used for production and business activities.
- Cost of goods sold includes cost of purchasing machinery, raw materials, cost of goods production, labor cost, administrative expenses, etc.
- General and administrative expenses are expenses used to operate an enterprise’s activities.
- Net revenue is the amount earned by the business after all deductions have been deducted.
- Profit after tax is the amount obtained after taking total sales revenue minus all costs of logistics services.
The indicators on Total Assets and Equity are the main items in the balance sheet. These indicators show an overview of the assets situation of the enterprise. Based on these indicators, it is possible to assess the business situation and the ability to use the capital of the enterprise. Factors on the cost of goods sold; management costs; net revenue and profit after tax are the main indicators in the income statement of an enterprise. These indicators reflect the business results and development trends of the enterprise as a basis for making strategic financial decisions. These financial indicators reflect the business situation of a logistics enterprise. The data source is actual data on the business situation of enterprises in the period 2017–2020. The data were collected through the website of the General Statistics Office and are summarized in Table 2, Table 3, Table 4 and Table 5 below [29].
3. Research Results
3.1. Check Correlation Coefficient
The correlation coefficient is a statistical quantity that measures the degree of correlation between two factors. If the correlation coefficient has a value in the range [−1, 0), that indicates the negative correlation between those two factors (that is, if this value increases, the other value decreases, and vice versa). If the correlation coefficient has a value in the range (0, 1], that indicates the positive correlation between the two factors (that is, the value of one factor increases, the value of the other factor also increases and vice versa)) The correlation coefficient has a value of 0, indicating that the two factors are independent of each other.
Based on the results obtained in Table 6, the values of correlation coefficients between factors are all positive (+). This result reflects that the factors used in the study have a positive relationship with each other (that is, when the input factors increase, the output factors also increase accordingly). In particular, the values of the correlation coefficients in this study are mostly greater than 0.5, showing that the factors have a strong correlation with each other [25]. This result confirms that the factors used in the study satisfy the correlation conditions to serve as a basis for research and analysis.
3.2. Malmquist Productivity Index Results
The authors use the Malmquist productivity index to assess the impact of the COVID-19 pandemic on the business situation of logistics enterprises in Vietnam in the period 2017–2020. The results are as shown in Table 7 and Figure 11 below.
Since the end of 2019, the COVID-19 pandemic has forced countries around the world to apply measures to prevent the spread of the disease. These include restricting logistics activities, including the export and import activities at borders. This has had a heavy impact on logistics activities, disrupting supply chains and international trade flows. Many businesses had to suspend operations, causing a backlog of goods in warehouses, factories, and distribution centers, and reduced volume of goods in circulation. At the same time, the storage costs of goods increased, especially goods in cold storage and fresh food. This made the cost of transportation and logistics services more expensive.
Research results show that logistics businesses operating in the field of transportation have been heavily affected by the COVID-19 pandemic, so the business situation fluctuates sharply. Specifically, Malmquist LO1 decreased from 1.1643 in the period 2017–2018 to 0.7235 in the period 2019–2020; Malmquist LO5 decreased from 1.0256 for 2017–2018 to 0.9853 for 2019–2020; Malmquist LO9 decreased from 1.0732 for the period 2017–2018 to 0.9857 for the period 2019–2020; Malmquist LO10 decreased from 1.1240 for 2017–2018 to 0.9866 for 2019–2020. However, there are a number of logistics enterprises still operating effectively, including MalmquistLO4(2019–2020) = 1.2058; MalmquistLO6(2019–2020) = 1.1078; MalmquistLO7(2019–2020) = 1.4105; MalmquistLO8(2019–2020) = 1.1514. Basic logistics service businesses include the management of freight services, warehousing services, and logistics network design. Therefore, depending on the line of each business, the level of impact of the COVID-19 pandemic is different. According to the business profile, the above businesses all have the following main areas: bonded warehouse services, container freight station warehouses, cold storage, warehousing, loading and unloading, storage of import and export goods and services, freight forwarding, customs clearance, shipping agents and cargo brokers. Some logistics enterprises have large warehouse systems, and a cold storage system to store fresh food and special goods.
3.3. Super-Slacks-Based Model Results
3.3.1. Results before Alliance
In this study, the authors used the Super-SBM model to evaluate efficiency and rank the logistics enterprises in Vietnam in the period of 2019–2020. The results show that, even during the pandemic, there are still businesses that operate very effectively: RankLO4 = 1 (ScoreLO4 = 3.2525), RankLO9 = 2 (ScoreLO9 = 1.5320), RankLO8 = 3 (ScoreLO8 = 1.3031). However, there are businesses that have been heavily affected by the COVID-19 pandemic, so their operations are not effective: RankLO2 = 9 (ScoreLO2 = 0.5554); RankLO3 = 10 (ScoreLO3 = 0.4432).
The authors used the results in Table 8 and Figure 12 as a basis for selecting enterprises to make alliances with other enterprises. If we choose businesses that have not achieved business efficiency in this period (LO2, LO3), it is difficult to convince other businesses to implement the alliance. Therefore, the authors have chosen LO10 (Vietnam container shipping joint stock corporation) as a target enterprise to engage in negotiations with other enterprises to implement alliances in order to realize strategic goals and support each other for mutual development. The authors chose LO10 as the target enterprise. In 2020, LO10 still had good business results: Rank LO10 = 5 (Score LO10 = 1.2242). LO10 in Hai Phong city was established in 1985, specializing in logistics and container agency services, shipping agents, warehouse business, yards, transport of import and export goods, cargo projects, goods in transit, and so on. When participating in negotiations to form alliances with other businesses, this enterprise will have many advantages and a high probability of success.
3.3.2. Results after Alliance
After selecting LO10 as the target enterprise, the authors combined it with nine other businesses to create virtual alliances. Then, the authors evaluated the business performance of these alliances.
From the results in Table 9 and Figure 13, it is shown that, when implementing the LO10 alliance with other enterprises, it can bring better business performance for those enterprises. However, there are also alliances of LO10 with other businesses that do not achieve better business performance. The authors divided enterprises into two groups of alliances as follows:
Group 1: The alliances are not really suitable, as they have not brought good business results (shown in Table 10). Specifically, those alliances are: LO9 + LO10; LO2 + LO10; LO5 + LO10; LO3 + LO10. These alliances make businesses less efficient. Therefore, these alliances are not recommended.
Group 2: These alliances bring good business results for enterprises (shown in Table 11). Specifically, those alliances are: LO7 + LO10; LO1 + LO10; LO4 + LO10; LO8 + LO10; LO6 + LO10. These alliances are therefore encouraged.
Among the above alliances, the alliance between LO7 and LO10 achieved the highest business efficiency (RankLO7+LO10 = 4/19) (ScoreLO7+LO10 = 1.2060). LO7 (Transimex corporation transimex) in Ho Chi Minh City was established in 1983, specializing in import and export goods transportation, bonded warehouse services, CFS warehouse, cold storage, warehousing, loading and unloading, and storing goods. The location is convenient; so, in the future, LO7 will become one of the most competitive enterprises in the market. Moreover, the geographical advantage of these enterprises can help the parties save many logistical costs (LO10 in the north, LO7 in the south). These two businesses have the advantage of all forms of transportation.
By road: LO10 in Hai Phong City–LO7 in HCM City which is 1654.3 km apart (via National Highway 1A).
Waterway: LO10 is near Hai Phong port; LO7 is near Cat Lai port in Ho Chi Minh City.
By air: LO10 is near Cat Bi airport, while LO7 is near Tan Son Nhat airport.
By railway: LO10 is near Hai Phong station, LO7 is near Saigon station.
Therefore, the alliance of LO10 and LO7 is very convenient regarding all forms of transportation. These businesses can maximize each other’s advantages, forming a win–win relationship.
According to statistics, logistics costs in Vietnam are still very high because about 70–75% of transport routes only carry one-way goods. When LO7 and LO10 create an alliance, they can exploit freight in the opposite direction and save a lot of costs, such as material costs, personnel costs, road and bridge costs, and the cost of vehicle wear and tear. The alliance helps businesses access and share customers, increase revenue, and take advantage of economies of scale. This alliance will increase the competitive advantage for both parties. This is considered a reasonable tactic for LO7 and LO10 during this pandemic period, and today’s rapidly changing era of science, technology, and engineering. When implementing the alliance, businesses will solve difficult problems during and after the pandemic, aiming for sustainable development together. As every business is a cell of the economy, any business that survives and prospers will create a great impetus for the national and world economy to recover and develop rapidly.
3.4. Grey Forecasting Results
In this study, the authors used the GM (1, 1) model to forecast the business situation of two enterprises selected to implement a strategic alliance. This forecast result provides a solid basis for managers to make decisions using a complete picture of the business situation of partners in the period 2021–2024. The authors used the data of IN1 of LO7 to explain in detail the calculation steps of the forecast data of enterprises. The steps to calculate the total forecast are performed as follows:
The statistics on IN1 of LO7 in the period 2017–2020 were used to build the original value chain as follows:
The authors use the cumulative addition method to build the value chain of
The authors use the value chain of to calculate the mean :
After calculating the mean , the authors set up the following system of equations:
From the values in the above system of equations, the authors set up the matrices and find the coefficients a, b by the method of least squares:
With the coefficients a, b, the authors built the equation of the GM (1, 1) model:
The formula for calculating the forecast values is set up as follows:
Substituting the values of k in turn, the authors obtain the values of as in Table 12.
The cumulative method is used to calculate the forecast values below:
By the same calculation methods, the authors obtain forecast values that reflect the business situation of logistics enterprises participating in the strategic alliance in the period 2021–2024, which are shown in Table 13 and Table 14, below.
To ensure the reliability of the forecast results, the authors used MAPE to recheck and the results are as follows: MAPELO7 = 3.96%; MAPELO10 = 2.06%. This result shows that the predictive values have very high accuracy (<10%). The forecast results provide managers of enterprises with an overview of the business situation of enterprises in the period 2021–2024. Therefore, managers of enterprises can use the forecast results in this study as a solid basis for making decisions about implementing alliances to bring high results for the business and sustainable development.
4. Conclusions
The COVID-19 pandemic has greatly affected the production and business situation of enterprises around the world. Enterprises in different industries and of different sizes have different levels of influence. In this study, the authors used the Malmquist productivity index to assess the impact of the pandemic on logistics enterprises in Vietnam and the super-slack-based model to evaluate the rankings for businesses in two steps before and after alliance implementation. The rankings are used to choose the optimal alliances for logistics enterprises in Vietnam. The alliances can help businesses save on transportation costs, loading and unloading costs, storage costs, and labor costs, while helping businesses increase revenue and profit. The alliances can help businesses promote their strengths and create competitive advantages. In addition, the authors used the Grey forecasting model to provide managers of enterprises with a complete picture of their partners’ business situation in the period 2021–2024 as a solid basis for decision making.
5. Discussion
The research has some limitations, due to legal policies, environmental conditions, and weather, which affect the business situation of logistics enterprises. In addition, the business strategy of an enterprise also depends on the cultural characteristics, the owner’s views on the development strategy and the resources of the enterprise. So, in practice, to implement this alliance, it is necessary to closely consider combining the above factors. In the future, it will be necessary to combine these factors with the models used in the research to obtain more comprehensive results.
Funding
This research received no external funding.
Institutional Review Board Statement
Not applicable.
Informed Consent Statement
Informed consent was obtained from all subjects involved in the study.
Data Availability Statement
Not applicable.
Conflicts of Interest
The author declares no conflict of interest.
References
- Loan, H. The Picture of the Logistics Industry Is Not Uniform. VnEconomy. Available online: https://vneconomy.vn/ (accessed on 25 May 2021).
- Liu, A.; Zhang, Y.; Luo, S.; Miao, J. Dual-Channel Global Closed-Loop Supply Chain Network Optimization Based on Random Demand and Recovery Rate. Int. J. Environ. Res. Public Health 2020, 17, 8768. [Google Scholar] [CrossRef]
- Van, N. Vietnam’s Transport Infrastructure after 35 Years of Renovation: One Step Ahead to Promote Economic Development. Labour Online. Available online: https://laodong.vn/ (accessed on 27 June 2021).
- Vietnam Logistics Report 2020. Ministry of Industry and Trade. Available online: https://moit.gov.vn/ (accessed on 25 June 2021).
- Toloo, M. An Equivalent Linear Programming Form of General Linear Fractional Programming: A Duality Approach. Mathematics 2021, 9, 1586. [Google Scholar] [CrossRef]
- Wong, W.-P. A Global Search Method for Inputs and Outputs in Data Envelopment Analysis: Procedures and Managerial Perspectives. Symmetry 2021, 13, 1155. [Google Scholar] [CrossRef]
- Parte, L.; Alberca, P. Business Performance and Sustainability in Cultural and Rural Tourism Destinations. Mathematics 2021, 9, 892. [Google Scholar] [CrossRef]
- Lacko, R.; Hajduová, Z.; Zawada, M. The Efficiency of Circular Economies: A Comparison of Visegrád Group Countries. Energies 2021, 14, 1680. [Google Scholar] [CrossRef]
- Chowdhury, H.; Wodchis, W.; Laporte, A. Efficiency and technological change in health care services in Ontario: An application of Malmquist Productivity Index with bootstrapping. Int. J. Product. Perform. Manag. 2011, 60, 721–745. [Google Scholar] [CrossRef] [Green Version]
- Abbas, M.; Hammad, R.S.; Elshahat, M.F.; Azid, T. Efficiency, productivity and Islamic banks: An application of DEA and Malmquist index. Humanomics 2015, 31, 118–131. [Google Scholar] [CrossRef]
- Bahrini, R. Productivity of MENA Islamic banks: A bootstrapped Malmquist index approach. Int. J. Islamic Middle East. Financ. Manag. 2015, 8, 508–528. [Google Scholar] [CrossRef]
- Lee, Y.J.; Joo, S.-J.; Park, H.G. An application of data envelopment analysis for Korean banks with negative data. Benchmarking Int. J. 2017, 24, 1052–1064. [Google Scholar] [CrossRef]
- Wang, C.-N.; Nguyen, H.-K. Enhancing Urban Development Quality Based on the Results of Appraising Efficient Performance of Investors—A Case Study in Vietnam. Sustainability 2017, 9, 1397. [Google Scholar] [CrossRef] [Green Version]
- Deng, J.L. Introduction to Grey system theory. J. Grey Syst. 1989, 1, 1–24. [Google Scholar]
- Stanujkić, D.; Karabašević, D.; Popović, G.; Stanimirović, P.S.; Saračević, M.; Smarandache, F.; Katsikis, V.N.; Ulutaş, A. A New Grey Approach for Using SWARA and PIPRECIA Methods in a Group Decision-Making Environment. Mathematics 2021, 9, 1554. [Google Scholar] [CrossRef]
- Gerus-Gościewska, M.; Gościewski, D. Grey Systems Theory as an Effective Method for Analyzing Scarce, Incomplete and Uncertain Data on the Example of a Survey of Public Perceptions of Safety in Urban Spaces. Land 2021, 10, 73. [Google Scholar] [CrossRef]
- Wu, X.; Zhou, J.; Yu, H.; Liu, D.; Xie, K.; Chen, Y.; Hu, J.; Sun, H.; Xing, F. The Development of a Hybrid Wavelet-ARIMA-LSTM Model for Precipitation Amounts and Drought Analysis. Atmosphere 2021, 12, 74. [Google Scholar] [CrossRef]
- Kokocińska, M.; Nowak, M.; Łopatka, P. Measuring the Efficiency of Economic Growth towards Sustainable Growth with Grey System Theory. Sustainability 2020, 12, 10121. [Google Scholar] [CrossRef]
- Gligorić, Z.; Gligorić, M.; Halilović, D.; Beljić, Č.; Urošević, K. Hybrid Stochastic-Grey Model to Forecast the Behavior of Metal Price in the Mining Industry. Sustainability 2020, 12, 6533. [Google Scholar] [CrossRef]
- Fan, G.-F.; Wang, A.; Hong, W.-C. Combining Grey Model and Self-Adapting Intelligent Grey Model with Genetic Algorithm and Annual Share Changes in Natural Gas Demand Forecasting. Energies 2018, 11, 1625. [Google Scholar] [CrossRef] [Green Version]
- Nguyen, H.-K. Combining DEA and ARIMA Models for Partner Selection in the Supply Chain of Vietnam’s Construction Industry. Mathematics 2020, 8, 866. [Google Scholar] [CrossRef]
- Wang, G.; Qian, Z.; Deng, X. Analysis of Environmental Policy and the Performance of Sustainable Agricultural Development in China. Sustainability 2020, 12, 10453. [Google Scholar] [CrossRef]
- Le, T.; Wang, C.; Nguyen, H. Using the optimization algorithm to evaluate and predict the business performance of logistics companies—A case study in Vietnam. Appl. Econ. 2020, 52, 4196–4212. [Google Scholar] [CrossRef]
- Liu, Y.; Sun, H.; Shi, L.; Wang, H.; Xiu, Z.; Qiu, X.; Chang, H.; Xie, Y.; Wang, Y.; Wang, C. Spatial-Temporal Changes and Driving Factors of Land-Use Eco-Efficiency Incorporating Ecosystem Services in China. Sustainability 2021, 13, 728. [Google Scholar] [CrossRef]
- Nguyen, H.-K. Applications Optimal Math Model to Solve Difficult Problems for Businesses Producing and Processing Agricultural Products in Vietnam. Axioms 2021, 10, 90. [Google Scholar] [CrossRef]
- Hou, J.; Ruan, X.; Lv, J.; Guo, H. Two-Stage Super-Efficiency Slacks-Based Model to Assess China’s Ecological Wellbeing. Int. J. Environ. Res. Public Health 2020, 17, 7045. [Google Scholar] [CrossRef] [PubMed]
- Ebtehaj, I.; Soltani, K.; Amiri, A.; Faramarzi, M.; Madramootoo, C.A.; Bonakdari, H. Prognostication of Shortwave Radiation Using an Improved No-Tuned Fast Machine Learning. Sustainability 2021, 13, 8009. [Google Scholar] [CrossRef]
- Lin, Z.; Guo, W. Cotton Stand Counting from Unmanned Aerial System Imagery Using MobileNet and CenterNet Deep Learning Models. Remote Sens. 2021, 13, 2822. [Google Scholar] [CrossRef]
- Statistics. General Statistics Office of Vietnam. Available online: https://www.gso.gov.vn/ (accessed on 25 May 2021).
Figure 1.
Dual channel network structure in Logistics (Liu et al., 2020).

Figure 2.
Proportion of road types in Vietnam (Vietnam Logistics Report 2020).

Figure 3.
Weight of goods transported by road (Million tons) (Vietnam Logistics Report 2020).

Figure 4.
Weight of goods transported by railway (thousand tons) (Vietnam Logistics Report, 2020).

Figure 5.
Weight of goods transported by seaway (million tons) (Vietnam Logistics Report 2020).

Figure 6.
Weight of goods transported by inland waterways (million tons) (Vietnam Logistics Report 2020).
Figure 6.
Weight of goods transported by inland waterways (million tons) (Vietnam Logistics Report 2020).

Figure 7.
Weight of goods transported by airline (thousand tons) (Vietnam Logistics Report 2020).

Figure 8.
Research process (Source: Researcher).

Figure 9.
Catch-up (Le et al., 2020) [23].
Figure 9.
Catch-up (Le et al., 2020) [23].

Figure 10.
Forecasting process (Nguyen Han Khanh 2021) [26].
Figure 10.
Forecasting process (Nguyen Han Khanh 2021) [26].

Figure 11.
Malmquist results (source: researcher).

Figure 12.
Score efficiency of LOs before alliances (source: researcher).

Figure 13.
Score efficiency of virtual alliances (source: researcher).


Table 1.
List of LOs (Statistics 2021).
| LOs | Name of Companies |
|---|---|
| LO1 | GMD corporation |
| LO2 | HA transport & stevedoring |
| LO3 | HT transport joint stock company |
| LO4 | S & A freight international |
| LO5 | DHMM transport joint stock company |
| LO6 | TC warehousing joint stock company |
| LO7 | TRA corporation |
| LO8 | VIN joint stock company |
| LO9 | VIN logistics joint stock company |
| LO10 | VCS joint stock corporation |
Table 2.
Data of 10 LOs in 2017 (Statistics 2021).
| LOs | IN1 | IN2 | IN3 | IN4 | OU1 | OU2 |
|---|---|---|---|---|---|---|
| LO1 | 7,094,537 | 11,291,217 | 2,954,817 | 344,481 | 3,990,532 | 581,436 |
| LO2 | 836,177 | 1,309,071 | 574,311 | 45,393 | 777,930 | 152,573 |
| LO3 | 320,833 | 377,548 | 144,037 | 15,200 | 181,182 | 21,162 |
| LO4 | 353,880 | 570,430 | 172,822 | 70,447 | 716,293 | 40,947 |
| LO5 | 211,893 | 232,389 | 121,307 | 19,214 | 159,959 | 17,665 |
| LO6 | 322,166 | 676,834 | 539,185 | 42,987 | 679,417 | 62,766 |
| LO7 | 1,421,715 | 2,737,361 | 1,882,482 | 59,715 | 2,136,424 | 211,414 |
| LO8 | 260,283 | 736,057 | 1,806,305 | 24,310 | 1,886,382 | 44,213 |
| LO9 | 201,262 | 340,814 | 797,138 | 14,774 | 824,846 | 24,904 |
| LO10 | 1,709,546 | 2,479,002 | 895,119 | 60,881 | 1,302,883 | 263,828 |
Table 3.
Data of 10 LOs in 2018 (Statistics 2021).
| LOs | IN1 | IN2 | IN3 | IN4 | OU1 | OU2 |
|---|---|---|---|---|---|---|
| LO1 | 6,528,982 | 9,984,063 | 1,739,451 | 320,526 | 2,707,556 | 1,900,250 |
| LO2 | 1,218,676 | 1,655,980 | 834,979 | 61,303 | 1,054,283 | 158,895 |
| LO3 | 330,438 | 392,029 | 175,367 | 16,914 | 219,561 | 27,751 |
| LO4 | 407,014 | 707,326 | 202,781 | 71,644 | 869,055 | 54,172 |
| LO5 | 208,490 | 226,436 | 121,974 | 19,810 | 158,488 | 14,726 |
| LO6 | 340,517 | 609,841 | 528,232 | 42,381 | 659,418 | 60,549 |
| LO7 | 1,625,789 | 3,166,212 | 2,089,885 | 68,910 | 2,333,136 | 235,012 |
| LO8 | 340,219 | 744,914 | 1,608,770 | 21,849 | 1,676,896 | 33,710 |
| LO9 | 210,991 | 354,157 | 907,519 | 13,078 | 941,690 | 24,372 |
| LO10 | 1,944,570 | 2,489,083 | 1,198,472 | 63,187 | 1,694,460 | 354,245 |
Table 4.
Data of 10 LOs in 2019 (Statistics 2021).
| LOs | IN1 | IN2 | IN3 | IN4 | OU1 | OU2 |
|---|---|---|---|---|---|---|
| LO1 | 6,567,257 | 10,119,907 | 1,630,141 | 330,636 | 2,642,914 | 613,569 |
| LO2 | 1,254,682 | 1,827,544 | 889,647 | 67,209 | 1,108,933 | 132,739 |
| LO3 | 335,807 | 427,116 | 225,370 | 20,254 | 271,911 | 29,377 |
| LO4 | 445,005 | 538,935 | 136,653 | 14,237 | 845,985 | 44,877 |
| LO5 | 195,483 | 213,861 | 125,466 | 18,317 | 161,096 | 16,251 |
| LO6 | 359,439 | 626,332 | 548,740 | 54,609 | 701,657 | 68,593 |
| LO7 | 1,947,165 | 3,310,259 | 2,067,261 | 80,137 | 2,348,544 | 225,324 |
| LO8 | 356,345 | 716,298 | 1,463,866 | 19,708 | 1,519,304 | 19,795 |
| LO9 | 211,456 | 340,901 | 871,202 | 14,559 | 899,915 | 18,788 |
| LO10 | 2,070,078 | 2,393,245 | 1,355,854 | 65,611 | 1,792,751 | 285,795 |
Table 5.
Data of 10 LOs in 2020 (Statistics 2021).
| LOs | IN1 | IN2 | IN3 | IN4 | OU1 | OU2 |
|---|---|---|---|---|---|---|
| LO1 | 6,594,929 | 9,834,544 | 1,656,082 | 341,474 | 2,605,666 | 440,476 |
| LO2 | 1,335,797 | 2,094,551 | 952,285 | 67,886 | 1,191,667 | 146,598 |
| LO3 | 338,248 | 418,484 | 237,067 | 24,904 | 282,084 | 26,660 |
| LO4 | 482,381 | 702,041 | 171,784 | 19,294 | 1,203,173 | 82,333 |
| LO5 | 200,204 | 220,371 | 134,019 | 19,509 | 170,252 | 17,861 |
| LO6 | 356,895 | 652,319 | 601,216 | 57,627 | 768,721 | 78,060 |
| LO7 | 2,346,510 | 3,919,585 | 3,111,468 | 98,228 | 3,421,254 | 321,629 |
| LO8 | 355,180 | 917,042 | 2,420,329 | 24,450 | 2,471,666 | 8557 |
| LO9 | 220,936 | 402,607 | 1,162,837 | 20,349 | 1,202,207 | 23,191 |
| LO10 | 2,170,698 | 2,458,144 | 1,239,556 | 73,458 | 1,688,865 | 296,404 |
Table 6.
Correlation coefficient (calculated by researcher).
| IN1 | IN2 | IN3 | IN4 | OU1 | OU2 | IN1 | IN2 | IN3 | IN4 | OU1 | OU2 | |
|---|---|---|---|---|---|---|---|---|---|---|---|---|
| 2017 | 2018 | |||||||||||
| IN1 | 1.0000 | 1.0000 | ||||||||||
| IN2 | 0.9979 | 1.0000 | 0.9948 | 1.0000 | ||||||||
| IN3 | 0.7858 | 0.8175 | 1.0000 | 0.5549 | 0.6024 | 1.0000 | ||||||
| IN4 | 0.9800 | 0.9793 | 0.7424 | 1.0000 | 0.9732 | 0.9734 | 0.4506 | 1.0000 | ||||
| OU1 | 0.8780 | 0.9022 | 0.9762 | 0.8546 | 1.0000 | 0.7591 | 0.7937 | 0.9340 | 0.6936 | 1.0000 | ||
| OU2 | 0.9655 | 0.9652 | 0.7909 | 0.9183 | 0.8771 | 1.0000 | 0.9893 | 0.9835 | 0.4880 | 0.9829 | 0.7005 | 1.0000 |
| 2019 | 2020 | |||||||||||
| IN1 | 1.0000 | 1.0000 | ||||||||||
| IN2 | 0.9953 | 1.0000 | 0.9938 | 1.0000 | ||||||||
| IN3 | 0.5761 | 0.5944 | 1.0000 | 0.3875 | 0.4404 | 1.0000 | ||||||
| IN4 | 0.9809 | 0.9866 | 0.5046 | 1.0000 | 0.9798 | 0.9832 | 0.3235 | 1.0000 | ||||
| OU1 | 0.7904 | 0.7977 | 0.9237 | 0.7164 | 1.0000 | 0.5850 | 0.6282 | 0.9349 | 0.5102 | 1.0000 | ||
| OU2 | 0.9859 | 0.9717 | 0.6146 | 0.9500 | 0.8191 | 1.0000 | 0.9128 | 0.8955 | 0.4863 | 0.8391 | 0.6714 | 1.0000 |
Table 7.
Malmquist results (calculated by researcher).
| Malmquist | 2017 => 2018 | 2018 => 2019 | 2019 => 2020 | Average |
|---|---|---|---|---|
| LO1 | 1.1643 | 0.7163 | 0.7235 | 0.8680 |
| LO2 | 0.7853 | 0.8382 | 1.0542 | 0.8926 |
| LO3 | 0.9747 | 0.9007 | 0.9371 | 0.9375 |
| LO4 | 1.0368 | 1.5156 | 1.2058 | 1.2527 |
| LO5 | 1.0256 | 1.1056 | 0.9853 | 1.0388 |
| LO6 | 0.9705 | 1.0628 | 1.1078 | 1.0470 |
| LO7 | 1.0054 | 0.9615 | 1.4105 | 1.1258 |
| LO8 | 0.8538 | 0.9284 | 1.1514 | 0.9779 |
| LO9 | 1.0732 | 0.9243 | 0.9857 | 0.9944 |
| LO10 | 1.1240 | 1.0037 | 0.9866 | 1.0381 |
| Average | 1.0014 | 0.9957 | 1.0548 | 1.0173 |
| Max | 1.1643 | 1.5156 | 1.4105 | 1.2527 |
| Min | 0.7853 | 0.7163 | 0.7235 | 0.8680 |
| SD | 0.1149 | 0.2134 | 0.1824 | 0.1132 |
Table 8.
Rank and score before alliances (calculated by researcher).
| LOs | Score | Rank |
|---|---|---|
| LO1 | 1.1969 | 6 |
| LO2 | 0.5554 | 9 |
| LO3 | 0.4432 | 10 |
| LO4 | 3.2525 | 1 |
| LO5 | 1.0729 | 8 |
| LO6 | 1.1042 | 7 |
| LO7 | 1.2964 | 4 |
| LO8 | 1.3031 | 3 |
| LO9 | 1.5320 | 2 |
| LO10 | 1.2242 | 5 |
| Average | 1.2981 | |
| Max | 3.2525 | |
| Min | 0.4432 | |
| St Dev | 0.7646 | |
Table 9.
Performance ranking of virtual LOs (calculated by researcher).
| DMU | Score | Rank |
|---|---|---|
| LO4 | 3.1323 | 1 |
| LO9 | 1.5320 | 2 |
| LO8 | 1.2891 | 3 |
| LO7 + LO10 | 1.2060 | 4 |
| LO1 + LO10 | 1.1506 | 5 |
| LO4 + LO10 | 1.1447 | 6 |
| LO6 | 1.1042 | 7 |
| LO5 | 1.0729 | 8 |
| LO8 + LO10 | 1.0569 | 9 |
| LO6 + LO10 | 1.0098 | 10 |
| LO7 | 1.0051 | 11 |
| LO10 | 1.0019 | 12 |
| LO1 | 1.0009 | 13 |
| LO9 + LO10 | 0.8816 | 14 |
| LO2 + LO10 | 0.8149 | 15 |
| LO5 + LO10 | 0.7543 | 16 |
| LO3 + LO10 | 0.7444 | 17 |
| LO2 | 0.4930 | 18 |
| LO3 | 0.4432 | 19 |
Table 10.
The alliances are not really suitable (calculated by researcher).
| Virtual Alliance | Rank of LO Objectives (1) | Rank of Virtual Alliance (2) | Difference (1)–(2) |
|---|---|---|---|
| LO9 + LO10 | 12 | 14 | (−2) |
| LO2 + LO10 | 12 | 15 | (−3) |
| LO5 + LO10 | 12 | 16 | (−4) |
| LO3 + LO10 | 12 | 17 | (−5) |
Table 11.
The good alliances (calculated by researcher).
| Virtual Alliance | Rank of LO Objectives (1) | Rank of Virtual Alliance (2) | Difference (1)–(2) |
|---|---|---|---|
| LO7 + LO10 | 12 | 4 | 8 |
| LO1 + LO10 | 12 | 5 | 7 |
| LO4 + LO10 | 12 | 6 | 6 |
| LO8 + LO10 | 12 | 9 | 3 |
| LO6 + LO10 | 12 | 10 | 2 |
Table 12.
Values of .
| k | 0 | 1 | 2 | 3 | 4 | 5 | 6 | 7 |
|---|---|---|---|---|---|---|---|---|
| 1,421,715 | 3,040,132.07 | 4,984,187.10 | 7,319,400.97 | 10,124,477.83 | 13,493,957.75 | 17,541,402.96 | 22,403,225.28 |
Table 13.
Forecast results of LO7 (calculated by researcher).
| Year | IN1 | IN2 | IN3 | IN4 | OU1 | OU2 |
|---|---|---|---|---|---|---|
| 2021 | 2,805,076.87 | 4,303,481.46 | 3,711,574.61 | 1,16,408.90 | 4,053,514.37 | 3,66,039.62 |
| 2022 | 3,369,479.92 | 4,808,990.52 | 4,654,061.51 | 1,39,347.27 | 5,023,131.95 | 4,37,167.59 |
| 2023 | 4,047,445.21 | 5,373,879.28 | 5,835,875.82 | 1,66,805.63 | 6,224,686.10 | 5,22,116.97 |
| 2024 | 4,861,822.33 | 6,005,122.78 | 7,317,790.39 | 1,99,674.67 | 7,713,657.04 | 6,23,573.51 |
Table 14.
Forecast results of LO10 (calculated by researcher).
| Year | IN1 | IN2 | IN3 | IN4 | OU1 | OU2 |
|---|---|---|---|---|---|---|
| 2021 | 1,719,878.32 | 1,304,769.41 | 78,465.61 | 256,273.93 | 2,415,700.90 | 2,297,303.85 |
| 2022 | 1,717,145.55 | 1,325,379.86 | 84,760.31 | 232,672.22 | 2,400,308.87 | 2,426,501.12 |
| 2023 | 1,714,417.13 | 1,346,315.89 | 91,559.99 | 211,244.13 | 2,385,014.91 | 2,562,964.27 |
| 2024 | 1,711,693.04 | 1,367,582.62 | 98,905.16 | 191,789.47 | 2,369,818.40 | 2,707,101.93 |
Publisher’s Note: MDPI stays neutral with regard to jurisdictional claims in published maps and institutional affiliations. |
© 2021 by the author. Licensee MDPI, Basel, Switzerland. This article is an open access article distributed under the terms and conditions of the Creative Commons Attribution (CC BY) license (https://creativecommons.org/licenses/by/4.0/).
Share and Cite
MDPI and ACS Style
Nguyen, H.K. Application of Mathematical Models to Assess the Impact of the COVID-19 Pandemic on Logistics Businesses and Recovery Solutions for Sustainable Development. Mathematics 2021, 9, 1977. https://doi.org/10.3390/math9161977
AMA Style
Nguyen HK. Application of Mathematical Models to Assess the Impact of the COVID-19 Pandemic on Logistics Businesses and Recovery Solutions for Sustainable Development. Mathematics. 2021; 9(16):1977. https://doi.org/10.3390/math9161977
Chicago/Turabian StyleNguyen, Han Khanh. 2021. "Application of Mathematical Models to Assess the Impact of the COVID-19 Pandemic on Logistics Businesses and Recovery Solutions for Sustainable Development" Mathematics 9, no. 16: 1977. https://doi.org/10.3390/math9161977
Note that from the first issue of 2016, this journal uses article numbers instead of page numbers. See further details here.