Abstract
The long short-term memory (LSTM) and gated recurrent unit (GRU) models are popular deep-learning architectures for stock market forecasting. Various studies have speculated that incorporating financial news sentiment in forecasting could produce a better performance than using stock features alone. This study carried a normalized comparison on the performances of LSTM and GRU for stock market forecasting under the same conditions and objectively assessed the significance of incorporating the financial news sentiments in stock market forecasting. This comparative study is conducted on the cooperative deep-learning architecture proposed by us. Our experiments show that: (1) both LSTM and GRU are circumstantial in stock forecasting if only the stock market features are used; (2) the performance of LSTM and GRU for stock price forecasting can be significantly improved by incorporating the financial news sentiments with the stock features as the input; (3) both the LSTM-News and GRU-News models are able to produce better forecasting in stock price equally; (4) the cooperative deep-learning architecture proposed in this study could be modified as an expert system incorporating both the LSTM-News and GRU-News models to recommend the best possible forecasting whichever model can produce dynamically.
1. Introduction
Stock market forecasting is an important task in stock market exchange in the world. Usually stock market forecasting is concerned with accurate prediction of either/both the trend or/and the price of a stock so as to gain a higher profit through trading. However, obtaining an accurate prediction of the stock trend and/or price has been a challenging and difficult task due to the nonlinear and volatile nature of stock exchange. Traditionally, some people who believe the efficient market hypothesis theory [1] argue that the future stock price is predictable based on the historical stock data. Others who trust the random walk theory believe that the future stock price does not depend on the historical stock data, and hence no useful patterns could be found in the historical data to reflect the pattern of the upcoming stock sequences [2].
As an intuitive choice, many statistical models were developed to estimate the stock price using the past and present data, such as autoregressive integrated moving average (ARIMA) models [3]. These statistical models map linear relationships well but are not practically useful in stock market forecasting due to the nonlinear nature of stock market exchange. With the emergence of computational intelligence in the past three decades, more nonlinear models empowered by artificial neural networks (ANNs), fuzzy–neural systems, genetic algorithms, evolutionary and/or particle swarm techniques have been proposed by many researchers for stock market forecasting [4,5,6,7,8,9].
Researchers also noticed that the financial news, along with the social media gossips through various social media platforms in the recent decade, could impose on further volatility on the stock market. The sentiment of such news must be considered in any expert system for stock market forecasting. Understandably, it is impossible to manually arrange such news sentiment for the purpose of dynamic stock market forecasting. Accordingly, algorithms of natural language processing and media sentiment analysis have been proposed to align the news sentiment and stock market indices automatically to increase the accuracy of stock market prediction [10].
Many studies by far indicated deep learning that employs multiple layers of ANNs has shown some promising results in stock market forecasting with or without considering the news sentiment measures [11,12,13,14,15,16,17]. The most popular deep-learning architecture for stock market forecasting seems the long short-term memory (LSTM) model or its hybridization [11,12,13,14,15]. The other popular deep-learning architecture for stock market forecasting is the gated recurrent unit (GRU) model or its hybridization [16,17,18,19]. Both models seemingly boast about producing the better performance in every new publication. However, these studies ware based on different designs, assumptions, implementations—and applying to different stocks in different countries—it is hardly to make any objective comparison between the performances of these two popular models in the same conditions. Furthermore, even for the same model, outcomes from various studies were far from reaching a certainty on whether incorporating financial news sentiments in the stock forecasting could lead to a better performance than without considering this factor due to the diverse conditions in different studies.
This study aims at first, conducting a normalized comparison on the performances of the LSTM and GRU models for stock market forecasting under the same conditions, and second, objectively assessing the significance of incorporating the financial news sentiments in stock market forecasting with respect to that if only the stock features are used. To achieve these goals, we design a cooperative deep-learning architecture that can treat both the LSTM and GRU models equally with the same inputs consisting of relevant features from past stock data and the news sentiment score for stock prediction. To ensure an objective comparison, the implementation of this cooperative deep-learning architecture has been made by using the existing algorithms or tools used in previously published studies by other researchers. This removes potential bias that may be introduced in any untried algorithm proposed by us. Given the high diversity in assessing the level of news sentiment for stock market exhibited by numerous media outlets in developed countries, it is logical to choose the stock market data from a country where the media outlets are consistent and accessible over a period of time long enough to support the purpose of this study. Hence, the Nepali stock datasets and financial news datasets are chosen for this study to explore the influence of the financial news sentiment on stock market forecasting.
The contributions of this study include: (a) Answering the key question: in the same conditions, which deep-learning model, LSTM or GRU, would be a better choice for achieving the best possible stock forecasting? (b) Confirming whether the financial news sentiment has a causal influence on stock market forecasting? (c) Establishing a cooperative deep-learning architecture that can treat both the LSTM and GRU models equally with the same inputs consisting of relevant features from past stock data and the news sentiment scores for stock prediction. This cooperative architecture could be modified as a platform for conducting objective comparative studies in many other disciplines, and more important, as an expert system incorporating both the LSTM-News and GRU-News models to recommend the best possible forecasting whichever model can produce dynamically.
The remainder of this paper is organized as follows: related work is reviewed in Section 2; design and methodologies are presented in Section 3; experiment settings and results are shown in Section 4; discussions on the results and implications are made in Section 5, followed by conclusion and future work in Section 6.
2. Related Work
In recent years, various deep-learning techniques have been applied in stock market prediction in different stock markets around the world. The LSTM model was used by Chen et al. [11] to predict China’s stock market in Shanghai and Shenzhen Exchanges (SSE). This model contains a single input layer, followed by multiple LSTM layers, a dense layer and a single output layer with several neurons. Multiple stock features such as high price, low price, open price, close price, were experimented with six different methods to predict stock prices. This study indicated that the normalized features and SSE indices could increase the accuracy of forecasting. Financial news sentiment was not considered in this study.
Samarawickrama and Fernando [14] selected three companies from the Colombo Stock Exchange (CSE) to predict the stock prices using multilayer perceptron (MLP), simple recurrent neural network (SRNN), LSTM and GRU architectures. The experiment used closing, high and low prices of the past two days as the input variables without considering financial news sentiments. What is more interesting about the research output was that the MLP model produced the best result when predicting the closing price for the next day. This finding may be attributed to the fact that only the stock features of the past two days were considered for these models, which restricted the ability of the deep-learning models to explore more potential clues.
Althelaya et al. [12] evaluated and compared the bidirectional LSTM (BLSTM) and stacked LSTM (SLSTM) models for stock price prediction. In BLSTM, preceding and succeeding input sequences were used to exploit all input data in the learning process. In SLSTM, several LSTM layers were stacked to perform deep learning. Data from Standard and Poor 500 Index (S&P500) were used for training, and the closing price at the end of every trading day was the predicting target. Overall, the BLSTM model performed well for both long and short-term predictions whereas the SLSTM model produced a better performance for predicting short-term prices only. However, this study did not consider any financial sentiment influence.
Li et al. [15] incorporated stock indicators with investor sentiments to predict the CSI300 index values based on the LSTM model that contained four layers with 30 nodes. The investor sentiments were analyzed with a naïve Bayes classifier. This study showed that this model outperformed the support vector machine (SVM) methods in prediction accuracy. However, it fell short in making comparison with the performance of the LSTM model if only using the stock indicators without considering the investor sentiments.
Jiawei and Murata [13] attempted to identify the factors influencing stock market trend prediction with a LSTM model with a preprocessing algorithm to reduce the dimension of stock features and a sentiment analyzer to render financial news for stock trend prediction. The result showed that the ‘market emotion’ was a very important factor influencing the stock market and could help improving prediction accuracy. However, it stopped exploring further on assessing the extent of such influence with respect to that if only the stock features were used as the input.
Li. et al. [20] proposed a LSTM model using the stock features with the sentiment polarity from financial news as inputs for stock trend prediction. This LSTM model with the basic news sentiment produced better performance compared with the baseline model consisting of SVM and multiple-kernel learning (MKL). A comparison with the performance of the LSTM model if only used the stock indicators as the input would have been more useful in assessing the influence of the news sentiments in stock forecasting.
GRU introduced by Cho et al. [21] is a deep-learning architecture to overcome the problems of vanishing and explosion of gradients in traditional recurrent neural networks (RNNs) when learning long-term dependencies. Hence, similar to LSTM, GRU and GRU-related models have been used in financial investment prediction recently, for example, Bitcoin price prediction [22].
Shen et al. [16] applied two GRU models for predicting trading signals of stock indices of the Hang Seng Indexes (HSI), the Deutscher Aktienindex (DAX) and the S&P 500 Index from 1991 to 2017 and compared the performance of this GRU-based model with that of SVM and other models. The results showed that the two GRU models produced a higher prediction accuracy than other models. It should be noted than this study was focused on predicting trading signals of stock indices by using stock data without considering financial news sentiments.
Rahman et al. [17] applied the GRU model to predict the future prices of stock markets using stock datasets collected from Yahoo finance. The authors claimed that the proposed method predicted the future prices with good accuracy. Obviously, financial news sentiment was not considered, and no comparison was made with the performance of other models in this study.
Saud and Shakya [18] compared the performances of stock price prediction from three deep-learning models Vanilla RNN, LSTM and GRU using the stock market features extracted from the Nepal Stock Exchange (NEPSE). This study found that GRU was the most successful model in stock price prediction among the three models. Financial news sentiment was not considered in this study.
Dang et al. [19] proposed a two-stream GRU model that incorporated the financial news sentiments with stock features as inputs to forecast S&P 500 index trends and prices. Results showed that the two-stream GRU model outperformed other models, including both the LSTM model and the original GRU model. The authors also pointed out that the two-stream GRU model requires long time for training and huge computational resources because of the complexity of the enlarged GRU model.
The review of literature echoes the aims of this study in the previous section, i.e., to conduct a normalized comparison on the performances of the LSTM and GRU models for stock market forecasting under the same conditions and to objectively assess the significance of incorporating the financial news sentiments in stock market forecasting.
3. Methods and Design
The proposed deep-learning architecture for stock price prediction is shown in Figure 1. The historical stock data and the sentiment scores of financial news headlines are combined as a single vector to generate a time series sequence as the input. Two deep-learning models, LSTM and GRU, are then trained in supervised learning settings with the mean absolute error (MAE) chosen as the main loss function. Finally, these models are evaluated based on metrices discussed in Section 3.4 later.
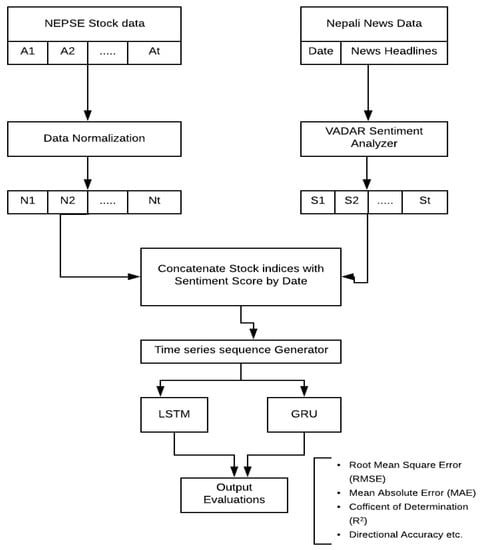
Figure 1.
Cooperative deep learning architecture for stock price prediction framework.
3.1. Data Preparations
Historical stock data and financial news headlines are scraped from website (www.sharesansar.com) using a web crawler. This website is a popular stock trading source in Nepal which contains a plethora of information about the Nepalese stock market. It lists daily trading data of individual stocks listed in the Nepal Stock Exchange (NEPSE), Initial Public Offering (IPO), Further Public Offering (FPO) and financial news. Historical stock data of agriculture development bank (ADBL) on daily basis are scrapped with the following attributes: open price, last traded price (LTP), high price, low price and quantity of share from 20 March 2011 to 14 November 2019. The daily financial news of a total of 42,110 samples are collected for the same period. The statistics of data collected is shown in Table 1.

Table 1.
Description of datasets.
3.2. Data Alignment and Analysis
News headlines obtained from web scraping are processed to remove those unnecessary texts in the HTML tags and escape sequences. As punctuations like exclamation marks and multiple question marks reflect the emotion and strength in the headlines, such punctuation marks are not removed. Instead of creating our own algorithm that may lack of credibility, we choose the published algorithm VADER [23,24] to render the financial news headlines to sentiment scores. Note that regardless of how the sentiment scores are converted from the news headlines, they are fed to both the LSTM and GRU models equally without bias to one or the other. The sentiment scores are placed into a new field named ‘Score’ and saved into a CSV file. The ‘date’ field in the news datasets is converted to the format mm/dd/yyyy to match the date format with the stock datasets. Commas in the ‘quantity’ field in the stock datasets representing the numeric positions are removed to make the numbers as pure numeric values. Examples of the cleaned daily data are shown in Table 2. The source codes used in this study are available at https://github.com/tejshahi/StockPricePrediction-NEPSE-.
Table 2.
Samples of combined datasets.
Since the Nepal stock exchange runs from Sunday to Thursday, but financial news headlines are published seven days in a week, we assert that news on weekend days have an impact on the stock price on Sunday (the first trading day of next week). Therefore, we aligned the sentiment score to stock data daily as shown in Figure 2.
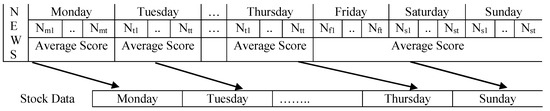
Figure 2.
Mapping between financial news sentiment scores and stock data.
The min–max normalization [25] technique is used to scale each feature to range [0, 1]. The min–max transformation is achieved by using Formula (1).
A total of 1991 datasets are available after merging the sentiment scores to the stock data. Among these 1991 datasets, there are 1786 positive, 204 negative and 1 neutral news headlines. Applying regression to all the corelated variables produces the correlation matrix presented in Figure 3. There are significant correlations between the sentiment score and each of the chosen stock indices.
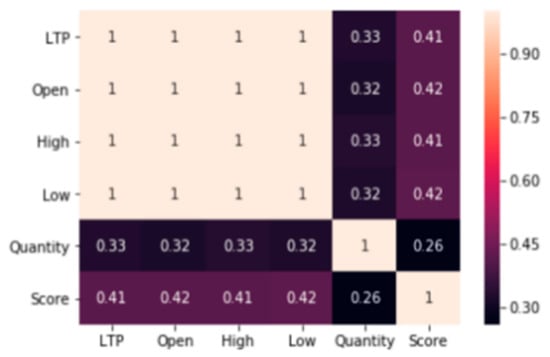
Figure 3.
Correlation matrix between all features.
The fields open, high, low, quantity and score are combined as the input to the models and the target variable is LTP. Two input sets are created for different purposes: Set I with only the stock attributes and Set II with both the stock attributes and the news sentiment score, both using n-days lag (i.e., look-back value).
3.3. Deep-Learning Models: GRU and LSTM
The structure of a GRU unit consists of an update gate (zt), reset gate (rt), and a current memory content (ĥt) whereas the output (ht) is stored in the final memory of the GRU [8]. The update gate decides how much the input (xt) and previous output (ht − 1) to be passed to the next cell, which is controlled by the weight (Wz). The reset gate is used to determine how much of the past information to forget. The current memory content ensures that only the relevant information to be passed to the next iteration, which is determined by the weight W. The main operations in GRU are governed by the following formulae:
where zt and rt are intermediate values obtained from the update and reset gates, respectively; tanh is hyperbolic tangent function; σ is the sigmoid function.
Compared with the GRU model, the LSTM architecture includes one more gate i.e., the output gate, in addition to the update (or input) and reset (or forget) gates in GRU. LSTM also has more operations with respect to each of the gates briefed as follows:
Forget gate
Input gate
Output gate
where ft is the value from the forget gate; b is the bias; Ct is the value from the input gate; it is the intermediate output.
3.4. Model Assessment Metrices
The daily stock price and trend prediction are assessed through various metrices. The root mean square error (RMSE) and mean absolute error (MAE) are used to assess the prediction error while coefficient of determination (R2) is used to measure the goodness of fittings between the actual and predicted values. The accuracy of prediction trend is assessed with directional accuracy (DA). It measures the accuracy of stock trend prediction by comparing the predicted price with actual price using Formula (15). All the measures are formulated below.
where ; pd is the predicted price and ad is the actual price of stock at day d.
4. Experiment Settings and Results
4.1. Experimental Setup
In the experiment, both LSTM and GRU have the same number of layers, activation function and inputs to make the comparison consistent. Each model is composed of one input layer, followed by a LSTM/GRU layer, followed by a dropout layer and finally a dense output layer. The input layer contains the number of memory units equal to the number of input features. The LSTM/GRU layers consist of 120 memory units. The activation function used in each LSTM/GRU layer is the hyperbolic tangent. The full specification of parameters used in these models is listed in Table 3.
Table 3.
Specification of parameters for training.
In order to prevent overfit and underfit of training due to too many or too few epochs, the early stopping method is being implemented in these models. Early stopping is a method that allows us to specify a large arbitrary number of training epochs and stop training once the performance of the model has stopped improving on the validation dataset.
The total data are divided into three subsets: training, validation and test sets as shown in Table 4. The validation set is used during the training process to validate the value of the loss function in each epoch. The loss function used in the model is MAE. MAE is calculated at the end of each epoch. The training process is stopped if there is no further improvement or no change in the loss function value, after a certain number of epoch delay. The first sign of no further improvement may not be the optimal time to stop training as the model may coast into a plateau of no improvement or even get slightly worse before getting better. To account for this situation, a delay to the trigger in terms of the number of epochs on which there is no improvement is set.
Table 4.
Training and test data distribution.
4.2. Experimental Results
The designed LSTM and GRU models are executed for several look-back values with an epoch value of 100 and batch size 30. The experiment has two input sets. Set I only uses the historical stock attributes whereas Set II contains both the historical stock attributes and the news sentiment scores. These inputs are used to train the LSTM/GRU model separately. During the experiments, different look-back values are set. The MAE and RMSE at different look-back values are plotted in Figure 4 whereas the coefficients of determination (R2) for the four models are plotted in Figure 5. The detailed statistical figures are tabulated in Table 5.
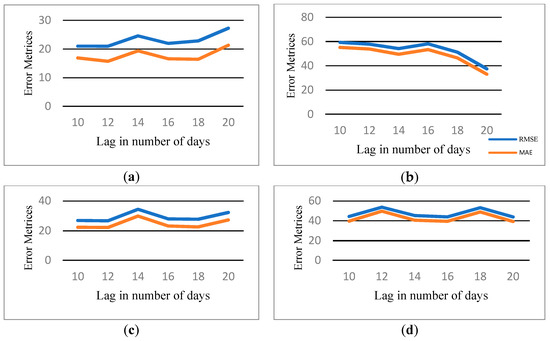
Figure 4.
Mean absolute error (MAE) and root mean square error (RMSE) plots at different look-back values: (a) long short-term memory (LSTM) with news sentiment; (b) LSTM without news sentiment; (c) gated recurrent unit (GRU) with news sentiment; and (d) GRU without news sentiment.
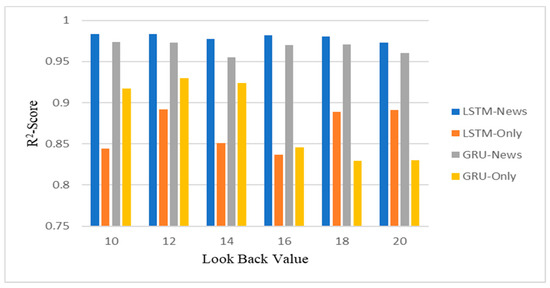
Figure 5.
Chart of R2 scores of the four models at different look-back values.
Table 5.
Summary of results.
All indicators (except training time) show that the LSTM model with the news sentiment is the best performer, followed by the GRU model with news sentiment. This order is almost completely inversed for LSTM and GRU if the news sentiment is not considered. However, both LSTM and GRU perform far inferior than they do by incorporating the news sentiment with stock feature in the input. In other words, the impact of the financial news sentiments on stock market prediction is very influential. The difference in DA among the four models is the smallest; hence all four models can predict the stock trend with a similar level of accuracy.
4.3. Statistical Test
Although some indicators point to the existence of significant differences between the outcomes with or without considering the financial news sentiments as part of the input to the models, such indicative fact must be evaluated through statistical analysis. We use the Diebold–Mariano (DM) test [26] to achieve this goal. Let at be the actual time series and pt be the predicted time series; then ei,t is the forecast error of ith model. In the DM test, the null hypothesis assumes that two models have equal levels of prediction accuracy, i.e., E(dt) = 0, where dt = f(e1,t) − f(e2,t) which refers to a loss differential with given loss function f(.). The formula for DM statistics is given in Formula (17).
where and are consistent estimate of spectral density of the loss differential at frequency 0. We conducted the DM test on the loss function MAE as it is the simplest indicator with the least distortion caused by nonlinear operations like the square root. The statistical results are shown in Table 6.
Table 6.
Diebold–Mariano (DM) tests on Mean absolute error (MAE) between forecasting models for Nepal Stock Exchange (NEPSE).
In Table 6, the values below the diagonal indicate the DM-statistics and the values above the diagonal represent the p-value for DM-test. We should reject the null hypothesis, i.e., the two model has no significant difference at 95% confidence level if DM-statistics is outside of the range −1.96 to 1.96 or p-value is less than 0.05. Otherwise, we cannot reject the null hypothesis. The p-value less than 0.05 (or the DM value outside of the range −1.96 to 1.96) is italicized in Table 6. Statistically the LSTM-News model distinguishes itself from other models in terms of MAE, so does the GRU-News model. There is no statistical difference between the LSTM only and GRU only models.
5. Discussion
It is difficult to compare our results with those from previous studies by other authors due to differences in stock datasets, news channels and sentiment rendering, model design and implementation, evaluation measures, computing environments, etc. The purpose of this study is to conduct a normalized comparison on the performances of the LSTM and GRU models for stock market forecasting under the same conditions and to objectively assess the significance of incorporating the financial news sentiments in stock market forecasting with respect to that if only the stock features are used. Hence, our results are sufficient for us to achieve these preset goals of this study. Our discussions are focused on the issues associated with these preset goals.
5.1. Performances of LSTM and GRU with Only Stock Features
In [18], the authors found that GRU outperformed LSTM in stock price prediction. In another comparative study involved more than ten different models [8], the authors tabulated the outcomes from applying these models to various stocks in different countries. It showed that the GRU and LSTM models had mixed performances, i.e., on some cases LSTM was better than GRU whereas on other occasions GRU outperformed LSTM.
Under the same conditions with MAE as the measure, our results show that the performances of LSTM and GRU are statistically different from each other, and GRU is the better performer with a MAE of 42.8 compared with a MAE of 48.5 for LSTM (Table 5). This seems to support the conclusion in [18]. By carefully inspecting the test plots of these two models in Figure 6, however, LSTM seems outperformed GRU in most period except from April 2019 to September 2019. It seems the overall average of MAE misrepresents the entire picture of forecasting to some extent. It is more logical to suggest that both LSTM and GRU are circumstantial in stock forecasting with only the stock market features as the input. This finding seems consistent with the outcomes from [8].
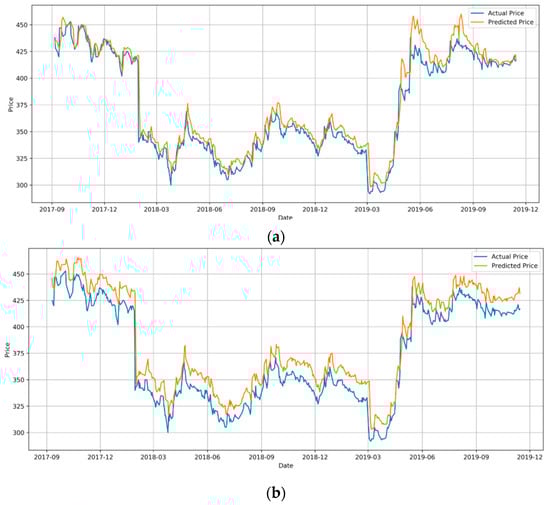
Figure 6.
The actual and predicted price of agriculture development bank (ADBL) from 12/09/2017 to 14/11/2019. (a) LSTM; (b) GRU.
5.2. Performances of LSTM with and without Financial News Sentiments
In [15] and [20], the authors reported that LSTM with financial sentiment indicators showed improved performances over other traditional models, but they did not conduct any comparison on the performances of LSTM with and without considering any financial sentiment indicator in stock prediction. The result from [13] showed that the ‘market emotion’ was a very important factor influencing the stock market and could help prediction accuracy but failed to present any statistical support to this finding.
Under the same conditions with MAE as the measure, our results show that the performances of LSTM with and without the financial news sentiments are statistically different from each other, and the LSTM-News model has a far better performance with a MAE of 17.7 compared with a MAE of 48.5 for the LSTM only model (Table 5). The much stronger coefficient of determination (R2) of 0.979 for the LSTM-News model indicates a consistent improvement in stock price prediction over the whole period, which can be seen by contrasting Figure 6a and Figure 7a. The large discrepancies from April 2019 to September 2019 in Figure 6a for the LSTM only model are significantly reduced in Figure 7a for the LSTM-News model whereas the good fits in other sections are maintained. We can draw a conclusion with statistical confidence that the performance of LSTM for stock price forecasting can be significantly improved by incorporating the financial news sentiments with the stock features as the input.
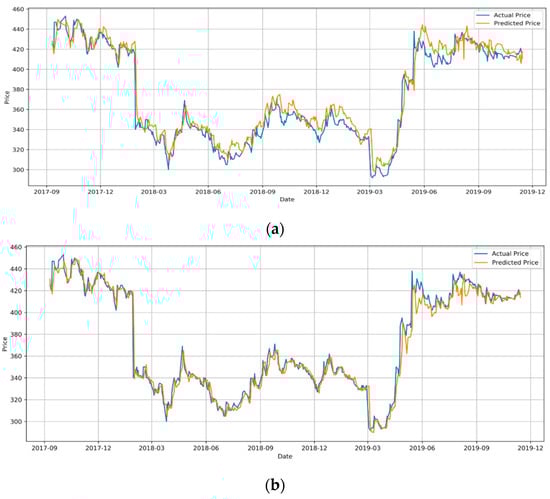
Figure 7.
The actual and predicted price of ADBL from 12/09/2017 to 14/11/2019: (a) LSTM with News; (b) GRU with News.
However, it must be noted that the financial news sentiments must be carefully examined for relevance and rendered for appropriate representation. It is also noticeable that the processing time for the LSTM-News model is much longer compared with if only using the stock features (Table 5).
5.3. Performances of GRU with and without Financial News Sentiments
Similar to the LSTM-News model, under the same conditions with MAE as the measure, our results show that the performances of GRU with and without the financial news sentiments are statistically different from each other, and the GRU-News model has a far better performance with a MAE of 24.5 compared with a MAE of 42.8 for the GRU only model (Table 5). The strong coefficient of determination (R2) of 0.967 for the GRU-News model indicates a consistent improvement in stock price prediction over the whole period (Figure 7b). We can also draw a conclusion with statistical confidence that the performance of GRU for stock price forecasting can be significantly improved by incorporating the financial news sentiments with the stock features as the input. Once again, the financial news sentiments must be carefully examined for relevance and rendered for appropriate representation.
5.4. Performances of LSTM and GRU with Financial News Sentiments
Our results and previous discussions have confirmed that both LSTM and GRU can produce far better performance in stock forecasting by incorporating the financial news sentiments with the stock features as the input. The other suggestion is that both LSTM and GRU are circumstantial in stock forecasting if without considering the financial news sentiments. The following discussion is focused on assessing if both LSTM and GRU are still circumstantial in stock forecasting if considering both the financial news sentiments and the stock market features as the input.
Under the same conditions with MAE as the measure, our results show that the performances of LSTM-News and GRU-News are statistically different from each other (p = 0.001), and the LSTM-News model has a better performance with a MAE of 17.7 compared with a MAE of 24.5 for the GRU-News (Table 5). However, there is no statistical difference in the coefficient of determination (R2) between LSTM-News (0.979) and GRU-News (0.967). This means that the direct correlation between the actual and predicted prices is almost the same for both the LSTM-News and GRU-News models. Hence, the averaging nature of MAE may smooth the pikes of errors in some sections.
By carefully inspecting the test plots of these two models in Figure 7, GRU seems performed better than LSTM over the whole period virtually. However, statistically in terms of MAE, LSTM seems a better performer than GRU. Given these contradictory indications, it is logical to suggest that both the LSTM-News and GRU-News models are able to produce better forecasting in stock price, equally, not one over the other. This point implies that the cooperative deep-learning architecture proposed in this study could be modified as an expert system incorporating both the LSTM-News and GRU-News models to recommend the best possible forecasting whichever model can produce dynamically.
6. Conclusions and Further Work
By utilizing the cooperative deep-learning architecture proposed in this study, we have achieved the aims set for this study, i.e., a normalized comparison on the performances of the LSTM and GRU models for stock market forecasting under the same conditions and an objective assessment on the significance of incorporating the financial news sentiments with the stock features as the input in stock market forecasting. Further discussion and statistical analysis on the experiment results have led to the following conclusion—or suggestion or implication—under the same conditions with MAE as the measure,
- It is suggested that both LSTM and GRU are circumstantial in stock forecasting with only the stock market features as the input, not one better than the other;
- It is concluded with statistical confidence that the performance of LSTM for stock price forecasting can be significantly improved by incorporating the financial news sentiments with the stock features as the input;
- It is concluded with statistical confidence that the performance of GRU for stock price forecasting can be significantly improved by incorporating the financial news sentiments with the stock features as the input;
- It is suggested that both the LSTM-News and GRU-News models are able to produce better forecasting in stock price, equally, not one over the other. However, both models require more computation power or take longer time to complete the process;
- It is implied that the cooperative deep-learning architecture proposed in this study could be modified as an expert system incorporating both the LSTM-News and GRU-News models to recommend the best possible forecasting dynamically.
This work can be extended in some ways. First, we only considered the NEPSE-ADBL stock for the experiments over a certain period. An extended period with varieties of stock data and financial news from different countries should make our findings solider. Second, more effort should be made on how the financial news sentiments can be better rendered and represented to ensure a high level of relevance in stock market forecasting. In a broader sense, other media sentiments regarding particular stocks, in addition to the financial news, may be considered in future studies. Of course, it would be more useful if the cooperative deep-learning architecture proposed in this study can be modified as an expert system incorporating both the LSTM-News and GRU-News models to recommend the best possible forecasting dynamically from either or both in the future.
Author Contributions
Conceptualization, T.B.S., A.S. and W.G.; methodology, T.B.S.; software, A.S. and T.B.S.; validation, A.N., T.B.S. and W.G.; formal analysis, T.B.S. and A.S.; investigation, T.B.S.; writing—original draft preparation, T.B.S.; writing—review and editing, T.B.S., A.N. and W.G.; supervision, W.G. and A.N. All authors have read and agreed to the published version of the manuscript.
Funding
This research received no external funding.
Acknowledgments
The authors would like to thank Nepal Stock Exchange for making available data online through website.
Conflicts of Interest
The authors declare no conflict of interest.
References
- Malkiel, B.G.; Fama, E.F. Efficient capital markets: A review of theory and empirical work. J. Financ. 1970, 25, 383–417. [Google Scholar] [CrossRef]
- Fama, E.F. Random walks in stock market prices. Financ. Anal. J. 1995, 51, 75–80. [Google Scholar] [CrossRef]
- Pai, P.-F.; Lin, C.-S. A hybrid ARIMA and support vector machines model in stock price forecasting. Omega 2005, 33, 497–505. [Google Scholar] [CrossRef]
- Araújo, R.d.A. A quantum-inspired evolutionary hybrid intelligent approach for stock market prediction. Int. J. Intell. Comput. Cybern. 2010, 3, 24–54. [Google Scholar] [CrossRef]
- Vui, C.S.; Soon, G.K.; On, C.K.; Alfred, R.; Anthony, P. A review of stock market prediction with Artificial neural network (ANN). In Proceedings of the 2013 IEEE international conference on control system, computing and engineering, Mindeb, Malaysia, 29 November–1 December 2013; pp. 477–482. [Google Scholar]
- Shi, C.; Zhuang, X. A study concerning soft computing approaches for stock price forecasting. Axioms 2019, 8, 116. [Google Scholar] [CrossRef]
- Nti, I.K.; Adekoya, A.F.; Weyori, B.A. A systematic review of fundamental and technical analysis of stock market predictions. Artif. Intell. Rev. 2019, 53, 3007–3057. [Google Scholar] [CrossRef]
- Lv, D.; Huang, Z.; Li, M.; Xiang, Y. Selection of the optimal trading model for stock investment in different industries. PLoS ONE 2019, 14, e0212137. [Google Scholar] [CrossRef] [PubMed]
- Atsalakis, G.S.; Valavanis, K.P. Surveying stock market forecasting techniques–Part II: Soft computing methods. Expert Syst. Appl. 2009, 36, 5932–5941. [Google Scholar] [CrossRef]
- Seng, J.-L.; Yang, H.-F. The association between stock price volatility and financial news–a sentiment analysis approach. Kybernetes 2017, 46, 1341–1365. [Google Scholar] [CrossRef]
- Chen, K.; Zhou, Y.; Dai, F. A LSTM-based method for stock returns prediction: A case study of China stock market. In Proceedings of the 2015 IEEE International Conference on Big Data, Santa Clara, CA, USA, 29 October–1 November 2015; pp. 2823–2824. [Google Scholar]
- Althelaya, K.A.; El-Alfy, E.-S.M.; Mohammed, S. Evaluation of bidirectional LSTM for short-and long-term stock market prediction. In Proceedings of the 2018 9th international conference on information and communication systems (ICICS), Irbid, Jordan, 3–5 April 2018; pp. 151–156. [Google Scholar]
- Jiawei, X.; Murata, T. Stock market trend prediction with sentiment analysis based on LSTM neural network. In Proceedings of the International Multi-Conference of Engineers and Computer Scientists (IMECS), Hong Kong, China, 13–15 March 2019; pp. 13–15. [Google Scholar]
- Samarawickrama, A.; Fernando, T. A recurrent neural network approach in predicting daily stock prices an application to the Sri Lankan stock market. In Proceedings of the 2017 IEEE International Conference on Industrial and Information Systems (ICIIS), Peradeniya, Sri Lanka, 15–16 December 2017; pp. 1–6. [Google Scholar]
- Li, J.; Bu, H.; Wu, J. Sentiment-aware stock market prediction: A deep learning method. In Proceedings of the 2017 International Conference on Service Systems and Service Management, Dalian, China, 16–18 June 2017; pp. 1–6. [Google Scholar]
- Shen, G.; Tan, Q.; Zhang, H.; Zeng, P.; Xu, J. Deep learning with gated recurrent unit networks for financial sequence predictions. Procedia Comput. Sci. 2018, 131, 895–903. [Google Scholar] [CrossRef]
- Rahman, M.O.; Hossain, M.S.; Junaid, T.-S.; Forhad, M.S.A.; Hossen, M.K. Predicting prices of stock market using gated recurrent units (GRUs) neural networks. Int. J. Comput. Sci. Netw. Secur. 2019, 19, 213–222. [Google Scholar]
- Saud, A.S.; Shakya, S. Analysis of look back period for stock price prediction with RNN variants: A case study on banking sector of NEPSE. Procedia Comput. Sci. 2020, 167, 788–798. [Google Scholar] [CrossRef]
- Dang, M.L.; Sadeghi-Niaraki, A.; Huynh, H.D.; Min, K.; Moon, H. Deep learning approach for short-term stock trends prediction based on two-stream gated recurrent unit network. IEEE Access 2018, 6, 55392–55404. [Google Scholar]
- Li, X.; Wu, P.; Wang, W. Incorporating stock prices and news sentiments for stock market prediction: A case of Hong Kong. Inf. Process. Manag. 2020, 57, 102212. [Google Scholar] [CrossRef]
- Cho, K.; van Merrienboer, B.; Gulcehre, C.; Bahdanau, D.; Fethi, B.; Holger, S.; Bengio, Y. Learning phrase representations using RNN encoder–decoder for statistical machine translation. arXiv 2014, arXiv:1406.1078. [Google Scholar]
- Dutta, A.; Kumar, S.; Basu, M. A gated recurrent unit approach to bitcoin price prediction. J. Risk Financ. Manag. 2020, 13, 23. [Google Scholar] [CrossRef]
- Chaithra, V. Hybrid approach: Naive Bayes and sentiment VADER for analyzing sentiment of mobile unboxing video comments. Int. J. Electr. Comput. Eng. 2019, 5, 4452–4459. [Google Scholar]
- Hutto, C.J.; Gilbert, E. Vader: A parsimonious rule-based model for sentiment analysis of social media text. In Proceedings of the 8th International AAAI Conference on Weblogs and Social Media, Ann Arbor, MI, USA, 1–4 June 2014. [Google Scholar]
- Jayalakshmi, T.; Santhakumaran, A. Statistical normalization and back propagation for classification. Int. J. Comput. Theory Eng. 2011, 3, 1793–8201. [Google Scholar]
- Diebold, F.X.; Mariano, R.S. Comparing predictive accuracy. J. Bus. Econ. Stat. 2002, 20, 134–144. [Google Scholar] [CrossRef]
© 2020 by the authors. Licensee MDPI, Basel, Switzerland. This article is an open access article distributed under the terms and conditions of the Creative Commons Attribution (CC BY) license (http://creativecommons.org/licenses/by/4.0/).