Article

Longer-Term Forecasting of Excess Stock Returns—The Five-Year Case

1
Faculty of Actuarial Science and Insurance, Cass Business School, City, University of London, 106 Bunhill Row, London EC1Y 8TZ, UK
2
Department of Economics, University of Graz, Universitätsstraße 15/F4, 8010 Graz, Austria
*
Author to whom correspondence should be addressed.
Mathematics 2020, 8(6), 927; https://doi.org/10.3390/math8060927
Submission received: 20 May 2020 / Revised: 29 May 2020 / Accepted: 1 June 2020 / Published: 5 June 2020

Abstract

:
Long-term return expectations or predictions play an important role in planning purposes and guidance of long-term investors. Five-year stock returns are less volatile around their geometric mean than returns of higher frequency, such as one-year returns. One would, therefore, expect models using the latter to better reduce the noise and beat the simple historical mean than models based on the former. However, this paper shows that the general tendency is surprisingly the opposite: long-term forecasts over five years have a similar or even better predictive power when compared to the one-year case. We consider a long list of economic predictors and benchmarks relevant for the long-term investor. Our predictive approach consists of adopting and implementing a fully nonparametric smoother with the covariates and the smoothing parameters chosen by cross-validation. We consistently find that long-term forecasting performs well and recommend drawing more attention to it when designing investment strategies for long-term investors. Furthermore, our preferred predictive model did stand the test of Covid-19 providing a relatively optimistic outlook in March 2020 when uncertainty was all around us with lockdown and facing an unknown new pandemic.

1. Introduction

In recent years, investment planners and expert forecasters recognize the importance of the horizon when long-term predictions of (excess) stock returns are constructed. It is well-known in the financial literature that it is difficult to provide better forecasts than the simple historical long-term mean. There are also regular discussions in academic as well as practitioner circles on whether it is possible at all. This paper follows and adds to the work and insight of Lioui and Poncet [1] or Møller and Rangvid [2] which provide evidence that it is indeed possible to predict better than the trivial long-term mean when a careful validation approach is applied based on reasonable long-term economic drivers of the financial market to predict. It is also well-recognized, of course, that the longer the horizon, the less noise will disturb the prediction. Therefore, one would expect that it becomes more and more difficult to beat the long-term mean when the horizon is increased, simply because the noise involved in the long term is so low that it seems to be difficult to lower it even further through predictive modeling. In this paper, we find that long-term forecasts counter-intuitively improve as much as, or sometimes even more, than the simple one-year long-term mean forecast. We show this concretely via a comparison between the five-year and the one-year case. The extraordinary and surprisingly good results we get from the five-year prediction approach should lead to reconsiderations when deciding on the horizon to use in the design of investment strategies for long-term investors.
The linear regression model is the classical benchmark in this predictive modeling context. However, there is some evidence documented in the literature that stock return predictability is much stronger when the functional form of the relationship between stock returns and predictive variables is allowed to be nonlinear [3,4,5]. Along those lines, we adopt and implement the fully nonparametric local-linear smoothing technique in combination with a leave-k-out cross-validation. The linear function can be estimated through the local-linear smoother without any bias and is thus automatically embedded in our approach. We extent the single- and full-benchmarking of Kyriakou et al. [6] to the five-year horizon, since a careful imposition of structure in the statistical modeling process has shown to be promising in previous work [7,8,9]. Our preferred predictive model gives an optimistic outlook, even though we are at the beginning of a worldwide economic crisis caused by the Covid-19 pandemic. This surprising optimistic outlook was indeed in line with the performance of the stock market from March till June 2020.
The remainder of this paper is organized as follows. In Section 2, we present our framework for nonlinear predictive long-term regressions. We define the underlying financial model, describe the local-linear smoother with its theoretical properties, and present our validation criterion for the model and smoothing parameter selection. In Section 3, we provide the details of our dataset and a short descriptive analysis. Subsequently, we illustrate our empirical findings from two different validated scenarios: (i) a single benchmarking approach where only the dependent variable is measured in excess of the benchmark; and (ii) the case where both the independent and dependent variables are adjusted accordingly to the benchmark (full-benchmarking approach). Finally, we comment on real-income pension prediction and give one-year-ahead real-time predictions. Section 4 summarizes the key points of our analysis and concludes the paper.

2. A Method for Long-Term Prediction

The focus of our analysis lies on nonlinear predictive relationships between stock returns over the next T years in excess of a reference rate (or benchmark) and a set of explanatory variables. We aim to investigate different benchmark models and their predictability over horizons of one year and five years. We consider the four different benchmarks proposed in Kyriakou et al. [6]: the short-term interest rate, the long-term interest rate, the earnings-by-price ratio, and the inflation rate.

2.1. The One-Year Case

We investigate stock returns S t = ( P t + D t ) / P t 1 , where D t denotes the (nominal) dividends paid during year t and P t the (nominal) stock price at the end of year t, in excess (log-scale) of a given benchmark B t 1 ( A ) :
Y t ( A ) = ln S t B t 1 ( A ) ,
where A { R , L , E , C } with, respectively,
B t ( R ) = 1 + R t 100 , B t ( L ) = 1 + L t 100 , B t ( E ) = 1 + E t P t , B t ( C ) = C P I t C P I t 1 ,
R t is the short-term interest rate, L t the long-term interest rate, E t the earnings accruing to the index in year t, and C P I t the consumer price index for year t. The predictive nonparametric regression model for the one-year horizon is then given by
Y t ( A ) = m ( X t 1 ) + ξ t ,
where
m ( x ) = E ( Y ( A ) | X = x ) , x R q ,
is an unknown function which we want to estimate with the local-linear smoother and ξ t is an error term. The sequence of error terms in Equation (3) is assumed to form a martingale difference process, consisting of serially uncorrelated zero-mean random variables, given the past, of an unknown conditionally heteroscedastic form σ ( x ) .
Our aim is to predict the excess stock returns Y t ( A ) using (combinations of) popular time-lagged predictive variables X t 1 R q including the: (i) dividend-by-price ratio d t 1 = D t 1 / P t 1 ; (ii) earnings-by-price ratio e t 1 = E t 1 / P t 1 ; (iii) short-term interest rate r t 1 = R t 1 / 100 ; (iv) long-term interest rate l t 1 = L t 1 / 100 ; (v) inflation π t 1 = ( C P I t 1 C P I t 2 ) / C P I t 2 ; (vi) term spread s t 1 = l t 1 r t 1 ; and (vii) excess stock return Y t 1 ( A ) .

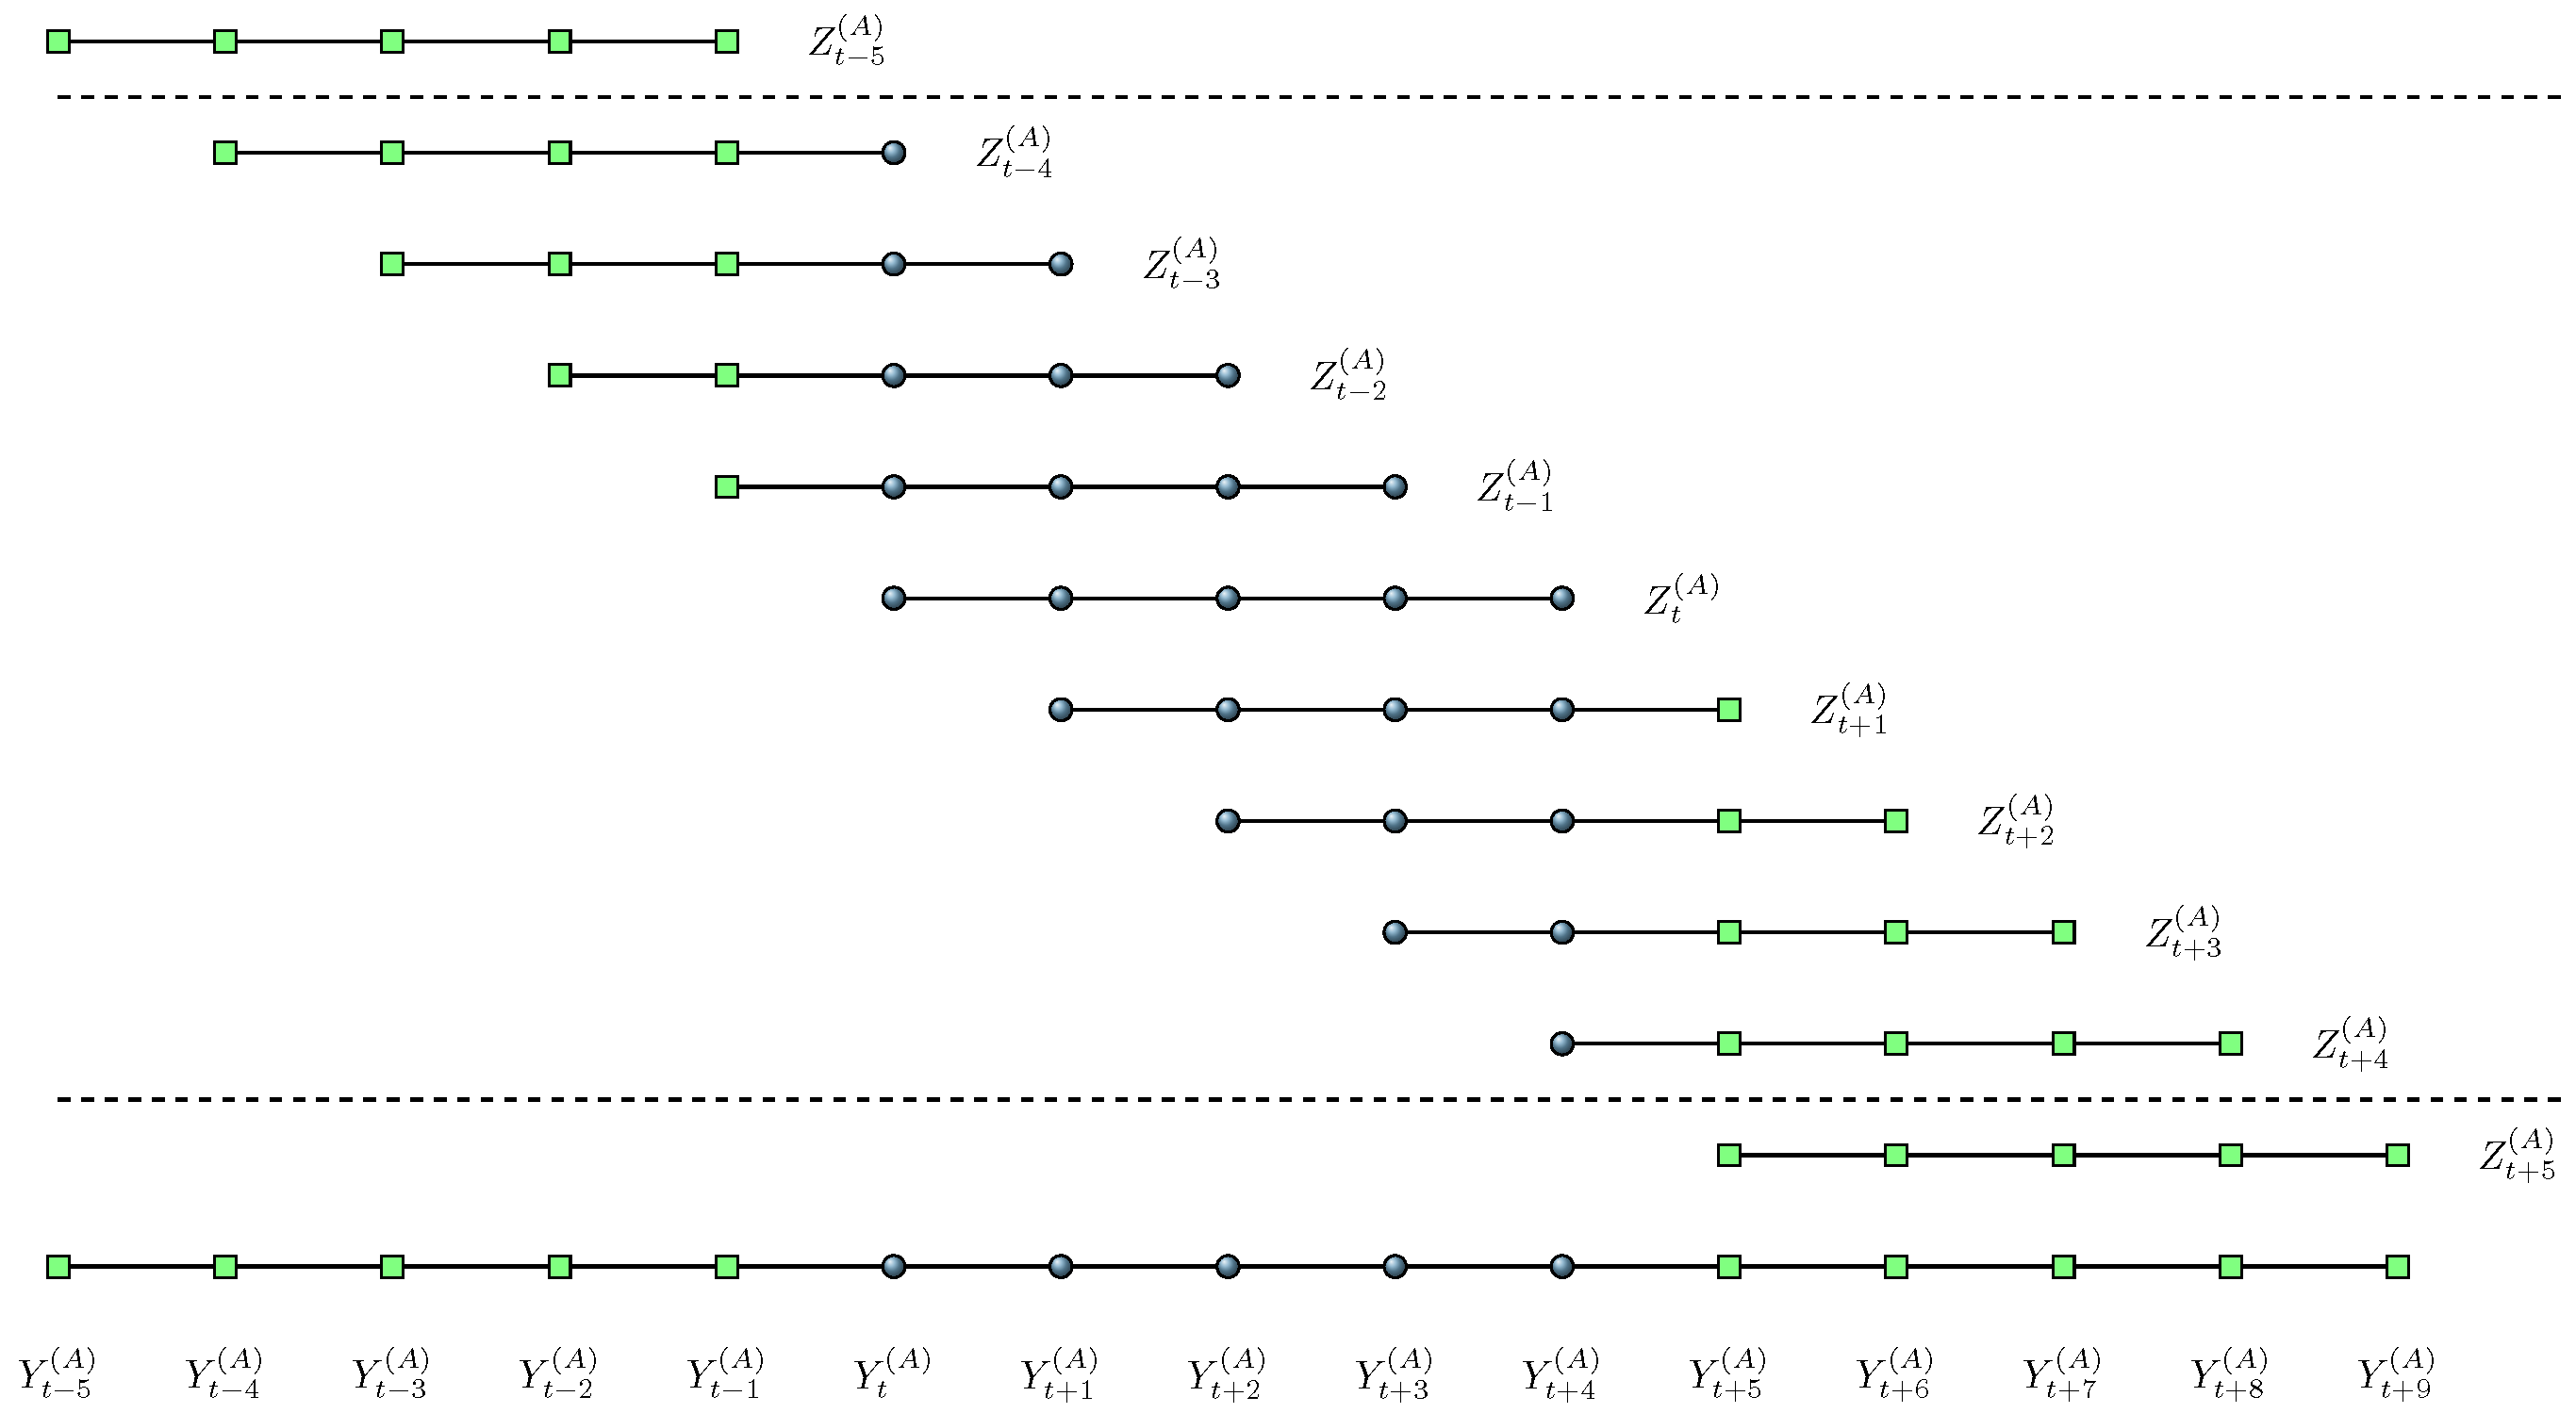
2.2. The T-year Case

Longer horizons are of fundamental interest to long-term investors, such as pension funds, insurance companies, other institutional investors, or market participants saving for a distant pay-off. Long-term investors are in general willing to take on more risk for higher rewards. Note that the risk is taken usually increases with the investment horizon. However, Rapach and Zhou [10] report that longer horizons also tend to produce better estimates than shorter horizons. Munk and Rangvid [11] indicates that major investors today use longer horizons (up to ten years) to stabilize and improve future predictions.
In our paper, we concentrate on the five-year view as the first compromise for a comparison between a longer horizon and the shorter one-year horizon. The choice of the five-year horizon is arbitrary and is intended to illustrate the potential of our approach. Any other combination of short- and long-term horizons could be considered. However, it seems that shorter horizons based on monthly, weekly, daily, or even intra-day data do not provide good information on the pension savers future income. Therefore, these types of short-term predictions, also known as investment robots, are not suitable when the (maximum) risk level of the pensioner is defined. More in detail, for longer horizons T we consider the sum of annual continuously compounded returns:
Z t ( A ) = i = 0 T 1 Y t + i ( A ) .
Note that the returns Z t ( A ) are overlapping, which requires a careful econometric modelling. Assume for illustration a linear relationship in Equation (3) between Y t ( A ) and X t 1 , as well as some (linear) persistence of the forecasting variable (treating the variables as deviations from their means):
Y t ( A ) = β X t 1 + ξ t and X t = γ X t 1 + η t ,
with ξ t as in Equation (3), η t being white noise, and slope parameters β and γ . The T-year regression problem that is implied by this pair of one-year regressions is now
Z t ( A ) = Y t ( A ) + + Y t + T 1 ( A ) = ( β X t 1 + ξ t ) + + ( β X t + T 2 + ξ t + T 1 )
= β i = 0 T 1 γ i X t 1 + β i = 0 T 1 j = 0 T 1 i γ j η t + i + i = 0 T 1 ξ t + i = ϕ X t 1 + ν t ,
that is, the excess stock return for year t over the next T years can be decomposed in two parts: a predictive part depending on the variable X t 1 and an unpredictable error term ν t . To avoid functional misspecification due to our simplistic assumption, we allow for nonlinearity and set up our predictive nonparametric regression model in the same fashion as in Equation (3)
Z t ( A ) = m ( X t 1 ) + ν t ,
where
m ( x ) = E ( Z t ( A ) | X = x ) , x R q ,
is again an unknown smooth function. The important difference between the models (3) and (9) is now that ξ t is a martingale difference process but ν t will be serially correlated by construction. The predictive variables under consideration collected in the q-dimensional vector X include again the dividend-by-price ratio d, earnings-by-price ratio e, short-term interest rate r, long-term interest rate l, inflation π , term spread s, and the one-year excess stock return Y ( A ) .

2.3. The Local-Linear Smoother for the T-Year Horizon

As mentioned before, the important difference between the one-year and the T-year case is the inherited serial correlation of the error terms ν t in Equation (9). It is well documented in the statistical literature that, in the presence of correlated errors, quite fundamental problems occur: (i) while the consistency result from Theorem 3 in Kyriakou et al. [6] still holds, the left-out information of the error dependency leads to less efficient estimators [12,13]; and (ii) the commonly applied automatic smoothing parameter selection procedures, like cross-validation or plug-in, break down [14,15]. The latter problem will be discussed in detail in the next section.
More efficient estimators are proposed in the literature. For example, Xiao et al. [12] use a pre-whitening transformation of the dependent variable that has to be estimated from the data. More in detail, the residual process ν t is assumed to be stationary, zero-mean with variance σ ν 2 , and has an invertible linear process representation
ν t : = i = 0 c i ε t i ,
where ε t are i.i.d. with zero mean and variance σ ε 2 . Define c ( L ) = i = 0 c i L i with the usual lag operator L. By inverting c ( L ) one gets an autoregressive representation of ν t of infinite order:
c ( L ) 1 = a ( L ) = a 0 i = 1 a i L i
and thus a ( L ) ν t = ε t . The transformed regression problem (9) is then
a ( L ) Z t ( A ) = a ( L ) m ( X t 1 ) + ε t , or
Z ˜ t ( A ) : = Z t ( A ) i = 1 a i Z t i ( A ) m ( X t 1 i ) = m ( X t 1 ) + ε t
with an uncorrelated error term ε t . In practice, Z ˜ t ( A ) is replaced by an approximation based on estimates of the coefficients { a i } and a truncation of the infinite sum. Other contributions which provide more efficient local-polynomial estimators under similar settings can be found in Su and Ullah [13], Linton and Mammen [16], or more recently in Geller and Neumann [17] (and citations therein).
We do not apply such techniques in our paper for several reasons. First, additional parameters { a i } have to be estimated and the infinite sum must be truncated at a meaningful value in Equation (14), or the residual process has to be adequately modeled by some parametric ARMA process or even nonparametrically, where the appropriate lag-length has to be specified. Second, most examples and simulations are given in the literature are one-dimensional. However, we adapt our local-linear smoother in a multidimensional problem and it is not clear what the efficiency gain would be in our scarce data environment. Finally, in a recent study, Scholz et al. [8] show that, in a long-term set-up with annual data, the reduction of the prediction bias is crucial as it contributes squared to the prediction mean squared error. Our approach of imposing economic structure by using explanatory variables that are transformed according to the chosen benchmark (full benchmarking) aims in a similar direction.
Thus, we think that the more severe problem caused by autocorrelation is the misleading smoothing parameter selection for methods like cross-validation or plug-in. These will be discussed in detail in the next section.

2.4. A Principle of Validation for Model Selection and Smoothing Parameter Choice

For our nonparametric estimation technique, we require an adequate measure of the predictive power. Classical in-sample measures, such as the R 2 or adjusted R 2 , are not appropriate. Note further that in prediction, we are not interested in how well a model explains the variation inside the sample but, instead, in its out-of-sample performance. Therefore, we aim to estimate the prediction error directly.
We follow Nielsen and Sperlich [7] and use the validated R V 2 which is based on a leave-k-out cross-validation for both models as well as optimal bandwidth (smoothing parameter) selection. This method has been shown to be suitable also in a time series context. For example, Bergmeir et al. [15] show that, in the case of uncorrelated errors, cross-validation is preferred to out-of-sample evaluation where a section from the end of the series is withheld for evaluation. For the latter, only one evaluation on a test data set is possible, whereas cross-validation performs various evaluations. This property is beneficial, especially for small data sets such as ours applied in Section 3.
The validation criterion for one-year predictions is defined as
R V , 1 2 = 1 t ( Y t ( A ) m ^ t ) 2 t ( Y t ( A ) Y ¯ t ( A ) ) 2 ,
where leave-one-out estimators are used: m ^ t for the conditional mean function m from Equation (3) and Y ¯ t ( A ) for the unconditional (historical) mean of Y t ( A ) . For T-year predictions, we use a similar criterion, now based on Z t ( A ) instead of Y t ( A ) :
R V , T 2 = 1 t ( Z t ( A ) m ^ t ) 2 t ( Z t ( A ) Z ¯ t ( A ) ) 2 ,
where leave-k-out estimators are used: m ^ t for the conditional mean function m from Equation (9) and Z ¯ t ( A ) for the unconditional (historical) mean of Z t ( A ) . Both are computed by removing k observations around the tth time point. Here we use k = 2 T 1 due to the construction of the dependent variable over a horizon of T years, that is, for the five-year horizon the leave-nine-out estimator. As it is clear from the context whether we are in the one- or five-year case, we use in the following for both horizons the shorter notation R V 2 . Note that the R V 2 measures the predictive power of a given model compared to the cross-validated historical mean; a positive R V 2 implies that the predictor-based regression model (3) or (9) outperforms the corresponding historical average excess stock return over 1 or T years, respectively.
Cross-validation often requires the omission of more than one single data point and our five-year scenario is one such example. It can also happen that additional corrections are necessary when the omitted fraction of data is considerable [18]. In addition, De Brabanter et al. [14] show that automatic tuning parameter selection methods, such as cross-validation or plug-in, can fail when serial correlation arises (as in our longer-horizon application) and the structure of the error terms is ignored. Here, the problem is that for increasing correlations the chosen bandwidths become smaller, and the corresponding model fits become progressively more under-smoothed [19]. This reduces the bias of the predictor which contributes in a squared fashion to the prediction mean squared error—the numerator of the ratio in Equations (15) and (16). Consequently, the R V 2 also increases—not for the better fit but due to the ignored correlation structure. The consequence is a misleading decision on the bandwidth or model specification (the set of preferred covariates). To avoid such problems, Chu and Marron [20] propose the use of bimodal kernel functions which are known to remove the correlation structure very effectively. Nevertheless, the estimator m ^ suffers from increased mean squared error [14]. To overcome the problems mentioned, De Brabanter et al. [14] propose a correlation-corrected cross-validation which consists of two steps: (i) finding the amount of data k to be left out in the estimation process when a bimodal kernel function is used; and (ii) applying the actual choice of the smoothing parameter using leave-k-out cross-validation with a unimodal kernel function. As we know k in our set-up by construction, we can skip the first step. For example, remember that Z t ( A ) = Y t ( A ) + + Y t + 4 ( A ) in the five-year case. Now we have to exclude all Z s ( A ) that include any of Y t ( A ) , , Y t + 4 ( A ) . It is easy to see from Figure 1 that this amounts to a leave-nine-out set of Z t 4 ( A ) , , Z t + 4 ( A ) .

3. Empirical Results and Discussion

3.1. The Data Set

We applied our local-linear smoother to annual US stock-market data. This dataset was provided by Robert Shiller and is made available from http://www.econ.yale.edu/~shiller/data.htm. It includes, among other variables, long-term changes of the Standard and Poor’s (S&P) Composite Stock Price Index, consumer price index changes, and interest rate data from 1872 to 2019. This is an updated and revised version of (Shiller [21], Chapter 26), which provides a detailed description of the data.
Note that the extension of the risk-free rate series (based on the six-month commercial paper rate until 1997 and, afterward, on the six-month certificate of deposit rate, secondary market) was not possible as it was discontinued in 2013. Here, we followed the strategy of Welch and Goyal [22] and Mammen et al. [23] and replace this variable by an annual yield based on the six-month Treasury-bill rate, secondary market, from https://fred.stlouisfed.org/series/TB6MS. This new series was only available from 1958 to 2019. In the absence of information prior to 1958, we had to estimate it. To this end, we regressed the Treasury-bill rate on the risk-free rate from Shiller’s data for the overlapping period 1958 to 2013. Assuming a linear relationship and using an ordinary least squares regression, we obtained the estimated equation:
Treasury-bill rate = 0.0961 + 0.8648 × commercial paper rate ,
with an R 2 of 98.6%. Therefore, we instrumented the risk-free rate from 1872 to 1957 with the predicted regression equation. The correlation between the actual Treasury-bill rate and the predictions for the estimation period was 99.3%.

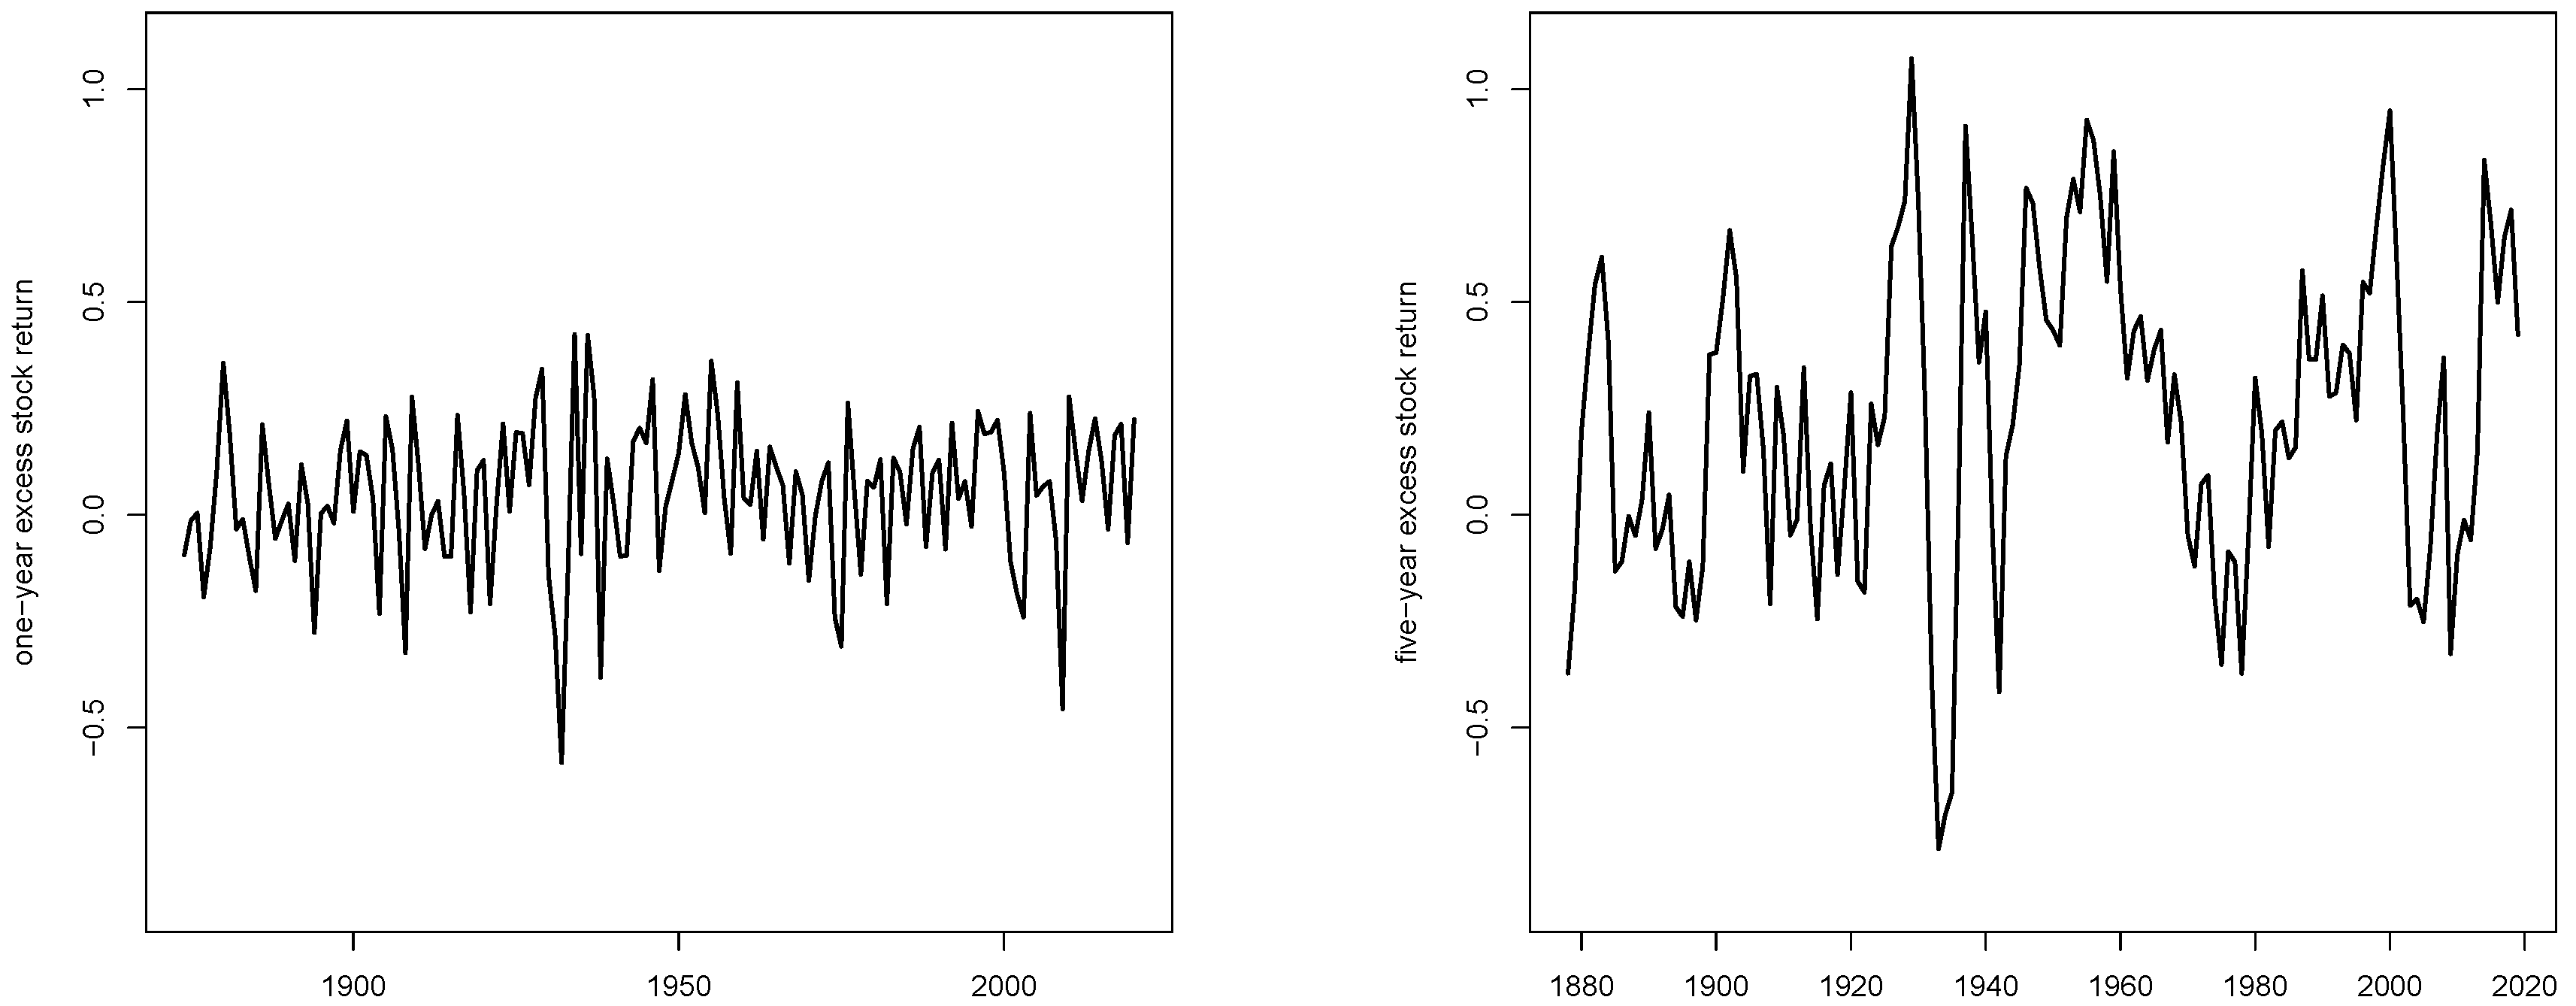
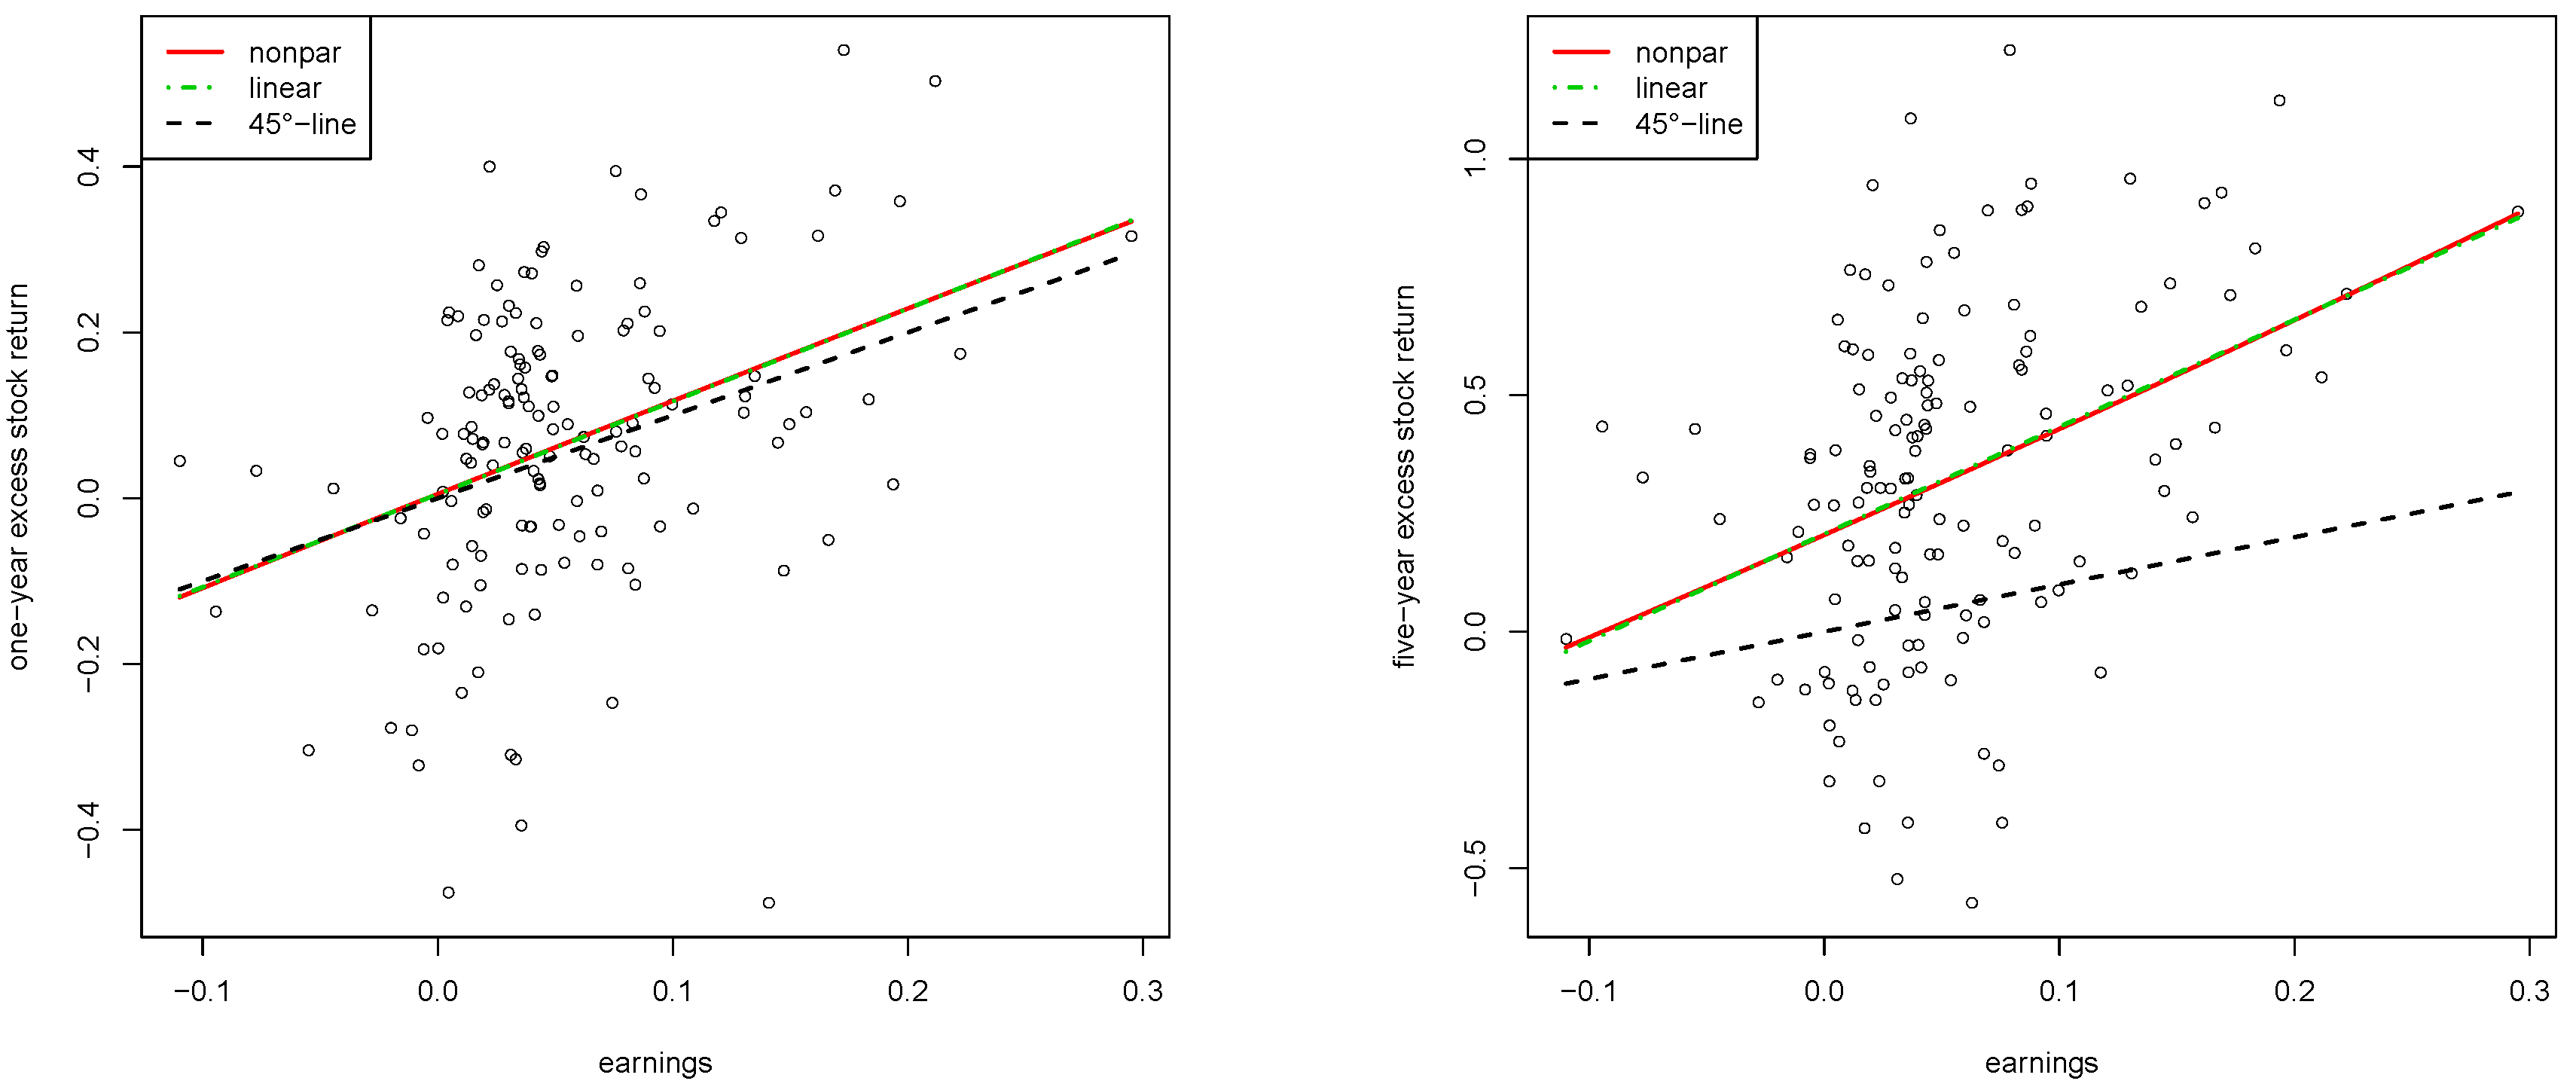
3.2. Descriptive Analysis

There is much research on the predictability of returns and a lot is known about the characteristics of short-horizon stock returns. For example, stylized facts about daily and monthly returns include excess kurtosis, distributions which are not normal, and volatility clustering [24]. However, less is known about distributions of long-horizon returns. However, such characteristics are of central interest to investors saving for distant pay-offs.
Figure 2 shows the time series of the one-year returns (left) and five-year returns (right), both in excess of the risk-free benchmark R, which are displayed on the same scale for the sake of comparison. The five-year series exhibits larger positive returns, which is not surprising as a longer period under risk should be paid-off with a higher risk premium. The autoregressive structure of the five-year returns can be easily seen in comparison to the assumed weak dependence of one-year returns.
Figure 3 shows histograms of the one-year returns (left) and five-year returns (right) together with a kernel density estimate (red) and a fitted normal distribution (green). One notes again that the distribution of the five-year returns is shifted to the right but has a higher volatility. A Jarque–Bera test of the hypothesis of normality does reject for one-year returns (p-value = 0.013 ) but does not reject for five-year returns (p-value = 0.522 ). Furthermore, the density estimate for the five-year returns indicates more a mixture of normals than a single normal distribution which represents some evidence of a possible structural break in the data-generating process.
Including structural changes in the modelling process could be beneficial, as shown in the literature especially for higher-frequency returns [25,26]. However, this comes with additional effort which is beyond the scope of our article and is left for future research. Several important points would have to be taken into consideration, for example: (i) it is not clear for which point in time one should incorporate a structural break in our annual data (the Great Recession, the Second World War, the Global Financial Crisis, the Bretton Woods agreement, etc.); (ii) a simple sample split would result in even smaller and not balanced data sets. From a statistical perspective, as we apply a fully nonparametric method, this would lead to mostly one-dimensional and potentially linear models. This way, we would lose the analysis of higher-dimensional models and nonlinear relationships between excess stock returns and their predictor variables.
This section is concluded with Table 1 which displays standard descriptive statistics for one-year and five-year returns as well as the available covariates. Both the one-year and five-year excess returns had a negative skewness, that is, the left tail of the distribution (large negative returns) was longer or fatter than the right tail (large positive returns). Note that this is more pronounced in the case of one-year rather than five-year returns. While one-year returns were leptokurtic (positive excess kurtosis of 0.68 ), five-year returns exhibited a small negative excess kurtosis of 0.37 .
Similar plots to those in Figure 2 and Figure 3 and information as in Table 1 for the other benchmarks are available upon request by the authors. In the next sections, we analyzed the predictability of one-year and five-year stock returns in excess of the different benchmarks.

3.3. The Single Benchmarking Approach

In this section, we considered a single benchmarking approach as in Kyriakou et al. [6] where only the variable S t was adjusted according to some benchmark B t 1 ( A ) , as shown in (1), while the independent variable(s) is (are) measured on the original nominal scale. The models (3) and (9) are estimated with a local-linear kernel smoother using the quartic kernel and the optimal bandwidth is chosen by cross-validation, that is, by maximizing the R V 2 given by (15) and (16). Moreover, it should be kept in mind that the nonparametric method can estimate linear functions without any bias, given that we apply a local-linear smoother. Thus, the linear model is automatically embedded in our approach. We study the empirical findings of R V 2 values based on different validated scenarios shown for the one-year horizon in Table 2 and the five-year horizon in Table 3. Note that the one-year predictions may differ from those originally reported in Kyriakou et al. [6] due the updated data set and the replacement of the commercial paper rate by the Treasury-bill rate; nevertheless, the models remain similarly ranked.
We found that in the case of the five-year returns, which was the focal point of this paper, the term spread s was, overall, the most powerful predictive variable for excess stock returns; this superior performance was also observed in the one-year case. More in detail, with the prediction constrained to using only one-dimensional covariates, the term spread is the best predictor for the one-year and five-year horizon under the short interest benchmark B ( R ) with, respectively, R V 2 = 9.7 % and 15.5 % , but this also does quite well in the one-year case under the long rate and earnings-by-price benchmarks, B ( L ) and B ( E ) , with R V 2 { 6.2 % , 7.5 % } (for B ( C ) the best is π with 10.3 % ). In the five-year case under B ( L ) and B ( E ) , the term spread s yields a high R V 2 { 8.0 % , 11.5 % } whereas under B ( C ) the dividend-by-price ratio d gains ground with R V 2 = 7.6 % .
In light of these remarks, we therefore, focused the spotlight on the relationship between the spread and the excess stock returns. We present in the top panel of Figure 4 the estimated functions m ^ (red solid line) for the one-year horizon (left) and the five-year horizon (right) under the single risk-free benchmark together with a corresponding linear model (dash-dotted green line), and a 45-degree line (dashed black line). Figure 4 shows thereby the three single covariates with the largest R V 2 ( T = 1 and T = 5 ): the term spread (9.7% and 15.5%), the short-term interest rate (3.0% and 7.8%), and the long-term interest rate (0.0% and 1.4%). Our findings for both horizons conformed to the fact that an increase in the spread corresponds to an increase in the excess stock return. While a positive spread corresponds to a positive return for the one-year case, a spread larger than 1 % gave, on average, a positive five-year return. This finding is in line with, for example, Resnick and Shoesmith [27] who find that the value of the yield spread holds important information about the probability of a bear stock market. Regarding our validation procedure, Figure 4 also confirms that our approach of correcting for autocorrelation in the five-year prediction problem was successful. The estimated functions are quite smooth indicating that the chosen bandwidth is not too small and that the resulting fit and validated R 2 are reasonable.
Back to our discussion of the results in Table 2 and Table 3, in broad terms, five-year predictability improved over one-year: 67 out of 112 models achieve a larger R V 2 , and we observed 64 (five-year) versus 52 (one-year) models with nonnegative R V 2 , that is, our proposed predictor-based regression model for the longer forecast horizon in this application surpassed the historical average excess return in the majority of cases. In addition, combining the term spread s with the dividend-by-price d results in uplifted predictability to 26.2 % ; this combination is, in fact, the best-performing one for 3 out of 4 benchmarks ( B ( R ) , B ( L ) , B ( C ) ). In particular, imposing an additional covariate to s results in one-year R V 2 in the range 6– 10 % under B ( R ) ; under other benchmarks, such as B ( L ) , the one-year R V 2 is in the range 3– 6.5 % (approx.); changing to the B ( E ) benchmark results in R V 2 in the range 4.5 7.5 % . Interestingly, for a five-year horizon, we observed a substantially improved predictive power with our cross-validated R V 2 ranking some two-dimensional better than one-dimensional models, in fact, more than for a one-year horizon: in particular, as possibly anticipated by the aforementioned performances of d and s, the two-dimensional covariate ( d , s ) boosts R V 2 to 26.2 % under B ( R ) , performs best with 21 % under B ( L ) , and comes second with 12 % under B ( E ) being beaten by ( Y ( E ) , s ) with 14.1 % .
In the one-year case, quite remarkable is the predictor π , either in itself or combined with covariates Y ( C ) , d , e , r , l , under the inflation benchmark B ( C ) leading to R V 2 in the range 9.5 15.4 % . In addition, when put together with the term spread, the resulting combination ( π , s ) under B ( C ) is the clear winner reaching up to R V 2 = 15.4 % . This is probably good news in an actuarial context where the inflation benchmark can be seen as an important one in pension product applications. In the five-year case, π still does quite well in the range 6.8 10.8 % (with an exception of 0.9 % for ( r , π ) ) and remains generally the best predictor under B ( C ) , nevertheless, it is no longer the globally best one.

3.4. The Full Benchmarking Approach

The next step now is to analyze whether transforming the explanatory variables can improve predictions. Recall that fully nonparametric models suffer in general by the curse of dimensionality, as in our framework where we confront sparsely distributed annual observations in higher dimensions. Importing more structure in the estimation process can help reduce or circumvent such problems.
Here, we extend the study in Section 3.3 using economic structure in the sense that we consider adjusting both the independent and dependent variables according to the same benchmark. To this end, in our full (double) benchmarking approach, the prediction problems are reformulated as
Y t ( A ) = m ( X t 1 ( A ) ) + ξ t ,
Z t ( A ) = m ( X t 1 ( A ) ) + ν t ,
where we use transformed predictive variables
X t 1 ( A ) = 1 + X t 1 B t 1 ( A ) , X { d , e , r , l , π } s t 1 B t 1 ( A ) = l t 1 r t 1 B t 1 ( A ) Y t 1 ( A ) , A { R , L , E , C } .
This approach can be interpreted as a way of reducing dimensionality of the estimation procedure as X t 1 ( A ) encompasses an additional predictive variable.
Results of this empirical study are presented for the one-year horizon in Table 4 and for the five-year horizon in Table 5. In addition, Figure 5 presents the three single covariates with the largest R V 2 ( T = 1 and T = 5 ) for the double inflation benchmark case: the earnings-by-price ratio (12.2% and 12.4%), the dividend-by-price ratio (10.4% and 10.9%), and the long-term interest rate (10.5% and 8.7%).
We find that, in the majority of cases, the full outruns the single benchmarking approach, even more when we consider a longer horizon, and the number of models with nonnegative R V 2 (that is, cases of beating the historical average excess return) increases: 68 out of 82 models (full benchmarking, five-year); 55 out of 82 (full benchmarking, one-year); 64 out of 112 (single benchmarking, five-year); and 52 out of 112 (single benchmarking, one-year).
The pair ( d ( R ) , s ( R ) ) in the full benchmarking approach for a five-year horizon yields R V 2 = 21.9 % against 26.2 % in the single benchmarking under B ( R ) , whereas ( e ( C ) , s ( C ) ) in the full benchmarking approach for a one-year horizon yields R V 2 = 17.8 % against 15.4 % using the predictor ( π , s ) in the single benchmarking under B ( C ) . It, therefore, seems that s is an important predictor, whose power is mostly unveiled when combining with another predictor depending on the benchmark choice and the forecast horizon. In addition, although under B ( R ) and B ( L ) , full benchmarking does not improve predictability, it does under B ( E ) and, especially, B ( C ) which is important if we aim to identify a likely common well-performing benchmark and predictor, that is, ( e ( C ) , s ( C ) ) , independently of the horizon length. For B ( C ) full benchmarking, R V 2 lies in the range 14.7 10.1 % (five-year) and 17.8 11.5 % (one-year), which are both an improvement from B ( C ) single benchmarking yielding R V 2 in 13.7 0.9 % (five-year) and 15.4 9.5 % (one-year), that is, a maximum width reduction by a factor of almost 3 for the five-year horizon.
Overall, we conclude that the term spread is a good predictor; if we aim to homogenize our choice of predictor and benchmark with respect to the horizon length, then the earnings-by-price and the term spread under the inflation benchmark would be an ideal compromise, even if not the winning one. This is welcoming, as, for example, in pension research or other long-term saving strategies, it is sensible to look at real value and employ such a model with all returns and covariates net-of-inflation.

3.5. Real-Income Long-Term Pension Prediction

In long-term pension planning, real-income protection is often an important aspect [28,29,30]. When optimizing investment asset allocation for the long term, one therefore needs a good econometric model in real terms. Based on the research in this paper and in Kyriakou et al. [6], we are able to conclude that, in the natural double benchmark setting for real-income econometrics, it looks like earnings divided by price is the natural covariate to consider. In Table 2 of Kyriakou et al. [6] and in Table 4 of this paper, it is concluded that earnings divided by price is the best single covariate to use in the double inflation benchmark case and, in this paper’s Table 5, this is also the case in the five-year view. On balance, we therefore conclude that the intuitively appealing earnings divided by price is a good long-term predictor for real-income forecasting. In the one-year view of Kyriakou et al. [6], the nonparametric smoother estimated for the relationship between earnings divided by price and return in the inflation double benchmarking case has the exact functional form of a simple line. So, even though we consider a nonparametric estimator that can pick any functional form, the resulting functional form is a simple line. This provides us with a strong argument for using the simple line in this case. The functional form of a line has been picked via a validation procedure against all functional forms. The linear expression is
Real one-year stock return = 0.004875 + 1.119 × real earnings-by-price .
Notice that a very good long-term predictor of real income can, therefore, be expressed as a simple linear relationship, where the expected return adds first 12% to the earnings divided by price and then another 0.5%. This is a very simple relationship that is easy for long-term investors to remember. Similarly to the one-year view, our validation procedure exactly picks a line against all other functional alternatives in the five-year view. The linear form for the five-year view is
Real five-year stock return = 0.2068 + 2.264 × real earnings-by-price .
The top panel of Figure 5 shows the estimated nonparametric function m ^ (red solid line) for the one-year horizon (left) and five-year horizon (right) under the double inflation benchmark for the earnings-by-price covariate together with the corresponding linear model (dash-dotted green line), and a 45-degree line (dashed black line). Note that the linear relationship discovered for the earnings-by-price predictor must not hold true for other covariates or their combinations. In those cases, the full benefit of our approach comes into its own. For example, the bottom panel of Figure 5 clearly shows nonlinearities for the five-year case when the long-term interest rate is considered. For a suitable statistical smoothing-based test (nonparametric versus linear model), see, for example, the test based on wild bootstrap proposed in Scholz et al. [8] or the discussion in the survey of González-Manteiga and Crujeiras [31].

3.6. One-Year ahead Real-Time Predictions

The four benchmarks proposed in this paper are useful in different situations. While in Section 3.5 we focused on real-income long-term predictions based on models using the inflation-double benchmark, we now want to explore the development of ‘pure’ stock returns S (without a benchmark) in the near future. Kyriakou et al. [6] found the model using the earnings benchmark with the term spread as the covariate, that is, Y ^ ( E ) = m ^ ( s ) , to perform best in terms of R V 2 when the predicted values are back-transformed and validated on stock returns S. We use this simple model to illustrate the usefulness of the earnings benchmark. For this purpose, we estimate this model over the full sample as before and predict the stock returns in excess of earnings using the current spread (in the period September 2018–March 2020). Finally, we back-transform those predictions to get a one-year ahead forecast for nominal stock returns S ^ t , n o m from
ln S ^ t , n o m = Y ^ t ( A ) + B t 1 ( A ) .
As a by-product, we also calculate a prediction for the real-stock return, S ^ t , r e a l = S ^ t , n o m π t , and the risk premium, R P ^ t = S ^ t , n o m R t , of holding stocks versus a risk-free asset. Table 6 shows the results of this forecasting exercise. The considered forecasting period is of interest for two specific features: (i) the term spread is U-shaped, that is, it reduces, gets negative (an inverted yield curve in August and September 2019), and finally increases again; and (ii) the external shock to the market caused by the Covid-19 pandemic leads to large negative returns starting in March 2020.
We find (i) that for the (slightly) negative spread the predicted stock return in excess of earnings is also negative. Nevertheless, the predicted nominal stock return is positive (around 4.1% and mainly driven by the earnings of around 4.5%) as well as the real return (around 2.4%) and the risk-premium (around 2.3%). Note (ii) that the one-year ahead predictions in March 2020 are not frightening even though we are at the beginning of a worldwide economic crisis and recession. They seem to reflect optimistic market expectations. Of course, we cannot incorporate external shocks in our model but the key variables show comforting figures as both, the term spread and the earnings-by-price, are at their second-highest values in the last 20 months. Thus, our model predicts that compared to the month before the crises started nominal one-year stock returns increase by 2.3%, real returns increase by 3.1%, and the risk-premium increases by 3.4%. Low inflation, low short-term interest rates (the latter being almost zero), and increasing prices will bring back the market to past performance such that this prediction was in line with what happened.

4. Conclusions and Outlook

In this paper, we extend the original working framework of Kyriakou et al. [6] to forecasting stock returns from a one-year to a five-year horizon in excess of different benchmarks, including the short-term rate, long-term rate, earnings-by-price ratio and inflation. We use predictors such as the dividend-by-price ratio, earnings-by-price ratio, short interest rate, long interest rate, term spread, inflation, as well as the lagged excess stock return, in one- and two-dimensional settings, with the returns benchmarked or also the covariates used to predict them.
We conclude that five-year returns can be forecasted via our economic variables. The improvement in overall variability compared to predicting a simple mean—measured via the R V 2 —is good and comparable to the overall forecasting improvement we have seen earlier in Kyriakou et al. [6] for the one-year view.
We find that for both one-year and five-year returns, the term spread is, overall, the most powerful predictive variable for excess stock returns. Combining this with the dividend-by-price in the five-year case boosts the predictive power to a maximum. In the one-year case, the inflation predictor is quite remarkable under the inflation benchmark either in itself, or combined with other covariates such as the term spread to achieve a best-performing pair for the given horizon. Notice that earnings seem to be the best overall predictor when working net-of-inflation. The double benchmarking approach has earnings as the best individual predictor net with the inflation benchmark, where it is almost as strong a predictor as when using earnings and spread combined. Based on the results of this paper and also of Kyriakou et al. [6], we therefore, conclude that modeling earnings-by-price is a good and relatively simple starting point when constructing forecasting models for real-value pension prognoses.
Finally, a good compromise when promoting only one set of predictors for both the one and the five-year view would be earnings-by-price and the term spread. It seems that the earnings-by-price tends to define the overall level of the return, while the term spread provides information on short-term market corrections. This is why the earnings-by-price benchmark with the term spread as a covariate was the superior combination among all considered opportunities when all forecasts were back-calculated to nominal returns (see, Kyriakou et al. [6]). The different role played by earning-by-price and the term spread may be explaining why they work so well on aggregate. So, the overall conclusions can be (i) that one should work with these two predictors when forecasting long-term stock returns and (ii) that the good results of our approach should lead to reconsiderations, along some of the comments of Lioui and Poncet [1], when deciding on the horizon of the investment strategy for the long-term investor.
Future research might work on econometric modeling that can combine short-term and long-term predictions. One could, for example, imagine an econometric model having the same predictive mean and variance one year ahead provided by the optimal one-year forecast, while simultaneously having the same predictive mean and variance five years ahead as provided by the optimal five-year forecast. Current efforts are being undertaken in that direction by the research team behind this paper.

Author Contributions

Conceptualization, I.K., P.M., J.P.N. and M.S.; Formal analysis, I.K., P.M., J.P.N. and M.S.; Funding acquisition, J.P.N.; Investigation, P.M.; Methodology, M.S.; Software, M.S.; Supervision, J.P.N.; Writing–original draft, I.K., P.M., J.P.N. and M.S. All authors contributed equally to this work. All authors have read and agreed to the published version of the manuscript.

Funding

The authors thank: (i) the Institute and Faculty of Actuaries in the UK for funding this research through the grant “Minimizing Longevity and Investment Risk while Optimizing Future Pension Plans”, and (ii) the University of Graz for the Open Access Funding.

Conflicts of Interest

The authors declare no conflict of interest.

References

  1. Lioui, A.; Poncet, P. Long horizon predictability: An asset allocation perspective. Eur. J. Oper. Res. 2019, 278, 961–975. [Google Scholar] [CrossRef]
  2. Møller, S.; Rangvid, J. End-of-the-Year Economic Growth and Time-varying Expected Returns. J. Financ. Econ. 2015, 115, 136–154. [Google Scholar] [CrossRef] [Green Version]
  3. Lettau, M.; Van Nieuwerburgh, S. Reconciling the return predictability evidence. Rev. Financ. Stud. 2008, 21, 1601–1652. [Google Scholar] [CrossRef]
  4. Chen, Q.; Hong, Y. Predictability of Equity Returns over Different Time Horizons: A Nonparametric Approach; Working Paper; Department of Economics, Cornell University: Ithaca, NY, USA, 2009. [Google Scholar]
  5. Cheng, T.; Gao, J.; Linton, O. Nonparametric Predictive Regressions for Stock Return Predictions; Cambridge Working Papers in Economics; 1932; Faculty of Economics, University of Cambridge: Cambridge, UK, 2019. [Google Scholar]
  6. Kyriakou, I.; Mousavi, P.; Nielsen, J.P.; Scholz, M. Forecasting Benchmarks of Long-Term Stock Returns via Machine Learning. Ann. Oper. Res. 2019. [Google Scholar] [CrossRef] [Green Version]
  7. Nielsen, J.; Sperlich, S. Prediction of stock returns: A new way to look at it. ASTIN Bull. 2003, 33, 399–417. [Google Scholar] [CrossRef] [Green Version]
  8. Scholz, M.; Nielsen, J.; Sperlich, S. Nonparametric prediction of stock returns based on yearly data: The long-term view. Insur. Math. Econ. 2015, 65, 143–155. [Google Scholar] [CrossRef]
  9. Scholz, M.; Sperlich, S.; Nielsen, J. Nonparametric long term prediction of stock returns with generated bond yields. Insur. Math. Econ. 2016, 69, 82–96. [Google Scholar] [CrossRef] [Green Version]
  10. Rapach, D.; Zhou, G. Forecasting Stock Returns. In Handbook of Economic Forecasting, 2A ed.; Elliott, G., Timmerman, A., Eds.; Elsevier: Amsterdam, The Netherlands, 2013; pp. 328–383. [Google Scholar]
  11. Munk, C.; Rangvid, J. New Assumptions of a pension forecast model: Background, level and consequences for individuals forecasted pension. Finans/Invest 2018, 6, 6–14. [Google Scholar]
  12. Xiao, Z.; Linton, O.B.; Carroll, R.J.; Mammen, E. More efficient local polynomial estimation in nonparametric regression with autocorrelated errors. J. Am. Stat. Assoc. 2003, 98, 980–992. [Google Scholar] [CrossRef]
  13. Su, L.; Ullah, A. More efficient estimation in nonparametric regression with nonparametric autocorrelated errors. Econ. Theory 2006, 22, 98–126. [Google Scholar] [CrossRef]
  14. De Brabanter, K.; De Brabanter, J.; Suykens, J.; De Moor, B. Kernel regression in the presence of correlated errors. J. Mach. Learn. Res. 2011, 12, 1955–1976. [Google Scholar]
  15. Bergmeir, C.; Hyndman, R.J.; Koo, B. A note on the validity of cross-validation for evaluating autoregressive time series predictions. Comput. Stat. Data Anal. 2018, 120, 70–83. [Google Scholar] [CrossRef]
  16. Linton, O.B.; Mammen, E. Nonparametric transformation to white noise. J. Econ. 2008, 142, 241–264. [Google Scholar] [CrossRef] [Green Version]
  17. Geller, J.; Neumann, M.H. Improved local polynomial estimation in time series regression. J. Nonparametric Stat. 2018, 30, 1–27. [Google Scholar] [CrossRef]
  18. Burman, P.; Chow, E.; Nolan, D. A cross-validatory method for dependent data. Biometrika 1994, 81, 351–358. [Google Scholar] [CrossRef]
  19. Opsomer, J.; Wang, Y.; Yang, Y. Nonparametric regression with correlated errors. Stat. Sci. 2001, 16, 134–153. [Google Scholar]
  20. Chu, C.K.; Marron, J.S. Comparison of two bandwidth selectors with dependent errors. Ann. Stat. 1991, 19, 1906–1918. [Google Scholar] [CrossRef]
  21. Shiller, R. Market Volatility; MIT Press: Cambridge, MA, USA, 1989. [Google Scholar]
  22. Welch, I.; Goyal, A. A comprehensive look at the empirical performance of equity premium prediction. Rev. Financ. Stud. 2008, 21, 1455–1508. [Google Scholar] [CrossRef]
  23. Mammen, E.; Nielsen, J.P.; Scholz, M.; Sperlich, S. Conditional Variance Forecasts for Long-Term Stock Returns. Risks 2019, 7, 113. [Google Scholar] [CrossRef] [Green Version]
  24. Cont, R. Empirical properties of asset returns: Stylized facts and statistical issues. Quant. Financ. 2001, 1, 223–236. [Google Scholar] [CrossRef]
  25. Pesaran, H.; Timmermann, A. Market Timing and Return Predictability under Model Instability. J. Empir. Financ. 2002, 8, 495–510. [Google Scholar] [CrossRef] [Green Version]
  26. Rapach, D.; Wohar, M. Structural Change and the Predictability of Stock Returns; Working Paper; University of Nebraska-Omaha: Omaha, NE, USA, 2004. [Google Scholar]
  27. Resnick, B.G.; Shoesmith, G.L. Using the yield curve to time the stock market. Financ. Anal. J. 2002, 58, 82–90. [Google Scholar] [CrossRef]
  28. Merton, R. The crisis in retirement planning. Harv. Bus. Rev. 2014, 92, 43–50. [Google Scholar]
  29. Gerrard, R.; Hiabu, M.; Kyriakou, I.; Nielsen, J.P. Communication and personal selection of pension saver’s financial risk. Eur. J. Oper. Res. 2019, 274, 1102–1111. [Google Scholar] [CrossRef]
  30. Gerrard, R.; Hiabu, M.; Kyriakou, I.; Nielsen, J.P. Self-selection and risk sharing in a modern world of life-long annuities. Br. Actuar. J. 2019, 23. [Google Scholar] [CrossRef] [Green Version]
  31. González-Manteiga, W.; Crujeiras, R. An updated review of Goodness-of-Fit tests for regression models. TEST Off. J. Span. Soc. Stat. Oper. Res. 2013, 22, 361–411. [Google Scholar] [CrossRef]
Figure 1. Illustration of the leave-nine-out set (between the dashed lines) of Z t 4 ( A ) , , Z t + 4 ( A ) which include at least one element of Y t ( A ) , , Y t + 4 ( A ) (see bottom).
Mathematics 08 00927 g001
Figure 2. (Left) one-year stock returns in excess of the risk-free benchmark. (Right) five-year stock returns in excess of the risk-free benchmark. Period: 1872–2019. Data: annual S&P 500.
Mathematics 08 00927 g002
Figure 3. Histogram, kernel density estimate (red), and fitted normal distribution (green). (Left) one-year stock returns in excess of the risk-free benchmark. (Right) five-year stock returns in excess of the risk-free benchmark. Period: 1872–2019. Data: annual S&P 500.
Mathematics 08 00927 g003
Figure 4. Single risk-free benchmark. Relation between excess stock returns and the spread (top), the short-term interest rate (middle), and the long-term interest rate (bottom). Estimated nonparametric function m ^ (red solid line), linear model (dash-dotted green line), and 45-degree line (dashed black line). Left: one-year horizon. Right: five-year horizon. Period: 1872–2019. Data: annual S&P 500.
Mathematics 08 00927 g004
Figure 5. Double inflation benchmark. Relation between real stock returns and real earnings-by-price (top), real dividends-by-price (middle), and the real long-term interest rate (bottom). Estimated nonparametric function m ^ (red solid line), linear model (dash-dotted green line), and 45-degree line (dashed black line). Left: one-year horizon. Right: five-year horizon. Period: 1872–2019. Data: annual S&P 500.
Mathematics 08 00927 g005aMathematics 08 00927 g005b
Table 1. US market data (1872–2019).
MaxMinMeanSdSkewExc. Kurt
S&P stock price index2789.803.25277.58558.132.435.50
Dividend accruing to index53.750.186.0410.562.456.00
Earnings accruing to index132.390.1613.9626.312.435.35
One-year excess stock returns Y ( R ) 42.39−58.264.5817.28−0.570.68
Five-year excess stock returns Z ( R ) 107.27−78.5423.4936.69−0.14−0.37
Dividend-by-price9.881.174.311.710.460.25
Earnings-by-price17.751.727.282.751.051.39
Short-term interest rate14.930.073.972.500.962.34
Long-term interest rate14.591.884.532.271.813.63
Inflation20.69−15.652.235.960.261.60
Spread3.64−3.710.561.32−0.050.02
Table 2. Predictive power measured by R V 2 (%) for one-year excess stock returns Y t ( A ) : the single benchmarking approach.
Benchmark B ( A ) Explanatory Variable(s) X t 1
Y ( A ) derl π s
Short-term rate−1.6−1.1−0.63.00.0−1.49.7
Long-term rate−1.8-0.8-0.41.90.0−1.46.2
Earnings-by-price−1.7−1.2−1.40.0−0.8−1.27.5
Inflation−1.4−0.2−1.50.8−0.810.37.2
( Y ( A ) , d ) ( Y ( A ) , e ) ( Y ( A ) , r ) ( Y ( A ) , l ) ( Y ( A ) , π ) ( Y ( A ) , s )
Short-term rate−2.6−2.40.9−2.4−2.96.3
Long-term rate−2.4−2.3−0.2−2.4−3.12.7
Earnings-by-price−3.5−3.7−2.0−2.8−2.84.5
Inflation−1.6−3.4−0.9−2.59.74.8
( d , e ) ( d , r ) ( d , l ) ( d , π ) ( d , s )
Short-term rate−2.92.1−1.6−2.69.3
Long-term rate−2.71.3−1.3−2.35.8
Earnings-by-price−3.7−1.4−2.2−2.46.0
Inflation−1.90.8−1.29.57.9
( e , r ) ( e , l ) ( e , π ) ( e , s )
Short-term rate4.0−1.1−1.69.1
Long-term rate3.2−0.5−1.35.5
Earnings-by-price−1.4−2.3−2.75.4
Inflation−0.4−2.510.95.4
( r , l ) ( r , π ) ( r , s )
Short-term rate8.51.410.0
Long-term rate4.90.36.5
Earnings-by-price6.0−1.57.2
Inflation5.29.57.4
( l , π ) ( l , s )
Short-term rate−2.110.1
Long-term rate−2.06.6
Earnings-by-price−2.07.0
Inflation9.97.4
( π , s )
Short-term rate7.7
Long-term rate4.1
Earnings-by-price5.2
Inflation15.4
Table 3. Predictive power measured by R V 2 (%) for five-year excess stock returns Z t ( A ) : the single benchmarking approach.
Benchmark B ( A ) Explanatory Variable(s) X t 1
Y ( A ) derl π s
Short-term rate0.91.1−1.57.81.4−1.815.5
Long-term rate1.14.60.53.91.0−1.08.0
Earnings-by-price1.4−3.8−3.6−4.7−1.4−1.411.5
Inflation1.37.6−3.9−6.7−3.56.80.8
( Y ( A ) , d ) ( Y ( A ) , e ) ( Y ( A ) , r ) ( Y ( A ) , l ) ( Y ( A ) , π ) ( Y ( A ) , s )
Short-term rate−1.5−2.88.22.2−1.716.4
Long-term rate2.4−0.34.41.6−0.59.0
Earnings-by-price−4.5−3.9−4.9−0.6−0.414.1
Inflation5.9−4.8−5.7−3.07.32.2
( d , e ) ( d , r ) ( d , l ) ( d , π ) ( d , s )
Short-term rate−3.16.4−4.1−2.326.2
Long-term rate1.05.8−0.11.621.0
Earnings-by-price−7.5−12.1−6.6−6.112.0
Inflation3.40.31.810.813.7
( e , r ) ( e , l ) ( e , π ) ( e , s )
Short-term rate8.1−4.5−1.519.1
Long-term rate7.9−3.31.712.6
Earnings-by-price−11.4−8.8−4.510.4
Inflation−9.5−12.59.7−1.1
( r , l ) ( r , π ) ( r , s )
Short-term rate14.75.614.8
Long-term rate6.52.77.0
Earnings-by-price9.2−6.59.0
Inflation−6.40.9−5.9
( l , π ) ( l , s )
Short-term rate−1.413.4
Long-term rate−0.55.8
Earnings-by-price−1.89.2
Inflation7.5−5.8
( π , s )
Short-term rate15.4
Long-term rate8.8
Earnings-by-price11.0
Inflation8.5
Table 4. Predictive power measured by R V 2 (%) for one-year excess stock returns Y t ( A ) : the double benchmarking approach.
Benchmark B ( A ) Explanatory Variable(s) X t 1 ( A )
Y ( A ) d ( A ) e ( A ) r ( A ) l ( A ) π ( A ) s ( A )
Short-term rate−1.63.15.29.5−1.39.5
Long-term rate−1.8−0.20.76.1−1.56.1
Earnings-by-price−1.7−2.3−0.2−1.0−0.77.4
Inflation−1.410.412.27.210.56.5
( Y ( A ) , d ( A ) ) ( Y ( A ) , e ( A ) ) ( Y ( A ) , r ( A ) ) ( Y ( A ) , l ( A ) ) ( Y ( A ) , π ( A ) ) ( Y ( A ) , s ( A ) )
Short-term rate1.83.26.0−2.96.0
Long-term rate−1.9−1.12.6−3.12.6
Earnings-by-price−4.1−2.3−3.2−2.74.3
Inflation10.811.56.29.64.1
( d ( A ) , e ( A ) ) ( d ( A ) , r ( A ) ) ( d ( A ) , l ( A ) ) ( d ( A ) , π ( A ) ) ( d ( A ) , s ( A ) )
Short-term rate2.49.81.59.8
Long-term rate−1.66.3−1.86.3
Earnings-by-price−3.2−3.6−3.54.0
Inflation10.39.510.015.7
( e ( A ) , r ( A ) ) ( e ( A ) , l ( A ) ) ( e ( A ) , π ( A ) ) ( e ( A ) , s ( A ) )
Short-term rate10.73.310.7
Long-term rate7.1−0.57.1
Earnings-by-price
Inflation11.411.317.8
( r ( A ) , l ( A ) ) ( r ( A ) , π ( A ) ) ( r ( A ) , s ( A ) )
Short-term rate
Long-term rate3.6
Earnings-by-price4.9−2.15.7
Inflation13.914.8
( l ( A ) , π ( A ) ) ( l ( A ) , s ( A ) )
Short-term rate7.2
Long-term rate
Earnings-by-price−2.45.4
Inflation14.7
( π ( A ) , s ( A ) )
Short-term rate7.2
Long-term rate3.6
Earnings-by-price5.1
Inflation
Table 5. Predictive power measured by R V 2 (%) for five-year excess stock returns Z t ( A ) : the double benchmarking approach.
Benchmark B ( A ) Explanatory Variable(s) X t 1 ( A )
Y ( A ) d ( A ) e ( A ) r ( A ) l ( A ) π ( A ) s ( A )
Short-term rate0.912.110.415.5−2.515.5
Long-term rate1.18.50.88.0−1.68.0
Earnings-by-price1.48.4−4.9−3.7−0.711.4
Inflation1.310.912.45.78.70.8
( Y ( A ) , d ( A ) ) ( Y ( A ) , e ( A ) ) ( Y ( A ) , r ( A ) ) ( Y ( A ) , l ( A ) ) ( Y ( A ) , π ( A ) ) ( Y ( A ) , s ( A ) )
Short-term rate10.89.916.5−1.516.5
Long-term rate3.2-0.19.2-1.19.2
Earnings-by-price5.3−5.3−5.1−0.214.0
Inflation11.112.45.89.02.2
( d ( A ) , e ( A ) ) ( d ( A ) , r ( A ) ) ( d ( A ) , l ( A ) ) ( d ( A ) , π ( A ) ) ( d ( A ) , s ( A ) )
Short-term rate8.521.97.321.9
Long-term rate1.413.85.013.8
Earnings-by-price−1.64.15.415.5
Inflation9.54.11.713.0
( e ( A ) , r ( A ) ) ( e ( A ) , l ( A ) ) ( e ( A ) , π ( A ) ) ( e ( A ) , s ( A ) )
Short-term rate21.48.221.4
Long-term rate16.42.516.4
Earnings-by-price
Inflation8.64.914.7
( r ( A ) , l ( A ) ) ( r ( A ) , π ( A ) ) ( r ( A ) , s ( A ) )
Short-term rate
Long-term rate9.5
Earnings-by-price5.9−6.26.0
Inflation10.810.0
( l ( A ) , π ( A ) ) ( l ( A ) , s ( A ) )
Short-term rate16.0
Long-term rate
Earnings-by-price−6.46.0
Inflation10.1
( π ( A ) , s ( A ) )
Short-term rate16.0
Long-term rate9.5
Earnings-by-price11.9
Inflation
Table 6. One-year ahead real-time forecasts: predictions from the model using the single-earnings benchmark and the term spread s as covariate ( Y ^ ( E ) = m ^ ( s ) ) and estimated over the full sample period.
US Stock Market DataPredictions
datePDERLs π de Y ^ ( E ) S ^ nom S ^ real RP ^
2018-092901.5052.34130.392.473.000.532.281.804.491.786.183.903.71
2018-102785.4652.81131.062.563.150.592.521.904.711.976.574.054.01
2018-112723.2353.28131.722.603.120.522.181.964.841.756.474.303.87
2018-122567.3153.75132.392.572.830.261.912.095.160.885.914.003.34
2019-012607.3954.15133.062.502.710.211.552.085.100.705.684.133.18
2019-022754.8654.54133.722.472.680.211.521.984.850.705.443.922.97
2019-032803.9854.94134.392.412.570.161.861.964.790.535.213.342.80
2019-042903.8055.32134.682.342.530.192.001.914.640.635.173.172.83
2019-052854.7155.70134.982.272.400.131.791.954.730.425.043.252.77
2019-062890.1756.08135.271.942.070.131.651.944.680.424.993.343.05
2019-072996.1156.46134.481.912.060.151.811.884.490.494.883.072.97
2019-082897.4556.84133.691.731.63−0.101.751.964.61−0.444.072.322.34
2019-092982.1657.22132.901.751.70−0.051.711.924.46−0.254.112.402.36
2019-102977.6857.56135.091.571.710.141.761.934.540.454.893.133.32
2019-113104.9057.90137.281.531.810.282.051.864.420.955.273.223.74
2019-123176.7558.24139.471.511.860.352.291.834.391.195.483.203.97
2020-013278.2058.69138.431.491.760.272.491.794.220.915.052.563.56
2020-023277.3159.13137.391.371.500.132.331.804.190.424.522.193.15
2020-032652.3959.58136.350.320.870.551.542.255.141.856.865.326.54

