Assessing Bank Performance Using Dynamic SBM Model


1
Department of Industrial Engineering and Management, National Kaohsiung University of Science and Technology, Kaohsiung 80778, Taiwan
2
Department of Industrial Engineering and Management, Fortune Institute of Technology, Kaohsiung 83160, Taiwan
*
Authors to whom correspondence should be addressed.
Mathematics 2019, 7(1), 73; https://doi.org/10.3390/math7010073
Submission received: 23 November 2018
/
Revised: 18 December 2018
/
Accepted: 29 December 2018
/
Published: 11 January 2019
Abstract
:Global economic growth has led banks to expand their operations all over the world. The purpose of this research was to understand the efficiency of 18 large bank from all over the world during the period from 2013 to 2017. The performance was estimated by a dynamic slacks-based measure (SBM) model in data envelopment analysis (DEA). This model could be solved using inputs, outputs, and links. The banks variables were considered as follows: Assets, capitalization, and liabilities as inputs; revenue as output; and net interest income as a good link. The final empirical results exhibit the efficiency for each term, and the overall score. The data analysis recommends a feasible solution to refine inefficient terms based on the projections (slacks). This study visually observed the proficiency of the banking industry to equip enterprises with the best choice for their finances.
1. Introduction
Finance plays a key role in a national development, which facilitates societal changes, including economic, political and cultural. A bank is an organization of credit, deposits and provision loans, the first bank was established in Italy in the 14th century [1] and banks have expanded continuously the world over. Nowadays, a bank is a representor in performing financial operations [2,3,4]; it can be a government bank or a private bank. Connecting banking with social activities would enhance economic development because a bank organization is a bridge to shorten the distance between savers and borrowers [5]. Moreover, the integration of technology creates a foundation to link a bank’s connective information with users, allowing users to utilize bank services anytime and anywhere via the Internet. Banks offer various services such as deposits, loans, and credit, and integrating technology is an important strategy for attracting customers. The banking system is improving, leading to higher customer satisfaction. To obtain extensive knowledge and evaluate the banking industry’s operations, this research analyzed variables in financial reports, including assets, capital, revenue, and net interest income, of 18 large banks all over the world from 2013 to 2017 that support measuring efficiency.
Data envelopment analysis (DEA) has been used to assess the performance of different banking aspects, e.g., measuring the operation efficiency of the banking sector in Serbia with the DEA technique [6]; using the Charnes–Cooper–Rhodes model (CCR model) or the Banker–Charnes–Cooper model (BBC model) to calculate bank efficiency [7,8,9]; evaluating the cost efficiency [10,11,12]; discovering the efficiency of banks in Czech Republic, Slovakia, Austria, Poland, Hungary, and Slovenia by estimating undesirable outputs [13]; and testing Canadian banks via the constant returns to scale and variable returns to scale [14]. Examination of a bank’s performance is not limited to the traditional model; DEA represents a new model. Iranian banks illustrate, using dynamic DEA, by interconnecting activities (links) of input-bad excesses link and output-good link shortfalls (slacks) [15]. Notably, the dynamic SBM model can account for the effect of carry-over activities between consecutive terms; further, there are four types of carry-over, i.e. links: Desirable (good), undesirable (bad), discretionary (free), and non-discretionary (fixed). The values can be compared using the long-range performance of the banks. Therefore, this study derived a dynamic SBM model to formulate the efficiency of 18 large banks all over the world during the period of 2013–2017 with the carry-overs as good links based on the rule of inter-connecting activity. The analysis results reveal the efficiency/inefficiency of each term and the overall efficiency. The empirical results exhibit all operation processes of large banks during 2013–2017. Moreover, the dynamic SBM model presents the projection of inputs, output, and good links, and these valuations suggest a solution to improve inefficient terms.
The research is organized as follows. Section 1 introduces the objective, scope, and method. Section 2 reviews the theoretical efficiency banks and the dynamic SBM model. Section 3 describes the research process, data source, and mathematical equations of dynamic SBM model. Section 4 explores the empirical results. Section 5 summarizes the main findings.
2. Literature Review
Banks have the objective to be a monetary authority that manages and supports people, organizations, and financial enterprises. In the monetary shortage case, individuals or enterprises can borrow from the bank. Conversely, they can deposit excess money in the bank. A bank is a financial intermediary that manages money [16] and issue deposits [17]. Banks are major managers and supporters of finance [18]. With the role of holding finance, banks are established in all countries, thus many papers have studied the operating valuation of banks. For example, the shadow price of profit function models is used to assess the efficiency of American banks [19]. An investigation of Indian banks presents the mean efficiency score through the traditional CCR model [20]. An efficiency measurement of the Brazilian banking system using non-dynamic panel data models is implemented to compute the efficiency level [21]. A study of Turkish commercial bank performance finds the cost efficiency scores using the true fixed effects model [22]. An evaluation of bank efficiency in Slovakia employs BCC models [23]. An analysis of bank performance in China was demonstrated by the Malmquist model [24]. In summary, banks are present and thrive in all countries, and many researchers explore their efficiency with various models. This paper gives an overall view of large banks all over the world when utilizing a dynamic SBM model.
Data envelopment analysis (DEA) is analysis software with different models that measure efficiency in many aspects with multiple input and output variables. It has two characteristics: Radial and non-radial. In traditional CCR, the BBC model [25] was the first radial model to maximize outputs without more inputs. The efficiency is computed by a ratio of outputs that respond to the operations of the enterprise. Charnes confirmed that decision-making units (DMUs) are 100 % efficient when decreasing both inputs and outputs or increasing both inputs and outputs [26]. Then, Cooper indicated that a DMU should be rated as 100 percent efficient based on available evidence when the performances of other DMUs show that neither their inputs nor outputs can be improved without worsening other inputs or outputs [27]. SBM model represents a non-radial model that deals with inputs and outputs individually and monitors input excess and output shortfall [28] to calculate the efficiency. Further expanding models for measuring the efficiency in DEA, Fare and Grosskopf proposed a dynamic SBM model [29] to measure performance by connecting input excesses and out shortfalls as well as the presence of carry-over (link) between the two continual terms. Each carry-over has a different function: Desirable (good) links are solved as outputs, and output shortfalls; undesirable (bad) links are input excesses; discretionary (free) links are handled separately and do not directly impact the efficiency evaluation; and non-discretionary (fixed) links affect the efficiency score indirectly through the continuity condition between two terms. Furthermore, the dynamic SBM model approaches inputs and outputs to solve inter-connecting activities [30]. This model was applied in previous research in different areas: Determining productive efficiencies in production with the usage of quasi-fixed inputs [31]; calculating the airline energy efficiency by an approach of virtual frontier dynamic SBM [32]; evaluating inter-temporal efficiency for executive efficiency of energy based on fossil-fuel CO2 emissions in the organization for economic co-operation and development (OECD) and China through a carry-over of intermediate linking different terms [33]; a gauge of energy and emission reduction efficiencies in China’s industrial sector [34]; and an investigation of bank performance evaluation utilized the dynamic SBM model to deal input-band link excesses and output-good link shortfalls [15]. As same as the previous studies, we also used the dynamic SBM model approach to measure the efficiency. In particular, we calculated the efficiency of banks through connecting activities as the desirable output link. The discretionary expresses carry-over between terms consciously, its value can increase or decrease basing on observed valuation. This model recommends the performance valuation when calculating the value among inputs, output, and good link.
3. Methods
3.1. Research in Progress
The study assesses the performance of 18 world banks during the period of 2013–2017 via a dynamic SBM model, which is presented in Figure 1 to describe a common picture of researching the process according to the following steps:
Step 1: Selecting DMUs and collecting their relative information: From the beginning, global banks were determined to be a study object. This stage collected the information from eighteen banks all over the world [35], and their input and output factors during the period time of 2013–2017 were chosen based on their annual reports posted on tmxmoney [36]. With the aim to measure efficiency, the input and output factors were selected.
Step 2: Many models can compute the efficiency, but the dynamic SBM model is the first innovative scheme formally solved via inter-connecting activities. Thus, the research chose the dynamic SBM model to calculate the performance. From the defined variables in the Stage 1, we designed the structure of the dynamic SBM model in this study. Next, the mathematical equations were set up accordingly.
Step 3. Before applying the DEA model to formulate the values, the input and outputs variables had to be ensured to have a positive valuation. The inappropriate factors with negative values had to be reselected in order to meet the right qualification, and the appreciate variables were used for counting the scores. The empirical results indicated term efficiency and overall score. By the way, each large bank company determined efficiency/inefficiency for each term and whole term. Moreover, the dynamic SBM model presents the projections of variables, so the inefficient term can be improved through the input excesses, output, and desirable link shortfalls.
Step 4: Conclusion. The research summarizes the key finds, conducts contributions, and suggests future studies.
3.2. Data Source
Accordingly the source of the world’s top 100 banks [35], based on their financial quotation within five years from 2013 to 2017, was posted on tmxmoney [36]; the research selected 18 large banks from all over the world, as shown in Table 1.
Selecting inputs and outputs is an important background task in manipulating DEA to measure the efficiency of DMUs. Based on the financial reports and the direction of the study, the researcher chose two variables of inputs and one output as below:
- Assets (input): Tangible and intangible assets that enterprises own and control.
- Capitalization (input): Capitalization is the net worth and the value to a bank’s investor.
- Liabilities (input): Liabilities for a bank include mortgage payments for building, distribution payments to customers from stock, and interest paid to customers.
- Revenue (output): Revenue is the total money that a bank actually receives during a specific operating period.
- Net interest income (good link): The net interest income is generated from the interest earned on assets over the interest paid out on deposits, based on the excess revenue.
Assets, capital, liabilities, revenue, and net interest income are key financial indicators that can assess the potential development of an enterprise. Adopting the carry-over of dynamic SBM model, variables will be responded to their functions to estimate the efficiency of every term particularly. With the link, the net interest income is employed as carry-over between the end of each year and the beginning of the following year.
3.3. Dynamic SBM Model
Tone and Tsutsui [30] researched and computed the theoretical aspects of the dynamic SBM model with the classification of carry-over activities that comprises of four categories including desirable, undesirable, discretionary and non-discretionary. In this study, we computed the efficiency of 18 large banks all over the world through treating desirable link. The bank company is set over terms . For each term, have inputs , outputs , and desirable output . Set , , , and indicate the observed (undesirable) input and desirable output values of at term . The symbolization of desirable link as . Let the notation as , where is the number of desirable link. The dynamic structure of enterprise is descripted in Figure 2. There are five consecutive terms, each term will deal with inputs and output variables, simultaneously the carry-over (link) will connect between two consecutive term.
The production possibility [30] denotes are given by:
where is the intensity vector for the term t. With the constant returns-to-scale, and on the right of the above are positive data, and on the left are variables that are connected by the intensity variable .
When continuing to link (carry-over) between term t and t + 1, one must make sure the condition is met, as below:
The symbol stands for good link, the constraint is critical for the dynamic model when it connects term t and term t + 1 activities.
Having DMUk (k = 1, …, n) and utilizing the production is shown as:
where are slack variables, they are called input excess, output shortfall and good link shortfall. The overall efficiency of DMU will be computed by variables such as: .
The output-oriented overall score is given as follows:
From Equations as (2), and (3), the weight to term t and input u are , they must satisfy the below condition:
The output-oriented SBM model is in respect to output shortfall [28] over the whole set data, the characteristics are also mentioned to the dynamic SBM model. Shortfalls in desirable link are given as output shortfalls because they have similar feature to output. The good link plays role in connecting two consecutive terms as demonstrated by the constraint. The efficiency of the term t is measured by the relative slacks of outputs and link.
With an optimal solution of , then the efficiency is denoted by:
The weighted harmonic mean of the term efficiencies is considered as the output-oriented overall efficiency during the period as follows:
DMUk is called output-oriented efficiency at term t if . In this way, all optimal slacks for term t are zero i.e., , and the optimal solution also satisfies . In contrary, the DMUk does not have efficiency if and .
From these optimal solutions, the projection of DMUk is determined as follows:
When the DMUk is projected, it will have an overall efficiency.
Equation (7), we determined the efficiency of each DMU; thus, the maximum efficiency of the dynamic SBM model is equal to 1, whereas the super-SBM model can reach efficiency of above 1 without a limitation for the highest score; furthermore, it can obtain a good distinguishing rate [37], but it only solves with input and output factors. In contrary, the dynamic SBM model obtains the performance when its score is 1, so it is difficult to distinguish efficient DMUs; in addition, the data must be a positive number; if any valuation is negative, or zero, it must be removed or replaced by a small positive number. However, the dynamic SBM model can deal with input and output variables, i.e., simultaneous inter-connecting activities [29]. Accompanying this rule, we show that the net interest income responds to the undesirable link; thus, it is not output that is used for inter-connecting activities with the role of connection of two consecutive terms.
4. Results
4.1. Data Analysis
Banks are financial organizations that hold and control monetary assets. A bank not only gathers money from various people or enterprises but also lends money to private persons or companies. Hence, it always stores an amount of available capital. For pointing out the performance of banks in the world, the study analyzed the efficiency of 18 banks based on the selected data as shown in Section 3.2.
The statistical data of 18 banks were collected and are recapitulated in Table A1, which indicates that the smallest value of assets, capitalization, liabilities, revenue, and net interest income is 294,792, 45,562, 266,519, 7265, and 4409, respectively; the highest value of assets, capitalization, liabilities, revenue, and net interest income is 4,010,883, 549,435, 3,681,696, 111,246, and 80,270, respectively. Thus, all inputs, output, and good link are positive and significant. From the principle of using data in a dynamic SBM model, all values are suitable to apply in analyzing the efficiency.
Before the data are applied into the dynamic SBM model, the correlation must be checked among inputs, output, and good link. Table A2 indicates that all correlation coefficients are from 0.3892 to 1. Thus, with the rule of Pearson’s correlation, all the size measures have a significant and good correlation.
4.2. Efficiency Measurement
A normal SBM model does not incorporate the carry-over activities between terms; thus, efficiency is measured without the links between consecutive terms. In contrast, the dynamic SBM model obtains the carry-over activities between consecutive terms and observes the long-term viewpoint. This can support the technical efficiency of valuation more accurately. According to the above analysis, all values of 18 large banks from 2013 to 2017 are used for calculating the scores via the dynamic SBM model (efficiencies of banks are shown in Table 2).
Observing the scores in Table 2 and projections in Table A3 and Table A4, the efficiency of every bank is presented. There are four banks, i.e., ACGBF, BNPQF, IITSF, and ITUB, which always obtained efficiency all over the whole term when their different percentages of the projections were equal to 0; in addition, their term efficiencies approached 1; and also overall scores attained were 1. Therefore, these banks represented the best excellent operation that maintains a stable performance and first position from 2013 to 2017.
The remaining banks continually fluctuated and maintained efficiency over the whole term, as most of their projections were different, with a value of 0, as shown in Table A3 and Table A4; further, their overall scores were smaller than 1, as shown in Table 2. Although CICHF did not obtain the performance, it was a good bank, with term efficiencies from 0.9286 to 0.9954, and its overall score of 0.958. IDCBY and BACHF achieved a high performance with the overall scores of 0.8221, and 0.8106, respectively; whereas the term efficiencies of IDCBY were from 0.7973 to 0.8473, and BACHF were from 0.7850 to 0.8401. HSBC, C, BAC, and JMP had a median efficiency with overall scores from 0.5801, 0.5738, 0.5144, and 0.5013, respectively; in addition, the term efficiencies of HSBC were from 0.5043 to 0.6654, C were from 0.5156 to 0.6760, BAC were from 0.4747 to 0.5528, and JMP were from 0.4711 to 0.5378. These results indicated that BAC still obtained a low efficiency in 2016 with the term efficiency of 0.4724, and JPM archived a low efficiency in 2013, and 2016. SHG, BCLYF, DBSDF, ING, and DB had a low performance with the overall scores of 0.4960, 0.4610, 0.4354, 0.3432, and 0.3235, respectively; simultaneously, most of their term efficiencies were lower than 0.5. However, the term efficiencies of SHG and BCLYF upgraded the median valuation in some terms; for example, SHG were 2014, 2015, and 2017 and BCLYF were 2013, 2015, and 2016. Two banks including UBS and DNSKF, had a very low performance because they had large liabilities and capitalization excesses with projections under 0, along with output and good link shortfalls with the projections under 0. The overall scores of UBS and DNSKF were 0.2954, and 0.2591, respectively. As a result, DNSKF had the lowest term efficiency and overall score during the period from 2013–3017.
According to the above findings, with 18 large banks within five years, the term efficiencies revealed 20 efficient terms and 70 inefficient terms; the overall scores presented four efficient companies and 14 inefficient companies. The empirical results denote that ACGBF, BNPQF, IITSF, and ITUB held sustainable development over the period from 2013–2017, as they always maintained solid performance; others banks increased and reduced smoothly over the whole term. The performance was divided into five levels, i.e., excellent, good, median, low, and very low as shown in Table 3.
Table 3 summarizes the classification of performance and the quantity of each type. The DMU will be excellent if an overall score can attain 1; thus, there were four companies with excellent efficiency. The DMU will be good, median, low, and very low if its overall scores are 7–9.9, 5–6.9, 3–4.9, and 0–2.9, respectively; therefore, the quantity of good, median, low, and very low banks were 3, 4, 5, and 2, respectively.
Moreover, the dynamic SBM model had the same features as the SBM model, which experiences input excess and output shortfalls to figure out the status of each variable in every term and suggests a direction to improve the inefficient term. In this study, the dynamic SBM model built three elements, including inputs excesses (assets, capitalization), output shortfall (revenue), and desirable output shortfall (good link) (net interest income), as shown in Table A3 and Table A4. For instance, ING in 2013 had the worst efficiency, this company only received a good slack of assets with the different projections as 0; others slacks must be refined accordingly, the excess of capitalization, and liabilities should be reduced 0.03, and 3.07, respectively; the shortfall of output and desirable output should be increased 266.68, 142.55, respectively.
4.3. Discussion
The purpose of this study is to evaluate the efficiency of DMUs through approaching a dynamic SBM model. The empirical values compute projections, term efficiency, and an overall score based on inputs, output, and good links with the historical time series of 18 large banks during the period of 2013–2017. As with other models such as Malmquist, Windows, undesirable aspects remain, i.e., in DEA, the dynamic SBM model also conducts the efficiency to every term that is called “term efficiency.” The different points of this model include Equation (7), which computes the overall score of every DMU which evaluates the performance of whole term; and from the Equation (8), the research defines projections (slacks) of input excesses, output shortfall, and good link shortfall. These projections suggest a particular solution of excesses, and shortfalls in inefficient terms.
The empirical analysis results confirm that the dynamic SBM model is a good tool for determining the efficiency of large banks. With 18 large banks all over the world, the final result concludes that ACGBF, BNPQF, IITSF, and ITUB were the best banks and always remained in the first positions. In contrary, UBS and DNSKF with overall scores of 0.2954, and 0.2591, respectively, were considered to be the worst banks; simultaneously, their rankings were 17, and 18, respectively.
In this study, we express directly the term efficiency, overall score (efficiency), and projections; however, the previous studies demand using the dynamic two-stage slacks-based measure model to assess the efficiency of Chinese banks. The results indicate the inefficiencies of both productivity and profitability stages [38]; furthermore, to avoid the deficiency of the traditional dynamic SBM model in distinguishing the efficient DMUs, Cui et al. proposed the virtual frontier dynamic SBM model to calculate the energy efficiency of 22 airlines [32]. Therefore, each research has a separate approach via the dynamic SBM model to show the performance of DMUs.
5. Conclusions
Accompanied by the growing economy, many banks are enhanced via sustainable development. Based on the financial report from tmxmoney [30], this research selected 18 large banks from all over the world using their input and output factors during the period term from 2013–2017 to evaluate their efficiency and suggest a solution to improve the inefficient terms based on the dynamic SBM model.
The study propounds the dynamic SBM model to be applied to accounting the scores. The implementation stages are analyzed by outputs and input variables and good link, whereas net interest income responds to carry-over and a desirable link between consecutive terms. The empirical results reveal every efficiency of each term and the overall efficiency of the whole term. Then, from the different projections (slacks) to inputs, output, and good link, a solution of efficiency improvement are put forward for consideration.
In regard to the structure rule of the dynamic SBM model, the study provides a new structure for analyzing the input and output variables of global banks. The formulated results express the accuracy measurement of operating efficiencies in each term of the 18 large banking companies. The findings equip them to have an accurate view of their position over the global market; simultaneously, their customers typically evaluate a bank’s development valuation before cooperating.
Approaching the dynamic SBM model, which was used to discover the efficiency of 18 large banks all over the world, the research still has limitations. The dynamic SBM model gives carry-overs, i.e., good, bad, free, and fixed links; furthermore, this study only responds to the good link, and additional study could design more links for in-depth analysis. Moreover, according to the econometric method, the selected variables and data meet with the endogeneity problem because inputs are independent factors, while output and good link are dependent factors; in addition, the historical time series from 2013 to 2017 is to relate to the context of time-series analysis of causal processes [39]. Future research should use the generalized method for moments (GMM) to estimate dynamic models [40] for showing the endogeneity problem.
Author Contributions
C.-N.W. guided the analysis method, the research direction, and found the solutions; Q.-C.L. designed the research framework, collected the data, and analyzed the empirical results; T.-K.-L.N. analyzed the data and wrote the manuscript; and J.-D.D. edited the content. All authors contributed in issuing the final manuscript.
Funding
This research was partly supported by the National Kaohsiung University of Science and Technology, and MOST107-2622-E-992-012-CC3 from the Ministry of Sciences and Technology in Taiwan.
Acknowledgments
The authors appreciate the support from the National Kaohsiung University of Science and Technology.
Conflicts of Interest
The authors declare no conflict of interest.
Appendix A

Table A1.
Statistics on data (million USD).
| Variable | Year | Inputs | Output | Good Link | ||
|---|---|---|---|---|---|---|
| AST | CAP | LIE | REV | NII | ||
| Max | 2013 | 3,124,702 | 482,359 | 2,913,534 | 97,392 | 73,227 |
| Min | 294,792 | 45,562 | 266,519 | 7,265 | 4,409 | |
| Average | 1,748,388 | 216,989 | 1,629,470 | 55,051 | 30,857 | |
| St Dev | 911,726 | 133,268 | 827,835 | 30,848 | 21,203 | |
| Max | 2014 | 3,321,191 | 508,106 | 3,073,462 | 105,830 | 79,529 |
| Min | 308,952 | 51,151 | 281,061 | 7,407 | 4,769 | |
| Average | 1,746,921 | 213,525 | 1,626,513 | 55,123 | 31,240 | |
| St Dev | 973,613 | 138,341 | 871,883 | 32,888 | 23,745 | |
| Max | 2015 | 3,420,306 | 536,224 | 3,143,026 | 107,079 | 78,212 |
| Min | 314,966 | 51,862 | 287,925 | 7,642 | 4,850 | |
| Average | 1,666,563 | 215,314 | 1,535,014 | 53,558 | 30,685 | |
| St Dev | 985,703 | 143,383 | 878,414 | 33,405 | 23,366 | |
| Max | 2016 | 3,475,501 | 549,435 | 3,190,235 | 96,946 | 67,941 |
| Min | 328,019 | 50,669 | 300,341 | 7,902 | 4,576 | |
| Average | 1,681,349 | 216,268 | 1,548,367 | 50,627 | 28,255 | |
| St Dev | 1,016,991 | 145,325 | 906,255 | 31,181 | 20,532 | |
| Max | 2017 | 4,010,883 | 539,773 | 3,681,696 | 111,246 | 80,270 |
| Min | 387,072 | 63,939 | 349,837 | 9,176 | 4,813 | |
| Average | 1,843,114 | 292,382 | 1,698,131 | 55,512 | 31,265 | |
| St Dev | 1,137,296 | 142,016 | 1,013,694 | 34,350 | 23,916 | |
Note: AST, Assets; CAP, Capitalization; LIE, Liabilities; REV, Revenue; NII, Net Interest Income.
Table A2.
Pearson’s correlation.
| Variables | Year | AST | CAP | LIE | REV | NII |
|---|---|---|---|---|---|---|
| AST | 2013 | 1.0000 | 0.4555 | 0.9988 | 0.8640 | 0.8015 |
| CAP | 0.4555 | 1.0000 | 0.4251 | 0.5524 | 0.3892 | |
| LIE | 0.9988 | 0.4251 | 1.0000 | 0.8456 | 0.7853 | |
| REV | 0.8640 | 0.5524 | 0.8456 | 1.0000 | 0.8689 | |
| NII | 0.8015 | 0.3892 | 0.7853 | 0.8689 | 1.0000 | |
| AST | 2014 | 1.0000 | 0.4792 | 0.9983 | 0.8854 | 0.8199 |
| CAP | 0.4792 | 1.0000 | 0.4476 | 0.5685 | 0.4520 | |
| LIE | 0.9983 | 0.4476 | 1.0000 | 0.8684 | 0.8019 | |
| REV | 0.8854 | 0.5685 | 0.8684 | 1.0000 | 0.8907 | |
| NII | 0.8199 | 0.4520 | 0.8019 | 0.8907 | 1.0000 | |
| AST | 2015 | 1.0000 | 0.5302 | 0.9989 | 0.9285 | 0.8939 |
| CAP | 0.5302 | 1.0000 | 0.4994 | 0.6435 | 0.5153 | |
| LIE | 0.9989 | 0.4994 | 1.0000 | 0.9152 | 0.8838 | |
| REV | 0.9285 | 0.6435 | 0.9152 | 1.0000 | 0.9003 | |
| NII | 0.8939 | 0.5153 | 0.8838 | 0.9003 | 1.0000 | |
| AST | 2016 | 1.0000 | 0.5445 | 0.9990 | 0.9105 | 0.9073 |
| CAP | 0.5445 | 1.0000 | 0.5148 | 0.6924 | 0.6162 | |
| LIE | 0.9990 | 0.5148 | 1.0000 | 0.8969 | 0.8949 | |
| REV | 0.9105 | 0.6924 | 0.8969 | 1.0000 | 0.9184 | |
| NII | 0.9073 | 0.6162 | 0.8949 | 0.9184 | 1.0000 | |
| AST | 2017 | 1.0000 | 0.7497 | 0.9994 | 0.9047 | 0.9166 |
| CAP | 0.7497 | 1.0000 | 0.7369 | 0.8416 | 0.6483 | |
| LIE | 0.9994 | 0.7369 | 1.0000 | 0.8956 | 0.9075 | |
| REV | 0.9047 | 0.8416 | 0.8956 | 1.0000 | 0.8906 | |
| NII | 0.9166 | 0.6483 | 0.9075 | 0.8906 | 1.0000 |
Table A3.
Projections of large banks for 2013-2015.
| DMU | 2013 | 2014 | 2015 | ||||||||||
|---|---|---|---|---|---|---|---|---|---|---|---|---|---|
| AST | CAP | LIE | REV | NII | AST | CAP | LIE | REV | NII | AST | CAP | LIE | |
| IDCBY | −0.62 | 0 | 0 | 26.84 | 21.54 | −0.75 | 0 | 0 | 19.41 | 19.05 | −0.99 | 0 | 0 |
| CICHF | −1.08 | 0 | 0 | 8.26 | 4.66 | −0.93 | 0 | 0 | 3.51 | 3.9 | −1 | 0 | 0 |
| ACGBF | 0 | 0 | 0 | 0 | 0 | 0 | 0 | 0 | 0 | 0 | 0 | 0 | 0 |
| BACHF | −1.04 | 0 | 0 | 17.79 | 30.92 | −1.22 | 0 | 0 | 18.59 | 28.57 | −1.21 | 0 | 0 |
| HSBC | −0.72 | 0 | 0 | 108.44 | 72.18 | −0.78 | 0 | 0 | 58.35 | 77.72 | −1.19 | 0 | 0 |
| JPM | −0.72 | −4.25 | 0 | 80.87 | 136.73 | −0.94 | 0 | 0 | 75.42 | 116.68 | −2.78 | 0 | 0 |
| BNPQF | 0 | 0 | 0 | 0 | 0 | 0 | 0 | 0 | 0 | 0 | 0 | 0 | 0 |
| BAC | −3.18 | −18.6 | 0 | 71.46 | 116.69 | −3.21 | 0 | 0 | 79.64 | 104.4 | −4.3 | 0 | 0 |
| DB | 0 | 0 | −3.18 | 173.44 | 188.74 | 0 | 0 | −3.25 | 203.43 | 222.06 | 0 | 0 | −3.66 |
| BCLYF | 0 | 0 | −0.67 | 70.57 | 99.76 | −11.33 | 0 | −13.08 | 149.66 | 145.03 | 0 | 0 | −1.14 |
| C | −3.08 | −17.51 | 0 | 77.7 | 74.91 | −3.07 | 0 | 0 | 74.64 | 51.61 | −4.99 | −4.07 | 0 |
| UBS | 0 | −0.03 | −1.92 | 105.16 | 401.44 | 0 | 0 | −14.24 | 77.8 | 377.84 | 0 | 0 | −1.9 |
| ING | 0 | −0.03 | −3.07 | 266.68 | 142.55 | 0 | −14.55 | −2.47 | 349.83 | 129.57 | 0 | −15.26 | −3.48 |
| IITSF | 0 | 0 | 0 | 0 | 0 | 0 | 0 | 0 | 0 | 0 | 0 | 0 | 0 |
| DNSKF | 0 | −46.06 | −3.67 | 231.6 | 296.6 | 0 | −31.07 | −4.44 | 249.26 | 280.96 | 0 | −40.5 | −3.77 |
| SHG | −1.52 | −30.14 | 0 | 89.5 | 115.8 | −0.54 | −13.48 | 0 | 89.44 | 95.26 | −0.67 | −5.31 | 0 |
| DBSDF | −2.3 | 0 | 0 | 166.03 | 158.45 | −1.62 | 0 | 0 | 144.54 | 129.14 | −1.45 | −5.2 | 0 |
| ITUB | 0 | 0 | 0 | 0 | 0 | 0 | 0 | 0 | 0 | 0 | 0 | 0 | 0 |
Table A4.
Projections of large banks for 2016−2017.
| DMU | 2015 | 2016 | 2017 | |||||||||
|---|---|---|---|---|---|---|---|---|---|---|---|---|
| REV | NII | AST | CAP | LIE | REV | NII | AST | CAP | LIE | REV | NII | |
| IDCBY | 17.4 | 18.65 | −1.03 | 0 | 0 | 25.38 | 25.47 | −43.48 | 0 | −44.02 | 37.33 | 5.26 |
| CICHF | 0 | 0.92 | −0.87 | 0 | 0 | 2.39 | 4.43 | −11.87 | 0 | −12 | 15.38 | 0 |
| ACGBF | 0 | 0 | 0 | 0 | 0 | 0 | 0 | 0 | 0 | 0 | 0 | 0 |
| BACHF | 17.18 | 27.53 | −1.34 | 0 | 0 | 9.13 | 28.93 | −42.52 | 0 | −42.76 | 45.87 | 8.89 |
| HSBC | 26.15 | 84.13 | −0.72 | 0 | 0 | 21.67 | 78.91 | −0.89 | −0.05 | 0 | 102.13 | 94.45 |
| JPM | 47.37 | 124.54 | −1.04 | 0 | 0 | 94.52 | 130.06 | −0.24 | −12.71 | 0 | 81.76 | 108.89 |
| BNPQF | 0 | 0 | 0 | 0 | 0 | 0 | 0 | 0 | 0 | 0 | 0 | 0 |
| BAC | 46.67 | 115.1 | −3.14 | 0 | 0 | 96.59 | 124.69 | −2.09 | −15.63 | 0 | 81.64 | 104.18 |
| DB | 148.11 | 220.26 | 0 | 0 | −4.19 | 177.39 | 255.13 | 0 | 0 | −4.31 | 203.7 | 276.82 |
| BCLYF | 81.24 | 97.34 | 0 | 0 | −1.02 | 55.84 | 143.37 | −0.5 | 0 | −1.75 | 163.75 | 145.98 |
| C | 35.37 | 60.5 | −3.19 | 0 | 0 | 106.02 | 81.85 | −0.92 | −22.83 | 0 | 90.26 | 80.89 |
| UBS | 65.58 | 369.88 | 0 | 0 | −2.77 | 90.77 | 413.64 | 0 | −9.49 | −3.74 | 101.99 | 380.85 |
| ING | 226.25 | 144.46 | 0 | 0 | −3.44 | 218.62 | 153.11 | 0 | −5.88 | −3.07 | 196.21 | 114.12 |
| IITSF | 0 | 0 | 0 | 0 | 0 | 0 | 0 | 0 | 0 | 0 | 0 | 0 |
| DNSKF | 176.29 | 348.99 | 0 | −31.09 | −5.44 | 250.02 | 428.51 | 0 | −52.7 | −5.2 | 180.24 | 395.6 |
| SHG | 59.76 | 120.26 | 0 | −3.1 | −1.38 | 129.79 | 131.87 | 0 | −31.74 | −0.86 | 94.09 | 87.47 |
| DBSDF | 144.65 | 115.72 | −1.7 | 0 | 0 | 121.25 | 115.56 | −6.8 | 0 | −5.23 | 135.93 | 87.14 |
| ITUB | 0 | 0 | 0 | 0 | 0 | 0 | 0 | 0 | 0 | 0 | 0 | 0 |
References
- Hoggson, N.F. Banking Through the Ages, 3rd ed.; Dodd, Mead & Company: New York, NY, USA, 1926; pp. 1–128. [Google Scholar]
- Dell’Ariccia, G.; Marquez, R. Information and bank credit allocation. J. Financ. Econ. 2004, 71, 185–214. [Google Scholar] [CrossRef]
- Levine, R. Financial development and economic growth: Views and agenda. J. Econ. Lit. 1997, 35, 688–726. [Google Scholar]
- King, R.G.; Levine, R. Finance, entrepreneurship and growth: Theory and evidence. J. Monet. Econ. 1993, 32, 513–542. [Google Scholar] [CrossRef]
- Fadzlan, S.; Fakarudin, K.; Annuar, N. Determinants of efficiency in the Malaysian banking sector: Does bank origins matter? Intellect. Econ. 2016, 10, 38–54. [Google Scholar] [CrossRef]
- Radojka, M.; Marija, K.; Predrag, M. Application of DEA methodology in measuring efficiency in the banking sector. Econ. Agric. 2013, 60, 843–855. [Google Scholar]
- Jelena, T.; Jelena, S.; Nataljia, L. Measuring bank efficiency: DEA application. Tech. Dev. 2014, 20, 739–757. [Google Scholar] [CrossRef]
- Karan, S.T.; Shashank, P. Measuring Bank Performance of Nepali Banks: A Data Envelopment Analysis (DEA) Perspective. Int. J. Econ. Financ. 2013, 3, 54–65. [Google Scholar]
- Chang, K.C.; Lin, C.L.; Cao, Y.; Lu, C.F. Evaluating branch efficiency of a Taiwanese bank using data envelopment analysis with an undesirable factor. Afr. J. Bus. Manag. 2011, 5, 3220–3228. [Google Scholar]
- Tugba, E.B.; David, A.V.; Bener, G. Determinants of bank efficiency in Turkey: Participation banks versus conventional banks. Bors. Istan. Rev. 2017, 17, 86–96. [Google Scholar] [CrossRef]
- Mihai, N.; Cristi, S. An Examination of Banks’ Cost Efficiency in Central and Eastern Europe. Proced. Econ. Financ. 2015, 22, 544–551. [Google Scholar] [CrossRef] [Green Version]
- Lee, C.C.; Huang, T.H. Cost efficiency and technological gap in Western European banks: A stochastic metafrontier analysis. Int. Rev. Econ. Finan. 2017, 48, 161–178. [Google Scholar] [CrossRef]
- Zuzana, S. Comparison and evaluation of bank efficiency in selected countries in EU. Proced. Econ. Financ. 2014, 12, 644–653. [Google Scholar] [CrossRef]
- Joseph, C.P.; Elizabeth, M.; Yang, X.P. Evaluating Canadian Bank Branch Operational Efficiency from Staff Allocation: A DEA Approach. Manag. Organ. Stud. 2015, 2. [Google Scholar] [CrossRef]
- Morteza, S.; Mohammad, S.; Mehdi, G. Bank performance evaluation using dynamic DEA: A slacks-based measure approach. J. Data Envel. Anal. Decis. Sci. 2013, 1–12. [Google Scholar] [CrossRef]
- Michael, A.K. A theory of banking firm. J. Monet. Cred. Bank. 1971, 3, 205–218. [Google Scholar] [CrossRef]
- Eugene, F.F. Banking in the theory of finance. J. Monet. Econ. 1980, 6, 39–57. [Google Scholar] [CrossRef]
- Douglas, W.D.; Phillip, H.D. Banking theory, deposit insurance, and bank regulation. J. Buss. 1986, 59, 55–68. [Google Scholar]
- Allen, N.B.; Diana, H.; David, B.H. Bank efficiency derived from the profit function. J. Bank. Financ. 1993, 17, 317–347. [Google Scholar] [CrossRef]
- Milind, S. Efficiency of banks in a developing economy: The case of India. Eur. J. Oper. Res. 2003, 148, 662–671. [Google Scholar] [CrossRef]
- Roberta, B.S.; Geraldo, D.S.S.; Benjamin, M.T. Evolution of bank efficiency in Brazil: A DEA approach. Eur. J. Oper. Res. 2010, 202, 204–213. [Google Scholar] [CrossRef]
- Hakan, G.; Dilem, Y. Estimating cost efficiency of Turkish commercial banks under unobserved heterogeneity with stochastic frontier models. Cent. Bank Rev. 2016, 16, 127–136. [Google Scholar] [CrossRef]
- Grmanova, E.; Ivanova, E. Efficiency of banks in Slovakia: Measuring by DEA models. J. Int. Stud. 2018, 11, 257–272. [Google Scholar] [CrossRef] [PubMed]
- Huichen, J.; Yifan, H. Applying Data Envelopment Analysis in Measuring the Efficiency of Chinese Listed Banks in the Context of Macroprudential Framework. Mathematics 2018, 6, 184. [Google Scholar] [CrossRef]
- Charnes, A.; Cooper, W.; Rhodes, E. Measuring the Efficiency of Decision Making Units. Eur. J. Oper. Res. 1978, 2, 429–444. [Google Scholar] [CrossRef]
- Charnes, A.; Cooper, W.; Rhodes, E. Evaluating program and managerial efficiency: An application of data envelopment analysis to program follow through. Manag. Sci. 1981, 27, 668–697. [Google Scholar] [CrossRef]
- Cooper, W.; Seiford, L.; Thanassoulis, E.; Zanakis, S. DEA and its uses in different countries. Eur. J. Oper. Res. 2004, 154, 337–344. [Google Scholar] [CrossRef]
- Tone, K. A slack-based measure of efficiency in data envelopment analysis. Eur. J. Oper. Res. 2001, 130, 498–509. [Google Scholar] [CrossRef]
- Fare, R.; Grosskopf, S. Intertemporal Production Frontiers: With Dynamic DEA; Springer: Dordrecht, The Netherlands, 1996; pp. 9–45. [Google Scholar] [CrossRef]
- Tone, K.; Tsutsui, M. Dynamic DEA: A slacks-based measure approach. Omega 2010, 38, 145–156. [Google Scholar] [CrossRef]
- Jiro, N.; Goto, M. Measuring dynamic efficiency in production: An application of data envelopment analysis to Japanese electric utilities. J. Prod. Anal. 2003, 19, 191–210. [Google Scholar] [CrossRef]
- Cui, Q.; Li, Y.; Yu, C.L.; Wei, Y.M. Evaluating energy efficiency for airlines: An application of Virtual Frontier Dynamic Slacks Based Measure. Energy 2016, 113, 1231–1240. [Google Scholar] [CrossRef]
- Guo, X.Y.; Lu, C.C.; Lee, J.H.; Chiu, Y.H. Applying the dynamic DEA model to evaluate the energy efficiency of OECD countries and China. Energy 2017, 134, 392–399. [Google Scholar] [CrossRef]
- Teng, X.Y.; Liang, C.L.; Chiu, Y.H. Considering Emission Treatment for Energy-Efficiency Improvement and Air Pollution Reduction in China’s Industrial Sector. Sustainability 2018, 10, 4329. [Google Scholar] [CrossRef]
- Tmxmoney. Available online: https://www.tmxmoney.com/en/index.html (accessed on 29 September 2018).
- Top 100 banks in the world. Available online: https://www.relbanks.com (accessed on 28 September 2018).
- Tone, K. A slacks-based measure of super-efficiency in data envelopment analysis. Eur. J. Oper. Res. 2002, 143, 32–41. [Google Scholar] [CrossRef] [Green Version]
- Li, Y.; Wang, Y.Z.; Cui, Q. Energy efficiency measures for airlines: An application of virtual frontier dynamic range adjusted measure. J. Renew. Sustain. Energy 2016, 8. [Google Scholar] [CrossRef]
- Li, F. Endogeneity in CEO power: A survey and experiment. J. Investig. Anal. 2016, 45, 149–162. [Google Scholar] [CrossRef]
- Dang, C.Y.; Li, Z.C.; Yang, C. Measuring firm size in empirical corporate finance. J. Bank. Financ. 2018, 86, 159–176. [Google Scholar] [CrossRef]
Figure 1.
Research processes.
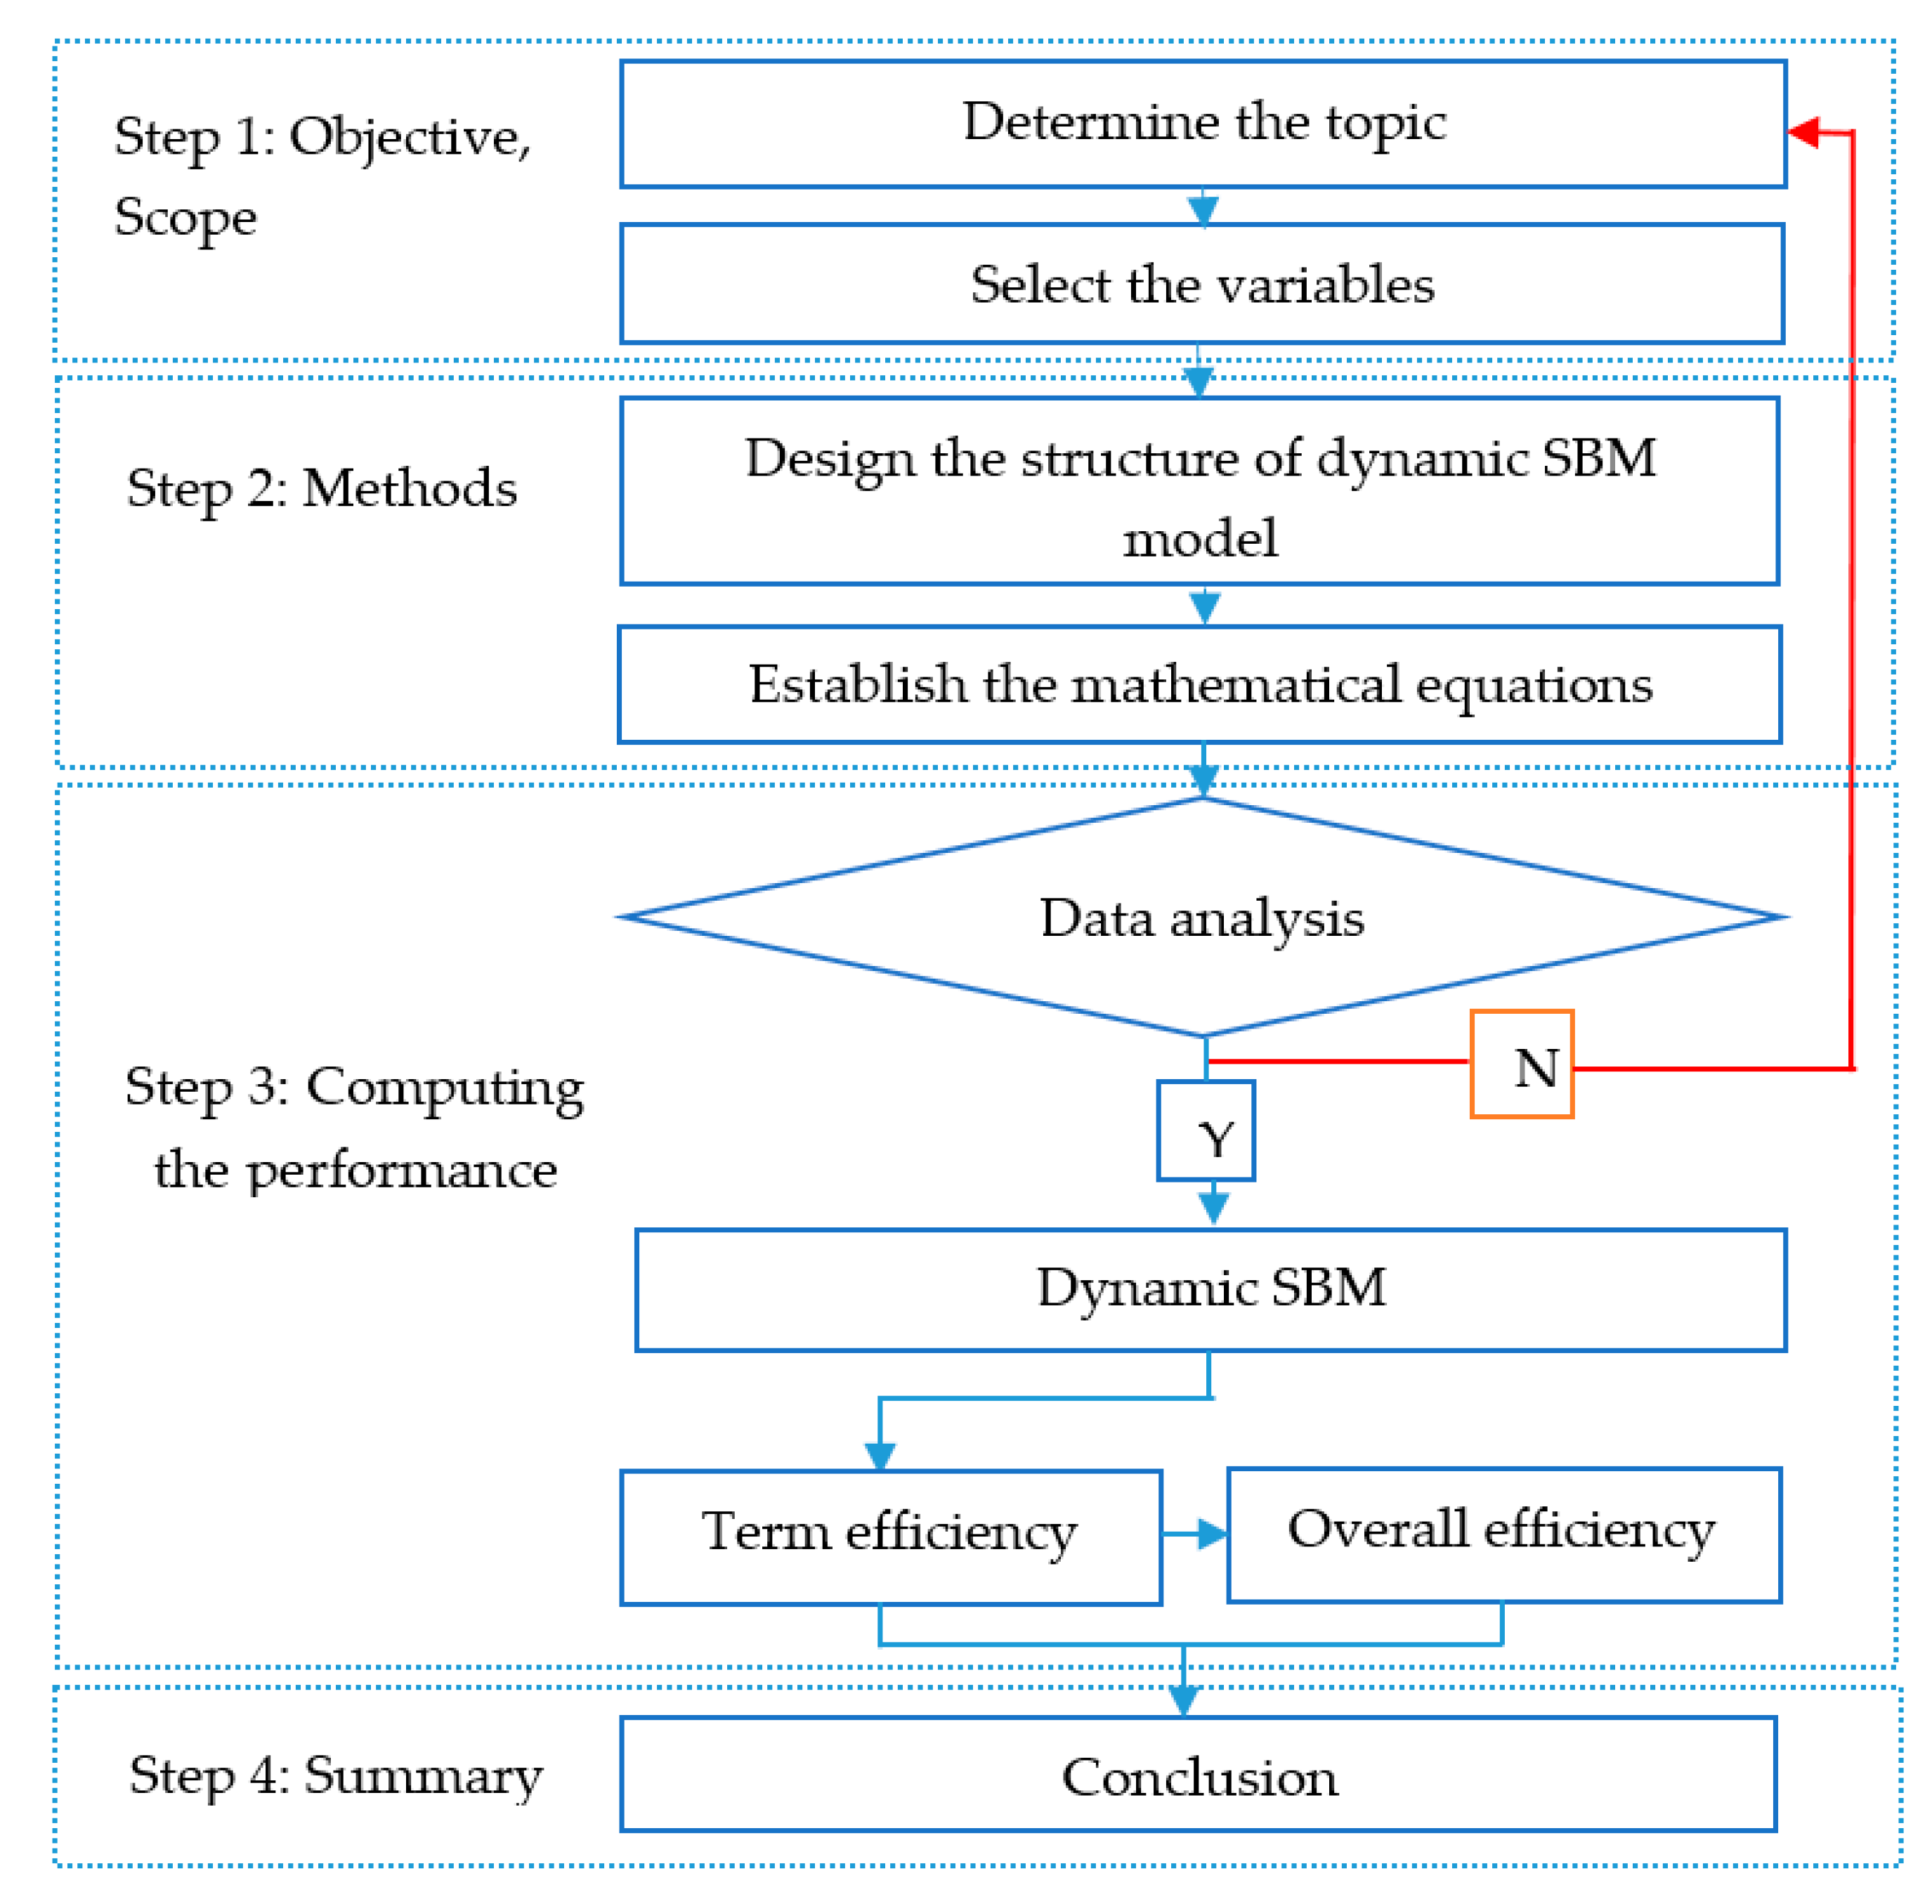
Figure 2.
Dynamic structure among link, inputs, and output.
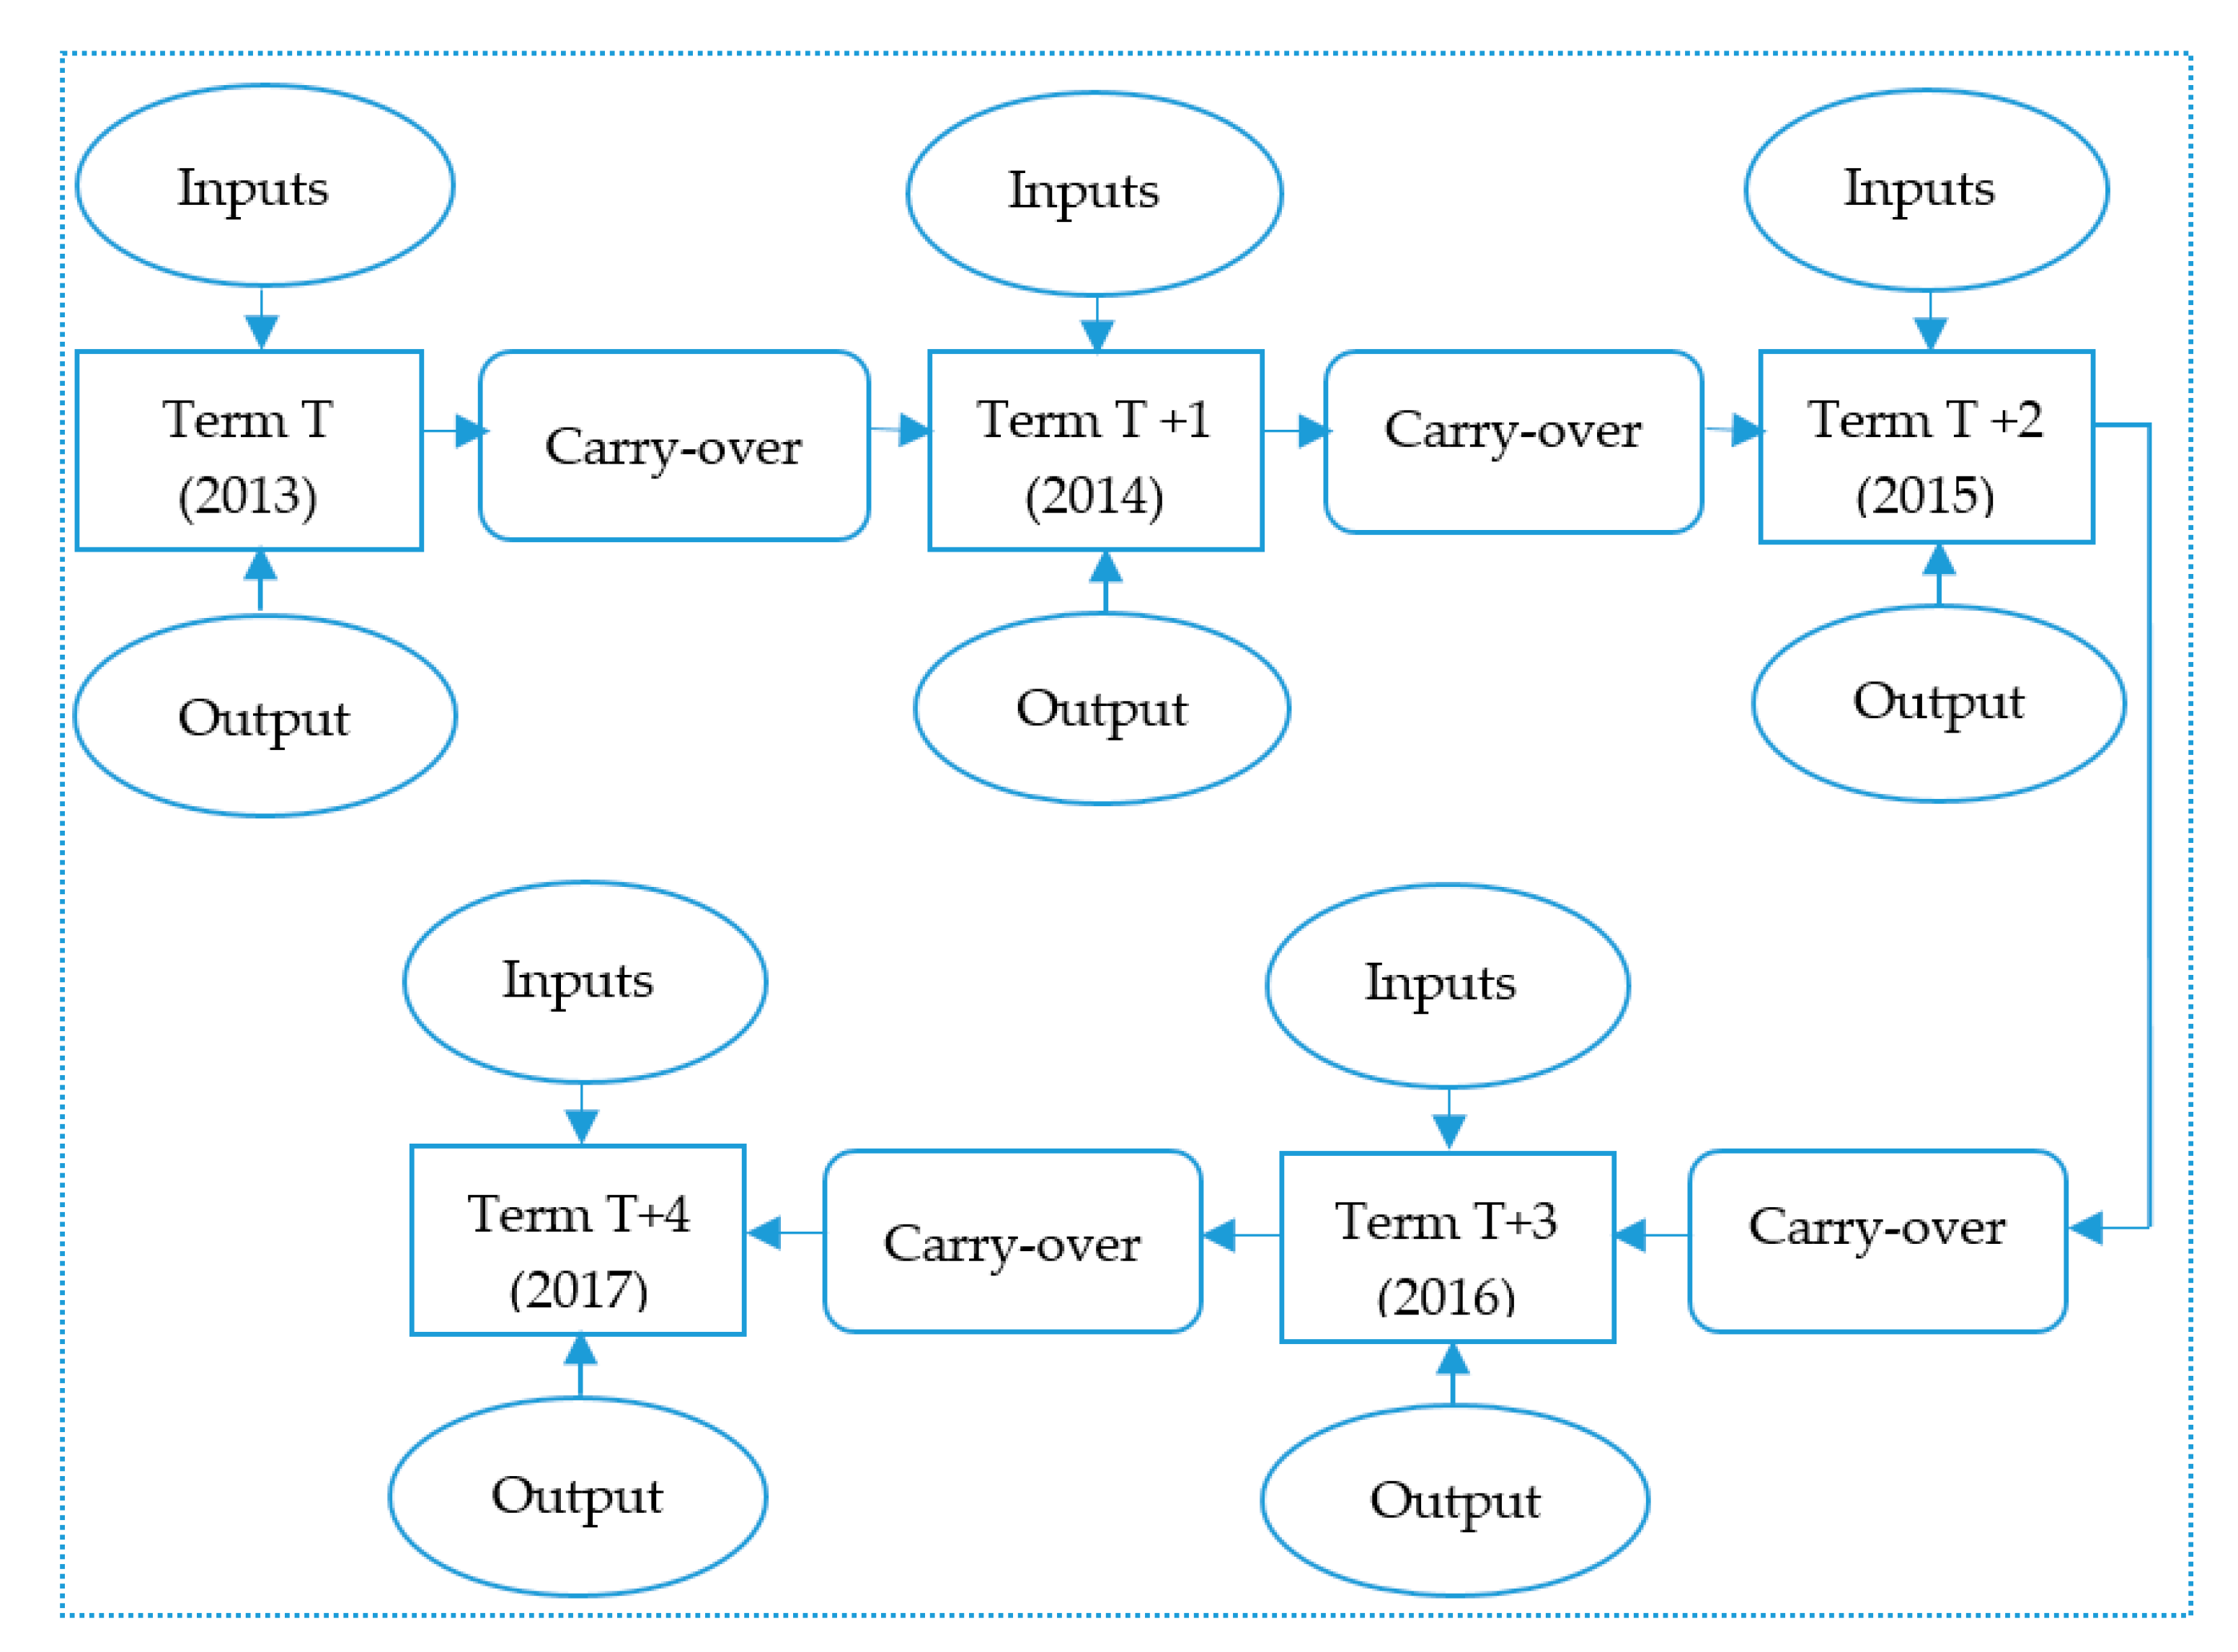
Table 1.
List of 18 large banks all over the world.
| No. | Name of Banks | Code of Banks | Head Quarter |
|---|---|---|---|
| 1 | Industrial and Commercial Bank of China Ltd. | IDCBY | Hong Kong |
| 2 | China Construction Bank Corp | CICHF | China |
| 3 | Agricultural Bank of China | ACGBF | Hong Kong |
| 4 | Bank of China Ltd. | BACHF | China |
| 5 | HSBC Holdings | HSBC | UK |
| 6 | JPMorgan Chase & Co | JPM | USA |
| 7 | BNP Paribas | BNPQF | France |
| 8 | Bank of America Corporation | BAC | USA |
| 9 | Deutsche Bank AG | DB | Germany |
| 10 | Barclays PLC | BCLYF | UK |
| 11 | Citigroup INC | C | USA |
| 12 | UBS Group AG | UBS | Switzerland |
| 13 | ING Group NV | ING | Netherlands |
| 14 | Intesa Sanpaolo | IITSF | Italy |
| 15 | Danske Bank | DNSKF | Denmark |
| 16 | Shinhan Financial Group Co Ltd. | SHG | Korea |
| 17 | DBS Group Holdings Ltd. | DBSDF | Singapore |
| 18 | Itau Unibanco Banco Holding | ITUB | Brazil |
Table 2.
Efficiency of large banks during the period of 2013–2017.
| DMU | Overall Score | Rank | Term Efficiency | ||||
|---|---|---|---|---|---|---|---|
| 2013 | 2014 | 2015 | 2016 | 2017 | |||
| IDCBY | 0.8221 | 6 | 0.8052 | 0.8387 | 0.8473 | 0.7973 | 0.8244 |
| CICHF | 0.958 | 5 | 0.9393 | 0.9643 | 0.9954 | 0.9670 | 0.9286 |
| ACGBF | 1.0000 | 1 | 1.0000 | 1.0000 | 1.0000 | 1.0000 | 1.0000 |
| BACHF | 0.8106 | 7 | 0.8042 | 0.8092 | 0.8173 | 0.8401 | 0.7850 |
| HSBC | 0.5801 | 8 | 0.5255 | 0.5951 | 0.6446 | 0.6654 | 0.5043 |
| JPM | 0.5013 | 11 | 0.4789 | 0.5101 | 0.5378 | 0.4711 | 0.5120 |
| BNPQF | 1.0000 | 1 | 1.0000 | 1.0000 | 1.0000 | 1.0000 | 1.0000 |
| BAC | 0.5144 | 10 | 0.5153 | 0.5208 | 0.5528 | 0.4747 | 0.5184 |
| DB | 0.3235 | 16 | 0.3558 | 0.3198 | 0.3519 | 0.3162 | 0.2939 |
| BCLYF | 0.461 | 13 | 0.5401 | 0.4043 | 0.5283 | 0.5010 | 0.3924 |
| C | 0.5738 | 9 | 0.5672 | 0.6130 | 0.6760 | 0.5156 | 0.5389 |
| UBS | 0.2954 | 17 | 0.2830 | 0.3050 | 0.3147 | 0.2839 | 0.2929 |
| ING | 0.3432 | 15 | 0.3283 | 0.2944 | 0.3504 | 0.3498 | 0.3919 |
| IITSF | 1.0000 | 1 | 1.0000 | 1.0000 | 1.0000 | 1.0000 | 1.0000 |
| DNSKF | 0.2591 | 18 | 0.2747 | 0.2739 | 0.2758 | 0.2277 | 0.2578 |
| SHG | 0.496 | 12 | 0.4935 | 0.5199 | 0.5263 | 0.4332 | 0.5241 |
| DBSDF | 0.4354 | 14 | 0.3813 | 0.4222 | 0.4344 | 0.4579 | 0.4727 |
| ITUB | 1.0000 | 1 | 1.0000 | 1.0000 | 1.0000 | 1.0000 | 1.0000 |
Table 3.
Classification of overall score.
| Overall Score | Excellent (1) | Good (7–9.9) | Median (5–6.9) | Low (3–4.9) | Very Low (0–2.9) |
|---|---|---|---|---|---|
| No. DMUs | 4 | 3 | 4 | 5 | 2 |
© 2019 by the authors. Licensee MDPI, Basel, Switzerland. This article is an open access article distributed under the terms and conditions of the Creative Commons Attribution (CC BY) license (http://creativecommons.org/licenses/by/4.0/).
Share and Cite
MDPI and ACS Style
Wang, C.-N.; Luu, Q.-C.; Nguyen, T.-K.-L.; Day, J.-D. Assessing Bank Performance Using Dynamic SBM Model. Mathematics 2019, 7, 73. https://doi.org/10.3390/math7010073
AMA Style
Wang C-N, Luu Q-C, Nguyen T-K-L, Day J-D. Assessing Bank Performance Using Dynamic SBM Model. Mathematics. 2019; 7(1):73. https://doi.org/10.3390/math7010073
Chicago/Turabian StyleWang, Chia-Nan, Quoc-Chien Luu, Thi-Kim-Lien Nguyen, and Jen-Der Day. 2019. "Assessing Bank Performance Using Dynamic SBM Model" Mathematics 7, no. 1: 73. https://doi.org/10.3390/math7010073
Note that from the first issue of 2016, this journal uses article numbers instead of page numbers. See further details here.