Article

Causality Effects of Interventions and Stressors on Driving Behaviors under Typical Conditions

1
Department of Statistics, Texas A&M University, College Station, TX 77843, USA
2
Departments of Visualization & Computer Science and Engineering, Texas A&M University, College Station, TX 77843, USA
3
Computational Physiology Lab, University of Houston, Houston, TX 77004, USA
*
Author to whom correspondence should be addressed.
Mathematics 2018, 6(8), 139; https://doi.org/10.3390/math6080139
Submission received: 13 July 2018 / Revised: 9 August 2018 / Accepted: 12 August 2018 / Published: 14 August 2018
(This article belongs to the Special Issue Human-Computer Interaction: New Horizons)

Abstract

:
In this paper, we demonstrate that interventions and stressors do not necessarily cause the same distractions in all people; therefore, it is impossible to evaluate the impacts of interventions and stressors on traffic accidents. We analyzed publicly available multimodal data that was collected through one of the largest controlled experiments on distracted driving. A crossover design was used to examine the effects of actual and perceived interventions and stressors in driving behaviors and parallel designs on reactivity to a startling event. To analyze this data and make recommendations, we developed and compared a wide variety of mixed effects statistical models and machine learning methods to evaluate the effects of interventions and stressors on driving behaviors.

1. Motivation

Distracted driving has gained attention, especially after the introduction of smart-phones [1]. Many states in the United States have already introduced hand-free laws [2] to decrease possible fatalities, since it is now widely viewed that distracted driving is an important problem that leads to injuries and fatalities. Despite this overwhelming social consensus, it is hard to develop statistically sound evidence that distracted driving, in fact, causes accidents. Even if we certainly know that distracted driving causes accidents, it is still hard to identify what kind of interventions or stresses cause distractions and what kind of distractions cause traffic accidents, injuries, and fatalities. A conceptual framework was proposed [3] which incorporates an individual’s driving style with driving habits, social norms, and cultural values. Sagberg et al. [3] also reviewed driving styles and road safety and the individual and socio-cultural factors that influence driving styles.
While driving simulators allow for the examination of a range of driving performance measures in a controlled and safe driving environment, no single driving performance measure can capture all effects of distraction [4] and driver distraction is a multidimensional phenomenon. Virtual simulations have been designed and used to study the effects of interventions (or stressors) on distracted driving [5,6,7]. Most of these works have mainly studied the impacts of the interventions and stress on changes in the driver’s breath and heart rate in addition to lane deviation with mostly simple statistical methods. Taggart demonstrated that driving in dense, fast-moving traffic raised the heart rate from the resting range of 70–85 to 100–140 beats per minute regardless of age [5]. Casali demonstrated that the breath rate erratically changes when the driver is agitated or distracted [6]. Jibo et al. found out that cognitive load reduces the variability in the lane position of drivers [7].
There is, therefore, a growing consensus that replacing human drivers with robot drivers (i.e., autonomous cars) could dramatically reduce traffic accidents and provide significant savings in productivity lost and accident-related costs [8,9]. Even in 2006, Miller et al. indicated that humans are poor drivers and that robots should be given a turn at the wheel [10]. There has been a number of government reports [11,12,13,14] that attribute the majority of traffic accidents to human error, although the oft-cited 93% can be an exaggeration as Smith [15] indicated.
Robot drivers are expected to be better than human drivers for three reasons: they have superior (1) sensory and (2) computational powers, and they demonstrate (3) rational behavior [9]. Robots have super-human sensory powers such as spherical vision, dark vision, and non-visual sensors. Moreover, they have superior computational power since they can rely on much faster signal transmission and processing. They can react and decide faster than humans; it has been shown by studies that humans’ reaction speed is limited to about 1.5 s, which translates to 37 m—about 120 feet—at highway speeds [16,17]. Humans, in addition, can potentially be irrational; they can retaliate against others, text, talk on the phone, put make up on, fall asleep at the wheel, or solve math problems, which can distract them and can further reduce their reaction times [8,9].
To make this problem more complicated, human and robot drivers are not viewed equally under current law practice. Greenblatt observed that we apply design-defect laws for robots, and we apply ordinary negligence laws for humans [9]. Therefore, in current practice, a robot driver will be held liable even under circumstances where a human driver who took the same actions would not be held liable [9]. To change current laws, Greenblatt further indicated that there is a need for convincing arguments to treat robot and human drivers equally [9].
Despite the sound-looking arguments presented in different studies that we stated earlier, it is still hard to formally prove that rational and super-power robots would cause fewer accidents than humans, even though the claim of the irrationality of the human driver is not strongly based from causality point of view [18,19,20]. Pearl, the founder of causality, exactly pointed out this issue in a recent interview by observing that “[robots] need a model of the underlying causal factors [to be comparable with human intelligent]” [21]. Although studies have suggested that the majority of traffic accidents are due to human error, we do not have clear expectations of what kind of advances in the power of robot drivers are needed to consider autonomous cars to be safer than human-driven cars [22]. Research on distracted driving could probably provide an insight into problems related to causality.
These causality problems are important, especially for the development of appropriate policies and laws to reduce traffic-related injuries and fatalities for both robot and human drivers [23,24]. Since we do not currently monitor all actions of human drivers or have solid data for robot drivers, it is hard to study either of these two problems [20]. Some car companies, such as Jaguar, are planning to monitor the brainwaves, breath, and heart rate of human drivers during driving to identify if a driver is tired or distracted [25]. Such data could eventually be used to directly evaluate the impact of human distraction during driving on traffic accidents, injuries, and fatalities.
Note that the results in refs. [4,5,6,7] do not demonstrate a causality relationship between distracted driving and traffic accidents. They only demonstrate that there is a correlation between interventions and indications of distractions such as the driver’s heart rate. In other words, we have no clear evidence towards the existence of some possibility that distracted driving causes traffic accidents. If there really exists a causality relation, this is really a significant problem for policymakers and lawmakers, since they cannot convince the public to develop appropriate policies to reduce traffic-related injuries and fatalities. Therefore, there is a need for more scientific studies with advanced statistical or machine learning methods that can provide some satisfactory answer to the public.

2. Introduction

In this work, we provide a scientific study with advanced statistical and machine learning methods to explain the relation between distracted driving and traffic accidents and to provide some illumination to this causality problem. Our statistical analysis is based on one of the most detailed studies on distracted driving that was obtained by virtual simulations [26]. This study provides a significantly large multimodal dataset that includes a no distraction (ND) drive and three type of distracted drives: driving under cognitive, emotional, and sensorimotor interventions (or stressors). See Figure 1 for representative scenes of virtual simulations of no distraction and distracted drives. This dataset provides recorded observations that enable modeling and detailed analysis of the effects of interventions on driving. We, therefore, were able to evaluate the data with a wide variety of advanced statistical techniques, including mixed effects statistical models and machine learning methods.
In the rest of the paper, we avoid using the term “distracted driving”, since it is not a neutral term to define the effect of interventions. The workload is another related term that was developed to evaluate human performance by Hart and Wickins [27,28], according to our research in related fields. Instead, we prefer to use the term “stressor”, since interventions are also called stressors [29]. Normal driving already introduces stress to human drivers. Any cognitive, emotional, or sensorimotor intervention or stressor is expected to increase this stress [30,31]. In other words, distracted driving is better to be called driving with increased stress. Our analysis of driving with increased stress deals mainly with answering two types of questions: (1) Which type of interventions and stressors increase stress? (2) Which type of interventions and stressors cause poorer driving performance.
We introduce an explanatory and model-based analysis to demonstrate that the same intervention does not necessarily affect every driver’s stress level in the same way. We further observe that this is really independent of gender or age. The same intervention that increases the stress level of some people does not increase the stress level of others. This result is actually expected based on other studies [27,28,32]. For instance, mental tasks that cause changes in the cognitive load used in this experiment include subtracting two numbers. This is not really an important stress for people who are good at number crunching. On the other hand, it can be a significant stress for people who rely on a calculator for even simple calculations. Therefore, it is not surprising that stress is not correlated with interventions, gender, or age. We observe that there is some correlation between breathing and heart rate with age, which can be explained by the fact that our physiological abilities diminish with age.
This is clearly not good news for policymakers who may want to apply the same criteria for everybody. Our results suggest that every individual is different and it is not possible to develop umbrella policies that apply to all human drivers. Therefore, instead of focusing on interventions, it may be better to focus on physiological stress which may correlate with the driver’s performance. Monitoring brainwaves, breath, and heart rate during driving to identify if the driver is tired or distracted, as planned by some car companies [25], could be an effective tool to identify actual driving performance. Collecting such big data will especially be useful to directly evaluate the real impacts of the physiological workload on driving performance and accidents, injuries, and fatalities. It could, then, be possible to develop methods to counter the effects of physiological stress.
It is also important to note that our results do not indicate that increased stress does not necessarily cause traffic accidents. We still strongly believe that most traffic accidents are caused by increased stress (also called distracted driving). Our results simply suggest that interventions do not necessarily cause the same impact of stress on all drivers; therefore, it is impossible to evaluate the impact of stress on traffic accidents.
The rest of the paper is organized as follows. In the next section, we discuss the basic details of the publicly available multimodal dataset and issues related to formatting and data loading. In addition, we briefly explain the data processing process. In Section 4, we provide our analysis and discuss our results. Section 5 presents the discussion, conclusions and future work.

3. The Dataset

In this paper, we used a publicly available dataset which was obtained as a result of controlled experiments on distracted driving using the driving simulator shown in Figure 2 [26,33,34]. For these controlled experiments, the subjects were recruited from a local community (population about 250,000) through email solicitations and flier postings. All subjects had a valid driving license and had normal or corrected to normal vision. The admission was restricted to individuals with at least one and a half years of driving experience who were between 18 and 27 years of age (young) or above 60 years of age (old). If the subjects were on medications affecting their ability to drive safely, they were excluded. Seventy-eight subjects, after the inclusion-exclusion criteria, volunteered for the study, whereas one subject quit in the middle of the experiment because of motion sickness, and 9 subjects were not recorded properly due to technical issues. That is why 68 subjects completed the experiment. The age and gender composition of the analyzed dataset was balanced for male and female and also for the young and old cohorts. For more details about this dataset, please refer ref. [33].
To obtain the observations for this multimodal dataset, 68 volunteers drove on the same highway under four different conditions: no distraction (ND), cognitive distraction (CD), emotional distraction (ED), and sensorimotor distraction (MD) (See Figure 1 and Figure 2). The experiment closed with a special driving session, in which all subjects experienced a startle stimulus in the form of an unintended acceleration—half of them under a mixed distraction and the other half in the absence of a distraction. This last special driving session was called failure drive (FD). During the experimental drives, key response variables and several explanatory variables were continuously recorded. The variables in the collected data included speed, acceleration, brake force, steering, lane position signals, perinasal electrodermal activity (EDA), palm EDA, heart rate, breathing rate, and facial expression signals as well as eye tracking data. This dataset enables research into driving behaviors under neatly abstracted distracting stressors. In this work, we used the variables that have been found to be important in the literature or have been statistically shown to be important, so not all drives or variables were used for our analyses.

3.1. Two Controlled Experiments in Failure Drive

Two different controlled experiments were run using the driving simulator to obtain this multimodal dataset, as explained in references [26,33,34]. Experiment 1 was based on a crossover design repeated measures design, such that each experimental unit (subject) received different treatments (stressor) during the different time periods. This experiment was not statistically sound, as multiple applications of the startle would have incurred diminishing physiological or emotional responses to the frequently repeated stressor. This is why Experiment 2 followed a parallel group design which is a better alternative and is called a non-crossover or between subject design. In parallel group design, the stressors are applied simultaneously to separate groups of subjects, whereas in a crossover design, each subject gets the stressors in sequence.
Experiment 1 has followed a crossover design where all subjects underwent all treatments, including stress-free driving (control), on the same segment of highway and in similar traffic/weather conditions. This provided data for all four drives (ND, CD, ED, and MD). The distraction order was randomized to improve the practice effect. The purpose was to account for intra-individual differences.
Experiment 2 followed a parallel group design, with nearly half of the subjects assigned to the non-loaded group, while the other half were assigned to the loaded group; both groups followed the same itinerary under similar traffic/weather conditions. The non-loaded group had a stressor-free drive throughout the itinerary, towards the end of which they experienced the startling event. The loaded group had a stressor-free drive only in the first portion of the itinerary; in the second portion of the itinerary, the loaded group subjects were experiencing a strong stressor of mixed nature. As in the case of the non-loaded group, the startling event took place towards the end of the itinerary, and this time, the mixed stressor was in effect. In other words, only two types of drives were provided: ND, now called non-loaded drive, and all others, i.e., CD, ED, and MD were called loaded drives.
In both experiments, towards the end of the drive, all subjects had to wait at a red light at an intersection. Prior to the green signal, a vehicle malfunction resulted in an unintended acceleration incident, propelling the car forward and putting it on a collision course with another car that had entered the intersection.

3.2. Data Loading and Formatting

The multimodal dataset included baseline (BL), practice drive (PD), relaxing drive (RD) and failure drive (FD: Experiment 1 and also in 2) conditions [33], but we only used the data from the failure drive, as we found it more interesting. The drives—normal or no distraction drive (ND), cognitive drive (CD), emotional drive (ED) and sensorimotor drive (MD) were randomized and blocked by gender and age groups in Experiment 1. In Experiment 2, the failure drive was based on FDL (loaded) and FDN (non-loaded) [33].
Data for all physiological and performance variables were obtained for all driving sessions for each participant (when available) from the R-Friendly Study dataset published by the authors on their data site [33]. R [35] is a programming language and free software environment for statistical computing and graphics that is supported by the R Foundation for Statistical Computing and was used in this study. There were neither heart rate, nor breathing rate data available for the failure drive (FD) for two of the 68 subjects (subjects 32 and 88), and no performance variable data for two other subjects (subjects 2 and 34), so the other subjects’ data were used for analyses.
CERT software (Version 1, Machine Perception Laboratory - University of California, San Diego, CA, USA) [36] was used to record facial expressions (anger, contempt, disgust, fear, joy, sad, surprise, neutral) of the subjects during each of the driving sessions. Facial expression signals (FACS) were reported in the structured data directory of the data site [33], and were not available in the R-Friendly Study dataset. The facial expression signals were extracted for all participants for the failure drive (when available) and merged with the physiological and performance variables. Facial expression signals were not available in three of the 68 subjects (subjects 45, 46 and 68). Given the data availability from the different sets, there was a complete final dataset for 60 of the 68 subjects.

3.3. Data Processing

Although the raw data seemed to have been cleaned, there was still a significant number of outliers for most of the variables (given the valid ranges provided). Outliers were removed and normality was visually assessed in the “cleaned” variables (See Figure 3b). No outliers were removed from the FACS variables given that they had been normalized. Using histograms and normal reference plots, it was determined that heart rate, breathing rate, and lane offset were approximately normally-distributed (See Figure 3b) in both experiments.
Transformations were not very effective for the other variables as they were highly skewed. We decided to move forward with heart rate, breathing rate, and lane offset as response variables in both experiments. All original variable names were preserved. The subjects, interventions, stressor types (ND, MD, CD, ED in Experiment 1 and FDL vs. FDN in Experiment 2) and facial expressions as a result of FD which involves FDL and FDN in Experiment 2 were used. Because of the overwhelming disgust facial expression signal, it was necessary to look at different clusters dominated by different signals. To determine the clusters, we used the Hiearchical Cluster Analysis (HCA) [37], and the results of the HCA are discussed in Section 4. We need to emphasize that the inclusion of the facial expressions created more interesting data for Experiment 2; however, Experiment 1 was still important to allow us to draw sound conclusions.
Before moving into modeling and prediction, it was also useful to look at the effects of gender, age, and distmode (stressors) on the heart rate, breathing rate, and lane offset. The box plots from Experiment 1 (See Figure 4a) show that (i) females and males do not seem to differ much in their breathing rate behaviour but seem to behave in opposite directions for heart rate and lane offset; (ii) there seem to be differences between old and young individuals whereby the direction of the difference in lane offset was reversed compared to the other two; and (iii) among the loaded drives, sensimotor drives consistently showed slightly higher values than the other three distractors. The box plots from Experiment 2 (See Figure 4b) show that (i) females and males do not seemed to differ much in their behaviors for all variables; (ii) there seem to be differences between old and young individuals whereby the direction of the difference in lane offset was reversed compared to the other two; and (iii) among the drives, loaded drives consistently showed higher values than non-loaded drives, and the difference lwas larger for heart rate.

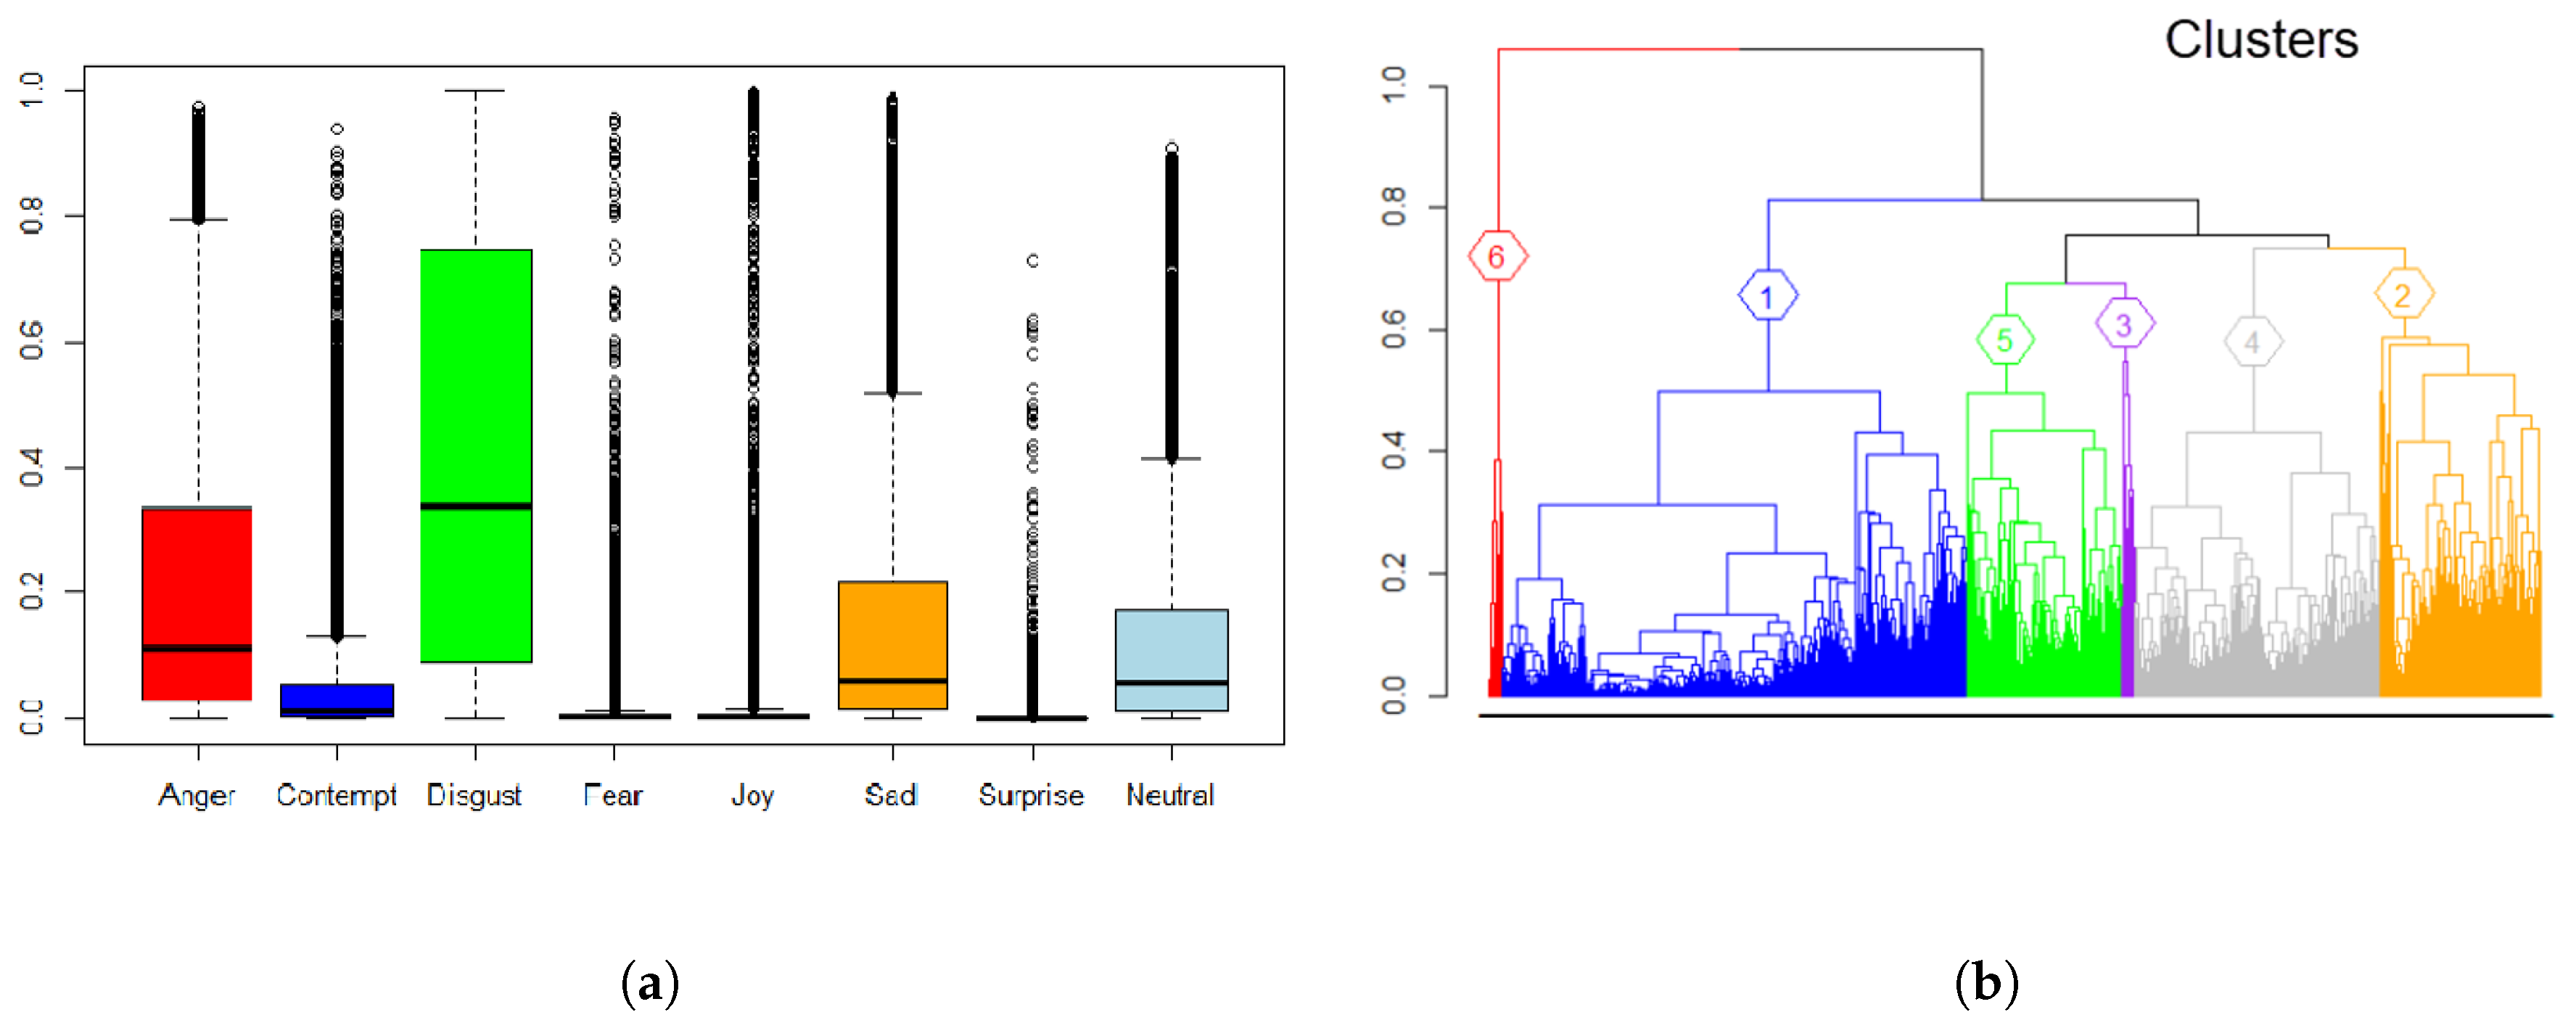
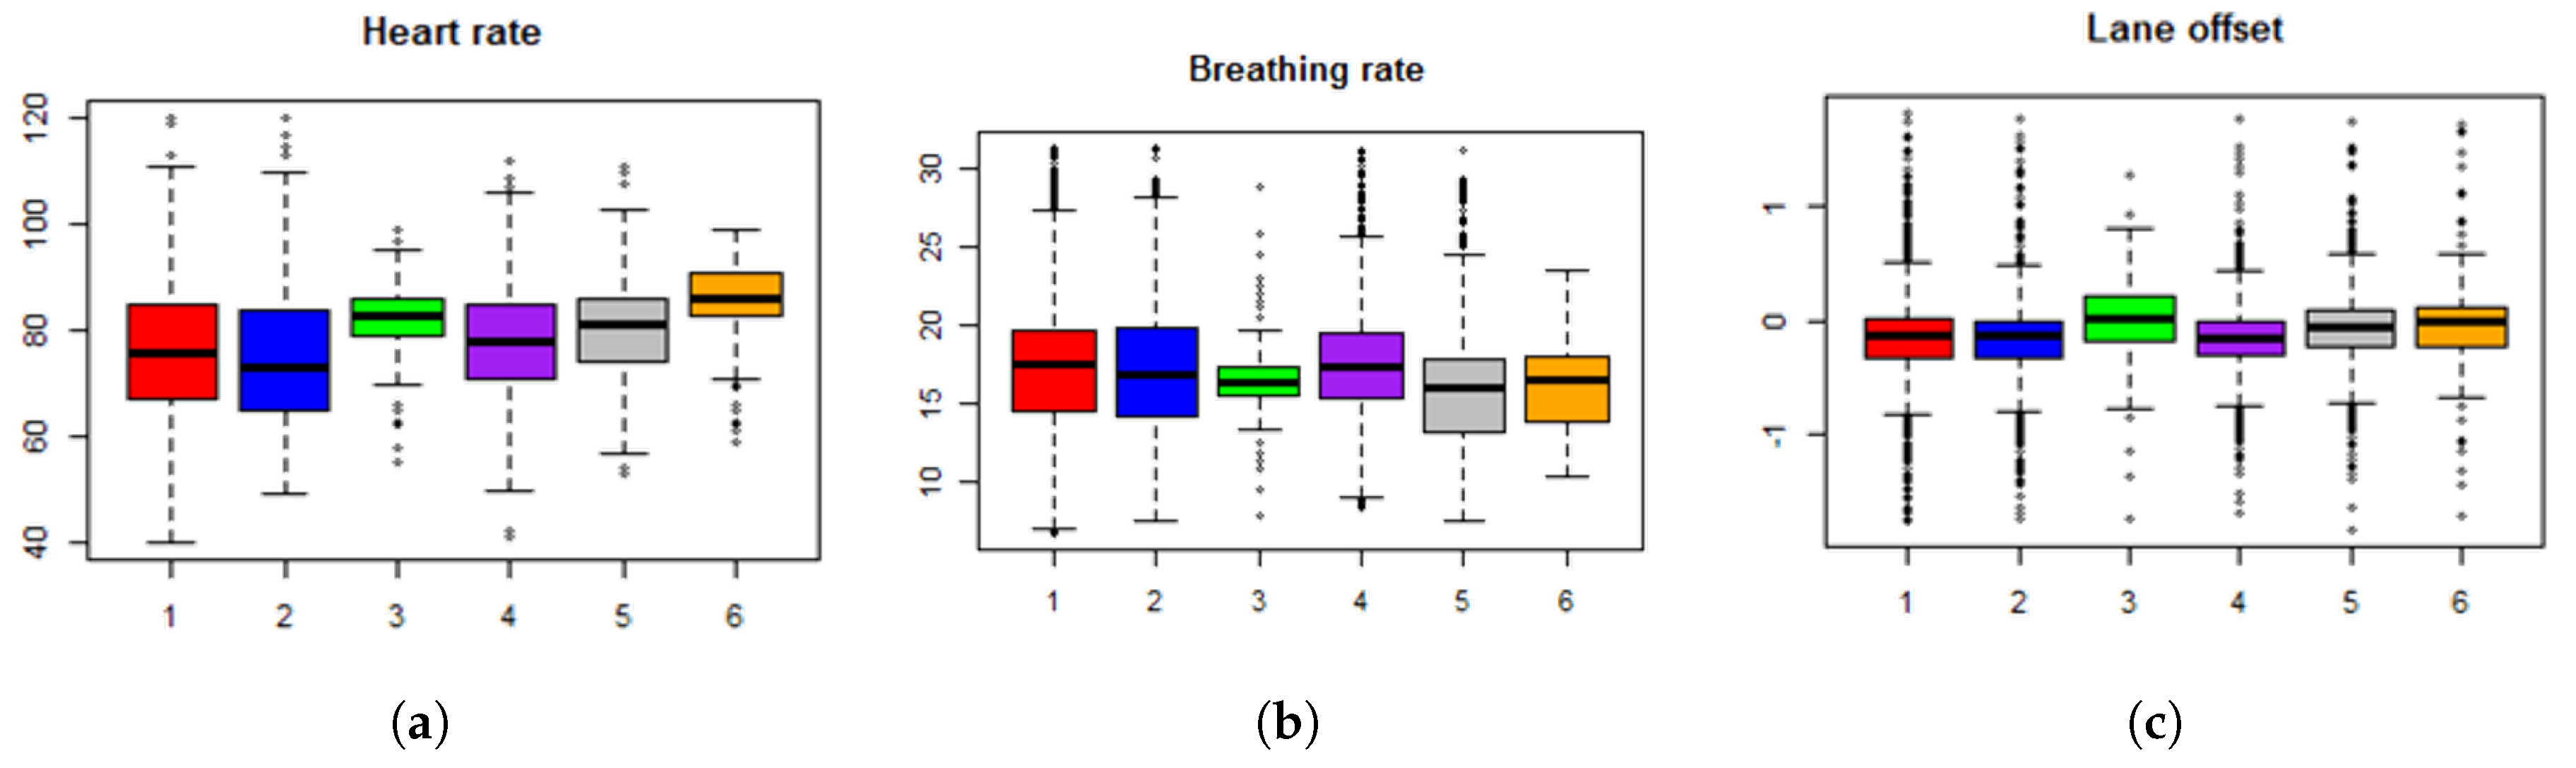
4. Analysis and Results

In this section, we provide the analysis and results. In the first and second subsections, we present the statistical analyses of Experiment 1 and Experiment 2, respectively.

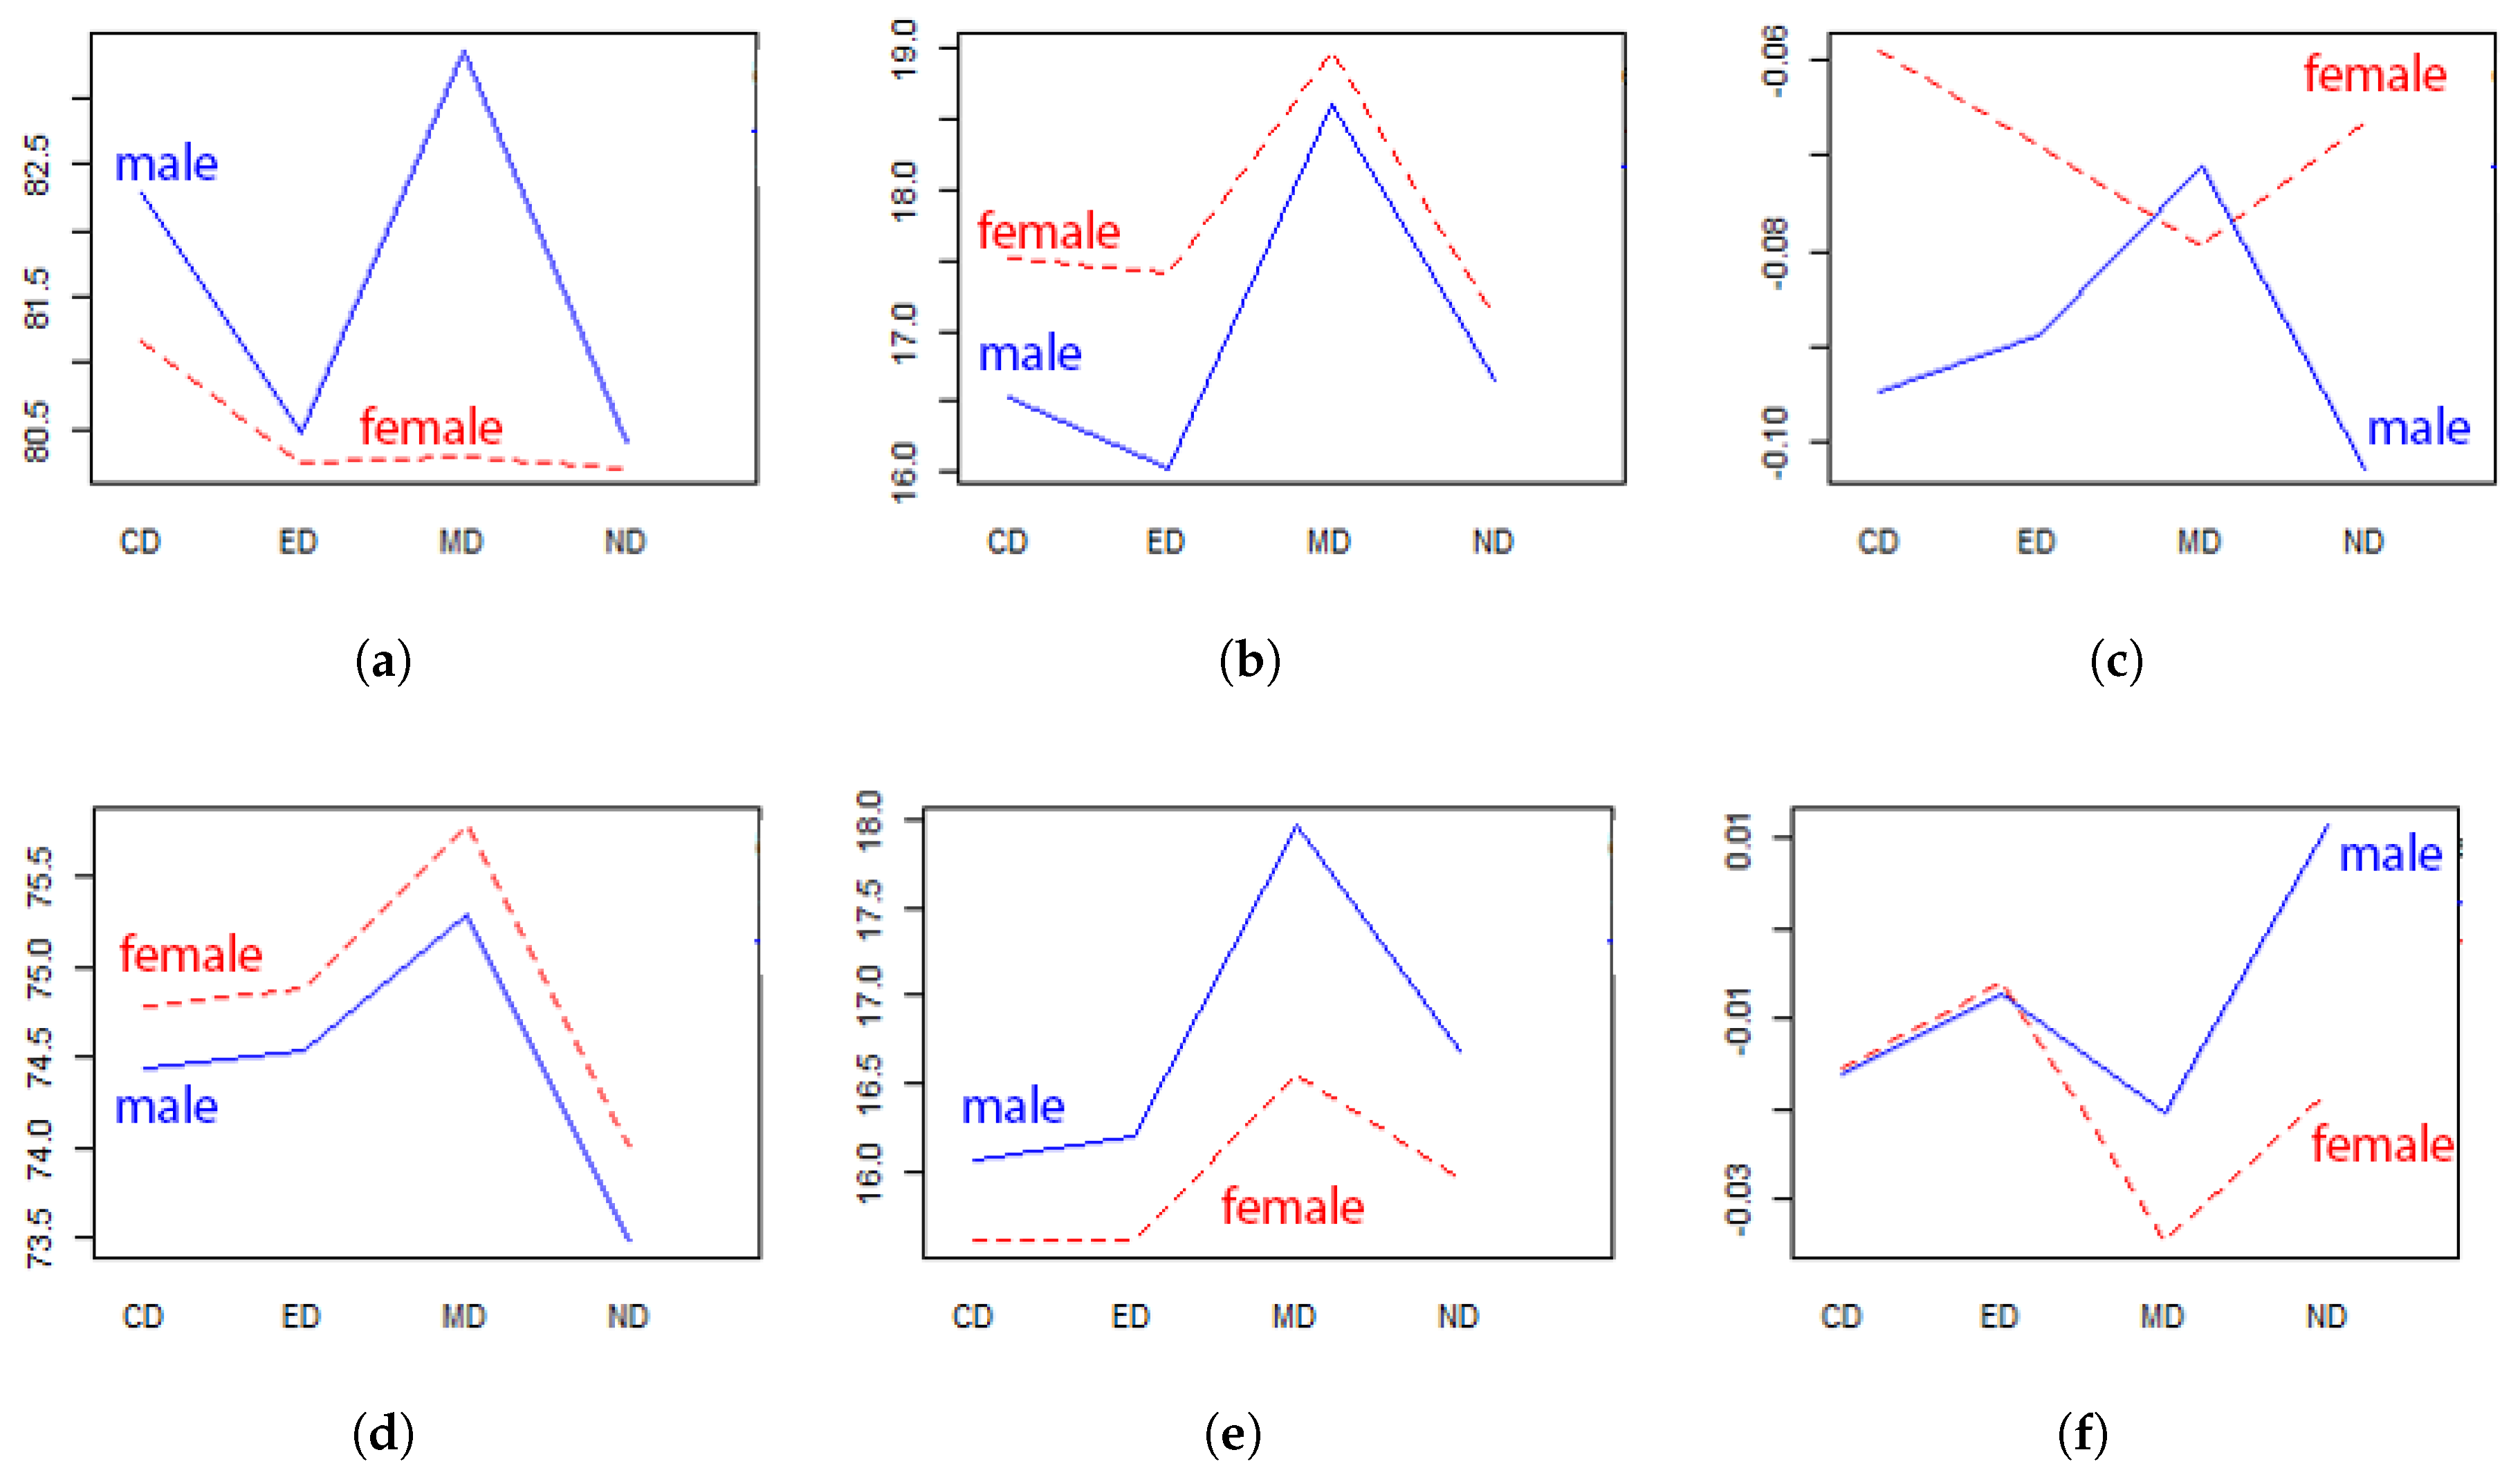
4.1. Advanced Mixed Effect Analysis of Experiment 1

We previously looked at the explanatory data analysis and behaviour of the variables with gender, age, and stressors in the earlier sections. In this section, we explain the advanced linear mixed effect model to predict changes in lane offset, breath, and heart rate. The linear mixed effects model that we have used in this case has the following form:
y i j k l m = μ + α i + b j ( i ) + γ k + τ d ( i , k ) + ζ l + ξ m + ( τ ξ ) d m + ( τ ζ ) d l + ( ζ ξ ) l m + ( τ ζ ξ ) d l m + ϵ i j k l m
where y represents the heart rate or breath rate or lane offset depending on the model. α , b, γ , τ , ζ , ξ , and ϵ are the notations for the sequence of drives, drivers nested in sequences, time period, interference, age group (young or old), gender (male or female), and random error, respectively. There were two-way and three-way interactions in which the notations were combined. Subscripts ( i , j , k , d , l , m ) refer to the number of levels or observations depending on whether the related variable included the observations or groups (levels). We included the interactions to demonstrate if the results changed jointly depending on the stressors, age, and gender.
The random sequence of drives for all subjects explained the variability in the model six times more than unexplained variability according to significant (95% confidence level) model for heart rate. This gives us some kind of assurance to indicate that we successfully eliminated any possible biases that may have arisen in the experiment causing us to incorrectly draw conclusions.
The interactions between gender, age, and interference types in predicting the lane offset, breath, and hearth rate were also found to be significant (95% confidence level) model. These interactions were even more significant (smaller probability of finding more extreme results when the joint effect was not there) in breath and heart rates compared to lane offset. In the explanatory data analysis shown in Figure 4a, MD was associated with a slightly higher median breath rate compared to ND, CD, ED, whereas the median of MD was similar to the others in regard to heart rate and lane offset. This advanced statistical model show the same effects of stress in different age groups and genders.
We also confirmed the explanatory data analysis results shown in Figure 5 with the model relationship. Both results indicated many inconsistencies that do not suggest causal relationships. We know list some of these inconsistencies. Figure 5a shows that the mean heart rate of young females did not increase during texting. In other words, the stress of young females stayed the same while texting, which is counterintuitive. It is even more interesting that the stress for young males increased texting during the MD drive. At the same time, Figure 5b further shows that stress decreased for young males during the ED drive. Similarly, for both old females and males, stress decreased during ED, as shown Figure 5e. To make matters worse, the driving performances of both young and old drivers, as shown in Figure 5c,f, seem to be inconsistent which suggests they are independent of the interventions. These observations further demonstrate the difficulty of proving causality relationships between interventions and driving performance.

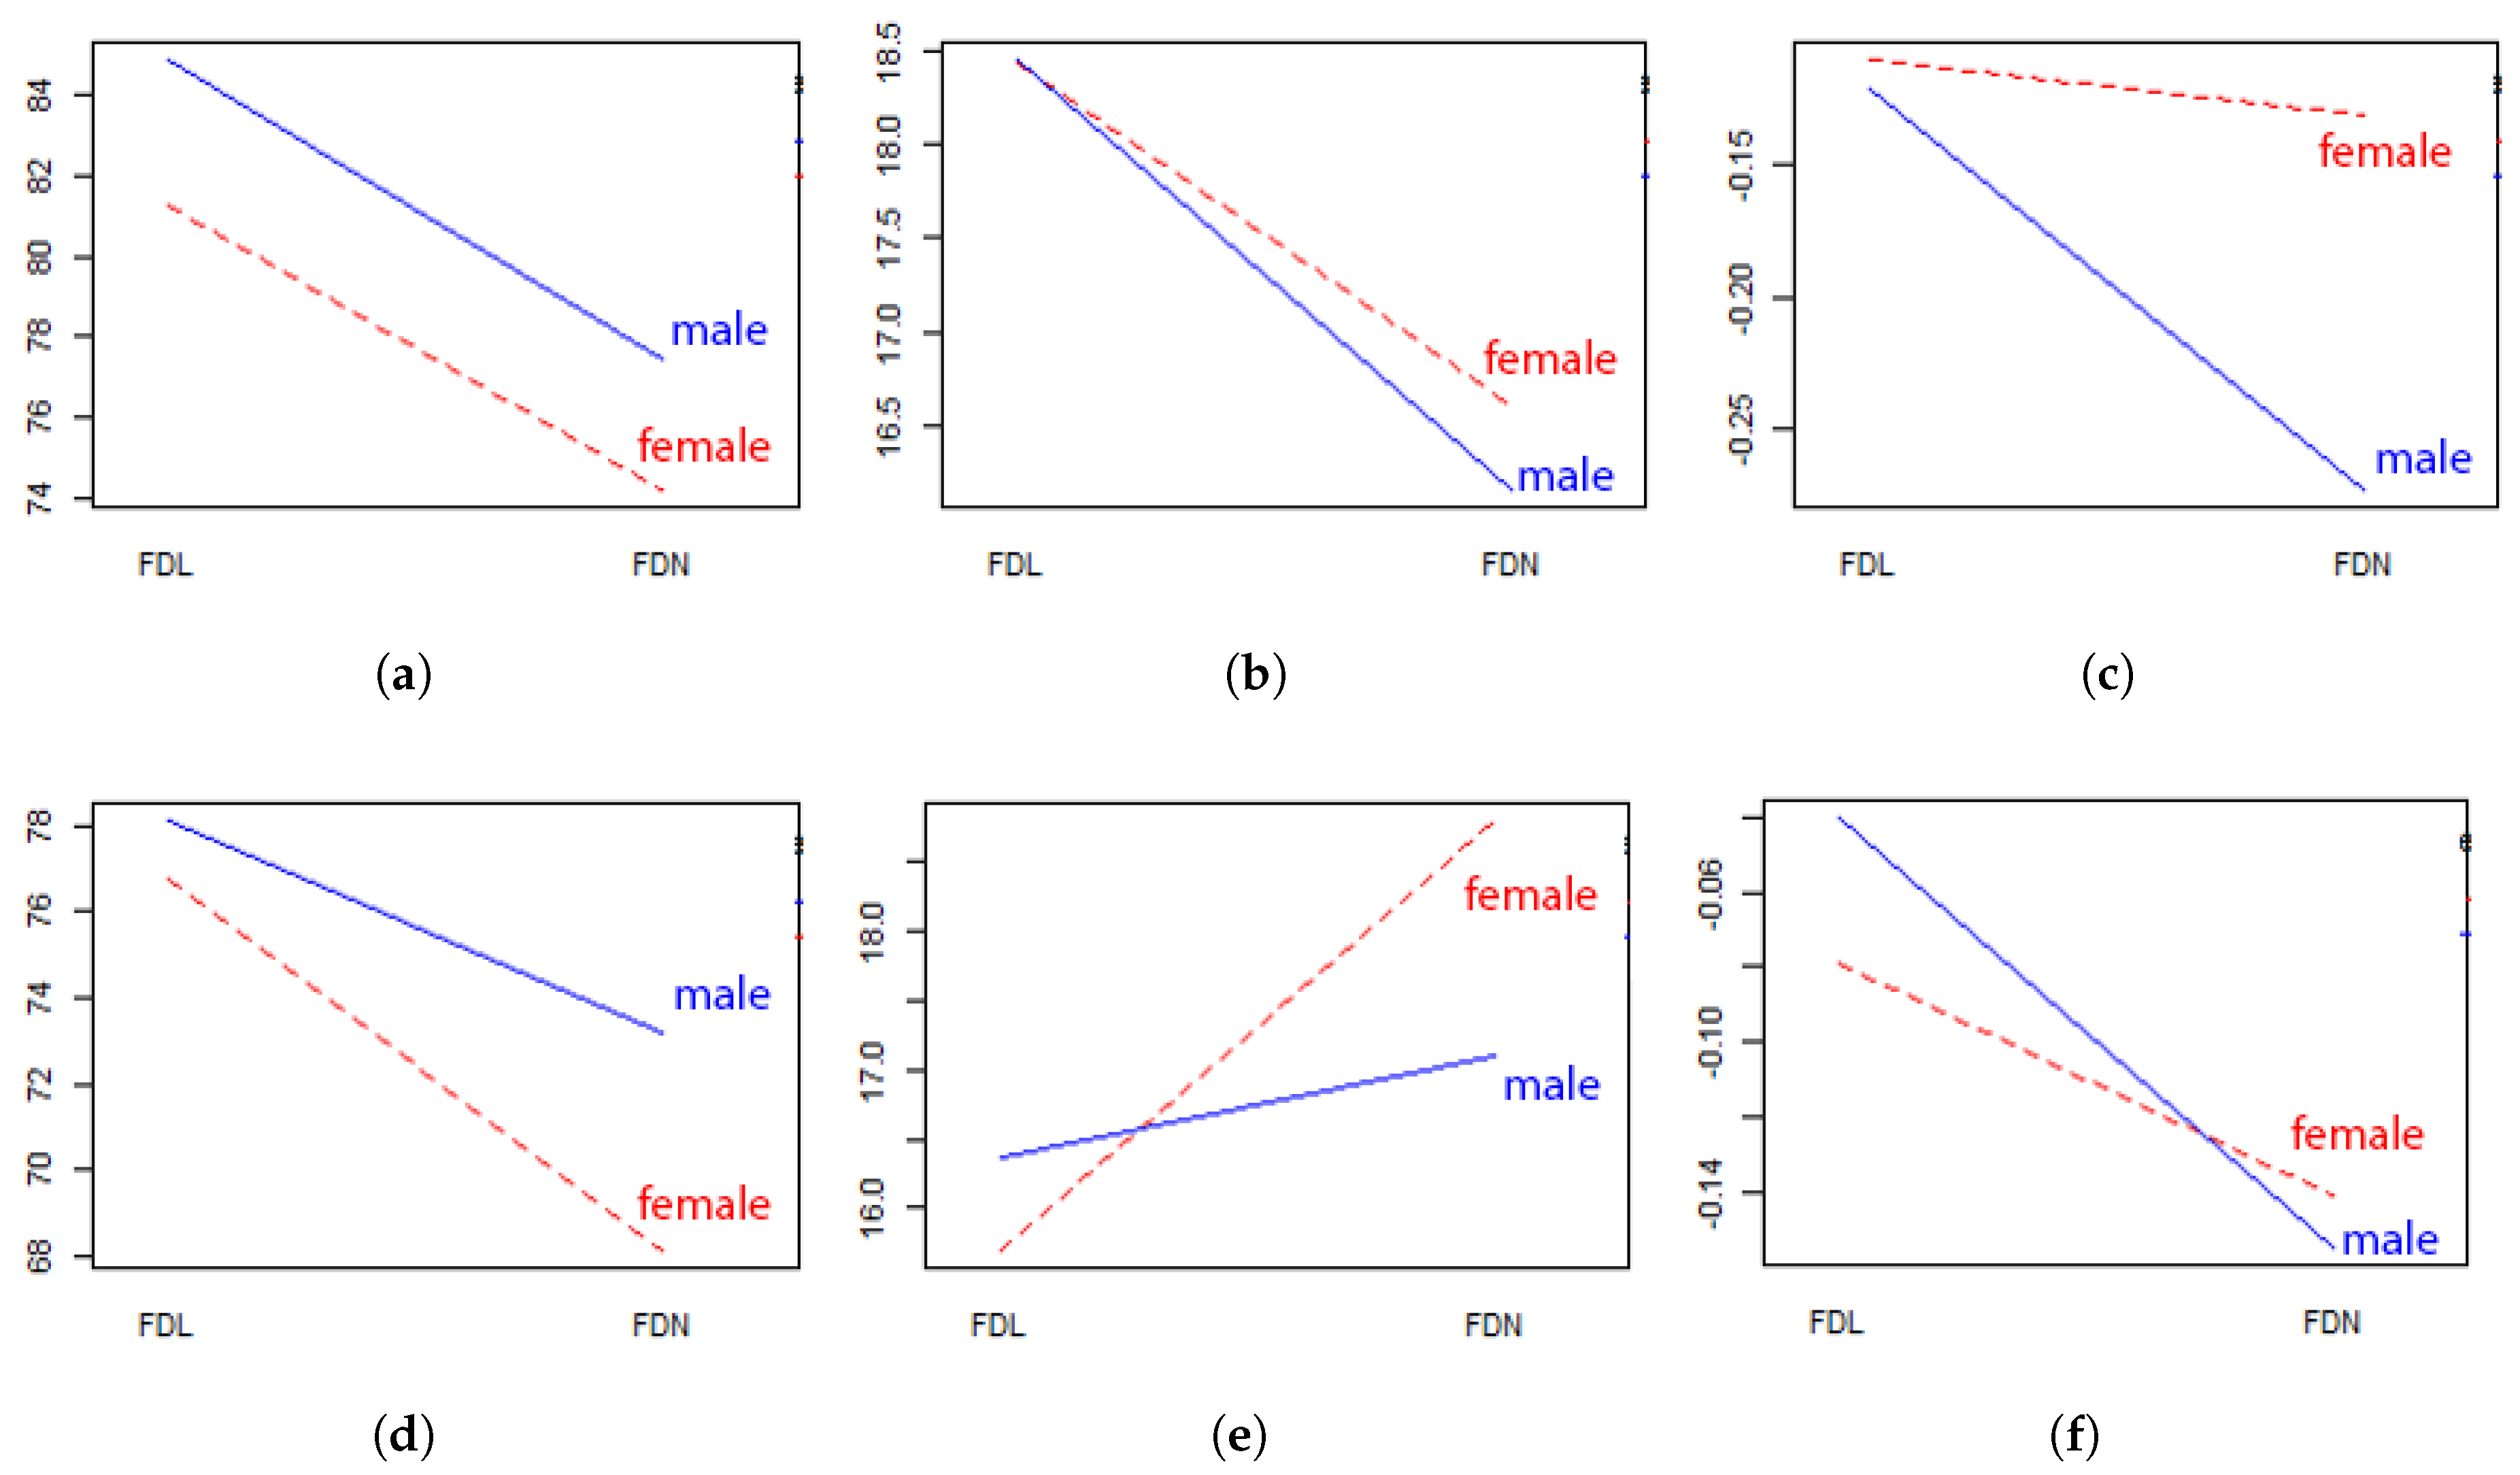
4.2. Advanced Mixed Effect Analysis of Experiment 2

The main differences between Experiments 1 and 2 are (i) facial expressions could be included, and (ii) we only had loaded versus non-loaded drives instead of normal drive, cognitive drive, emotional drive, and sensorimotor drive in the second experiment. At the end, the drives included a collusion path that would usually result in a traffic accident [26].
The main issue in dealing with facial expressions is that the recorded eight main facial expressions do not clearly provide information to determine stress, since some of the facial expressions appeared excessively and are questionable in the data. For example, we found out that the disgust expression, which is usually used to determine stress, was overwhelming in the data, as shown in Figure 6a. When we overlooked this and tried to model the data, we ended up with unreasonable models. The literature indicates that disgust can be confused with other negative facial expressions, like anger [38], so we decided to investigate if we could further cluster the facial expressions to provide more conclusive information about stress.
We, therefore, ran the Hierarchical Cluster Analysis to determine the different facial experiment clusters. We observed a significant jump in clustering distance for six clusters and identified that the use of six facial clusters, rather than eight facial expressions, was sufficient to represent stress, as shown in Figure 6b. It turned out that contempt or surprise were not necessary to obtain these clusters. Therefore, six out of eight facial expressions were sufficient to account for over 90% of the variability in the data according to hierarchical clustering with an average linkage of facial expression signals (See Figure 6b).
Looking at the explanatory boxplots of heart rate, breathing rate, and lane offset data shown in Figure 7, clusters 1, 2, 4, and 5 are similar clusters. It is interesting to note that despite this similarity, these four clusters were dominated by different facial expressions. Namely, cluster 1 was dominated by high disgust signals, cluster 4 was dominated by high anger signals with some disgust signals, cluster 5 was dominated by sad expressions with some anger or disgust signals, and cluster 2 was dominated by neutral signals. The similarity between anger and disgust reactions was not unexpected. In fact, this similarity was observed earlier by Pochedly et al. [38]. It is important to note that clusters 3 (dominated by high joy signals) and 6 (more fear and some sad) were the ones with the fewest number of observations. By evaluating these findings, we emphasize that only three combined expressions are crucial for heart rate, breath rate, and lane offset. Those three combined expressions are anger + disgust, joy, and fear + sadness. Since the hierarchical clustering recommends six clusters, we used this information for modeling instead of our observations on the cluster boxplots (See Figure 7).
Moreover, looking at the raw lane offset data shown in Figure 7c, all clusters had similar variability with the highest median occurring in cluster 3, whereas the cluster 6 had the highest median heart rate. Breath rate had similar high medians in clusters 1, 2, 4, and 6. Again, looking at these results, it is possible to infer the existence of interesting causality relationships [19,40]. For instance, according to the data, the lane offset may possibly cause fear and sadness along with an increased heart rate. In other words, fear, sadness, and increased heart rate can be considered to be the outcomes of lane offset. This suggests some kind of self-awareness, as also discussed by Leary [41,42] in the literature. On other hand, joy was not related to lane offset. By itself, it was able to cause an increase in heart rate. In this case, heart rate can be considered to be an outcome of joy. This discussion demonstrates the difficulty of inferring causality relationships [18,43] which can possibly exist in every direction.
In order to provide more solid evidence, we again built a linear mixed effects model with the inclusion of facial clusters to predict the changes in lane offset, breath, and heart rate. The general model was as follows:
y i j k r m = μ + α i + γ j + τ k + δ r + ( α γ ) i j + ( α τ ) i k + ( α γ τ ) i j k + ϵ i j k r m
where y represent the heart rate or breath rate or lane offset depending on the model. α , γ , τ , δ , and ϵ are the notations for the interference, age group, gender, facial expression clusters, and random error, respectively. There were two-way and three-way interactions where the notations were combined. Subscripts ( i , j , k , r , m ) refer to the number of levels or observations depending on whether the related variable included the observations or groups (levels).
This model still resulted in significant (95% confidence level) interactions between gender, age and interference types in the predicting lane offset, breath, and hearth rate. This interaction was even more significant (smaller probability of finding more extreme results when the joint effect was not there) than in Experiment 1 in the respective models for lane offset, breath, and heart rate. We observed earlier that cluster 3 was dissimilar to all other facial expression clusters in terms of lane offset. However,this was not indicated in its coefficient and related test in the linear mixed effects model (having a 95% confidence level). Its coefficient was not the largest in magnitude either. It should be noted that both positive and negative lane offset can be of interest, and it could be that the other clusters exhibited negative offset of larger magnitude. This is a really interesting result, since it means that our earlier causality inference from the raw data may not necessarily be correct, even though it looks logical. This suggests that lane offset and fear may not necessarily be correlated, which does not satisfactorily confirm our earlier observations about the self-awareness of drivers in terms of the lane offset.
Our explanatory analysis for Experiment 2 was also confirmed by interaction plots shown in Figure 8 as a result of modeling. The results corresponding to Experiment 2 also demonstrated inconsistencies that do not suggest causal relationships. Again, we list some of those inconsistencies. Figure 8a,b,d suggest that stress increased with the interventions, which is logical. On the other hand, Figure 8e indicates that stress decreased with the interventions for old males and females which is illogical and contradictory to previous observations. To make matters worse, the driving performances of both young and old drivers, as shown in Figure 8c,f, improved with the interventions. This further demonstrates the difficulty of proving causality relationships between interventions and driving as we showed earlier using Experiment 1.
We reached conclusions on how facial expression clusters affect predictions, so we wanted to see if the inclusion of these clusters improved the model. We ran a four-fold cross validation which is also called rotation estimation or out-of-sample testing to validate the models to assess how the results of a statistical analysis generalize to an independent data set. This method is widely used in settings where the goal of the modeling is prediction and estimation to see how accurately a predictive model will perform in practice.
We used the statistical model comparison tools, the Akaike’s Information Criteria (AIC) and Bayesian Information Criteria (BIC). For better model fit, lower values of AIC or BIC should be obtained in model comparison. The models with training data, which included the facial expression clusters, resulted in lower AIC and BIC as well as lower ASE (Average Squared Error) values in the validation data compared to the models without facial expression clusters. Even though there was an improvement, it was marginal for all three outcomes (heart rate, breath rate, lane offset) so we conclude that the facial expression clusters can be overlooked and facial expression may not play as an important of a role as we thought it may.

5. Conclusions and Future Work

In this paper, we have demonstrated that stress does not necessarily cause the same distractions in all people; therefore, it is impossible to evaluate the impact of stress on traffic accidents. Stress measures do not vary together or with biographical measures. Our results demonstrate that neither type of stress measure significantly improves modeling outcomes. Stress may be more helpful in the absence of knowledge of its type. There may be other measures, such as driving performance, that are more predictive of outcomes with added benefit but may not be worth the cost of measuring.
One of the shortcomings of our analysis is that we used only a portion of this immense dataset. More interesting observations could be deducted with an additional deep analysis. For instance, a preliminary analysis of some of the available data that is not reported in this study suggested that human drivers are not as irrational as expected. In particular, we observed that human drivers know that they deviate from their lane under certain types of stress and they become extra careful. In other words, the Dunning–Kruger effect, i.e., people with low ability having illusory superiority [44,45], was not high for human drivers who took the experiment. Having low confidence of their own abilities in dangerous situations is an important asset for all people to avoid accidents.
The difference between self-awareness of lane deviation can be explained by the abilities and shortcomings of human sensing. We can always see that the car is not in its lane. On the other hand, we can only sense acceleration, not speed. Speed and acceleration data are highly skewed so usual liner methods do not apply to them and more research is needed in this area. Without appropriate sensing mechanisms, it is not possible to be self aware. In the case of self awareness, robot drivers are guaranteed to be better than human drivers, since we can always include appropriate sensors to get correct feedback. Again, more research is to come in this area.
In conclusion, it is possible to show that most human drivers probably are not as bad as they are portrayed in proponents of robot drivers. Experienced drivers most likely develop strategies to handle stress and stressors [46]. In fact, previous studies show that personality factors related to aberrant driving behaviors work well in predicting the involvement of traffic accidents [47,48,49]. Drivers with personality factors that are susceptible to accidents can be a small percentage of the population, and a small random sample in the population may not necessarily include those drivers. This could be why we did not see distinct outliers in the data that we analyzed.
Another interesting problem is that accidents are usually caused by errors of more than one driver. The probability of more than one human driver making a mistake at the same time is low. In fact, considering how many cars travel on roads, the number of fatal collisions appears to be low, but we could not find any studies on this issue. An appropriate comparison will only be possible when we have as many cars driven by robots as humans.
We observed that even though this particular dataset is one of the most advanced datasets, there is still too much to do in terms of the design of experiments. One of the main problems is that we do not have more than one single human driver in the system. Without at least two simultaneous human drivers, it is not exactly possible to simulate real driving situations since there are many other issues with simulators. For instance, the current set up only included three screens that did not provide full coverage. Without coverage on the sides, it is not possible to provide motion parallax, and it is impossible to sense speed. It may also be necessary to include some haptic responses that can be related to speed, for example, speeding cars can shake more.
One idea to allow the use of more than a single driver is to use robot drivers that behave like humans in the experiments. Since this particular dataset provides us with human behavior, we could randomly create human-like behavior in a simulation environment. We could also combine them with real human drivers. Using such an environment, we may be able to study virtual traffic crashes in game-like environments.
It must also be noted that the advances we discussed earlier, such as monitoring all driving information along with brainwaves, breath, and heart rate of human drivers during driving, could be helpful to understand the problems. Our results suggest that there could be some latent variables that were not collected in this study. It could even be important to collect additional information about drivers, such as their expertise, their occupation, and their education. The collaboration of different fields like psychology, computer science, statistics, or other related fields is crucial to design the experiment from start to end, analyze the data, and inform the policymakers accordingly.

Author Contributions

Conceptualization, J.P.G., D.A. and E.A.; Data curation, I.P.; Formal analysis, J.P.G.; Investigation, D.A.; Methodology, J.P.G., D.A. and E.A.; Resources, I.P.; Software, J.P.G.; Supervision, D.A.; Visualization, E.A.; Writing–original draft, J.P.G., D.A. and E.A.

Funding

This research received no external funding.

Acknowledgments

The authors wish to thank the anonymous reviewers for their valuable comments and suggestions.

Conflicts of Interest

The authors declare no conflict of interest.

References

  1. Lipovac, K.; Đerić, M.; Tešić, M.; Andrić, Z.; Marić, B. Mobile phone use while driving—Literary review. Transp. Res. Part F Traffic Psychol. Behav. 2017, 47, 132–142. [Google Scholar] [CrossRef]
  2. Wikipedia. Restrictions on cEll Phone Use While Driving in the United States. Wikipedia. Available online: https://en.wikipedia.org/wiki/Restrictions_on_cell_phone_use_while_driving_in_the_United_States (accessed on 11 July 2018).
  3. Sagberg, F.; Selpi; Bianchi Piccinini, G.F.; Engström, J. A review of research on driving styles and road safety. Hum. Factors 2015, 57, 1248–1275. [Google Scholar] [CrossRef] [PubMed]
  4. Papantoniou, P.; Papadimitriou, E.; Yannis, G. Review of driving performance parameters critical for distracted driving research. Transp. Res. Procedia 2017, 25, 1801–1810. [Google Scholar] [CrossRef]
  5. Taggart, P.; Gibbons, D. Motor-car driving and the heart rate. Br. Med. J. 1967, 1, 411. [Google Scholar] [CrossRef] [PubMed]
  6. Casali, J.G.; Wierwille, W.W.; Cordes, R.E. Respiratory measurement: Overview and new instrumentation. Behav. Res. Methods Instrum. 1983, 15, 401–405. [Google Scholar] [CrossRef] [Green Version]
  7. He, J.; McCarley, J.S.; Kramer, A.F. Lane keeping under cognitive load: Performance changes and mechanisms. Human Factors 2014, 56, 414–426. [Google Scholar] [CrossRef] [PubMed]
  8. Mui, C. Fasten Your Seatbelts: Google’s Driver-Less Car Is Worth Trillions. Forbes Magazine, 22 January 2013. Available online: https://www.forbes.com/sites/chunkamui/2013/01/22/fasten-your-seatbelts-googles-driverless-car-is-worth-trillions/29b5057679dd(accessed on 12 July 2018).
  9. Greenblatt, N. Self-driving cars will be ready before our laws are. IEEE Spectr. 2016, 53, 46–51. [Google Scholar] [CrossRef]
  10. Miller, I.; Garcia, E.; Campbell, M. To drive is human. IEEE Comput. 2006, 39, 52–56. [Google Scholar] [CrossRef]
  11. Salmon, P.; Reagan, M.; Johnston, I. Human Error and Road Transport; Technical Report; Accident Research Center, Monash University: Victoria, Australia, 2001; Available online: https://www.monash.edu/__data/assets/pdf_file/0010/216946/muarc256.pdf (accessed on 12 July 2018).
  12. Hendricks, D.L.; Fell, J.C.; Freedman, M.; Page, J.F.; Bellis, E.S.; Scheifflee, T.G.; Hendricks, G.V.S.; Lee, K.C. The Relative Frequency of Unsafe Driving Acts in Serious Traffic Crashes; Summary Technical Report; National Highway Traffic Safety Administration, U.S. Department of Transportation: Washington, DC, USA, 2001. Available online: https://one.nhtsa.gov/people/injury/research/udashortrpt/summary.html (accessed on 10 July 2018).
  13. U.K. Government. Contributory Factors for Reported Road Accidents. Reported Road Accidents Statisticstables. Available online: https://www.gov.uk/government/statistical-data-sets/ras50-contributory-factors (accessed on 8 July 2018).
  14. U.S. Department of Transportation. National Motor Vehicle Crash Causation Survey; Summary Technical Report; U.S. Department of Transportation, National Highway Traffic Safety Administration: Washington, DC, USA, 2008. Available online: https://crashstats.nhtsa.dot.gov/Api/Public/ViewPublication/811059 (accessed on 11 July 2018).
  15. Smith, B.W. Human Error as a Cause of Vehicle Crashes. Available online: http://cyberlaw.stanford.edu/blog/2013/12/human-error-cause-vehicle-crashes (accessed on 10 July 2018).
  16. Green, M. “How long does it take to stop?” Methodological analysis of driver perception-brake times. Transp. Hum. Factors 2000, 2, 195–216. [Google Scholar] [CrossRef]
  17. Green, M. Perception-reaction time: Is Olson (and sivak) all you need to know? Collis. Int. Compend. Crash Res. 2009, 4, 88–93. [Google Scholar]
  18. Pearl, J. Probabilistic Reasoning in Intelligent Systems: Networks of Plausible Inference; Morgan Kaufmann: Burlington, MA, USA, 1988. [Google Scholar]
  19. Pearl, J. Causality: Models, Reasoning and Inference; Cambridge Univ Press: Cambridge, UK, 2000; Volume 29. [Google Scholar]
  20. Geiger, P.; Hofmann, K.; Schölkopf, B. Experimental and Causal View on Information Integration in Autonomous Agents. In Proceedings of the 6th International Workshop on Combinations of Intelligent Methods and Applications, The Hague, The Netherlands, 29 August–2 September 2016; pp. 21–28. Available online: https://www.microsoft.com/en-us/research/publication/experimental-causal-view-information-integration-autonomous-agents/ (accessed on 11 July 2018).
  21. Pearl, J. UCLA faculty Voice: Artificial Intelligence Can’T Reason Why. UCLA Newsroom, Opinion and Voices. 2008. Available online: http://newsroom.ucla.edu/stories/ucla-faculty-voice:-artificial-intelligence-cant-reason-why (accessed on 9 July 2018).
  22. Smith, B.W. The Reasonable Self-Driving Car. Available online: http://cyberlaw.stanford.edu/blog/2013/10/reasonable-self-driving-car (accessed on 12 July 2018).
  23. Anderson, J.M.; Kalra, N.; Stanley, K.D.; Sorensen, P.; Samaras, C.; Oluwatola, O.A. Autonomous Vehicle Technology: A Guide for Policymakers; Technical Report; RAND Foundation: Santa Monica, CA, USA, 2016; Available online: https://www.rand.org/content/dam/rand/pubs/research_reports/RR400/RR443-2/RAND_RR443-2.pdf (accessed on 10 July 2018).
  24. Foundation, R. Autonomous Vehicle Technology: A Guide for Policymakers; Technical Report; Reason Foundation: Los Angeles, CA, USA, 2018; Available online: https://reason.org/wp-content/uploads/2018/03/autonomous-vehicles-guide-for-policymakers.pdf (accessed on 11 July 2018).
  25. Kastrenakes, J. Jaguar Wants to Monitor Its Drivers’ Brainwaves, Heart Rate, and Breathing. Available online: https://www.theverge.com/2015/6/19/8815419/jaguar-brainwave-heart-rate-breathing-monitors (accessed on 8 July 2018).
  26. Pavlidis, I.; Dcosta, M.; Taamneh, S.; Manser, M.; Ferris, T.; Wunderlich, R.; Akleman, E.; Tsiamyrtzis, P. Dissecting driver behaviors under cognitive, emotional, sensorimotor, and mixed stressors. Sci. Rep. 2016, 6, 25651. [Google Scholar] [CrossRef] [PubMed]
  27. Hart, S.G.; Wickens, C.D. Workload assessment and prediction. In Manprint; Springer: Dordrecht, The Netherlands, 1990; pp. 257–296. [Google Scholar]
  28. Hart, S.G. NASA-task load index (NASA-TLX); 20 years later. Proc. Hum. Factors Ergon. Soc. Annu. Meet. 2006, 50, 904–908. [Google Scholar] [CrossRef]
  29. Stotland, E.; Pendleton, M. Workload, stress, and strain among police officers. Behav. Med. 1989, 15, 5–17. [Google Scholar] [CrossRef] [PubMed]
  30. Spector, P.E.; Jex, S.M. Development of four self-report measures of job stressors and strain: Interpersonal conflict at work scale, organizational constraints scale, quantitative workload inventory, and physical symptoms inventory. J. Occup. Health Psychol. 1998, 3, 356. [Google Scholar] [CrossRef] [PubMed]
  31. Gopher, D.; Donchin, E. Workload-An examination of the concept. In Handbook of Perception and Human Performance, Vol II, Cognitive Processes and Performance; Wiley & Sons: New York, NY, USA, 1986; pp. 1–49. [Google Scholar]
  32. Jo, S.; Myung, R.; Yoon, D. Quantitative prediction of mental workload with the ACT-R cognitive architecture. Int. J. Ind. Ergon. 2012, 42, 359–370. [Google Scholar] [CrossRef]
  33. Dcosta, M. Simulator Study I: A Multimodal Dataset for Various Forms of Distracted Driving. Available online: https://osf.io/c42cn/ (accessed on 11 July 2018).
  34. Taamneh, S.; Tsiamyrtzis, P.; Dcosta, M.; Buddharaju, P.; Khatri, A.; Manser, M.; Ferris, T.; Wunderlich, R.; Pavlidis, I. A multimodal dataset for various forms of distracted driving. Sci. Data 2017, 4, 170110. [Google Scholar] [CrossRef] [PubMed]
  35. RCoreTeam. R Project. Available online: https://www.r-project.org/ (accessed on 5 July 2018).
  36. Littlewort, G.; Whitehill, J.; Wu, T.; Fasel, I.; Frank, M.; Movellan, J.; Bartlett, M. The computer expression recognition toolbox (CERT). In Proceedings of the 2011 IEEE International Conference on Automatic Face & Gesture Recognition and Workshops (FG 2011), 21–25 March 2011, Santa Barbara, CA, USA; pp. 298–305.
  37. Rokach, L.; Maimon, O. Clustering methods. In Data Mining and Knowledge Discovery Handbook; Springer: New York, NY, USA, 2005; pp. 321–352. [Google Scholar]
  38. Pochedly, J.T.; Widen, S.C.; Russell, J.A. What emotion does the “facial expression of disgust” express? Emotion 2012, 12, 1315. [Google Scholar] [CrossRef] [PubMed]
  39. Bennani, Y.; Benabdeslem, K. Dendogram-based SVM for multi-class classification. J. Comput. Inf. Technol. 2006, 14, 283–289. [Google Scholar]
  40. Bessler, D.A.; Akleman, D.G. Farm prices, retail prices, and directed graphs: Results for pork and beef. Am. J. Agric. Econ. 1998, 80, 1144–1149. [Google Scholar] [CrossRef]
  41. Leary, M.R. How the self became involved in affective experience: Three sources of self-reflective emotions. In The Self-Conscious Emotions: Theory and Research; Guilford Press: New York, NY, USA, 2007; pp. 38–52. [Google Scholar]
  42. Tracy, J.L.; Robins, R.W.; Tangney, J.P. The Self-Conscious Emotions: Theory and Research; Guilford Press: New York, NY, USA, 2007. [Google Scholar]
  43. Pearl, J. Causal diagrams for empirical research. Biometrika 1995, 82, 669–688. [Google Scholar] [CrossRef] [Green Version]
  44. Dunning, D. The Dunning–Kruger effect: On being ignorant of one’s own ignorance. In Advances in Experimental Social Psychology; Elsevier: Amsterdam, The Netherlands, 2011; Volume 44, pp. 247–296. [Google Scholar]
  45. Kruger, J.; Dunning, D. Unskilled and unaware of it: How difficulties in recognizing one’s own incompetence lead to inflated self-assessments. J. Personal. Soc. Psychol. 1999, 77, 1121. [Google Scholar] [CrossRef]
  46. Klauer, S.G.; Guo, F.; Simons-Morton, B.G.; Ouimet, M.C.; Lee, S.E.; Dingus, T.A. Distracted driving and risk of road crashes among novice and experienced drivers. N. Engl. J. Med. 2014, 370, 54–59. [Google Scholar] [CrossRef] [PubMed]
  47. Sümer, N. Personality and behavioral predictors of traffic accidents: Testing a contextual mediated model. Accid. Anal. Prev. 2003, 35, 949–964. [Google Scholar] [CrossRef]
  48. Nabi, H.; Consoli, S.M.; Chastang, J.F.; Chiron, M.; Lafont, S.; Lagarde, E. Type A behavior pattern, risky driving behaviors, and serious road traffic accidents: A prospective study of the GAZEL cohort. Am. J. Epidemiol. 2005, 161, 864–870. [Google Scholar] [CrossRef] [PubMed]
  49. Perry, A.R.; Baldwin, D.A. Further evidence of associations of type A personality scores and driving-related attitudes and behaviors. Percept. Motor Skills 2000, 91, 147–154. [Google Scholar] [CrossRef] [PubMed]
Figure 1. The structure of virtual simulation: (a) No distraction drive; (b) Distracted drive. In this scene, the distracted drive image shows three types of interventions and stressors that can introduce distraction: texting while driving (see picture-in-picture), solving simple arithmetic operations (see though bubble), and road hazards (see cones).
Mathematics 06 00139 g001
Figure 2. Driving simulator.
Mathematics 06 00139 g002
Figure 3. Histogram and normal probability plots of heart rate, breathing rate, and lane offset in Experiments 1 (a) and 2 (b) that demonstrate a Gaussian distribution.
Mathematics 06 00139 g003
Figure 4. Box plots that demonstrate the effects of gender, age, and stressors in Experiments 1 (a) and 2 (b).
Mathematics 06 00139 g004
Figure 5. Interaction plots obtained by the mixed effects model presented in Equation (1), where the top plots are the younger drivers and the bottom plots are the older drivers. (a) Mean heart rate for young group. (b) Mean breathing rate for young group. (c) Mean lane offset for young group. (d) Mean heart rate for old group. (e) Mean breathing rate for old group. (f) Mean lane offset for old group. In these plots, the solid blue lines refer to males and the dotted red lines refer to females.
Mathematics 06 00139 g005
Figure 6. Original facial expressions and our hierarchical clustering. (a) Distribution of original facial expression signals that demonstrate that disgust is the dominated expression; (b) Compound dendogram that provides the compound correlated data of our facial expression clusters obtained by the Hiearchical Cluster Analysis (HCA) analysis [39].
Mathematics 06 00139 g006
Figure 7. Heart rate (a), breathing rate (b), and lane offset (c) boxplots for each cluster.
Mathematics 06 00139 g007
Figure 8. Interaction plots obtained by the advanced model presented in Equation (1) where the top plots are the younger drivers and the bottom plots are the older drivers. (a) Mean heart rate for young group. (b) Mean breathing rate for young group. (c) Mean lane offset for young group. (d) Mean heart rate for old group. (e) Mean breathing rate for old group. (f) Mean lane offset for old group. In these plots, the solid blue lines refer to males and the dotted red lines refer to females.
Mathematics 06 00139 g008

