1. Introduction
For a given undirected, connected network
, where
is the set of nodes,
is the set of arcs and
is the length of arc
, the minimum spanning tree (MST) is a subset of arcs
that connect all nodes in
such that
is minimum. To illustrate,
Figure 1 shows a sample undirected, connected network in which
, and
. Each arc
is represented in
Figure 1 using a dashed line, and its associated length (
) is written on top of the dashed line.
Figure 2 shows four different selected subsets of arcs which are represented by solid lines. In
Figure 2a, the selected arcs do not form a spanning tree as they do not connect all nodes in the network. In
Figure 2b, the selected arcs connect all nodes but they form the cycle 1-2-4-5-1. In cycles, an arc can be unselected to reduce the summation of the selected arcs’ lengths while the involved nodes remain connected. Therefore, this set of arcs does not represent a minimum spanning tree. In
Figure 2c, the selected arcs span all nodes in the network without forming a cycle, yet the summation of the selected arcs’ lengths is not minimum. Meanwhile,
Figure 2d shows selected arcs that form a spanning tree having the minimum summation of the arcs’ lengths. Therefore,
.
The problem of finding
is a famous combinatorial optimization problem for which polynomial time algorithms exist [
1,
2,
3,
4]. As explained in [
5], this problem appears in different engineering and service applications, particularly in designing computer, telecommunications, transportation and water supply networks. In addition, it has a number of computational applications such as clustering of data points in a plane [
6], handwriting recognition [
7] and providing approximate solutions for the traveling salesman problem [
8]. Some recent applications include cell nuclei segmentation [
9], Alzheimer’s classification [
10], water looped network equilibrium [
11] and characterizing local urban patterns [
12].
As indicated by Magnanti and Wolsey [
5], having alternate linear programming models for the problem of finding MST can offer theoretical and algorithmic insights into solving the problem. This can be extended to a larger application in which finding an MST is a subproblem. In the literature, there are ten different integer and mixed integer linear programming models for the MST problem. They are variants of set packing, cuts, network flow and node level formulations. The set packing formulation is based on defining constraints that restrict the cardinality of any selected subset of arcs not to exceed the number of connected nodes less than one. These constraints are used for eliminating cycles. In cuts formulations, a cut set is a subset of arcs that connect two subsets of nodes. Constraints that define lower bounds on the number of arcs in cut sets are used to ensure that all nodes are connected. The network flow formulations utilize artificial decision variables to represent quantities of commodity flows along the arcs. By maintaining consistent flow starting at a source node and ending at a destination node along the network, a tree is constructed. In the node level formulations, a level decision variable is associated with each node. Constraints that restrict the inclusion of arcs connecting a lower level node to a higher level one are used for eliminating cycles.
Some of the models are notorious for their combinatorial explosion as a result of their exponential number of constraints with respect to the number of nodes. Other models aim to have polynomial number of constraints while maintaining integer polyhedron for their linear programming relaxations. Such a property reduces the computational effort by directly using polynomial-time linear programming algorithms without the need for the non-polynomial MILP solution algorithms. However, this does not necessarily guarantee finding an optimal solution in reduced computational time. Therefore, any comparison between the models has to take into consideration two aspects: the first one is the size of the model represented by the number of decision variables and the number of constraints; and the second one being the computational time needed to prove optimality of a generated solution.
This paper presents a node level MILP model and compares it with existing models in terms of the number of decision variables and constraints. Numerical experiments are conducted using randomly generated instances of various sizes to provide computational comparisons between a selected subset of the models that have polynomial number of constraints in the size of the network represented by the number of nodes. IBM ILOG CPLEX version 12.8 [
13] (IBM, Armonk, NY, USA) is used to generate solutions to these instances based on the compared MILP models. The models are entered to CPLEX using the optimization programming language (OPL) [
14]. The computational time needed for each model to prove optimality of a generated solution is used for comparison.
The rest of this paper is organized as follows. A review is provided in
Section 2 for the existing integer and mixed integer linear programming models of the problem of finding MST. The proposed model is presented along with a proof for its validity in
Section 3. In
Section 4, a comparison is provided for the two aspects mentioned above; followed by the conclusion in
Section 5.
3. The Proposed MILP Model
The proposed eleventh model is another variant of the node level formulation. It utilizes the digraph
and the binary decision variables
for all
as defined in
Section 2.3. The main idea behind the proposed model is based on the analogy between rivers which have multiple sources and a single sink and trees which have multiple branches and a single trunk. Neither rivers nor trees not have cycles. In the proposed model, an arbitrary node
is labeled as a sink node. Other nodes represent either sources of water or intermediate intersection points. In both cases, water only flows from a higher level node to a lower level one. We define decision variables
for all
to represent the water level at each node. The sink node has the lowest level, which is set to zero, while the other nodes have levels that must be greater than zero. Some constraints are introduced to link the
variables with the level variables. We start with the following formulation.
The Objective Function (
34) is the same as (
1), defined using the decision variables
, where
for both
and
equals
for
. Constraints (
35) represent the condition that there is exactly one arc going out of every node
. Meanwhile, Constraint (
36) ensures that the sink node does not have any arcs going out of it. These constraints imitate directions of water flow in rivers, and they ensure that the number of arcs included in the solutions is
, which is equivalent to Constraint (
9).
Constraints (
37) define the relationship between the binary decision variables
and the corresponding level variables
and
. It is formulated to make sure that if
, the level at node
i is greater than the level at node
j by one; otherwise, this constraint will be redundant. Constraints (
38) sets the level of the sink node to zero. Constraints (
39) are the domain constraints for the variables
. The following theorem is necessary to proof the validity of the proposed model.
Theorem 1. Constraint (37) eliminates cycles. Proof. (by contradiction) Suppose without loss of generality that, for the subset of nodes
, where
, a cycle is formed by having
and
. Therefore, according to Constraints (
37),
and
. The latter leads to
which contradicts the former. ☐
Corollary 1. Constraints (35)–(39) result in valid trees. Proof. As a result of Theorem 1 and since Constraints (
35), (
36) and (
39) ensure that there is exactly one arc going out from every node
, there has to be at least one arc coming into node
. Therefore, a valid acyclic tree in which all nodes are connected is obtained by Constraints (
35)–(
39). ☐
Therefore, the MILP model presented by Equations (
34)–(
39) is sufficient to find a minimum spanning tree. However, additional bounding constraints for the decision variables help in reducing the number of iterations needed by a solution algorithm. Therefore, we define Constraints (
40) and (
41) to provide lower and upper bounds for the level decision variables.
In addition, valid inequalities [
19] can be defined to strengthen the proposed formulation. Logically, since there must be at most one arc connecting every pair of nodes, the following constraints are added.
Proposition 2. Constraints (42) are valid inequalities for Formulations (34)–(39). Proof. Since Formulations (
34)–(
39) results in solutions that do not contain cycles, as stated in Theorem 1 and Corollary 1, for every pair of nodes
i and
j either
or
but not both. Since Inequality (
42) are mathematical representations of these conditions, they are valid inequalities for Formulations (
34)–(
39). ☐
In addition, there must be at least one arc coming into the sink node
. Since this is implied by Constraints (
35) and (
36), the following constraint is another valid inequality for Formulations (
34)–(
39).
Therefore, the set of constraints
(
35)–(
43)} defines the domain of the decision variables of the proposed model.
4. Models Comparison
The first aspect to consider in comparing the eleven models presented herein is the memory size needed by an MILP solution algorithm, which is represented by the number of decision variables and the number of constraints. This aspect not only defines the memory requirements, but also reflects the computational time needed in each iteration of the solution algorithm. The second aspect is the computational time needed to prove optimality. Both aspects are not necessarily correlated. The following sections discuss these two aspects.
4.1. Model Size
A comparison of the characteristics of the eleven models and their sizes is presented in
Table 1. For each model, an abbreviated name is assigned in
Table 1 which is used in the following analysis, tables and figures to provide a meaningful reference. The size of each model is represented in
Table 1 by the total number of variables, the number of integer variables and the number of constraints. The number of arcs in the network,
, is used to simplify the formulas used for the calculated numbers. Following the convention of the MILP solvers, the non-negativity, integer and binary constraints for all models are not counted.
As shown in
Table 1, the first to fifth models suffer from the combinatorial explosion as a result of their exponential number of constraints. For the remaining models, the number of decision variables and constraints are polynomial in terms of the number of nodes. With respect to the number of decision variables, the tenth (D-level) and the proposed models have the lowest number of decision variables among the models with polynomial number of constraints. In terms of the number of integer variables, the LP relaxations of the seventh (D-m-flow) and eighth (m-flow-1) models have obvious advantage over the other models since they are proven to provide integer solutions without the need to explicitly define integer variables. This allows for solving them using polynomial time linear programming algorithms instead of the non-polynomial branch-and-bound or branch-and-cut algorithm. However, this does not necessarily mean that the computational time will be less as it is also affected by the model size. For the other models with polynomial number of constraints, the ninth (m-flow-2) model has the lowest number of integer variables. This may help in reducing the number of branch-and-bound iterations needed; however, again, it does not necessarily mean that the computational time is less.
The sixth (D-1-flow) model has the lowest number of constraints, followed by the tenth (D-level) and proposed models, respectively. The differences in the number of constraints between the D-1-flow, D-level and the proposed models are not significant, while the D-m-flow, m-flow-1 and m-flow-2 models have comparatively larger number of constraints. To demonstrate,
Figure 3 presents a comparison between selected models in terms of their number of constraints at different values of the number of nodes. The difference between the number of constraints of the D-m-flow and the m-flow-2 models is
A as given in
Table 1, which is comparatively small. This explains the overlapping curves for these two models in
Figure 3. Similarly, the difference between the number of constraints of D-1-flow and D-level models is
which is relatively small.
To further demonstrate the differences between the models with respect to their number of constraints, consider an instance with 500 nodes. The proposed model has a number of constraints that is 374,752 as opposed to 250,001 and 250,500 of D-1-flow and D-level models, respectively. Meanwhile, D-m-flow and m-flow-2 models are above 124 million constraints and their LP relaxations are almost 125 million constraints, since in the LP relaxations additional bounding constraints for binary variables are added. For m-flow-1 model, this number exceeds 3 billion.
4.2. Computational Time
The computational time needed to prove optimality of a generated solution is an important criterion that needs to be considered in comparing mathematical programming models. This comparison have to be done using a state-of-the-art software that implements efficient algorithmic techniques. IBM ILOG CPLEX version 12.8 fits this requirement as it implements concurrently a mix of primal/dual simplex and barrier methods for solving linear programming models. For MILP models, CPLEX implements branch-and-bound, branch-and-cut and dynamic search algorithms in addition to pre-processing algorithms for model reductions and heuristic methods for speeding up the search [
13]. For linear programming models, an optimality check is performed at each step, and the iterations continue until a proof of optimality is reached. For MILP models, a proof of optimality is concluded when the lower bound equals the upper bound. All computational experiments in this paper were conducted on a laptop computer with Intel Core i7 processor running at 2.70 GHz with 2 cores, 4 logical processors and 8 GB physical memory, under Microsoft Windows 10.
Random instances are generated by assigning two random coordinates for each node. The arc length between any two nodes equals the Euclidean distance between them based on their coordinates. This approach maintains the triangular inequality property in the randomly generated instances, which is commonly found in most, if not all, applications. The randomly generated coordinates and the calculated distances are prepared in Microsoft Excel and loaded through the interface provided by IBM ILOG CPLEX Optimization Studio. The loading time for the data as well as the model loading time are taken into consideration in the recorded computational times.
Preliminary experiments with less than 20 nodes do not show any significant differences in the computational times needed to prove optimality of generated solutions based on the models presented in this paper. Since the number of constraints of the first to fifth models is quite large for instances with 20 or more nodes (exceeds half million constraints), they are not considered in the computational comparison. Since the LP relaxations of the seventh (D-m-flow) and eighth (m-flow-1) models, denoted LP (D-m-flow) and LP (m-flow-1), respectively, have integer polyhedrons, they are used in the computational comparisons instead of their original MILP models.
4.2.1. Results for 30-Node Instances
The first set of experiments is based on 30-node instances. The coordinates are randomly generated integers following a uniform distribution between 1 and 100. For 100 randomly generated instances,
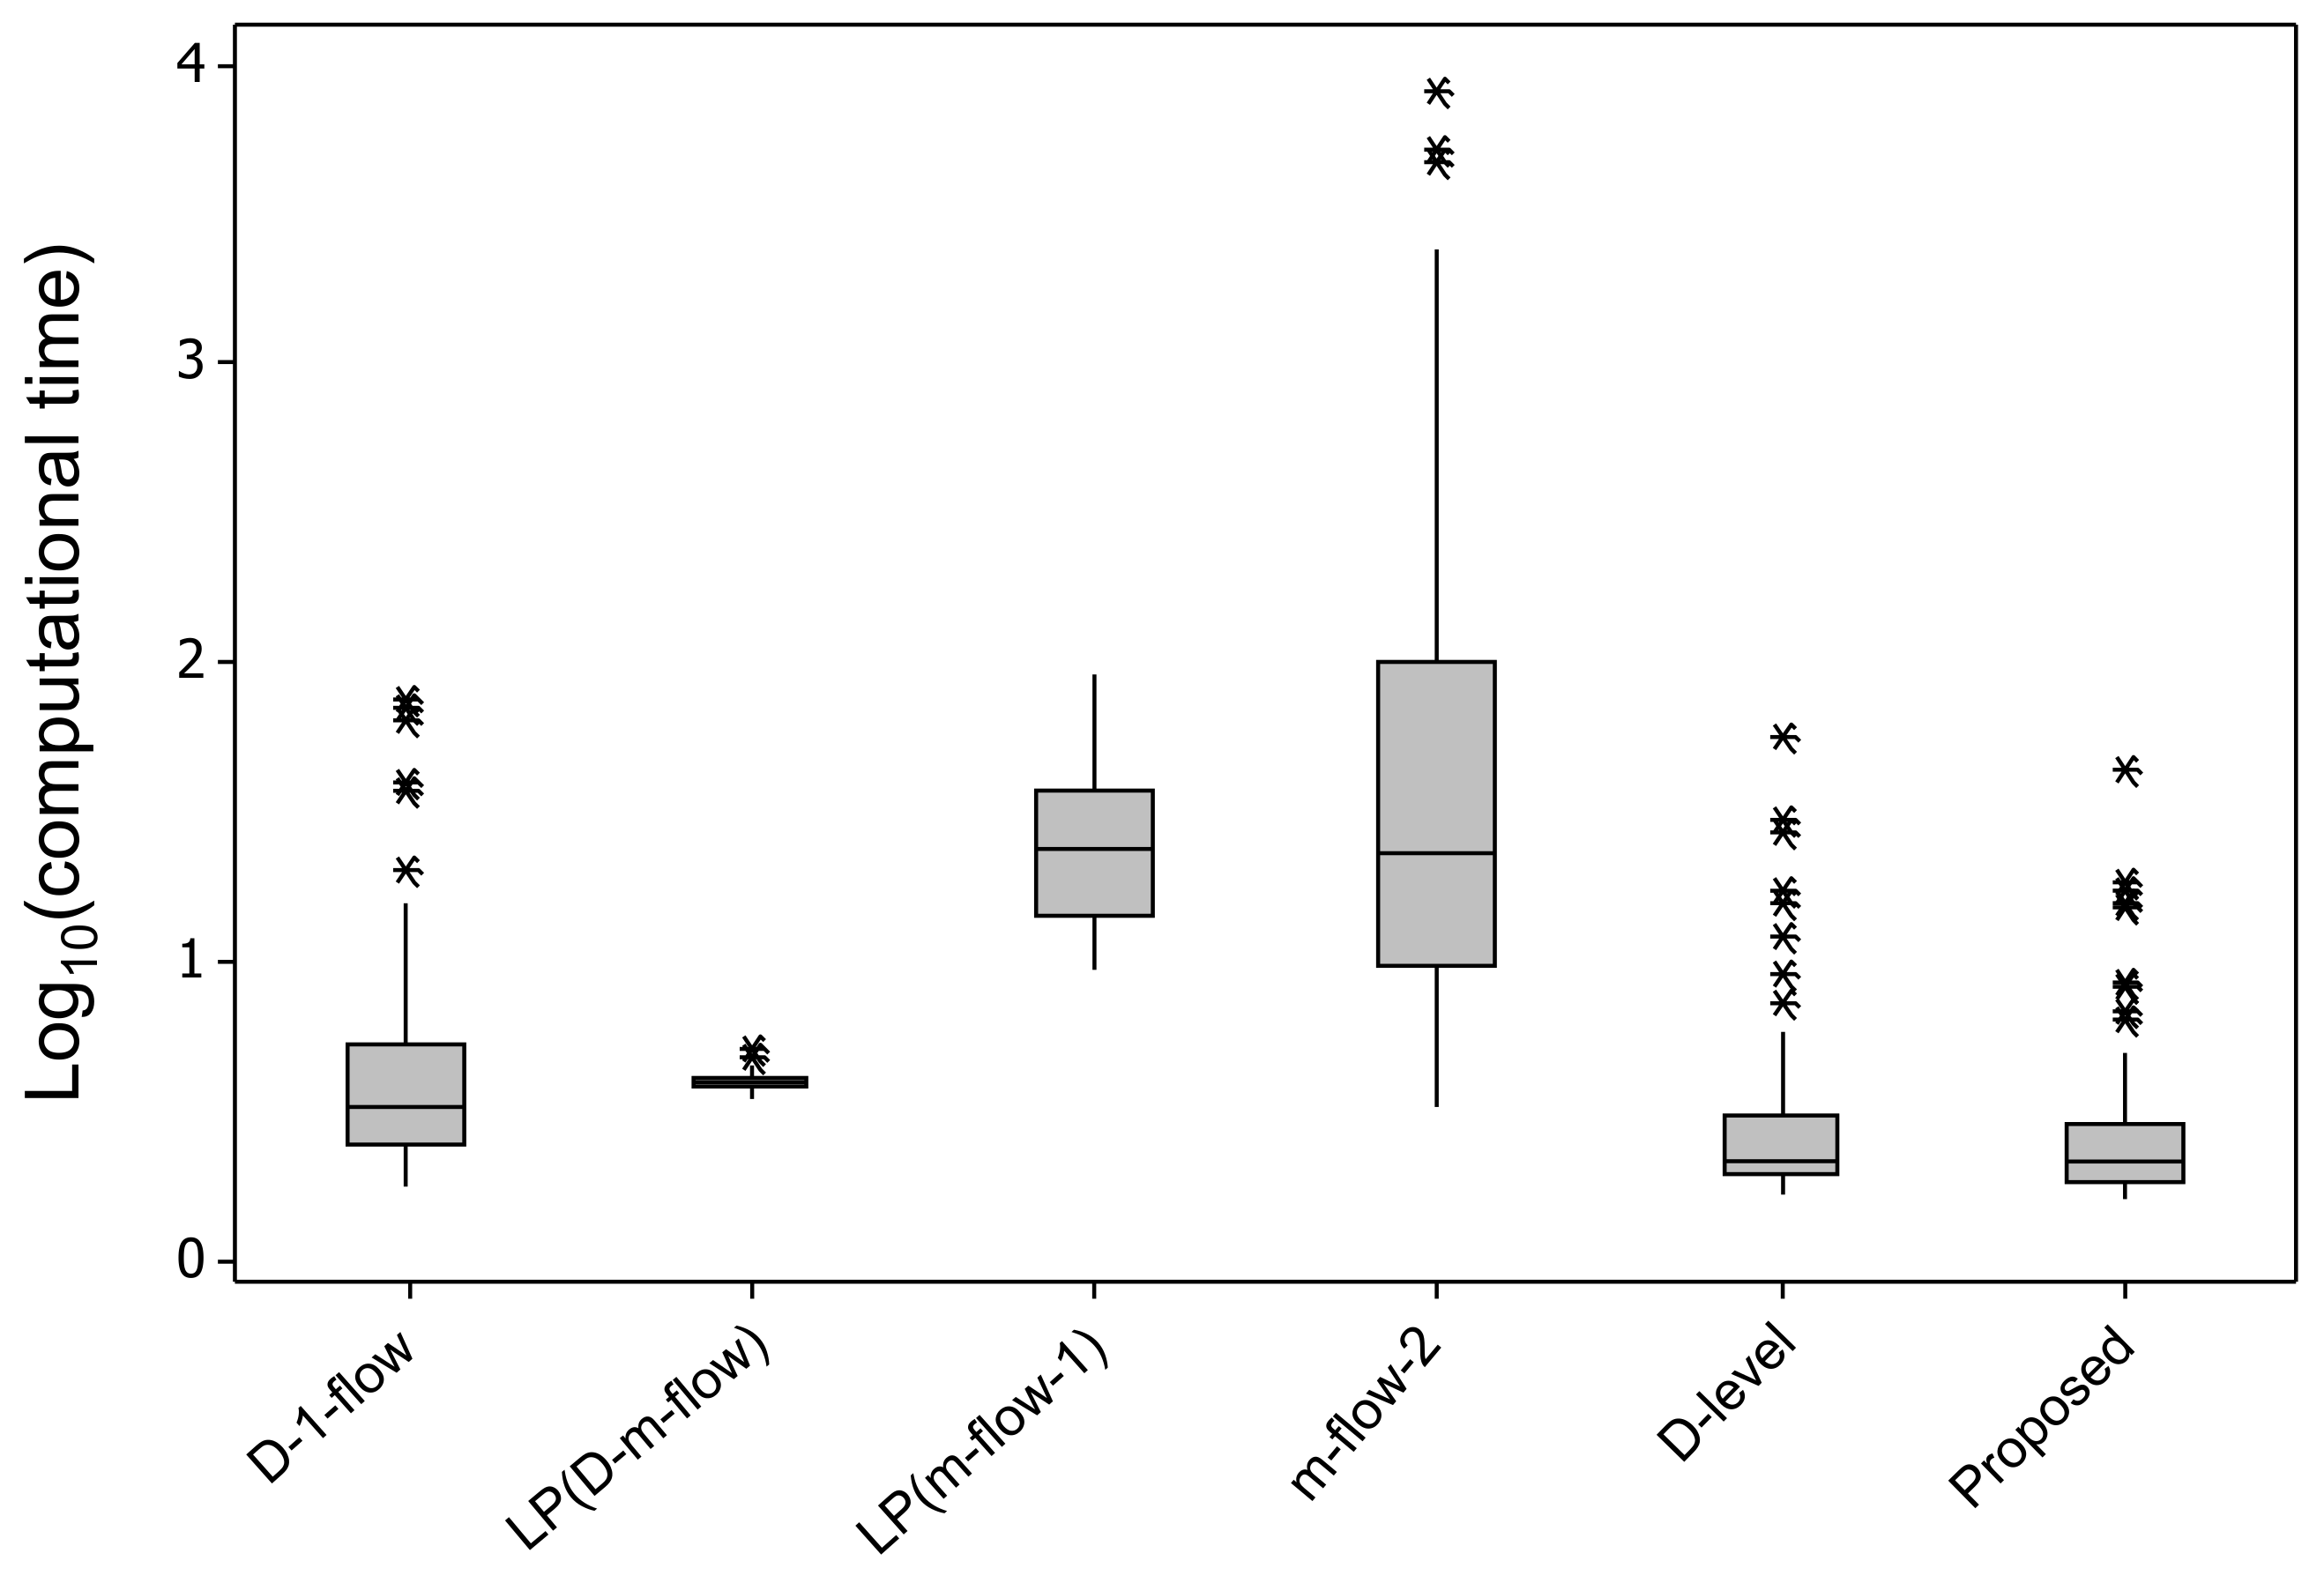
Table 2 presents some descriptive statistics for the total computational time in seconds, and
Figure 4 provides a comparison between the Box and Whisker plots of the models. The logarithm to the base 10 of the computational times is presented in
Figure 4 for a better clarity of the distribution of the points.
Based on the statistics provided in
Table 2, it is evident that the proposed model provides the best performance in terms of the average computational time, followed by the LP relaxation of the D-m-flow model and the D-level model respectively, both with slight differences. However, the LP relaxation of the D-m-flow model has the lowest standard deviation which makes it more robust to changes in the input data. Despite the relatively large variability of the computational times of the D-level and the proposed models, they both have median computational times that are almost half the median computational time of the LP relaxation of the D-m-flow model. This indicates that, in most cases, both models need less computational times, which occurred in 87 and 86 instances for the D-level and the proposed models, respectively, as the detailed results reveal. Meanwhile, the proposed model achieved less computational times in 74 instances compared to the D-level model.
The statistics of the D-1-flow model indicate that it has both higher average and standard deviation values for the computational time when compared to the LP relaxation of the D-m-flow, the D-level and the proposed models. Even though it is capable in some cases to find an optimal solution faster than these three models, which occurred in 12 cases, its computational time in 12 cases was more than twice the computational time of any one of the other three models.
As shown in
Figure 4, It is evident that the m-flow-2 model results in the worst computational time that went over two hours for one of the instances. Furthermore, its standard deviation of the computational time is the highest, which makes it unfavorable candidate when compared to the LP relaxation of the D-m-flow model which has slightly larger number of constraints. Similarly, even though the LP relaxation of the m-flow-1 model is a slight modification of the D-m-flow model, such a modification does not provide any benefit in terms of reducing the computational time.
4.2.2. Results for 40-Node Instances
The second set of experiments excludes both the LP relaxation of the m-flow-1 model and the m-flow-2 model from the comparison as based on the 30-node instances, they are not expected to provide competitive computational times. In the second set of experiments, 100 instances of 40 nodes are randomly generated. Similar to the previous set, node coordinates are random integers generated using uniform distribution between 1 and 100.
Table 3 presents some descriptive statistics for the total computational time in seconds, and
Figure 5 provides a comparison between the Box and Whisker plots of the models.
The results of the 40-node set is coherent with the previous 30-node set. As shown in
Table 3, the proposed model provides the best average computational time followed by the LP relaxation of the D-m-flow model and the D-level model respectively. Meanwhile, the performance of the D-1-flow model is comparatively very poor on average, it has the highest median and standard deviation values, and its computational time exceeded 1.5 h in one instance.
As illustrated in
Figure 5, the LP relaxation of the D-m-flow model has the lowest variability in computational time; nevertheless, its median is more than double the medians of the proposed and the D-level models, which conforms with the results of the 30-node instances. The detailed results reveal that the proposed model is capable of achieving less computational time than the LP relaxation of the D-m-flow model in 81 instances, and less than the D-level model in 78 instances.
4.2.3. Results for 50 and 60-Node Instances
The remaining computations in this paper are intended to compare the proposed model with the LP relaxation of the D-m-flow model. The advantage of the proposed model is attributed to its smaller size, yet the algorithmic techniques used for solving it are not polynomial in time. On the other hand, the latter model is easier to solve using polynomial time algorithms, but due to its larger size, the computational time needed can be larger than the proposed model. Therefore, the intention of conducting computational experiments with 50-node and more than 50-node instances is to investigate and compare the trends of the computational times for both models.
Starting with 50-node instances, the coordinates of the nodes are randomly generated integers uniformly distributed between 1 and 500. Increasing the scale for the generated coordinates compared to previous instances is done to reduce the chances of having duplicate nodes with the same coordinates. However, this does not have any effect on the computational time.
Table 4 presents some descriptive statistics for the total computational time in seconds, and
Figure 6 provides a comparison between the Box and Whisker plots of the two models for all problem sizes investigated so far.
The statistics provided in
Table 4 show that the median of the computational times of the proposed model is a little bit higher than half the median of the LP relaxation of the D-m-flow model which is not significantly different from the results of smaller size instances. However, the proposed model results in an average computational time that is higher than that of the LP relaxation of the D-m-flow model which represents a shift from the results of smaller-size instances. However, in general, the relative distributions of the computational time results of the two models for the 50-node instances are not significantly different from those of smaller instances, as depicted in
Figure 6.
For the 50-node instances, the proposed model achieved less computational times in 74 instances. Even though this number represents a relatively large proportion, it is less than the figures obtained for small size instances, which are 86 and 81 for the 30-node and 40-node instances, respectively. This signifies a downward trend for the proposed model.
To further investigate this trend, additional instances with 60 nodes are randomly generated. Similar to the 50-node instances, the coordinates of the nodes are randomly generated integers uniformly distributed between 1 and 500. only 30 randomly generated instances are sufficient to reveal the deterioration of the performance of the proposed model. It is capable of achieving less computational time in only 13 instances. The median of the computational time of the proposed model is found to be 108.2 s, while, for the LP relaxation of the D-m-flow model, it is found to be 71.49 s. Even though the proposed model can achieve relatively low computational times—less than 10 s in 10 cases—it takes more than 5 min in eight cases with slow convergence rate to a proven optimality. The LP relaxation of the D-m-flow model on the other hand is very stable in its computational time requirement with a mean of 73.42 s and relatively small standard deviation of 9.63 s.
5. Conclusions
Combinatorial optimization problems are characterized by logical relationships that can be represented mathematically using different models. This paper follows an assessment approach for such models that is based on two aspects. The first is the memory size needed; and the second is the computational time needed by a solution algorithm to prove optimality. This paper presents a node level MILP model for the famous combinatorial optimization problem of finding a minimum spanning tree in a given network. Despite the ten existing models in the literature and the polynomial time solution algorithms for this problem, introducing a model with a modified structure can provide more insights for modeling and solving larger problems in which the MST problem is a subproblem.
The proposed model is based on the analogy between rivers and trees, as both do not contain cycles. It is proven that the proposed model will result in valid minimum spanning trees. In terms of the model size, the proposed model has the third lowest number of constraints, which increases polynomially with the number of nodes. Meanwhile, the number of decision variables of the proposed model is the second lowest, which also increases polynomially with the number of nodes.
To compare the proposed model with the other models in terms of the computational time needed to prove optimality of generated solutions, computational experiments were conducted using a state-of-the-art commercial MILP solver. The computational comparison focused only on models that have polynomial number of constraints. These computational experiments were done sequentially using increasing number of nodes in a graph to filter out inefficient models early. Starting with 30-node instances, two multi-commodity flow-based models were found to be inefficient and were excluded from the next set of 40-node instances. The computational results for the 40-node instances showed that the proposed model produces the best results and is competitive with a linear programming relaxation of a digraph multi-commodity flow model. These two models were investigated further using 50-node instances, for which the results showed that the proposed model achieved less computational time in 74 cases out of 100. However, since that figure is found to be decreasing when compared to the previous results of 30- and 40-node instances, additional experiments with 60-node instances were conducted. The latter results suggest that the proposed model may not be efficient with instances of more than 50 nodes. For larger instances, the computational results show slow convergence for the lower and upper bounds. On the other hand, the LP relaxation of the digraph multi-commodity flow model demonstrated stable computational time results; however, its size is relatively large.


