Article

An Approach Based on Intuitionistic Fuzzy Sets for Considering Stakeholders’ Satisfaction, Dissatisfaction, and Hesitation in Software Features Prioritization

1
Department of Digital Systems, University of Thessaly, 41500 Larissa, Greece
2
Department of Informatics, Open Hellenic University, 26335 Patras, Greece
3
VNU Information Technology Institute, Vietnam National University, Hanoi 03000, Vietnam
4
Department of Informatics, Ionian University, 49100 Corfu, Greece
*
Authors to whom correspondence should be addressed.
Mathematics 2024, 12(5), 680; https://doi.org/10.3390/math12050680
Submission received: 16 December 2023 / Revised: 29 January 2024 / Accepted: 21 February 2024 / Published: 26 February 2024
(This article belongs to the Special Issue Applications of Soft Computing in Software Engineering)

Abstract

:
This paper introduces a semi-automated approach for the prioritization of software features in medium- to large-sized software projects, considering stakeholders’ satisfaction and dissatisfaction as key criteria for the incorporation of candidate features. Our research acknowledges an inherent asymmetry in stakeholders’ evaluations, between the satisfaction from offering certain features and the dissatisfaction from not offering the same features. Even with systematic, ordinal scale-based prioritization techniques, involved stakeholders may exhibit hesitation and uncertainty in their assessments. Our approach aims to address these challenges by employing the Binary Search Tree prioritization method and leveraging the mathematical framework of Intuitionistic Fuzzy Sets to quantify the uncertainty of stakeholders when expressing assessments on the value of software features. Stakeholders’ rankings, considering satisfaction and dissatisfaction as features prioritization criteria, are mapped into Intuitionistic Fuzzy Numbers, and objective weights are automatically computed. Rankings associated with less hesitation are considered more valuable to determine the final features’ priorities than those rankings with more hesitation, reflecting lower indeterminacy or lack of knowledge from stakeholders. We validate our proposed approach with a case study, illustrating its application, and conduct a comparative analysis with existing software requirements prioritization methods.

1. Introduction

In this paper, we address the challenge of software features prioritization within the context of planning upcoming software releases. For the purpose of our discussion, we adopt the definition that a software feature constitutes a logically related set of functional requirements, offering a capability to the user or satisfying a business objective [1]. Specifically, we follow the definition that a software feature encompasses a cohesive set of logically related individual functional requirements describing a software product characteristic from the user or customer perspective [2].
While various prioritization methods have been proposed in the literature, they predominantly focus on software requirements rather than software features [3,4]. However, in practical scenarios, software practitioners and developers often do not exhibit a strong preference for a specific prioritization method [5]. Despite the elegance of certain prioritization methods, many of them encounter scalability and complexity issues, hindering their practical application. For instance, powerful prioritization methods that adhere to a ratio-scale approach, such as the Analytical Hierarchy Process (AHP) pairwise comparison method [6], may face challenges in practical implementation due to the extensive and potentially inconsistent comparisons required to prioritize candidate requirements or features. Consequently, practitioners and involved stakeholders may lean towards more practical, ad-hoc, or ordinal-scale (ranking-based) prioritization approaches [7]. In these simpler approaches, stakeholders involved in prioritization, including business experts, end-user representatives, analysts, and software developers [8], straightforwardly rank various candidate features based on one or multiple prioritization criteria. These criteria can vary among stakeholder groups and may encompass aspects such as the features’ business value, implementation cost, or complexity [9]. Once stakeholders express their rankings, the next step involves consolidating (or aggregating) these diverse rankings into a single final priority list. This aggregation relies on subjective weight assignments to individual stakeholders, rankings, or criteria used in the prioritization process.
The precise evaluation and ranking of each software feature, based on multiple prioritization criteria, pose significant challenges for participating stakeholders, particularly when dealing with a large number of software features and a variety of prioritization criteria [10,11]. As the set of candidate features expands, the comparison of each feature against every other feature within the set introduces additional hesitation and uncertainty among stakeholders engaged in what may be inherently imprecise comparisons. This challenge is accentuated when stakeholders encounter features that are relatively “unknown” to them, leading to potentially vague assessments. Stakeholders’ knowledge may not always be comprehensive enough to make precise and confident judgments regarding the implementation cost, technical intricacies, and/or business value of all candidate features. The extent of their understanding may also vary depending on their specific roles. For instance, end users or their representatives may lack detailed insight into the technical implications of software features on the development effort required for the software system.
Consequently, it is foreseeable that some features might remain unranked in certain stakeholders’ assessments, reflecting a lack of confidence or knowledge in their evaluation. Additionally, due to inherent indeterminacy and hesitation, stakeholders may struggle to precisely differentiate the relative value of certain candidate features concerning specific prioritization criteria. It is not uncommon for a stakeholder to assign the same rank to multiple features, indicating their belief in the equal value of these features with respect to the prioritization criterion at hand. Such situations result in features sharing the same rank in some stakeholders’ assessments, highlighting instances where stakeholders may exhibit either a lack of knowledge or indeterminacy/hesitation. These various scenarios, involving unranked features and features with identical ranking scores concerning certain prioritization criteria, necessitate consideration in the features prioritization process. They may signify situations in which stakeholders, involved in the prioritization process, demonstrate either a lack of knowledge or indeterminacy/hesitation.
Building upon our prior contributions [12,13], we have introduced advancements to our software features prioritization approach, addressing the potential sources of stakeholders’ hesitation discussed earlier. This paper significantly extends our previous work by providing a detailed exposition of the mathematical computations integral to the proposed semi-automated prioritization approach. Our extensions delve into the intricacies of the mathematical computations essential for the proposed approach. Furthermore, we present and discuss the outcomes of applying this approach in a case study, shedding light on its practical implications. Additionally, we provide an overview of the current state of tool support for our approach. To ensure a comprehensive evaluation, we meticulously compare our approach with other existing requirements and features prioritization methods. This comparative analysis aims to delineate the preferred context for the application of our proposed approach in practical settings.
In this paper, we introduce a semi-automated approach designed to facilitate the prioritization of medium to large sets of candidate software features. Our approach departs from existing subjective methods by placing a strong emphasis on objectively and automatically quantifying the weights of stakeholders involved in the prioritization process. Central to our approach is the consideration of prioritization criteria that reflect the asymmetric perspectives of stakeholders’ perceived satisfaction and dissatisfaction for the features. To achieve objective weights’ quantification, we leverage the mathematical framework of Intuitionistic Fuzzy Sets (IFSs). This framework allows us to precisely quantify the hesitation and uncertainty exhibited by stakeholders when ranking candidate software features. The results of this hesitation quantification play a pivotal role in the assignment of objective weights to feature rankings and the corresponding stakeholders responsible for these rankings. Furthermore, objective weights are assigned to the criteria used to derive these rankings. A fundamental assumption of our approach is that larger weights should be allocated to rankings, stakeholders, or criteria associated with lower levels of uncertainty and hesitation.
To apply and validate our proposed approach, we conducted a case study within the context of the EDUC8 (EDUCATE) software project. EDUC8, a web-based system [14], aims to develop personalized learning environments utilizing multi-faceted knowledge bases and integrated technologies. The primary objective of EDUC8 is to facilitate personalized learning within higher education settings. In this case study, our focus was on determining the priorities of a medium to large set of candidate features slated for inclusion in the upcoming release of the EDUC8 system. For the prioritization process, we employed satisfaction and dissatisfaction as the key criteria. Stakeholders involved in the EDUC8 project, who were recognized experts, were asked to evaluate their satisfaction with each feature’s inclusion in the next system release and their dissatisfaction with its absence.
Consistent with findings in other research studies [15], we also accounted for the asymmetry between the levels of satisfaction and dissatisfaction associated with the inclusion or absence of specific features in the next system release’s functionality. For the prioritization methodology, we opted for a methodical, systematic, and practical ordinal scale-based approach—the Binary Search Tree (BST) method. This approach, previously demonstrated to scale effectively in prioritization problems, particularly with medium-sized feature sets [16], was chosen for its suitability. During the case study, each stakeholder was tasked with carefully performing a modified variant of the BST ordinal-scale prioritization method twice. This involved ranking features based on satisfaction if the feature is delivered in the next system release and, separately, based on dissatisfaction if the feature is not included in the release. Importantly, the methodology allowed for tied rankings, enhancing the realism of stakeholder assessments.
The foundational mathematical framework of our approach relies on the principles of Intuitionistic Fuzzy Sets (IFSs) [17,18]. Specifically, we leverage IFSs to map the rankings of features, derived from Binary Search Trees (BSTs) provided by stakeholders, into corresponding IFS representations. The concept of hesitation is integral to IFSs and proves particularly suitable for expressing ties in software features’ rankings (i.e., tied features) and unknowns (i.e., unranked features). Consequently, IFSs serve as a suitable mathematical tool for quantifying stakeholders’ indeterminacy and lack of knowledge regarding the evaluation of features [19]. We can utilize the quantification of hesitation in features’ rankings to automatically calculate an objective weight for that ranking. This objective weight may be assigned to the stakeholder who provided the ranking or to the prioritization criterion used to derive the ranking. In the final step, we aggregate the features’ rankings using the calculated objective weights. The result is a suggested prioritization list of features presented to stakeholders. This final list takes into account the inherent hesitation of stakeholders reflected in all features’ rankings.
In the subsequent sections, we delve into the various facets of our research. In Section 2, we conduct a comprehensive review of related work and the background that forms the foundation of our approach. Furthermore, we present a comparative analysis with other approaches from the existing literature. Moving on to Section 3, we elucidate the intricacies of the mathematical method underpinning our approach. This section includes detailed descriptions and examples to enhance the reader’s understanding of the method’s computations. Section 4 focuses on a practical demonstration of our approach through a prioritization case study. This application serves to validate the approach’s efficacy for use in software projects. In Section 5, we thoroughly discuss the case study’s results, analyzing the collected evidence and drawing conclusions to support the robustness of our approach. Section 6 is dedicated to addressing potential threats to the validity of our case study, providing a comprehensive examination of its limitations. Finally, in Section 7, we draw overall conclusions from our research and offer insights into potential future research directions.

2. Related Work

In this section, we provide a concise overview of existing software requirements and features prioritization methods. Additionally, we conduct a comparative analysis between the approach proposed in this paper and other relevant methods in the field. We delve into the concepts of stakeholders’ satisfaction and dissatisfaction, justifying their suitability as features prioritization criteria. Lastly, we briefly review other fuzzy-based methods presented in the literature for the prioritization of software requirements.

2.1. Overview of Software Requirements/Features Prioritization Methods

Software development projects grapple with diverse constraints, including budget limitations, human resource constraints, time constraints, and the intricacies of complex or misunderstood requirements and features [20]. A vital component in mitigating the risks inherent in software development projects is the requirements prioritization process. By devising a plan that ensures the delivery of the most crucial software requirements and features first, stakeholders’ expectations can be effectively met. Therefore, software requirements/features prioritization emerges as the foundational step in a successful software release planning process, prompting the proposal of numerous techniques and methods for this purpose [3,4]).
Methods for software requirements/features prioritization can be categorized based on several key factors:
  • Measuring Scales:
    • Nominal: Candidate requirements/features are classified into classes, with items in each class deemed of equal priority, yet without any inherent ordering.
    • Ordinal: Techniques produce an ordered list of requirements/features in an intuitive manner.
    • Ratio scale-based: Methods provide information about the relative difference between any two requirements/features.
  • Level of Automation:
    • Manual: All steps of the prioritization process are performed manually.
    • Automated: All steps are executed by automated tools or algorithmic techniques without stakeholder intervention.
    • Semi-automated: Some steps are manual, while others are executed by tools/computational techniques.
  • Consideration of Stakeholder Importance [8]:
    • Subjective methods: Few approaches in the literature emphasize prioritizing stakeholders based on their impact, often with limitations such as being time-consuming and lacking automation.
  • Project Size:
    • Small: Fewer requirements or features (i.e., less than 15).
    • Medium: A moderate number of requirements or features (i.e., between 15 and 50).
    • Large: A substantial number of candidate requirements/features (i.e., more than 50) [21,22].
  • Handling Dependencies:
    • Consideration or lack thereof of dependencies among requirements/features, acknowledging that some may functionally or logically depend on each other and should be treated as a group for prioritization and subsequent development planning [23].
This classification scheme provides a nuanced understanding of the diverse characteristics exhibited by different prioritization methods, catering to the unique needs and complexities of software development projects.

2.2. Comparison of the Proposed Approach with Existing Prioritization Methods

Before delving into a discussion of representative prioritization methods and their comparison with our proposed approach, it is essential to position our approach within the aforementioned classification of prioritization methods. Our approach aligns seamlessly with ordinal-scale prioritization methods, such as Simple Ranking, Binary Search Tree (BST), or the Bubble Sort method [3,24]. Ordinal-scale methods, notably BST, offer intuitive and practical applicability, demonstrating effectiveness in handling medium to large sets of requirements due to their simplicity [25]. The suggested approach acts as a complement to and supporter of ordinal-based prioritization techniques. It addresses the inherent challenges of ambiguous and vague information that may arise from the hesitation or uncertainty exhibited by stakeholders involved in the prioritization process when determining feature rankings.
Concerning features’ dependencies, our approach addresses challenges often encountered when prioritizing requirements with interdependencies [23]. To mitigate these issues, we shift the emphasis from prioritizing individual requirements to prioritizing features. Features, in the context of a software system, are regarded as independent functional characteristics that may encapsulate multiple low-level functional requirements [1,2]. While it is acknowledged that features within a software system may possess dependencies and interactions [26], our approach assumes that any existing functional or implementation dependencies between features need not necessarily be considered during the initial steps of the prioritization process. Instead, we advocate addressing these dependencies at subsequent stages in the software product release planning process, aligning with the findings in [15].
A pivotal characteristic of the proposed approach lies in its automatic calculation of objective weights for stakeholders or prioritization criteria. This feature eliminates the necessity of determining weights subjectively or arbitrarily through human decision-making processes, such as relying on a specific decision maker or seeking input from other stakeholders to assign priority. In contrast to many multi-criteria subjective stakeholder prioritization methods, including those outlined in [27,28], our approach takes a distinctive stance by placing emphasis on the objective calculation of participating stakeholders’ weights. We posit that stakeholders engaged in a prioritization process are experts and possess extensive knowledge in the domain of the candidate features to be prioritized. Consequently, objectively deciding and justifying different weights for stakeholders becomes challenging. Therefore, we operate under the assumption that stakeholders are capable of expressing their perspectives with equal or at least similar importance.
In the proposed approach, we adopt, as prioritization criteria, the stakeholders’ asymmetric satisfaction and dissatisfaction from offering and not offering, respectively, candidate features in the next software release. This deliberate focus on stakeholders’ satisfaction and dissatisfaction aims to circumvent challenging compromises that may arise when considering value-cost scenarios [6]. However, it is acknowledged that this choice may render our approach less suitable for projects with resource constraints, as it accentuates the “value” aspect of features—specifically, the satisfaction/dissatisfaction of stakeholders from offering/not offering each candidate feature. Recent research, exemplified by the study in [29], has examined value as the primary criterion in software features selection. This study highlights a current industry shift toward value-based software engineering. Despite this trend, there remains limited clarity on the practical interpretation of value. By placing emphasis on satisfaction and dissatisfaction, our approach endeavors to capture some of the diverse aspects of value considered in [29]. This strategic choice allows our approach to align with the evolving landscape of value-based software engineering, prioritizing stakeholders’ perspectives on the intrinsic worth of candidate features. Similarly, to our approach, authors in [22] have recently identified challenges in existing requirements prioritization techniques, particularly related to their handling of large and complex projects, issues with the quantification of requirements’ priorities, subjective prioritization of stakeholders, and the time-intensive nature of prioritizing extensive sets of requirements due to a lack of automation. To address these concerns, authors in [22] proposed a semi-automated method employing multi-criteria decision-making and clustering techniques (k-means and k-means++) alongside Binary Search Trees (BSTs).
Our approach is of a semi-automated nature and is grounded in the principles of Intuitionistic Fuzzy Sets (IFSs) techniques [17,18]. These techniques are adept at quantifying stakeholders’ hesitation stemming from either their lack of knowledge or indeterminacy—an aspect often overlooked in the current literature. Furthermore, we underscore the importance of the practical applicability of any scientific approach, a sentiment echoed by [30] in the context of static software analysis tools, stating that “sophisticated analysis is not easy to explain or redo manually.” In a recent survey on software requirements prioritization [31], the observation is made that “Some 158 different techniques were researched by those studying requirements prioritization, with AHP featuring most prominently; most solutions were only validated as being operational.” This highlights a lack of empirical evidence partially stemming from challenges in the practical applicability of many prioritization methods. Specifically, in the domain of requirements/features prioritization, approaches relying on automated clustering algorithms or machine learning techniques may face challenges in justifying and explaining results to stakeholders and end users. In contrast, our suggested approach integrates simple mathematical formulas to calculate the final prioritization list, enhancing ease of explanation to stakeholders.
Another recent prioritization approach, employing search-based techniques, has been presented in [32]. This work primarily centers around the cost aspect in requirements prioritization and aims to tackle the issue of cost overruns probability. Similar to our approach, this work endeavors to quantify the inherent uncertainty in requirements prioritization settings. However, it emphasizes the cost aspect rather than the value or satisfaction aspect and employs an automated search-based method to handle stakeholders’ uncertainty and hesitation when evaluating and ranking a set of candidate features.
Additionally, authors in [33] have introduced a novel approach that utilizes users’ ratings derived from questionnaires, incorporating features’ weighting through an optimization technique. This innovative method seeks to advise managers on priority optimization by mining online reviews and automatically assigning weights to features. While this aligns with our approach’s objective of automatically assigning weights to features, the mathematical approach differs. In our case, we assume that selected experts/stakeholders, rather than a broad community of users, are entrusted with the responsibility of performing features’ evaluation and prioritization.
A plethora of prioritization methods has been introduced in the literature, and these find application in both traditional software development projects and, more recently, in agile software development projects [4]. While academic publications often emphasize the mathematical accuracy and elegance of corresponding approaches, practical success is a primary driver. Methods that demonstrate robust results, particularly under specific circumstances, tend to prevail in real-world settings [3].
One notable mathematical framework frequently referenced and utilized is the Analytic Hierarchy Process (AHP) [34]. AHP involves pairwise comparisons of requirements/features based on various criteria, such as their importance to stakeholders, cost/duration of implementation, risk, or the potential damage resulting from not implementing a requirement/feature. Typically, a comparison matrix is constructed for pairwise comparisons, as each item under prioritization needs to be compared to all other candidate items with respect to each prioritization criterion. If criteria weights need determination, pairwise comparisons are also conducted for prioritization criteria. AHP stands out for its ability to provide reliable prioritization results, thanks in part to the computation of consistency ratios across performed pairwise comparisons. In the realm of AHP-based techniques for software requirements/features prioritization, a representative example is the Power Analytic Hierarchy Process (PAHP) method [35]. PAHP combines requirements prioritized by stakeholders through pairwise comparisons with the power priority vector, which is generated by stakeholders ranking each other.
Our approach diverges from prioritization methods like PAHP in two notable aspects. Firstly, our approach operates under the assumption that stakeholders adhere to an ordinal-scale method (such as the Binary Search Tree method—BST) when assessing candidate software features. We conduct ordinal-scale, not ratio-scale, pairwise comparisons of features, a choice that prioritizes ease of use and scalability for a larger number of features requiring prioritization. Secondly, we employ an objective method for weight assignment to the feature orderings, stakeholders, or prioritization criteria. This characteristic renders our approach more suitable for situations where subjectively ranking stakeholders’ power or criteria’s importance is challenging.
An older, widely cited AHP-based approach for requirements prioritization is the Cost–Value technique [6]. This technique utilizes AHP-based pairwise comparisons, with users assessing the relative value of requirements and software engineers evaluating the relative development cost of requirements. The approach produces “cost-value” diagrams, providing managers with justifications for their prioritization decisions. While the Cost-Value approach strives for simplicity and intuitiveness and avoids the need to determine weights for the cost and value criteria, it faces scalability limitations compared to our proposed approach. Moreover, it has not been widely reported to be applied in real settings of software development projects. Furthermore, our approach advocates for prioritizing the value of features, expressed through the satisfaction/dissatisfaction of stakeholders, rather than focusing on the cost aspect. This criterion may be reliably evaluated primarily by stakeholders with technical expertise in software development, such as experienced programmers or testers.
Another AHP-inspired approach is Case-based Ranking (CBRank) [36], which integrates machine learning by combining stakeholders’ evaluations with approximations computed through automated machine learning techniques. CBRank’s primary advantage lies in significantly reducing human efforts in prioritization, making it particularly suitable for small and medium projects. However, CBRank faces limitations, including challenges in handling dependencies among ranked requirements and adapting to ranking updates in response to changes in the candidate requirements’ list.
A similar approach to CBRank is DRank [37], which takes into account requirements’ dependencies, such as contribution dependencies and business dependencies, specified using the i* framework. DRank has been demonstrated to outperform CBRank. Given that many AHP-based approaches involve considerable time for pairwise comparisons, various methods in the literature attempt to circumvent these comparisons. An example of such an approach is Value-Oriented Prioritization (VOP) [38], where requirements receive ratings on a scale from 1 to 10 based on core business values to the software organization. Core business values are subjectively and somewhat arbitrarily assigned weights, also on a scale from 1 to 10. VOP employs an additive weighting technique with the aim of increasing anticipated business value, aligning with a central theme in most agile software development methods. However, limitations of the VOP method primarily stem from the subjective nature of the weighting approach, the neglect of requirements’ dependencies, and the absence of consideration for stakeholders’ uncertainty. Additionally, VOP lacks scalability, as it was primarily designed for use in small software projects implemented by small software development companies.
In addition to AHP, another widely referenced approach in the literature is Quality Functional Deployment (QFD) [39]. QFD employs a matrix where clients’ expectations are chronologically arranged, providing implementation guidelines to developers. However, QFD is a subjective and rather complex technique, primarily suitable for small projects due to scalability issues and challenges related to handling inconsistencies.
Within the realm of agile software development, a popular approach adopted by many organizations, various methods are employed for requirements prioritization. While these methods are generally user-friendly, they often encounter scalability issues and struggle with handling dependencies among requirements, stakeholders’ uncertainty, and the subjective nature of decision making. Notable methods in agile development include the Planning Game, the $100 Test/Allocation Method (also known as Cumulative Voting), the MoSCoW technique, and the Multi-voting system method [3]. According to [3], the ten most referenced prioritization methods in software engineering literature are AHP, Quality Functional Deployment, Planning Game, Binary Search Tree, $100 Allocation (Cumulative Voting), Cost–Value approach, Wieger’s Matrix, Win–Win, Pairwise comparisons, and Priority groups.
The majority of requirement/feature prioritization methods in the literature that assign weights to stakeholders often do so arbitrarily or through ad hoc and subjective decisions made by a designated decision maker [8]. Some methods, such as the one outlined in [28], determine weight assignments using a schema in which each stakeholder assesses the importance of other stakeholders in the group. The reliance on subjectively decided weights for stakeholders or prioritization criteria may introduce bias into rankings, as altering these weights can lead to significant variations in the final priorities of candidate features [38].
In contrast to existing subjective approaches, our method leverages the mathematical framework of Intuitionistic Fuzzy Sets (IFSs) to quantify stakeholders’ hesitation and uncertainty, providing objective weights to stakeholders or selected prioritization criteria. This approach is considered more preferable and realistic in many cases, as it avoids the need for subjective and ad hoc assignments of stakeholders’ and criteria weights. For instance, this assumption could be realistic in prioritization case studies where all stakeholders possess equal and high levels of experience, making them equally significant in decision making for the prioritization of candidate software features.

2.3. Stakeholders’ Satisfaction and Dissatisfaction as Prioritization Criteria

In the application and validation of our approach, we employed stakeholders’ satisfaction and dissatisfaction as prioritization criteria in the analyzed case study. We requested the involved stakeholders to assess their satisfaction with the implementation of each candidate feature in the upcoming software release and their dissatisfaction with the absence of each feature in the same release. Authors in [15], in their review of the literature on software requirements prioritization studies, highlighted that “the majority of prioritization techniques ignore the extent of conjoint consideration of satisfaction and dissatisfaction as feature/requirement prioritization criteria.” This observation is surprising, as the notions of satisfaction and dissatisfaction are inherently intuitive and easy to evaluate. In contrast, other prioritization criteria may be too specific for certain stakeholders, potentially increasing the level of indeterminacy and hesitation in stakeholder rankings. For instance, not all stakeholders may feel confident in evaluating the development cost or the required duration to implement each candidate software feature.
In the prioritization case study under analysis, we initially provided guidance to the participating stakeholders on the application of the Binary Search Tree (BST) prioritization method [16]. The objective was to systematically and methodically rank all candidate features in the product backlog of the EDUC8 project [14] based on satisfaction and dissatisfaction criteria. The overarching goal of the case study was to identify which features must, should, or have be implemented in the second release of the EDUC8 system. The selection of the BST method was motivated by its methodical, systematic, and practical ordinal scale-based prioritization approach, which has demonstrated scalability with medium-sized sets of features [16]. Additionally, the BST method was chosen due to experimental validation indicating that it requires fewer evaluations (comparisons) and generally yields more accurate results compared to methods such as AHP, Planning Game, $100 Test method, and the Planning Game combined with AHP [25]. In the application of the BST method, each involved stakeholder (or the stakeholders collectively as a group) was instructed to systematically construct a binary search tree. This involved comparing features and assigning them to respective tree nodes corresponding to their positions (ranks). Following the application of the method, the feature positioned at the extreme left node of the binary tree held the lowest rank, while the feature at the extreme right node held the highest rank [40].
A fundamental premise of the Binary Search Tree (BST) method involves the requirement for each stakeholder (or the stakeholders collectively as a group) to conduct a comparative evaluation of all candidate features. The objective is to construct a binary search tree, with the total number of nodes equal to the count of all candidate features [41]. Consequently, under normal circumstances, each resulting binary tree is expected to exhibit no tied or unranked features. However, in the application of our approach to the EDUC8 case study, we aimed to explore the impact of stakeholders’ hesitation and lack of knowledge regarding the ranks of features based on satisfaction and dissatisfaction. Stakeholders were explicitly informed of the option to assign more than one candidate feature to the same tree node if they lacked confidence in distinguishing the relative value (satisfaction/dissatisfaction) of these features. Moreover, stakeholders were given the flexibility to leave certain features unassigned to any tree node if they faced uncertainty or hesitation about the value (satisfaction/dissatisfaction) of these features.
In a departure from the traditional application of the BST method, stakeholders were also made aware that they could assign more than one feature to the same node of the binary tree if they believed that these features should be positioned at the same rank, particularly concerning the satisfaction/dissatisfaction criterion. Thus, in the performed case study, we meticulously instructed each stakeholder to perform this modified variant of the BST ordinal-scale prioritization method twice: once for ranking the features based on satisfaction if a feature is delivered in the next system release, and once based on dissatisfaction if a feature is not delivered in the next system release.
As previously mentioned, an inherent asymmetry surfaced between any two rankings provided by the same stakeholder, indicating that the levels of satisfaction and dissatisfaction varied for numerous features. Contrary to the expectation that satisfaction and dissatisfaction would be relatively straightforward for stakeholders to discern compared to more intricate prioritization criteria (such as the cost of requirement implementation, potential penalties or damages resulting from not implementing a requirement, risk associated with realizing a requirement, volatility of a requirement, etc. [9]), the rankings derived from stakeholders still exhibited indeterminacy and hesitation. This effect persisted despite stakeholders employing a systematic ordinal scale-based approach, specifically the Binary Search Tree (BST) method, to compare candidate features and establish their rankings.

2.4. Fuzzy Sets-Based Methods in Software Requirements/Features Prioritization

We are particularly focused on examining the asymmetry between satisfaction and dissatisfaction and the degree of stakeholder hesitation in the computation of features’ priorities. The foundational mathematical framework of the proposed approach in this paper, as previously mentioned, relies on the principles of Intuitionistic Fuzzy Sets (IFSs) [17,18]. Fuzzy set concepts in the realm of software features ranking have also been explored in [42], who introduced a fusion of Fuzzy Set theory and Soft Set theory to address uncertainty in determining criteria weights and importance. This approach involved the computation of weights using fuzzy-soft sets derived from raw data and was compared with other fuzzy-based methodologies. Additionally, authors in [43] presented a method that combines a rough-fuzzy approach with aggregation techniques to ascertain weights and prioritize requirements, especially when stakeholders furnish linguistic subjective evaluations. This enables prioritization and aggregation within a subjective context, taking into consideration the side effects of interactions. Moreover, it incorporates the aggregation of interacting features using two-additive fuzzy measures.
Fuzzy sets provide a valuable framework for addressing uncertainty and vagueness in the feature prioritization process, allowing for the representation of a degree of membership ranging from 0 to 1, in contrast to the binary 0 or 1 membership of classic sets. Intuitionistic Fuzzy Sets (IFSs), an extension of fuzzy sets, further enhance this representation by incorporating not only the degree of membership and non-membership but also the degree of indeterminacy. This extension is particularly beneficial in features prioritization scenarios, where stakeholders may possess diverse opinions or knowledge about the features. In our previous research studies, we integrated IFSs into features prioritization to effectively handle the uncertainty inherent in stakeholder perspectives. Specifically, we proposed an approach that quantifies the asymmetry between satisfaction and dissatisfaction when employed as prioritization criteria. The final priority is determined concerning satisfaction and dissatisfaction by calculating the objective weights of the criteria/rankings [12]. Additionally, IFSs played a pivotal role in another approach for features prioritization, where they were utilized to aggregate stakeholders’ ratings expressing positive, negative, and “neutral/don’t know” assessments. This approach is further supported by a consensus-reaching technique [44].
Fuzzy sets have found application in enhancing classical prioritization techniques, notably in the Fuzzy Analytic Hierarchy Process (AHP). In the Fuzzy AHP, pairwise comparisons of candidate features and hierarchical criteria are conducted using linguistic terms expressed in triangular or trapezoidal functions, deviating from traditional numerical values [45]. Recognizing the scalability challenges associated with AHP and similar techniques, especially in extensive software projects where stakeholders need to evaluate numerous features, we introduced a Recommender System (RS) within the context of features prioritization. This RS leverages collaborative filtering techniques to mitigate information overload during the rating of candidate features and integrates Intuitionistic Fuzzy Sets (IFSs) to adeptly represent stakeholders’ uncertainties [46]. The effectiveness of this approach was validated using a publicly available dataset, yielding promising results. Moreover, researchers have explored the combination of techniques from neural networks with fuzzy AHP for ranking requirements [45]. Additionally, a fusion of neural networks with a fuzzy inference system was employed to handle uncertainties in the context of planning the next software release [47]. These efforts showcase the versatility of fuzzy sets in addressing complexities and uncertainties within various aspects of the software development lifecycle.
In the current study, we transform the features’ rankings, derived from the binary search trees provided by stakeholders, into corresponding Intuitionistic Fuzzy Sets (IFSs). This preference for IFSs over alternative mathematical constructs stems from their unique ability to extend Fuzzy Sets by incorporating the concept of “hesitation”. In an IFS, each element possesses a degree of both membership and non-membership simultaneously. Notably, the values representing these two aspects, namely the membership and non-membership values, do not necessarily sum up to unity. The remaining portion is identified as the “hesitation degree”. The intrinsic nature of hesitation within IFSs renders them particularly well-suited for capturing nuances in items’ rankings, such as tied items or unranked items. This inherent capability of IFSs proves instrumental in mathematically quantifying stakeholders’ indeterminacy and their lack of knowledge when confronted with the task of evaluating a set of alternatives.
Subsequently, we employ a quantification method, as proposed in [19], to calculate the level of hesitation present in features’ rankings. This method facilitates the automated computation of objective weights for the features rankings. Our approach assigns higher importance, signified by elevated weights, to features’ rankings associated with lower levels of stakeholders hesitation. The rationale behind this prioritization is rooted in the understanding that rankings with reduced hesitation are indicative of lesser indeterminacy and greater knowledge on the part of stakeholders. Subsequently, we aggregate all features’ rankings from stakeholders using these objective weights. The culmination of this process results in the proposal of a final prioritization list for the candidate features, ensuring due consideration of stakeholders’ inherent hesitation across all rankings.

3. Problem and Method Description

3.1. Mapping Features Rankings into IFSs

The proposed approach adopts the concepts of Intuitionistic Fuzzy Sets (IFSs) to represent features’ rankings derived from stakeholders’ evaluations. Let X denote a universe of discourse. An IFS C in X is defined as follows [17,18]:
C = { < x , μ C ( x ) , u C ( x ) , π C ( x ) > | x X }
where μ C : X [ 0 , 1 ] , u C : X [ 0 , 1 ] , 0 μ C ( x ) + u C ( x ) 1 , and π C ( x ) = 1 μ C ( x ) u C ( x ) for all x X . Functions μ C ( x ) and u C ( x ) represent, respectively, the degree of membership and the degree of non-membership of an element x X to C, while function π C ( x ) represents the hesitation degree of whether x X belongs or does not belong to C.
Considering a software features prioritization problem, let F = { f ! , f 2 , , f n } denote a set of functionally independent software features (composite functional requirements) candidate for prioritization, development, and inclusion in the next software release. All candidate features in this set, comprising the software product backlog, must be assessed and evaluated by stakeholders { s ! , s 2 , , s k } with respect to selected prioritization criteria. This work assumes that the prioritization criteria adopted by stakeholders are satisfaction (S) from including a feature and dissatisfaction (D) from excluding a feature in/from the next software release. Each stakeholder s k provides two ranking vectors for the candidate features based on these prioritization criteria, applying an ordinal-scale method (e.g., Simple Ranking, Binary Search Tree, or Bubble Sort) twice. The resulting ranking vectors given by stakeholder s k are expressed as { R S 1 k , R S 2 k , , R S n k } and { R D 1 k , R D 2 k , , R D n k } , where R S i k is the rank (position) of feature f i among all other features with respect to criterion S (satisfaction) and R D i k is the rank (position) f i among all other features with respect to criterion D (dissatisfaction).
By applying the technique suggested in [19], each of these two ranking vectors provided by each stakeholder s k can be represented by corresponding vectors of Intuitionistic Fuzzy Numbers (IFNs). This technique utilizes two functions, namely w o r s e p j k ( f i ) and b e t t e r p j k ( f i ) , defined as follows: For each feature f i , w o r s e p j k ( f i ) is the total number of features surely worse than feature f i with respect to the chosen prioritization criterion p j , according to the ranking provided by stakeholder s k . Similarly, for each feature f i , b e t t e r p j k ( f i ) is the total number of features surely better than feature f i with respect to the prioritization criterion p j , according to the ranking provided by stakeholder s k . The following three Equations (2)–(4), are then used to compute the membership, non-membership, and hesitation degree of the IFS P j = { < f i , μ p j k ( f i ) , u p j k ( f i ) , π p j k ( f i ) > | f i F } . In particular, P j is an IFS that represents, in terms of IFNs, the ranking vector of the features R p j k given by stakeholder s k with respect to the prioritization criterion p j . The membership degree μ p j k ( f i ) expresses how much feature f i satisfies the criterion p j , the non-membership degree u p j k ( f i ) expresses how much feature f i fails to satisfy the criterion p j , and the hesitation degree π p j k ( f i ) denotes the level of indeterminacy of whether feature f i satisfies/dissatisfies criterion p j .
μ p j k ( f i ) = w o r s e p j k ( f i ) n 1
u p j k ( f i ) = b e t t e r p j k ( f i ) n 1
π p j k ( f i ) = 1 μ p j k ( f i ) u p j k ( f i )
where 0 μ p j k ( f i ) + u p j k ( f i ) 1 .
Example: Let us illustrate the application of the proposed method through a hypothetical scenario. Assume a stakeholder evaluates six candidate features, denoted as f 1 , f 2 , , f 6 , based on the satisfaction criterion. The resulting ranking vector from the stakeholder is { 1 , 3 , 3 , 2 , N , N } , indicating that f ! is ranked 1 st , f 4 is 2 nd , f 2 and f 3 are tied for 3 rd (suggesting potential indeterminacy or difficulty in distinguishing satisfaction levels for these features), and f 5 and f 6 are not ranked, reflecting uncertainty or a lack of knowledge in comparing these features.
Applying Equations (2)–(4), this ranking vector (i.e., { 1 , 3 , 3 , 2 , N , N } ) can be transformed into the following vector of IFNs: {(0.6, 0, 0.4), (0, 0.4, 0.6), (0, 0.4, 0.6), (0.4, 0.2, 0.4), (0, 0, 1), (0, 0, 1)} where, for example, (1) the membership, (2) the non-membership, and (3) the hesitation degrees of the feature f ! , with regard to the satisfaction criterion, are respectively calculated as follows:
( 1 ) 3 5 = 0.6 , ( 2 ) 0 5 = 0 , ( 3 ) 1 0.6 0 = 0.4

3.2. Quantifying the Hesitation of Stakeholders

The mapping of features’ rankings into IFNs (by using Equations (2)–(4)) can be particularly useful to quantify the total hesitation H ( R p j k ) associated with each ranking vector R p j k given by stakeholder s k when ranking the candidate software features with respect to the prioritization criterion p j . This total hesitation H ( R p j k ) is calculated by applying the following formula [19]:
H ( R p j k ) = i = 1 n ( 1 μ p j k ( f i ) u p j k ( f i ) ) = i = 1 n π p j k ( f i )
Example: In the running example, we can use Equation (5) to quantify the total hesitation of the stakeholder who provided the previously considered ranking vector of the six candidate features based on the satisfaction criterion (i.e., the vector { 1 , 3 , 3 , 2 , N , N } ). According to Equation (5), the total hesitation “inherent” in this ranking vector is calculated as equal to: 0.4 + 0.6 + 0.6 + 0.4 + 1 + 1 = 4.0 , where this result is calculated by summing the hesitation degrees of the IFNs in the corresponding IFNs vector: {(0.6, 0, 0.4), (0, 0.4, 0.6), (0, 0.4, 0.6), (0.4, 0.2, 0.4), (0, 0, 1), (0, 0, 1)}. Let us also assume that another stakeholder also ranked the same six features, by considering satisfaction as prioritization criterion, and he/she provided the ranking vector {1, 3, 4, 2, 5, 6} (i.e., in this ranking vector, there are no tied and unranked features). Based on Equations (2)–(4), this second ranking vector can be also mapped into a corresponding IFNs vector: {(1, 0, 0), (0.6, 0.4, 0), (0.4, 0.6, 0), (0.8, 0.2, 0), (0.2, 0.8, 0), (0, 1, 0)}, where the total hesitation associated with the ranking vector provided by the second stakeholder is quantified as equal to 0.
The total hesitation, as computed by Equation (5), has been proven [19] to be equal to the sum of two hesitation components: (i) the hesitation due to the indeterminacy H indet ( R p j k ) of stakeholder s k , expressed by the tied features in the ranking vector R p j k that they provide; (ii) the hesitation due to lack of knowledge H lack _ know ( R p j k ) of stakeholder s k , expressed by the unranked features in the ranking vector R p j k that they provide. These two hesitation components are calculated, respectively, by the following two Equations [19]:
H indet ( R p j k ) = i = 1 t k i ( k i 1 ) n 1
H lack _ know ( R p j k ) = ( n m ) m n 1 + m
where t is the total number of different ranks (positions) in the feature ranking R p j k , k i is the total number of features positioned at the same rank i, and m is the total number of unranked features.
Example: In the running example, we can use Equations (6) and (7) to quantify the two components comprising the first stakeholder’s hesitation. In particular, by applying Equation (6), the first hesitation component (i.e., the hesitation due to the stakeholder’s indeterminacy that is expressed by tied features in the ranking) is equal to:
1 ( 1 1 ) 6 1 + 1 ( 1 1 ) 6 1 + 2 ( 2 1 ) 6 1 = 0 + 0 + 2 5 = 0.4
By applying Equation (7), the second hesitation component (i.e., the hesitation due to the stakeholder’s lack of knowledge expressed by unranked features in the ranking) is calculated equal to:
( 6 2 ) 2 6 1 + 2 = 8 5 + 2 = 1.6 + 2 = 3.6
It should be noticed that the total hesitation, by considering both hesitation components, is equal to 0.4 + 3.6 = 4.0 , and therefore, it is equal to the value that was calculated before by using Equation (5).
The method proposed in [19] for calculating the indeterminacy component H indet ( R p j k ) in the total hesitation has a notable limitation. This limitation arises from the fact that the indeterminacy component, as quantified by Equation (6), does not account for the positions (ranks) of tied features in the ranking vector R p j k . Consequently, this approach may assign the same indeterminacy value to any two ranking vectors with the same total number of tied features but in different rank positions.
This limitation holds implications for accurately quantifying the hesitation arising from a stakeholder’s indeterminacy. In practice, stakeholders are often expected to assign the most perceived valuable features to different, highly prioritized positions in their rankings. Consequently, a scenario with a significant number of tied features occupying the same top position in a ranking vector could signify high stakeholder indeterminacy. Conversely, stakeholders may face challenges in distinguishing among the priorities of less valuable (unimportant) features, leading to the placement of these features at the same, very low position in a ranking vector. As a result, a substantial number of tied features at the same very low position in a features ranking vector might not consistently indicate high stakeholder indeterminacy, unlike the scenario where tied features are concentrated at top positions in the ranking vector.
Issues related to tied priorities in requirements have been documented in various requirements prioritization case studies, shedding light on potential challenges in the process. For instance, authors in [48] conducted a prioritization case study within a market-driven software development project. In their findings, they observed a noteworthy phenomenon where all stakeholders assigned the same priority to numerous requirements, particularly those deemed to have very low priority values. This observation aligns with a specific challenge known as the “problem of zeros” within the context of the Cumulative Voting prioritization method [49]. This issue, as identified in [50], manifests when stakeholders consistently assign zero rates or very low rates to a considerable number of requirements, often indicating a collective perception of these requirements as unimportant.
These instances highlight the complexities involved in eliciting distinct priorities, especially for less critical requirements. The tendency for stakeholders to converge on similar low-priority assessments raises questions about the effectiveness of certain prioritization methods in capturing the nuanced distinctions among less crucial features or requirements. Addressing such challenges becomes crucial for refining prioritization approaches and ensuring a more accurate representation of stakeholders’ preferences, particularly in scenarios where certain features are collectively considered less significant.
Consequently, in order to consider the effect of the positions of the tied features, we can also determine, in an alternative way, the indeterminacy component H indet ( R p j k ) of the total hesitation in a stakeholder’s ranking. In particular, we can modify the Equation (6) as follows:
H indet ( R p j k ) = i = 1 t k i ( k i 1 ) n 1 ( t i + 1 )
Therefore, the overall hesitation in the ranking vector R p j k provided by stakeholder s k , when assessing the candidate features according to criterion p j , is the sum of the indeterminacy component H indet ( R p j k ) , representing tied features, and the lack of knowledge component H lack _ know ( R p j k ) , representing unranked features:
H ( R p j k ) = H indet ( R p j k ) + H lack _ know ( R p j k )
where, H lack _ know ( R p j k ) is determined using Equation (7), while H indet ( R p j k ) can be computed using either Equation (6) or the modified Equation (9).
Example: In the hypothetical scenario mentioned above, consider six candidate features f ! , f 2 , f 3 , f 4 , f 5 , and f 6 ranked by two stakeholders based on the satisfaction criterion. The ranking vector of features provided by the first stakeholder is { 1 , 3 , 3 , 2 , N , N } , while the ranking vector of features provided by the second stakeholder is { 1 , 2 , 2 , 3 , N , N } . These two ranking vectors have the same total number of tied features (2), but the tied features in these vectors appear at different positions. The first stakeholder expresses certainty about satisfaction with the delivery of the first feature ( f ! ) and the second most preferred feature ( f 4 ), while expressing hesitation about features f 2 and f 3 , ranking both at the third (lowest) position in the satisfaction criterion. The second stakeholder is certain about the most valuable feature ( f 1 ) and the least preferred feature ( f 4 ) according to the satisfaction criterion. However, there is hesitation about features f 2 and f 3 , ranking both at the second position. It is reasonable to conclude that the hesitation of the first stakeholder is slightly less than the hesitation of the second stakeholder. This is because the former is certain about the two most valuable features, while the latter is certain about the most preferable feature but less certain about the second feature in terms of the satisfaction criterion.
We can use Equations (2)–(4) to transform the two ranking vectors into two vectors of Intuitionistic Fuzzy Numbers (IFNs): {(0.6, 0, 0.4), (0, 0.4, 0.6), (0, 0.4, 0.6), (0.4, 0.2, 0.4), (0, 0, 1), (0, 0, 1)} (representing the ranking vector by the first stakeholder), {(0.6, 0, 0.4), (0.2, 0.2, 0.6), (0.2, 0.2, 0.6), (0, 0.6, 0.4), (0, 0, 1), (0, 0, 1)} (representing the ranking vector by the second stakeholder).
By applying Equation (6), the hesitation of both stakeholders due to their indeterminacy (expressed by the tied features in the respective rankings) is the same and calculated equal to 0.4 for both stakeholders:
1 ( 1 1 ) 6 1 + 1 ( 1 1 ) 6 1 + 2 ( 2 1 ) 6 1 = 0 + 0 + 2 5 = 0.4 ( stakeholder # 1 )
1 ( 1 1 ) 6 1 + 2 ( 2 1 ) 6 1 + 1 ( 1 1 ) 6 1 = 0 + 2 5 + 0 = 0.4 ( stakeholder # 2 )
By applying Equation (8), however, the hesitation values due to the stakeholders’ indeterminacy are different and they are calculated as follows:
1 ( 1 1 ) 6 1 ( 3 1 + 1 ) + 1 ( 1 1 ) 6 1 ( 3 2 + 1 ) + 2 ( 2 1 ) 6 1 ( 3 3 + 1 ) = 0 + 0 + 2 5 = 0.4 ( stakeholder # 1 )
1 ( 1 1 ) 6 1 ( 3 1 + 1 ) + 2 ( 2 1 ) 6 1 ( 3 2 + 1 ) + 1 ( 1 1 ) 6 1 ( 3 3 + 1 ) = 0 + 4 5 + 0 = 0.8 ( stakeholder # 2 )

3.3. Computing Rankings Weights and Features Priorities

When stakeholders prioritize a large set of candidate software features, they may leave some features with unknown ranks or assign multiple features the same rank, possibly due to their lack of knowledge and indeterminacy. In this way, stakeholders express hesitation regarding the evaluation of the candidate features. If many tied and unknown features are present in the rankings, the total hesitation of stakeholders could be significant. This issue needs consideration as high total hesitation values in feature rankings may potentially negatively impact the quality and validity of the final prioritization results. In our proposed method, we explicitly consider the hesitation and uncertainty exhibited by stakeholders engaged in the feature prioritization process. We have the flexibility to leverage either the individual hesitation components (attributed to tied or unranked features) or the total hesitation value (arising from both tied and unranked features) to quantify the significance of rankings provided by stakeholders in the prioritization process. Specifically, our method employs a technique outlined in [51] for determining objective weights, often referred to as “entropy” weights, in intuitionistic fuzzy decision-making scenarios.
Unlike many manual and subjective prioritization methods where weights are assigned arbitrarily and subjectively to stakeholders, our approach introduces a key concept of automatically calculating objective weights for stakeholders. The underlying principle is that the higher the hesitation associated with a specific stakeholder’s ranking of features according to a chosen criterion, the smaller the weight assigned to that ranking in the computation of the final features’ priorities based on the selected criterion. Consequently, this technique assigns larger weights to rankings (and, by extension, stakeholders expressing them) associated with less hesitation.
Suppose that n features { f 1 , f 2 , , f n } are ranked by each stakeholder in a set { s 1 , s 2 , , s k } according to a prioritization criterion p j . The weight W ( R p j l ) of the ranking vector R p j l provided by stakeholder s l ( 1 l k ) when ranking the candidate features with respect to criterion p j can be calculated as follows [51]:
W ( R p j l ) = 1 H avg ( R p j l ) k l = 1 k H avg ( R p j l )
where 1 l k , W ( R p j l ) [ 0 , 1 ] , l = 1 k W ( R p j l ) = 1 , H avg ( R p j l ) = H ( R p j l ) n , and 0 H avg ( R p j l ) 1 .
The final priority of each software feature f i ( 1 i n ), according to the prioritization criterion p j , is derived by considering the objective weights of the ranking vectors (as computed by Equation (10)). Specifically, the priority of each software feature can be calculated by a measure called the weighted correlation coefficient ( W C C i ( F * , f i ) ). This measure represents the “distance” between each feature f i and the “ideal” feature F * , which is the feature associated with a rank expressed by the following Intuitionistic Fuzzy Number (IFN): ( μ ( F * ) , u ( F * ) , π ( F * ) ) = ( 1 , 0 , 0 ) (i.e., an IFN having a membership degree equal to 1). The priority W C C i ( F * , f i ) is calculated as follows [51]:
W C C i ( F * , f i ) = l = 1 k W ( R p j l ) μ p j ( f i ) l = 1 k W ( R p j l ) μ p j 2 ( f i ) + u p i 2 ( f i )
Example: Let us assume that a specific stakeholder ranked a rather large software feature set which includes 27 candidate software features f 1 , f 2 , , f 27 based on satisfaction/dissatisfaction from including/excluding features as part of the next software release. Two feature ranking vectors are derived by evaluating the candidate features based on these two (asymmetric) criteria, and these rankings are both shown in Table 1 along with the respective IFN that expresses each feature rank. Please notice that both ranking vectors contain unranked and tied features. As discussed before, the hesitation that is inherent in each ranking vector can be quantified (by using Equation (9)) as the sum of the hesitation due to tied features (i.e., the indeterminacy component) and the hesitation due to unranked features (i.e., the lack of knowledge component), where, in particular, the hesitation due to tied features can be calculated either by Equation (6) or by Equation (8).
In this example, for simplicity, only Equation (6) is considered, neglecting the positions of tied features in each feature ranking. The total hesitation values in the ranking vectors are presented at the bottom of Table 1, along with the average total hesitation that serves as input in Equation (10) for computing the objective weight of each ranking. The objective weight of each ranking (and, consequently, the objective weight for the corresponding criterion used to derive the ranking) is displayed in the last row of Table 1. It is noteworthy that the weight of the first ranking provided by the stakeholder based on the satisfaction criterion is slightly larger (0.535) than the weight of the second ranking (0.464) provided by the same stakeholder based on the dissatisfaction criterion. This discrepancy is attributed to the smaller total hesitation of the stakeholder in the first ranking (8.230) compared to the total hesitation in the second ranking (10.692). These weights are then applied in Equation (11) to calculate final priority values for the candidate features, expressed by corresponding weighted correlation coefficients. All intermediate results of the computations applied by Equation (11) are detailed in Table 2, with the final priority values (WCC values) of the candidate features shown in the last column of Table 2.
Finally, it is important to note that in Equation (10), the objective weight of each ranking vector R p l is computed by considering the average total hesitation H avg ( R p l ) in the ranking vector R p l , whereas the total hesitation H ( R p l ) is computed by Equation (9). Following the concept of “entropy” [51], if the entropy value (i.e., the hesitation) in a ranking vector is small across all candidate software features, it should provide more valuable information for the final prioritization of the features, and this ranking should receive a higher weight.
As a distinctive feature of our approach, it calculates objective weights for the stakeholders’ ranking vectors. This approach is particularly relevant in scenarios where all stakeholders are highly experienced in their respective domains, making it challenging to subjectively decide and justify different weights for each stakeholder’s importance.
When stakeholders’ evaluations carry varying degrees of importance, it becomes beneficial to account for the significance or weight assigned to each stakeholder in determining the final prioritization outcome. In such instances, a combination of both objective and subjective weighting can be employed, similar to the approach proposed by [52].
Specifically, a subjective weight W subj ( R p l ) can be considered for the ranking vector R p l provided by stakeholder s l (where 1 l k ) when ranking the candidate features concerning criterion p j . Here, W subj ( R p l ) is in the range [ 0 , 1 ] , and l = 1 k W subj ( R p l ) = 1 .
The final combined weight for the ranking vector can then be computed by incorporating both objective and subjective weights, expressed as W comb ( R p l ) = α W ( R p l ) + β W subj ( R p l ) , subject to α + β = 1 , α 0 , and β 0 . Here, the coefficients α and β represent the relative importance of the objective and subjective weights, respectively.

4. Prioritization Case Study

4.1. Case Study Context

To validate the proposed prioritization approach, we conducted a case study within the EDUC8 (EDUCATE) software development project. EDUC8 focuses on delivering an integrated information technology solution for the dynamic recommendation and execution of personalized academic plans in higher education settings [14]. The EDUC8 software system [53] provides a unified software environment for various stakeholders, including academic advisors, educators, managers, and administrative personnel within Higher Education Institutions (HEIs). EDUC8 is designed to address the diverse nature of their tasks, responsibilities, and personal experiences.
The EDUC8 project underwent a two-year iterative analysis, design, and development process, resulting in the creation of three system releases. These releases followed a structured approach involving requirements analysis, formulation of functional specifications, software architecture design and implementation, rigorous testing, validation, and eventual software deployment. The initial system release underwent in-house testing at the University of Thessaly, involving key stakeholders such as academic advisors responsible for guiding university students in selecting lifelong learning programs.
During this testing phase, stakeholders were actively engaged in providing feedback, maintaining a journal of suggestions for improvements, additional features, and change requests pertaining to software stability and usability. Prior to the features ranking and prioritization session with stakeholders, the EDUC8 development team, in collaboration with researchers involved in the current study, conducted a comprehensive brainstorming session. The objective was to compile a list of features to be considered for implementation in the second system release. Following a thorough review and analysis of the identified features, the stakeholder team collectively settled on 27 candidate features for inclusion in the EDUC8 software system. These features are meticulously detailed in Table 3.
As previously mentioned, the proposed approach operates under the assumption that candidate software features are independent functional components. This implies that these features are designed to have minimal functional, precedence, or coupling interdependencies among them [23]. The case study presented in this paper adheres to this assumption. This non-general assumption holds true for all features evaluated in the case study, as each feature in the list presented in Table 3 represents a coherent set of functionalities fulfilling a specific functional goal of the EDUC8 system.
In accordance with the definition of a software product feature provided in [1], each feature can be developed autonomously. They can be seamlessly incorporated as add-ons to the implemented system prototype in subsequent system releases. For instance, f 11 involves the integration of a machine learning add-on module, as described in [54], designed to predict student outcomes and enhance decision making. Similarly, f 10 entails the implementation of an extension based on a Web Ontology Language (OWL) API. This extension can be developed, deployed, operated, and scaled without affecting the functionality of other software components.

4.2. Stakeholders Selection

At the beginning of the case study, we specified the suitable roles and the number of stakeholders that could be engaged in the features prioritization process to obtain a representative group of involved participants. Five stakeholders participated in the features prioritization/ranking case study, and they are listed in Table 4. The low number of stakeholders that participated during the experiment could be considered a possible threat to the validity of the case study. This is a threat that was nearly impossible to remove because a larger pool of participants would be obtrusive to the experiment hosting team. However, the selected stakeholders had extensive professional experience that perfectly covered all EDUC8 software modules and features, as well as a clear picture of the EDUC8 project business needs and priorities. Considering that the participating stakeholders were experts and all had been involved in the development of the previous (first) release of the EDUC8 software system, they were considered trustworthy to provide justified, precise, and valid features’ rankings.

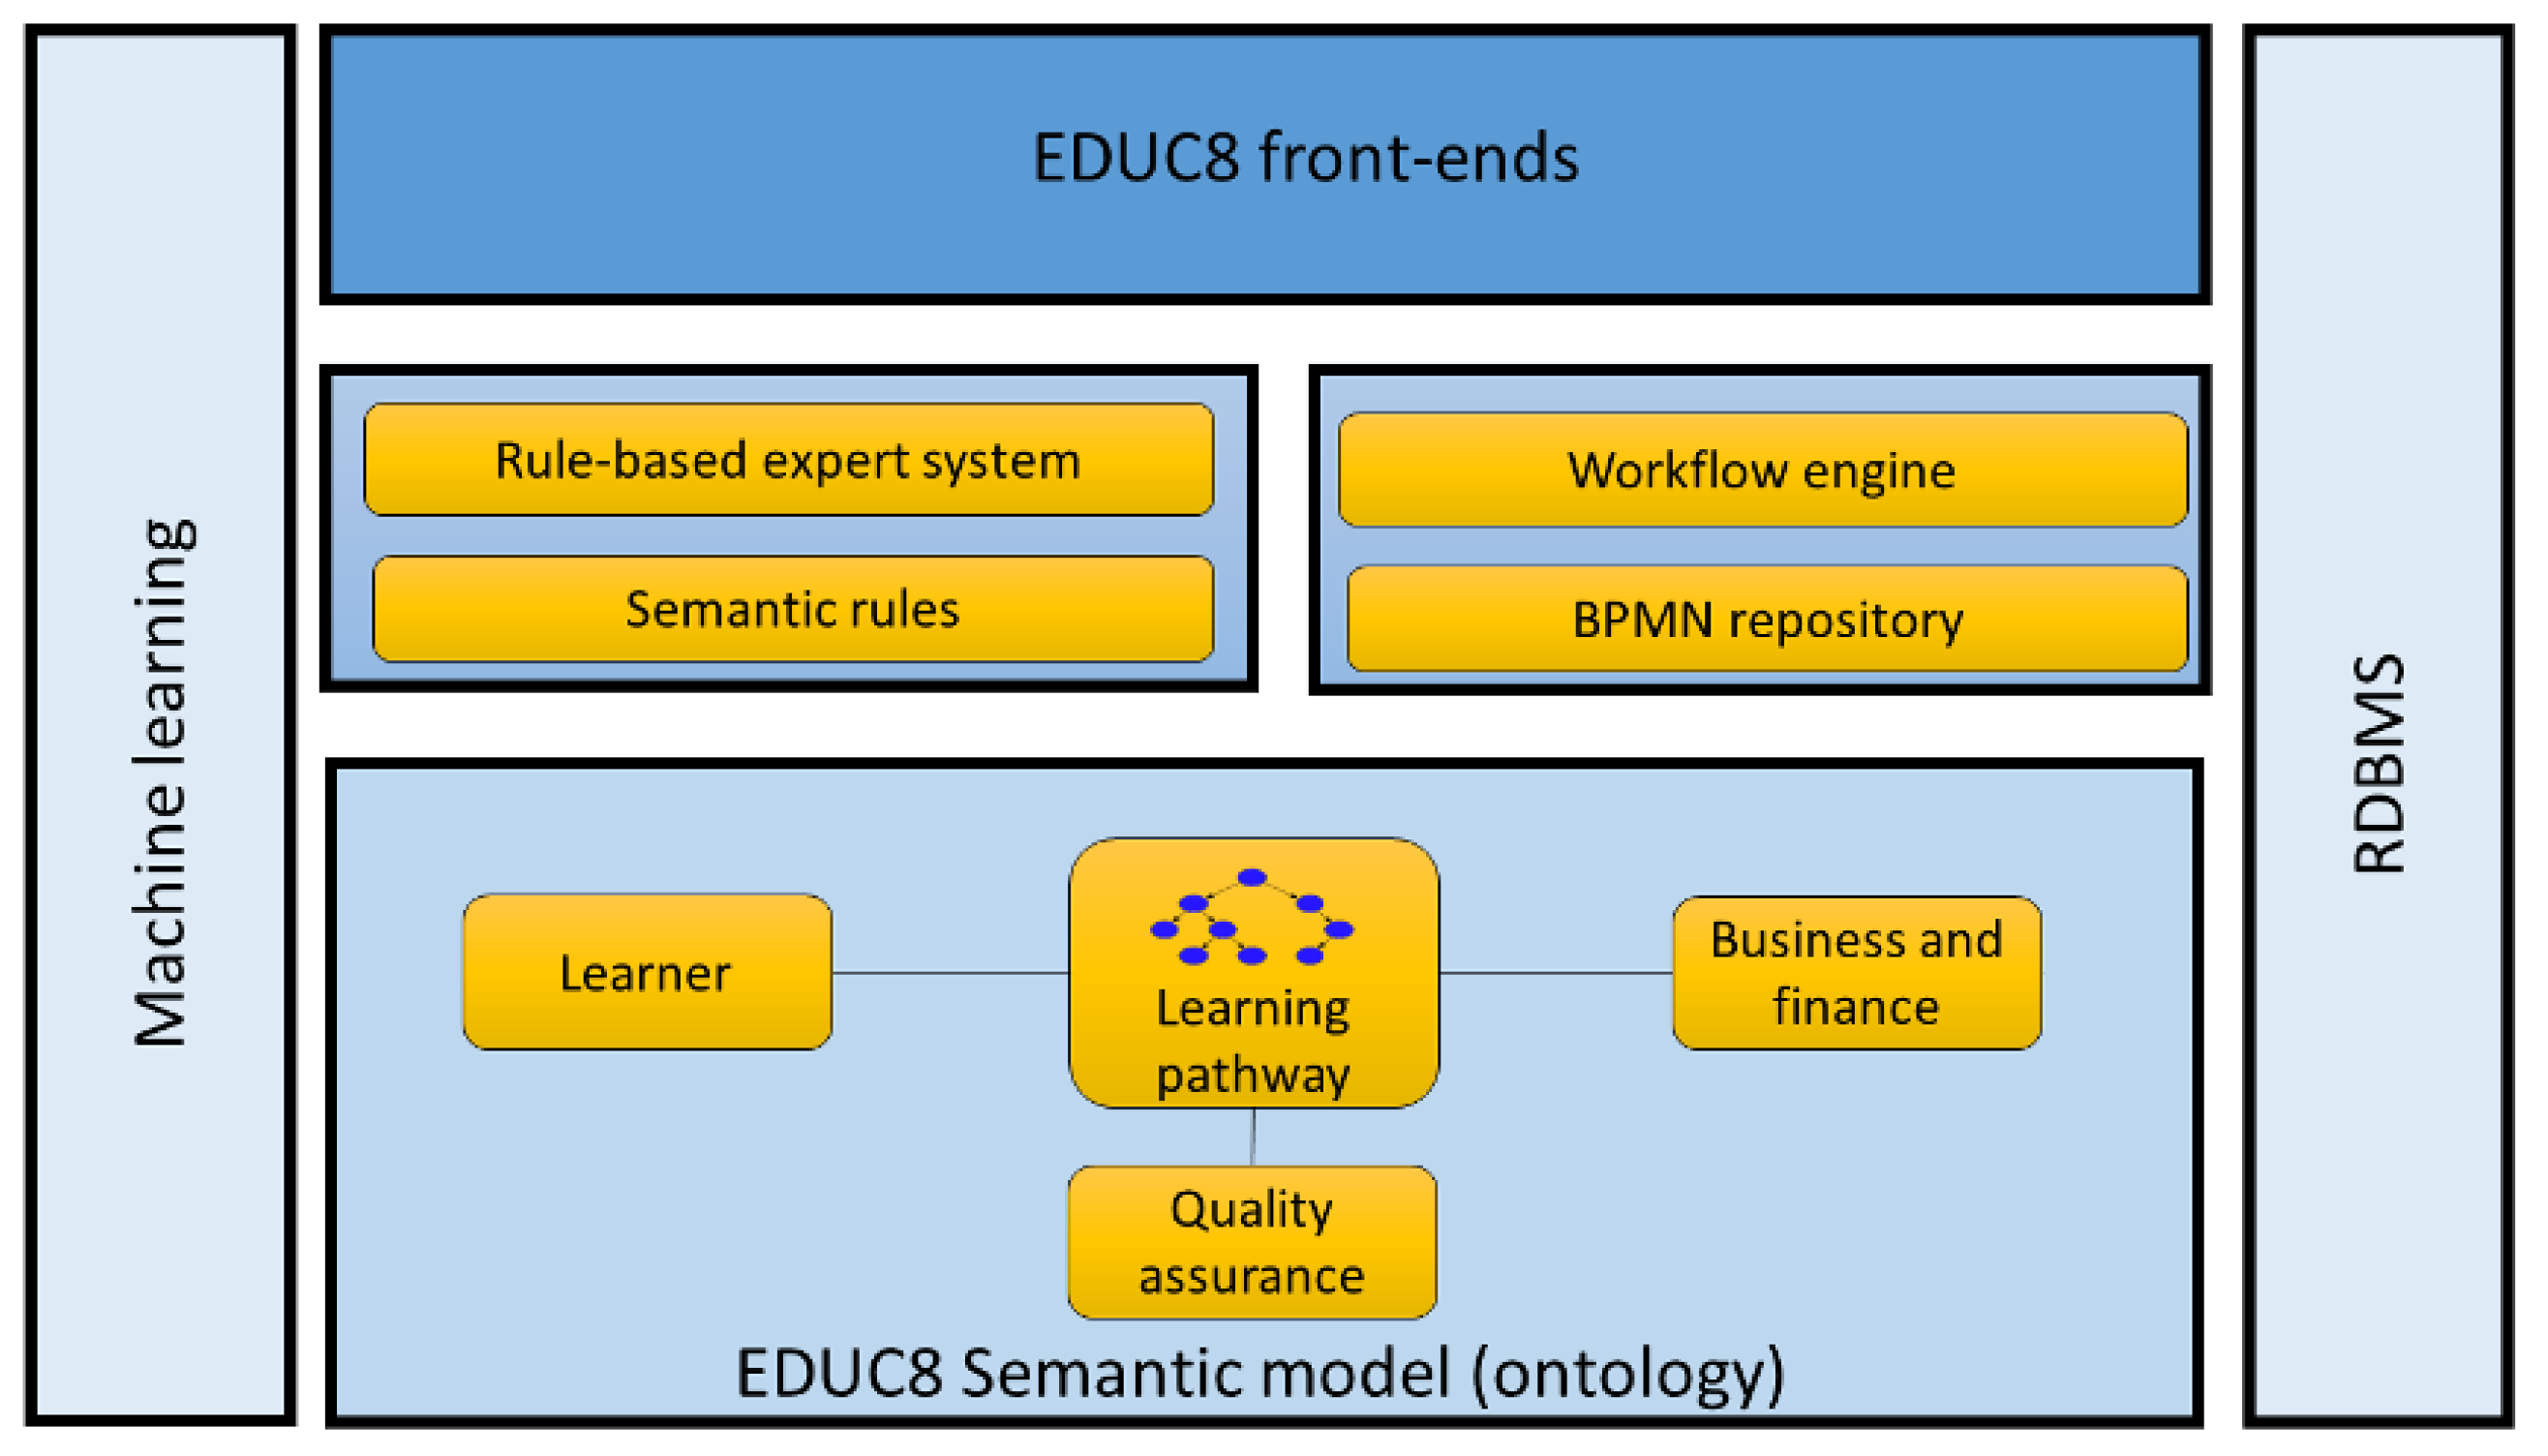
4.3. Architectural Description of Software

The choice of these specific knowledgeable stakeholders has also been justified by considering all the architectural layers of the EDUC8 system and corresponding offered system functionalities. The conceptual architecture of the EDUC8 system (Figure 1) comprises distinct architectural layers, which involve the above-mentioned stakeholders who collaborate throughout learners’ academic plans lifecycle.
The lower layer of the EDUC8 architecture is the semantic infrastructure layer and encompasses the appropriate semantics and knowledge streams (Learner part, Learning Pathway part, Business and Finance part, and the Quality Assurance part) required for the dynamic and personalized composition of academic plans for each individual university student. HEI managers, academic advisors, and ontology engineers (stakeholders: #5, #3, #2) are engaged to add and maintain the corresponding part of knowledge in the semantic model.
At the next layer, a rule-based expert system undertakes the task of executing the semantic rules that model the knowledge acquired from the academic advisors (stakeholder: #3) concerning the suggestion for the appropriate next step of the academic plan, while the next system module encloses the workflow-part in BPMN for each academic plan monitored by the HEI’s personnel (stakeholder: #4).
The upper layer of the EDUC8 allows the integration and presentation of client-side components for various tools and applications of the software environment. The architecture includes two modules positioned vertically, which can be accessed by various software components. The RDBMS module provides a common interface that the EDUC8 platform can use to store and retrieve information from a relational database. Finally, the machine learning module is specifically applied to learn potential insights pertaining to student characteristics, education factors, and outcomes, which can be used by the HEI’s managers (stakeholders: #1, #5) to conceptualize the system’s structure or behavior.
A meeting was organized and held with the five stakeholders with the aim of carefully evaluating and systematically prioritizing the 27 candidate features that comprised the EDUC8 product backlog. Stakeholders were asked to apply the BST prioritization approach to rank the features based on their perceived satisfaction (dissatisfaction) from the inclusion (exclusion) of each feature in (from) the second system release. To facilitate the systematic application of the BST method and provide an automated tool for supporting the ranking of the candidate features, we developed a graphical Binary Search Tree design tool named BSTV (Figure 2).
To mitigate the risk of stakeholders not understanding how features should be evaluated, stakeholders received a 30 min long instruction aimed at explaining the meaning of the prioritization criteria (satisfaction/dissatisfaction), how to construct the BSTs (binary search trees), and how to use the BSTV tool to compare features. Stakeholders were explicitly informed that they were allowed to assign more than one feature to the same node of a BST (if they hesitated to differentiate among the values of some features) or leave some features unassigned to any tree node (if they lacked knowledge about the value of some features). Stakeholders were also informed that they could even assign more than one feature to the same node of the BST if they thought that these features were of equal value. In such cases, they were advised to use the “Annotate a Tree Node” functionality of the BSTV tool to provide comments and justifications for the equally ranked features. Afterward, each stakeholder had another 45 min to use the BSTV tool to construct two BSTs denoting, respectively, two rankings of the 27 candidate features based on satisfaction and dissatisfaction criteria.

4.4. Application of the Proposed Approach

In the application phase of our proposed methodology, stakeholders were tasked with evaluating and ranking all candidate features based on their perceived satisfaction or dissatisfaction with the inclusion or exclusion of features in the upcoming system release. A comprehensive briefing was provided to stakeholders on the feature-ranking process, utilizing the Binary Search Tree (BST) method as outlined by [41]. The initial step involved creating a single node holding a randomly selected feature from the list of candidates.
Subsequently, each subsequent feature was compared to the top node in the BST. If its value was lower than the node, it was compared to the node’s left child, and vice versa if its value was higher. This process continued until each feature found its place within a respective node. Traversal of the final BST in in-order fashion resulted in a sorted order of features, initially from the lowest- to the highest-ranked feature. To present the final prioritized list from the highest to the lowest rank, the sorted list of features was reversed. This systematic application of the BST method facilitated the stakeholders in providing a structured and ordered evaluation of the candidate features.
An illustrative Binary Search Tree (BST), reflecting the comparison of features based on the satisfaction criterion as perceived by Stakeholder #1, is presented in Figure 3. In this representation, each node within the BST signifies features that are tied in the same rank, and the adjacent number to each node denotes the assigned rank (i.e., position) of the tied features. The BSTV tool automatically calculated these ranking values by traversing the BST in a reverse in-order manner.
In Figure 3, all features situated in the left subtree of a tree node denote lower-ranked features compared to those assigned to the node. Conversely, features located in the right subtree of each tree node represent higher-ranked features. Features placed in the same tree node are considered tied in rank. For instance, Stakeholder #1’s evaluation in Figure 3 indicates that features f 1 and f 19 are tied, both holding the rank of 1 according to the satisfaction criterion. Similarly, f 20 and f 22 share rank 2, f 13 , f 16 , and f 23 are tied in rank 3, f 4 , f 17 , f 21 , and f 26 are tied in rank 4, and so forth. It is noteworthy that features f 15 and f 24 are absent from this BST, implying that Stakeholder #1 might have faced uncertainty or lacked the necessary knowledge to compare these particular features with the others.
Figure 4 illustrates the corresponding Binary Search Tree (BST) representing the feature ranking based on the dissatisfaction criterion, as derived by Stakeholder #1. These BSTs exemplify instances of asymmetry between satisfaction and dissatisfaction rankings. Examining the features ranked 1 st and 2 nd by Stakeholder #1, notable differences emerge when considering satisfaction versus dissatisfaction. In terms of satisfaction, features f 1 and f 19 hold the 1 st rank, while features f 20 and f 22 occupy the 2 nd rank. In contrast, the dissatisfaction perspective reveals that features f 12 , f 18 , and f 25 are ranked 1 st , while features f 3 , f 14 , and f 20 secure the 2 nd rank. Notably, only one feature, f 20 , is common to both rankings at the 2 nd position, indicating a nuanced relationship between satisfaction and dissatisfaction criteria.
The feature ranking vectors derived from the five stakeholders involved in the prioritization case study, based on the satisfaction criterion, are presented in columns (b), (f), (j), (n), and (r) of Table 5. Corresponding rankings based on the dissatisfaction criterion are also provided by the stakeholders in the respective columns of Table 6.
Utilizing the BSTV tool facilitated all necessary computations. Ranks in the vectors shown in Table 5 were transformed into Intuitionistic Fuzzy Numbers (IFNs) (applying Equations (2)–(4)) with membership, non-membership, and hesitation degrees displayed in columns (c), (d), and (e) for stakeholder #1, (g), (h), and (i) for stakeholder #2, and so forth. Total hesitation in each ranking vector was calculated using Equation (5), and the corresponding (objective) weight of each ranking vector was determined with Equation (10)). These values, for each stakeholder ranking, are shown in the last two rows of Table 5. Notably, larger weights indicate rankings with less total hesitation.
Applying Equation (11), the weighted correlation coefficients (WCCs) for all features were computed. These values represent the final priorities of the candidate features according to the satisfaction criterion, displayed in column (w) of Table 5. Sorting features by their WCC values in descending order yields the final prioritized features list based on satisfaction, shown in column (x) of Table 5.
Similarly, WCCs (final priority values) for the features were calculated based on the dissatisfaction criterion, and the results are presented in the corresponding columns of Table 6.
The WCCs (priorities) for features based on satisfaction (column (w) of Table 5) are also included in column (b) of Table 7, while the WCCs for features based on dissatisfaction (column (w) of Table 6) are included in column (c) of Table 7. In the final step, features with WCCs values greater than 0.5 in both satisfaction and dissatisfaction were identified as potentially highly valuable. These features, including f 9 , f 14 , f 16 , f 19 , f 20 , f 21 , f 23 , f 25 , f 26 , and f 27 , are suggested for implementation in the next release of the EDUC8 system and are listed in column (f) of Table 7.
We conducted a sensitivity analysis to evaluate the impact of variations in the objective weights on the final calculated priorities (WCCs). The objective weights, automatically computed for feature rankings, were subjected to different calculations using the BSTV tool to assess their influence. Specifically, we altered the method of total hesitation computation for stakeholders’ rankings in the following ways:
  • Calculating total hesitation solely due to tied features using Equation (6).
  • Calculating total hesitation exclusively due to unknown features via Equation (7).
  • Determining total hesitation attributed to tied features with a modified weighting approach based on Equation (8), assigning lower weights to rankings with a higher number of tied features at top positions.
Throughout these various modes of WCCs calculation, the final results—especially concerning the most highly prioritized features (WCCs exceeding 0.5)—remained consistent. This robustness across different weighting scenarios suggests that the objectively calculated weights had minimal impact on the prioritization outcomes. Consequently, we inferred that there was no necessity to request certain stakeholders to reapply the BST method for feature ranking. All calculations for this sensitivity analysis were automated using the BSTV tool.
During the conclusive joint meeting involving all stakeholders, it was emphasized that the simplicity of the BST prioritization method, coupled with the comprehensive functionalities supported by the BSTV tool, renders the approach highly practical for real-world software projects. The consensus reached was that the utilization of the BSTV tool significantly aids in computing final feature priorities. This, in turn, assists stakeholders in justifying and selecting the most valuable software features for inclusion in the upcoming software release.
The unanimous agreement among stakeholders highlighted the effectiveness of the software feature prioritization approach, resulting in the identification of the final set of the top 10 preferred features for delivery in the next system release. Stakeholders acknowledged that these features, with their calculated high WCCs, are anticipated to yield a substantial amount of satisfaction (or dissatisfaction if not offered). In the final meeting discussion, stakeholders recognized the interconnected nature of these specific ten features, emphasizing that none can be neglected.
Notably, two recommended features, f 9 and f 14 , were closely tied to the implementation of two new graphical tools for the EDUC8 environment. These tools aim to empower academic staff, enabling them to model learning sub-processes and semantic rules without requiring advanced IT skills. The implementation of such tools is expected to be a significant enhancement, improving the overall usability and user-friendliness of the software platform. Additionally, features f 16 , f 19 , and f 20 pertained to the integration of EDUC8 with existing University software systems. Given that this integrated software environment operates within a Higher Education Institution (HEI), these key features are crucial for ensuring a high degree of interoperability, which is deemed critical for the project’s viability. Feature f 27 emerged as another top priority, focusing on the design and implementation of a component that personalizes EDUC8 GUIs based on the role of the individual end-user. This component also provides access to the appropriate subset of data, emphasizing the importance of user-specific customization and data accessibility.
In the conclusive joint meeting, we sought to assess the perceived usefulness of our approach by administering a questionnaire to the five stakeholders. The questionnaire comprised 10 questions, and stakeholders were asked to provide anonymous responses on a 5-point Likert scale, where “1” represented “strongly disagree” and “5” represented “strongly agree”. The average scores of the received answers were highly positive and are summarized as follows:
  • I feel familiar with the features considered for prioritization: 4.2;
  • The method was simple to use: 4.0;
  • I have understood the key ideas of the method: 4.4;
  • I agree with the key ideas of the method: 3.6;
  • The method can effectively prioritize software features: 4.2;
  • The method can efficiently support the feature prioritization process: 3.6;
  • It was easy to learn how to use the BSTV tool: 4.4;
  • I believe that the method can be easily applied in practice: 3.2;
  • I believe the proposed method increases the chances of recommending the most valuable features to be implemented: 4.2;
  • Overall, I am satisfied with the method results: 4.0.
These positive average scores indicate a generally favorable perception of the approach and its components, demonstrating a high level of satisfaction and understanding among the stakeholders. The feedback suggests that the method and the associated BSTV tool were well-received in terms of usability, effectiveness, and overall satisfaction in the context of feature prioritization for software projects.

5. Discussion

This section delves into a detailed discussion of the case study’s application of the proposed approach, aiming to analyze the gathered evidence and fortify the drawn conclusions. The examination of the approach’s application follows the case study planning template outlined in [55], encompassing three key steps: (i) case study design and planning, (ii) collection of data, and (iii) analysis of the collected data.

5.1. Case Study Design and Planning

The primary aim of the conducted case study was to implement the proposed prioritization approach, utilizing stakeholder satisfaction and dissatisfaction as criteria for the prioritization of valuable features in the forthcoming software release of the EDUC8 system. Additionally, the study sought to recommend final feature priorities to stakeholders by incorporating the hesitation in stakeholder judgments concerning feature rankings.
Before the features prioritization session, the research team, in collaboration with stakeholders, identified a set of candidate features, totaling 27 (refer to Table 3). As per established categorizations in the literature [21,22], sets with fewer than 15 candidate features are deemed small, those ranging from 15 to 50 are considered medium, and sets exceeding 50 features are classified as large. Consequently, our set of candidate features falls within the medium-sized category. Despite its application to a medium-sized feature set in this case study, the proposed approach exhibits potential effectiveness for handling medium to large feature sets. The BST prioritization method demonstrates scalability and outperforms other prioritization methods, such as bubble sort, binary priority list, spanning tree matrix, and AHP [25,41]. The BST method requires fewer comparisons and less time, with a complexity of O(log(n)) for a balanced BST and O(n × log(n)) for an unbalanced BST, making it well-suited for larger feature sets. In contrast, AHP and bubble sort involve ( n × ( n 1 ) 2 ) comparisons, presenting technical challenges and considerable time consumption.
It is essential to note that the BST method involves comparing and placing all features into nodes of a binary search tree to establish their relative rankings based on the chosen prioritization criterion. The method has demonstrated effectiveness in minimizing errors associated with feature prioritization, a process prone to errors for stakeholders [40]. This effectiveness can be attributed to the ordinal scale of the BST method, which represents the rank and order of features without revealing precise performance details.
During the case study design and planning phase, stakeholders received a 30-min briefing on the ranking process, elucidating the BST method for prioritizing candidate features. Stakeholders were also introduced to the BSTV tool, facilitating the application of a modified BST technique. This tool allows evaluators/stakeholders to place two or more features in the same position (i.e., tree node) or leave some features unranked if they are uncertain about their relative value. Stakeholders were explicitly informed that they could assign equal ranks to features expressing equal satisfaction/dissatisfaction and were encouraged to use the “Annotate a Tree Node” functionality in the BSTV tool to provide justifications for such cases.
It is noteworthy that the mathematical calculations of stakeholders’ weights, performed by the BSTV tool using Interval Type-2 Fuzzy Sets (IFSs), were not explained to stakeholders due to potential confusion for unfamiliar participants. Moreover, disclosing the calculation method could lead to intentional shrewd tactics, such as avoiding the specification of tied features or leaving features unranked. The use of BST-based pairwise (ordinal-scale) comparisons minimizes the risk of obstructive tactics through consistent application [48]. In this case study, rankings were independently provided by each stakeholder to ensure their results were not influenced by other stakeholders’ opinions.

5.2. Collection of Data

The challenge of assessing the value of candidate features in features prioritization arises from stakeholders’ diverse perspectives and interpretations of what constitutes value [56]. To encourage stakeholders to thoroughly examine the perceived value of features, each stakeholder in our case study was tasked with performing the BST method twice. Stakeholders were required to rank the candidate features based on satisfaction with the inclusion of each feature in the next software release and dissatisfaction with the exclusion of each feature from the next release. The time invested by stakeholders in constructing the two BSTs, depicting rankings based on satisfaction and dissatisfaction, ranged from 32 to 45 min. The duration of stakeholders’ evaluations indicates that the final BSTs resulted from thoughtful and careful pairwise comparisons.
Our proposed method addresses the challenge of time efficiency and automation in features prioritization, common in many existing techniques [22]. Most prioritization methods often involve manual quantification by stakeholders, relying on substantial professional human intervention to calculate the weight of each participating stakeholder. In our method, human intervention is required in the “Mapping Features Rankings into IFSs” step when stakeholders provide their rankings, and this step is facilitated by the BSTV tool. The “Quantifying the Hesitation of Stakeholders” and “Computing Rankings Weights and Features Priorities” steps are executed automatically by the BSTV tool, handling all necessary calculations. For “Computing Rankings Weights and Features Priorities”, the BSTV tool offers flexibility in calculating objective weights of stakeholders’ rankings by varying the method of total hesitation computation, thereby testing the sensitivity of the weights to the final priorities.
It is important to note that in a features prioritization process involving expert stakeholders, subjective determination of different weights for each stakeholder can be challenging. We assume that the participating stakeholders can express their perspectives on feature values with equal or similar importance. Using the suggested method, objective weights are derived through mathematical calculations from information present in stakeholders’ preferences for feature rankings. Specifically, weights are determined using the “entropy” measure, a widely-used approach in the decision-making literature for determining objective weights [57]. The primary advantage of entropy-based weight calculations is the reduction of stakeholders’ subjective impact on the final results [58]. Alternatively, asking stakeholders to indicate their confidence in the feature rankings could introduce another method potentially biased by stakeholders’ subjective self-evaluations.

5.3. Analysis of Collected Data

The results of the prioritization process underscore the inherent difficulty in identifying high-value features, accentuated by the introduced asymmetry. Even within the same stakeholder, the consideration of a feature from two different perspectives—satisfaction and dissatisfaction regarding its inclusion in the next software version—reveals notable disparities. A closer examination of the ranking values exposes asymmetries in both individual stakeholder rankings and the final aggregated rankings.
For instance, features such as f 16 (Single sign-on—Connect with University’s LDAP directory) and f 17 (Advanced search by student—Narrow student results by adding more search terms) hold the 1 st and 7 th positions, respectively, when evaluated based on perceived satisfaction in offering them in the next release (refer to Table 5). This prioritization is attributed to their enhancement of the EDUC8 software project capabilities. However, when considering dissatisfaction (refer to Table 6), these features are ranked 15 th and 22 nd , suggesting that they may be considered desirable but not essential, as the dissatisfaction from their exclusion is relatively low.
Conversely, features like f 25 (real-time chat—provide a live transmission of text messages between end-users) and f 12 (email notifications—automated email notifications for specific tasks) exhibit the opposite asymmetry. When evaluated from the dissatisfaction perspective, they hold the 1 st and 4 th positions, respectively (refer to Table 6). However, from the satisfaction perspective, their rankings are 17 th and 22 nd (refer to Table 5). A closer inspection of these features’ functionalities justifies the observed high dissatisfaction when excluded, indicating their essential nature for the scope of the EDUC8 software project.
To aggregate and analyze feature rankings from different stakeholders, an alternative approach involves assigning equal weights to all stakeholders and computing the average rank for each feature across all rankings. Figure 5 and Figure 6 present a visual comparison of feature priorities expressed through Weighted Consistent Criterions (WCC) values—calculated with objective weights for stakeholders—and average rankings, assuming equal weights for all stakeholders.
If we compare the prioritization results between these two approaches, substantial variations in the priorities of some features become apparent. For instance, in Figure 5, we observe that feature f 26 (fully responsive design—preserve the user experience and look and feel across all devices) is prioritized at the 7 th position according to the satisfaction criterion when using the average ranking (assuming equal stakeholder weights). However, in our proposed approach, it is prioritized at the 12 th position (refer to Table 5).
A closer examination of individual stakeholder rankings (Table 5) reveals that two stakeholders (Stakeholder #2 and Stakeholder #3) left feature f 26 unranked, while the other three stakeholders ranked it as follows: (i) Stakeholder #5 ranked f 26 at the 1 st position, (ii) Stakeholder #1 at the 4 th position, and (iii) Stakeholder #4 at the 5 th position. Considering the 7 th position of feature f 26 based on average ranking, it attains a high priority value, appearing among the top 10 highest priority features out of all 27 features. This result, however, overlooks the fact that 2 out of 5 stakeholders left feature f 26 unranked, and 2 out of 5 stakeholders ranked it nearly at the median position. In contrast, our approach prioritizes f 26 at the 12 th position, which appears more reasonable in the context of stakeholders’ rankings.
Features that receive consistent rankings with fewer ties, such as f 16 (Single sign-on- Connect with University’s LDAP directory), maintain the same position when comparing our approach with the equal weights/average ranking approach. Both these examples underscore that the entropy-based method we employ places emphasis on stakeholders’ ability to discriminate among features, assigning higher weights when stakeholders can effectively differentiate the value of features.
Moreover, our proposed prioritization method mitigates collisions in final priority values, even when stakeholders rank features at the same tied position due to hesitation or the assumption that certain features perform equally according to a specific criterion. Collisions may only occur in rare cases where two features are ranked in the same position by all stakeholders. This consideration is particularly significant in agile software development settings, where features must be uniquely selected for each software release [34].
To further explore the impact of hesitation calculations on final prioritization results, we tested the sensitivity of the resulting Weighted Consistent Criterions (WCC) values using different methods for calculating total hesitation and objective weights. For example, Table 8 presents the total hesitation and objective weights of the five stakeholders based on their rankings according to the satisfaction criterion: (i) only due to tied features by applying Equation (6), and (ii) considering the effect of the positions of the tied features by applying Equation (8). Both approaches result in the same average weights (equal to 0.2); however, the standard deviation is larger when considering the effect of the positions of the tied features. The impact of these two Equations on the final features’ priorities based on satisfaction in our case study could be considered negligible, as 18 out of 27 features appear in the same position, while the remaining features’ ranks differ by only one position.
Table 9 presents the correlation between the rankings provided by the stakeholders and the final prioritization rankings, considering the satisfaction/dissatisfaction from offering/not offering the same features in the next software release. The correlation is calculated using the Spearman’s rank correlation coefficient ( ρ ) through the following Equation, which accounts for tied and missing ranks [59,60]:
ρ = 1 n i = 1 n ( x i x ¯ ) ( y i y ¯ ) 1 n i = 1 n ( x i x ¯ ) 2 1 n i = 1 n ( y i y ¯ ) 2
where n is the total number of features, x i is the stakeholders’ i-th feature ranking, x ¯ is the mean stakeholders’ feature ranking, y i is the final i-th feature prioritization position and y ¯ is the mean of the final feature rankings.
An intriguing observation is that the rankings from Stakeholder #3 exhibit the lowest correlation according to the satisfaction criterion, despite Stakeholder #3 not having the lowest weight. Stakeholder #3 assigned the most tied features based on the satisfaction criterion and used the lowest number of ranks, specifically 6 (Table 5). In cases where multiple ties occur, it is interpreted as an indication of hesitancy and uncertainty in discriminating features with the highest value based on the satisfaction criterion. Tied ranks may appear; however, considering the two asymmetric criteria, we anticipate that equal features would be revealed. When evaluating the rankings based on the dissatisfaction criterion for Stakeholder #3 (Table 6), it is observed that tied features in the corresponding ranking are significantly fewer, revealing that these specific features do not have equal value. Despite having the highest weight based on the dissatisfaction criterion (Table 8), Stakeholder #3 does not exhibit the highest correlation in this context.
After presenting the final prioritization results (Table 7) to the stakeholders, we provided them with a comprehensive explanation of the underlying process. We observed that stakeholders judiciously utilized the annotation option of the BSTV tool to denote tied features—those positioned at the same rank concerning the satisfaction or dissatisfaction criterion, which they deemed to have equal perceived value. For instance, Stakeholder #3 annotated features f 22 (“Forgot password” functionality—add password recovery option) and f 24 (“Remember Me” login functionality—allow users to store their login information on their local computer) as equally valuable. Stakeholder #3 positioned both features at the 4 th rank based on the satisfaction criterion (Table 5). The rationale, as annotated by Stakeholder #3, was because both these features are related to login functionality. However, in the stakeholders’ rankings, we generally observed a limited number of ties associated with features of equal value, as perceived by the stakeholders.
In conclusion, the application of the proposed prioritization approach in the case study revealed several key findings:
  • The prioritization method employs two asymmetric criteria (satisfaction and dissatisfaction), highlighting the asymmetry in the perceived value of features.
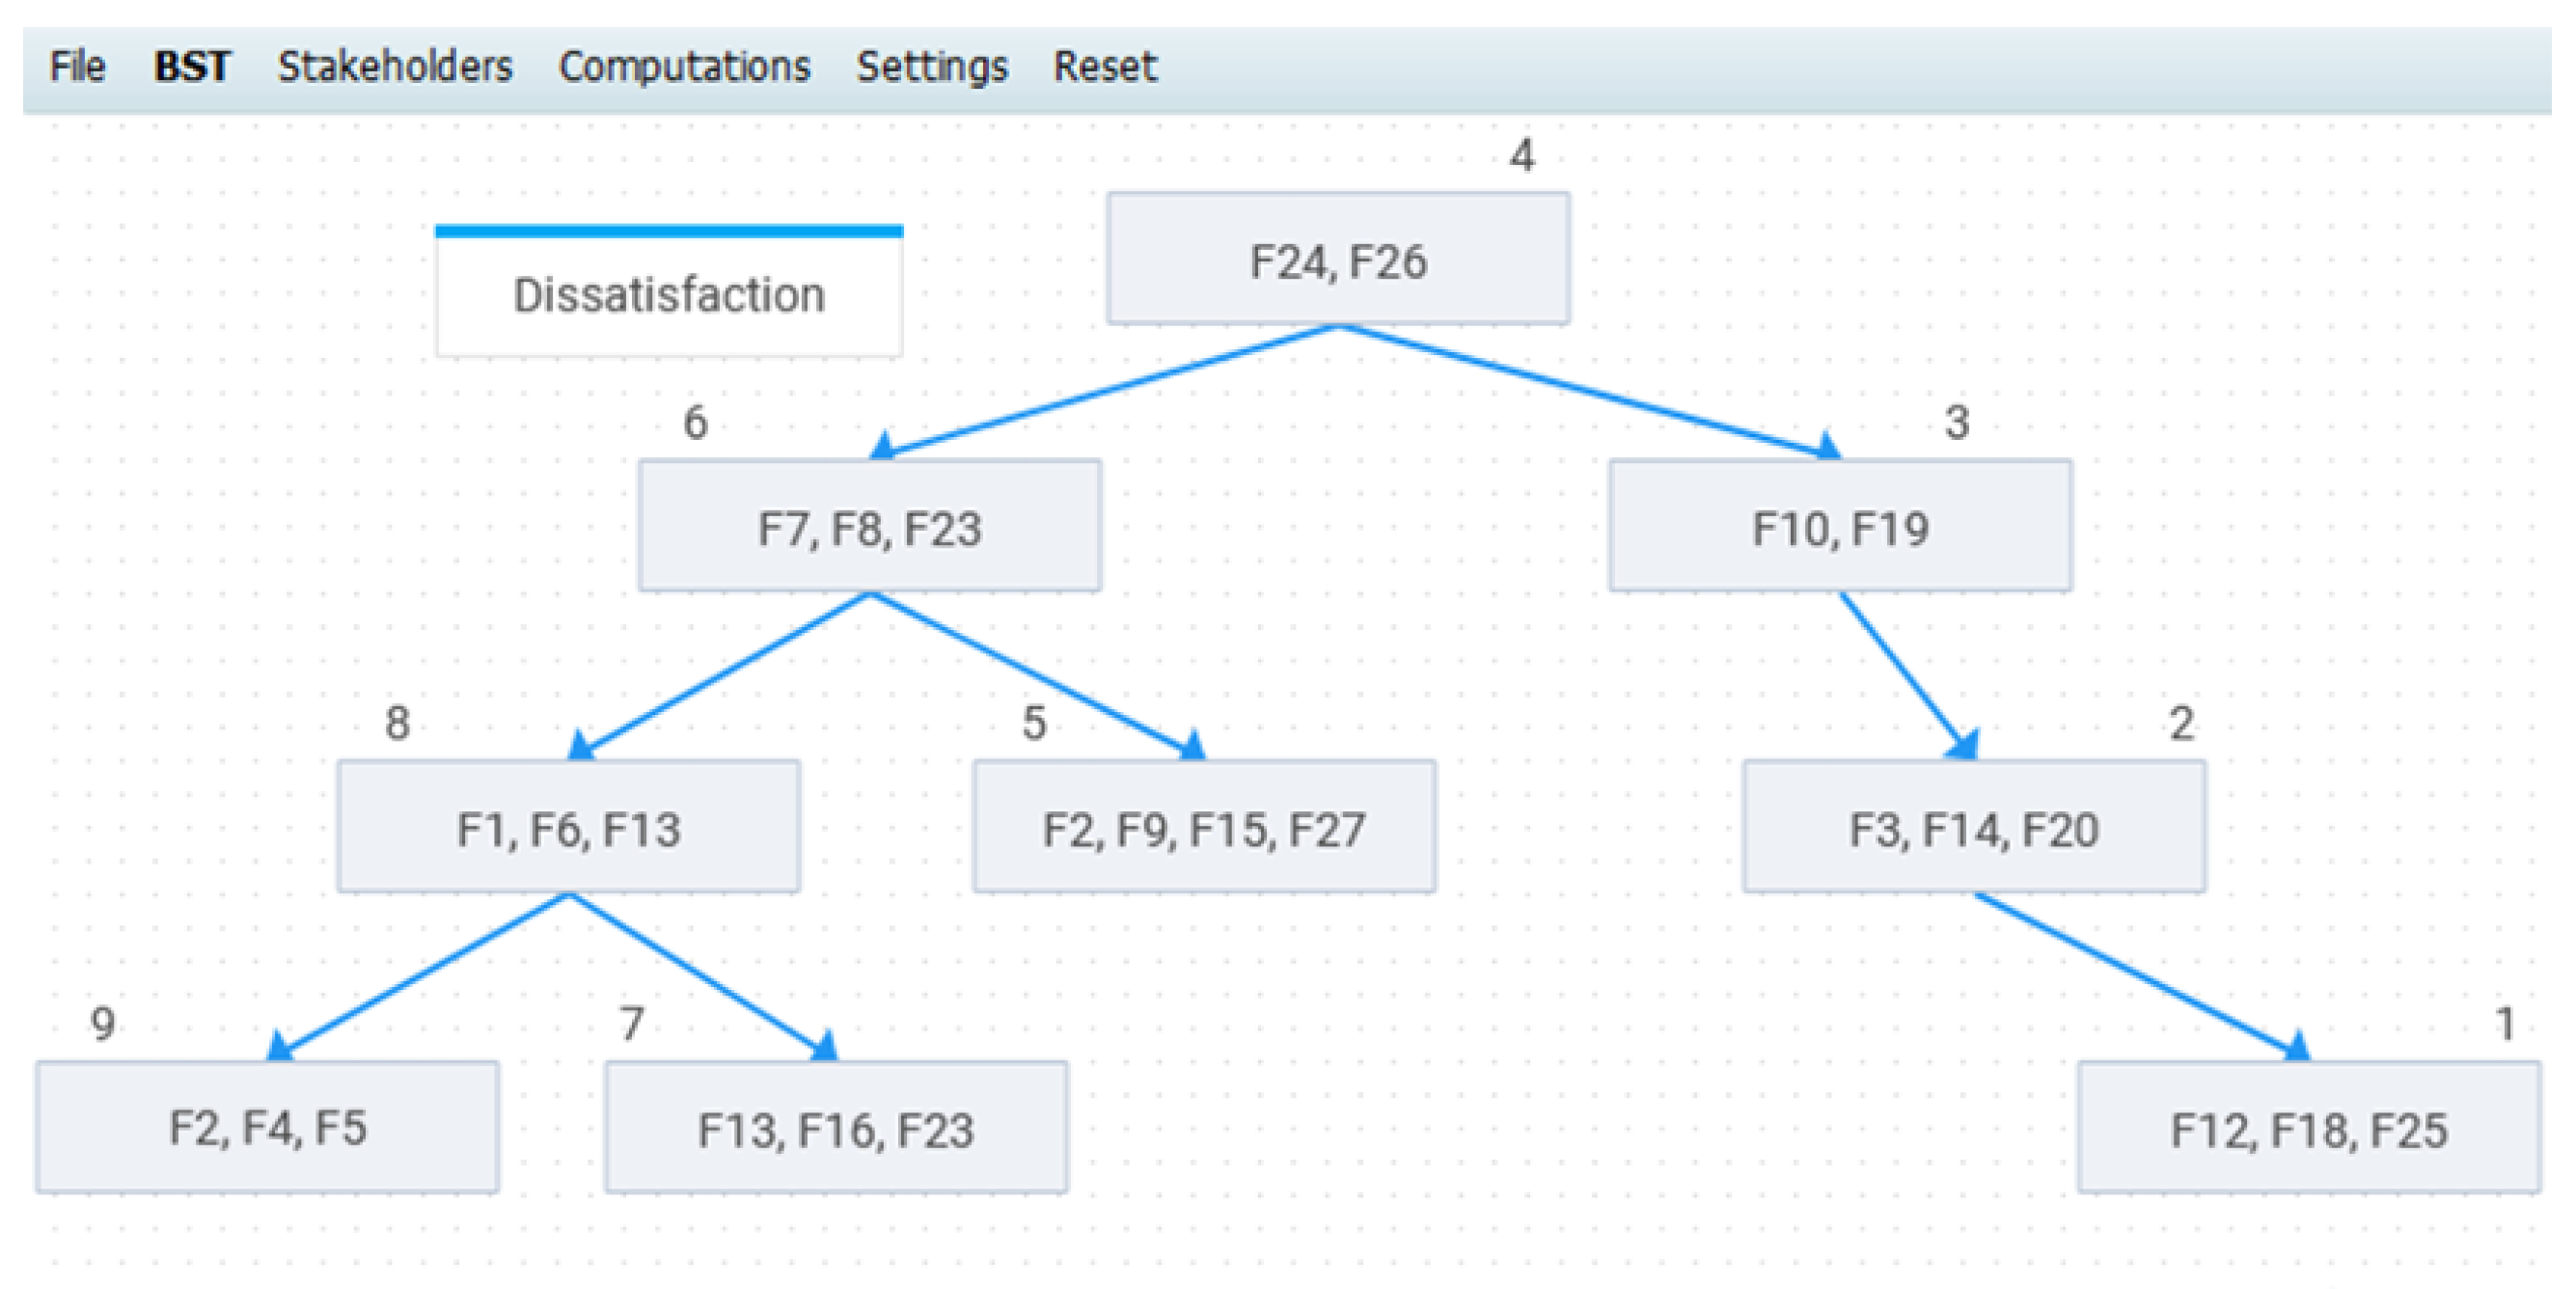
  • The method utilizes the Binary Search Tree (BST) technique, known for its efficiency and accuracy in the ordinal ranking of medium to large sets of features. The application is facilitated by the BSTV tool, implementing a modified version of the BST technique to handle tied and unranked features effectively.
  • The proposed method translates feature rankings into Intuitionistic Fuzzy Sets (IFSs), providing a quantitative measure of stakeholders’ hesitation.
  • Objective stakeholders’ weights are calculated in multiple ways, incorporating stakeholders’ hesitation and mitigating subjectivity in assigning weights.
  • The method is semi-automated, requiring minimal human intervention.
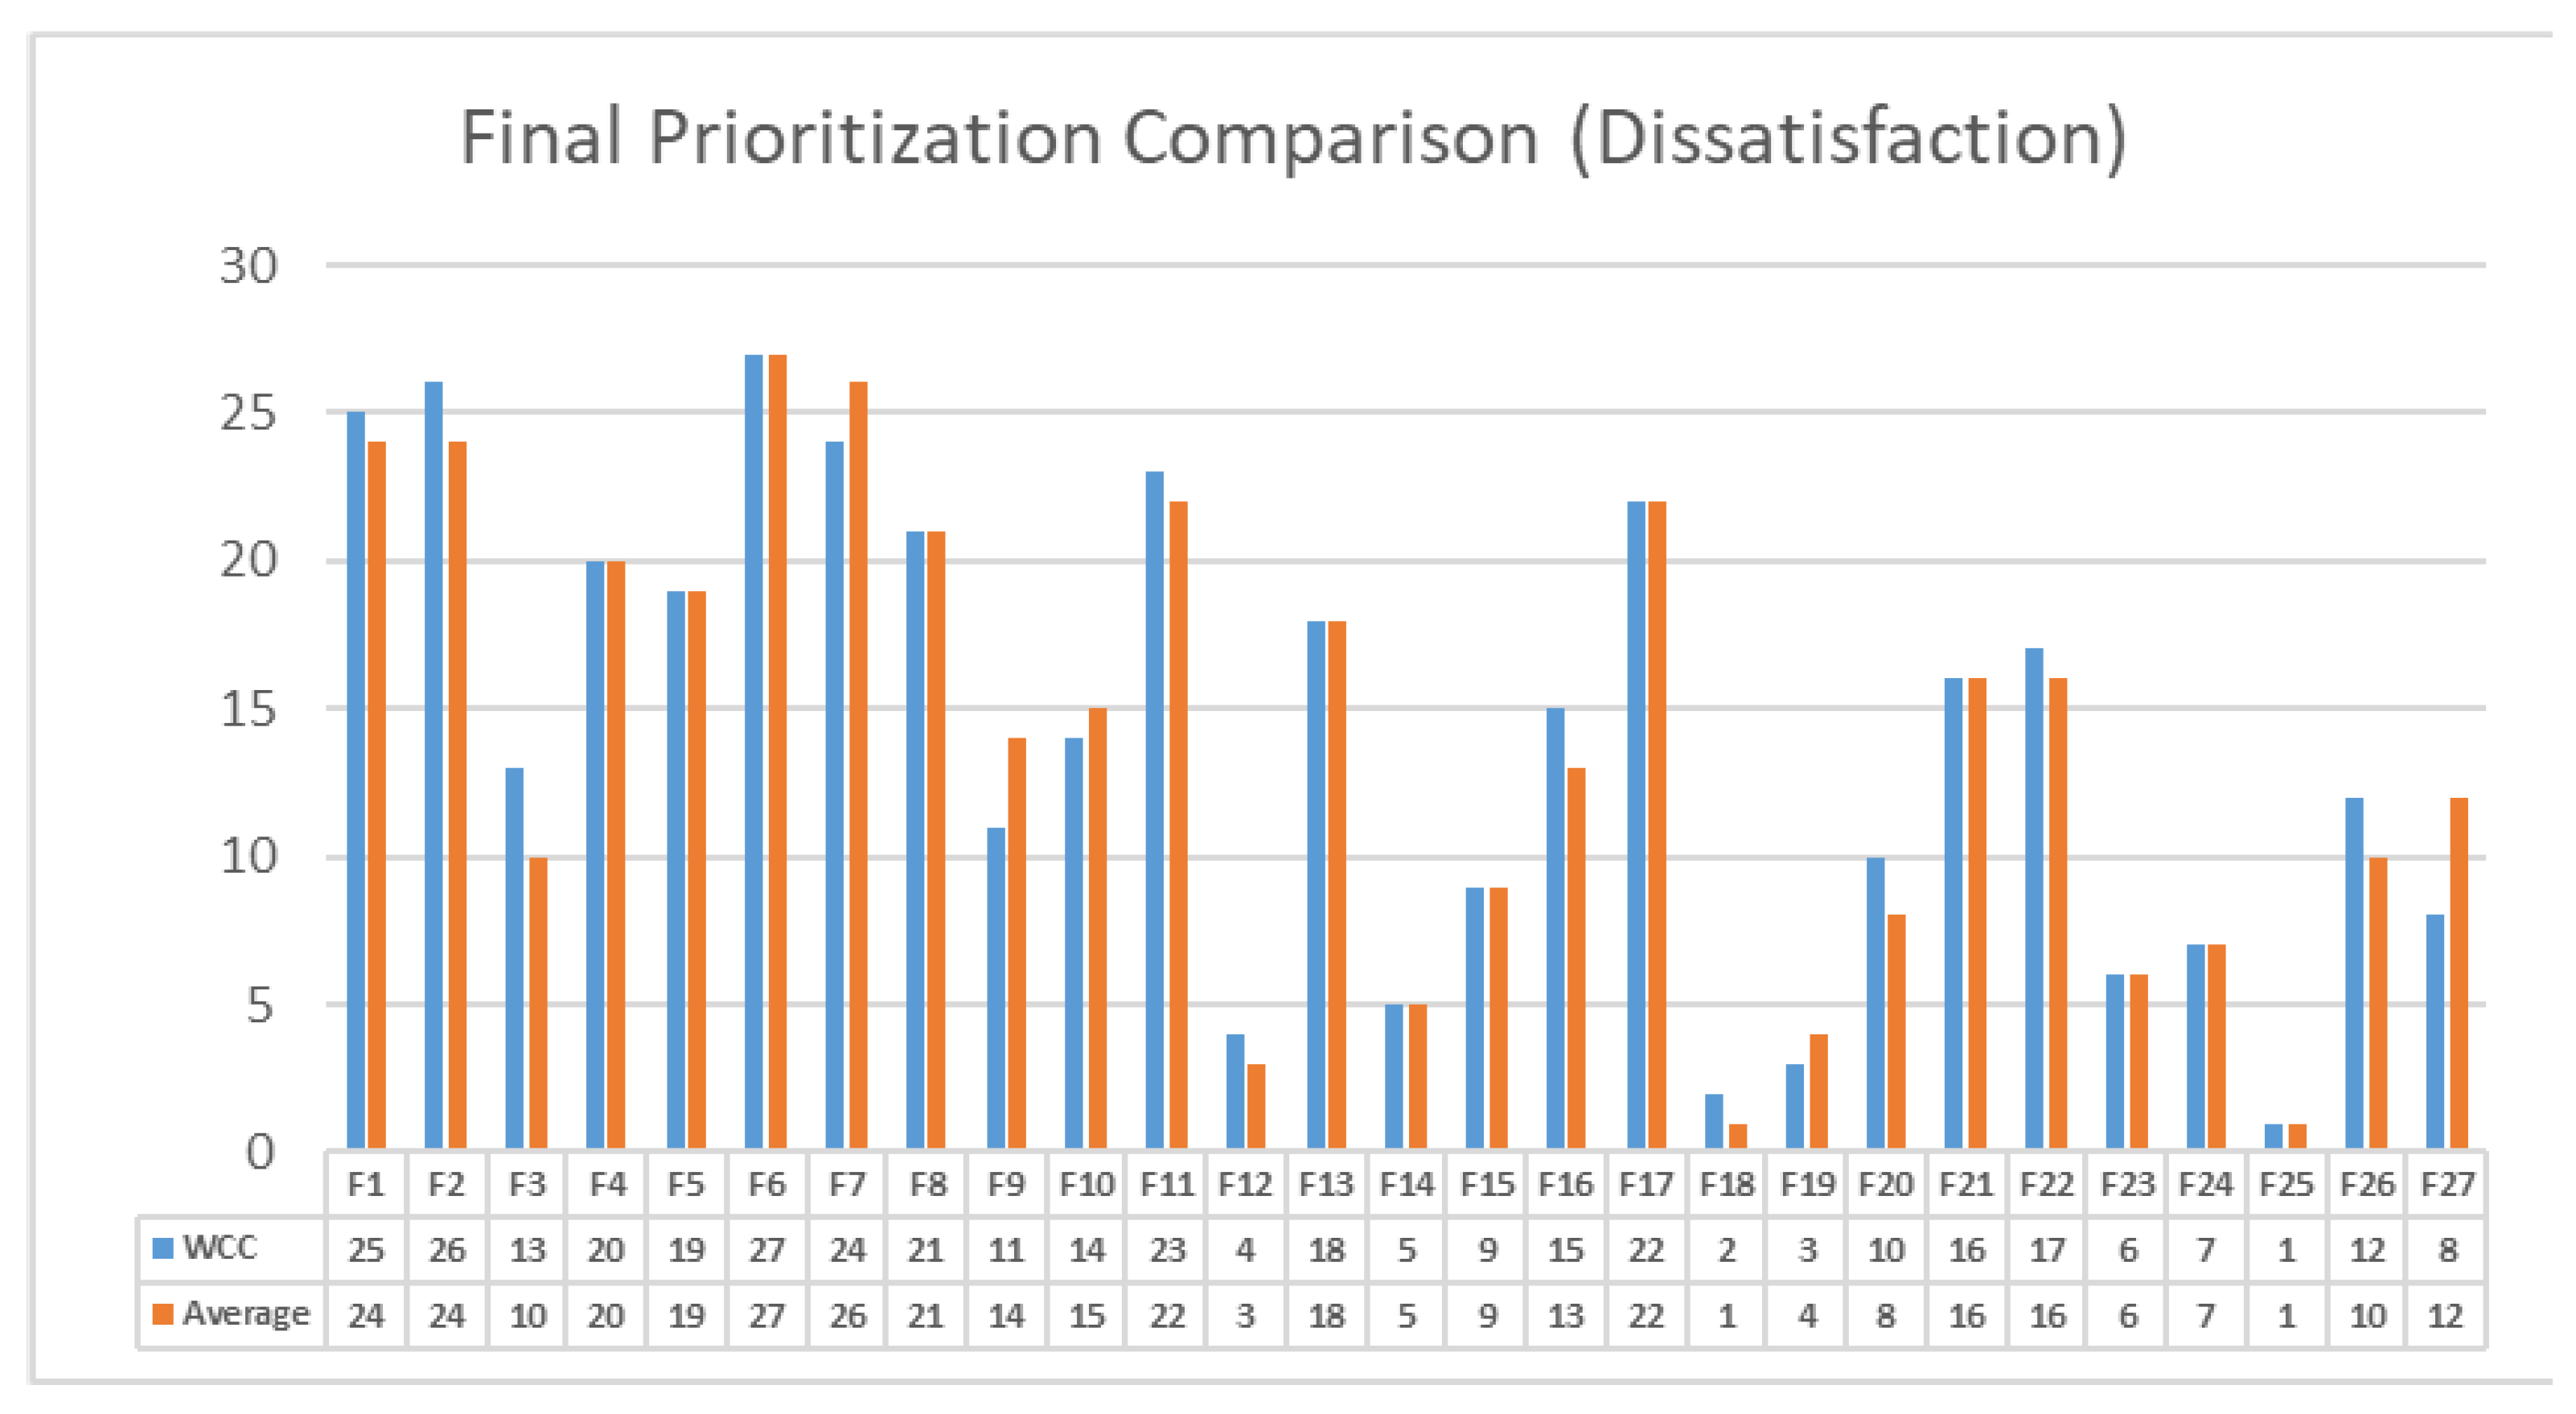
  • The method yields final feature priorities, ensuring that no two or more features share the same prioritization value.

6. Threats to Validity

The conducted case study aimed to assess the advantages and limitations of the proposed approach for prioritizing software features. While the case study approach is widely employed in software engineering research, it is susceptible to certain well-documented validity threats. In this section, we will address specific threats related to construct validity, internal validity, external validity, and reliability [55], offering insights into the potential challenges and limitations associated with our case study work.
Construct Validity pertains to the alignment between the observations in the case study and the theoretical concepts under examination. In our case study, this involves assessing whether the questions posed to the participants were pertinent to the established hypotheses. For instance, did the questions effectively gauge the extent to which the applied tool and the procedural steps aided stakeholders in prioritizing requirements? Were the questions designed to capture improvements resulting from the tool-assisted process?
As outlined in the case study section (Section 4), we gauged the approach’s effectiveness through a questionnaire, wherein stakeholders provided anonymous responses using a Likert scale ranging from 1 to 5. The questionnaire comprised ten questions addressing both the process and the tool, with additional inquiries (e.g., question no. 1) about participants’ experience in assessing features. The responses proved highly encouraging and directly relevant to the theoretical concept under investigation—specifically, the quality of the suggested feature priorities. These priorities were calculated by aggregating stakeholders’ rankings using the BST approach and factoring in objective weights based on each stakeholder’s level of hesitation or knowledge gaps.
Internal Validity concerns the causal relationship between the studied factors and the observed results, questioning whether unconsidered external factors might have influenced the results. In our context, it explores whether the observed results truly stem from the proposed tool-assisted process or if other factors played a role.
To mitigate external factors, we took precautions during stakeholder selection, ensuring participants possessed a high level of experience and familiarity with the features under evaluation [55]. This precision in assessments aligns with the methodology’s requirements. Stakeholders’ justifications during the BSTV tool evaluation demonstrated their knowledge and reasoned evaluations. While the low number of participants could be seen as a threat, the selected stakeholders, being EDUC8 software project experts, offered justified and valid rankings.
Fatigue and confusion due to an excessive number of feature comparisons might impact results. However, the Binary Search Tree (BST) method, requiring O ( n × log ( n ) ) comparisons, is less prone to this issue compared to methods like AHP. Participants spent less time and effort expressing their evaluations [22]. Misinterpretations or incorrect assumptions by evaluators about the process or tool usage could introduce errors. To counter this threat, stakeholders underwent a detailed course with instructions for applying the BST approach. The graphical tool (BSTV) provided further assistance, and participants’ time dedication during tool usage was monitored.
Additionally, potential influences of features interdependencies and interactions were considered. While modern software features often exhibit high interdependence, the proposed method focuses on ranking features under specific criteria, deferring the resolution of dependencies to the release planning process [26,37]. The BST method supports accurate and incremental feature prioritization without necessitating a complete reevaluation as new candidate features are introduced [61].
External Validity pertains to the extent to which the findings of a study can be generalized beyond the specific case under examination. It questions whether the tool-assisted process introduced in our case study can be applied in similar contexts.
While our discussion has primarily focused on one case study, it is essential to note that our approach has been applied to multiple case studies, enhancing the external validity of our findings. In a software development project for a Greek commercial company in the oil industry, the approach was tested to implement a marketing portal [13]. Another case study involved the development of an internet portal for multimedia file sharing, catering to employees and clients of the same oil company in Greece [62]. The criteria in these case studies mirrored the perceived satisfaction/dissatisfaction of users with software features, similar to the case study presented in this work. Encouraging conclusions from these diverse cases reinforce the potential generalizability of our results to future case studies.
Furthermore, we plan to extend the application of our tool and process to case studies with varying characteristics, spanning different domains and sizes. However, it is worth noting that our approach may not be readily applicable to projects with an extensive number of stakeholders or requirements. For projects of considerable scale, recommender system approaches might be more suitable [28]. Consequently, the generalizability of our suggested approach to such large-scale projects may be limited.
Reliability examines whether the results of a study are consistent and would be reproducible under similar conditions. In the context of our case study, several aspects contribute to the reliability of the results:
  • The tool-driven approach: The reliance on a tool ensures that if the same input is provided to the tool, it would produce identical output. This inherent feature contributes to the reliability of the case study results.
  • Selection of stakeholders: The choice of knowledgeable stakeholders with significant experience in the domain under study enhances the reliability of the results. Less experienced or less knowledgeable stakeholders could introduce variability and compromise the reliability of the findings. Thus, the careful selection of stakeholders is a deliberate measure to ensure reliability.
  • Stakeholders’ responses: While it is natural to expect some variations in responses to qualitative surveys, the structured nature of the approach, including the use of a Likert scale, mitigates the potential for large variations. The reliability of the results is further reinforced by the consistency in stakeholders’ responses, making the outcomes more dependable.
  • Dual criteria evaluation: The dual evaluation of features based on both satisfaction and dissatisfaction contributes to increased reliability. The consideration of these two criteria often leads to asymmetric evaluations, providing richer information for decision making. This enhanced information contributes to more reliable and repeatable results in future applications.
  • Sensitivity analysis on stakeholders’ weights: The reliability of the results is confirmed by the sensitivity analysis conducted on stakeholders’ weights. Three variants were used to calculate these weights based on different components of hesitation. Importantly, the prioritization of features remained consistent across these variants, indicating that the results are not highly sensitive to the calculation of objective weights. This resilience contributes to the overall reliability of the findings.

7. Conclusions and Future Work

In this paper, we introduced a practical semi-automated method designed for the prioritization of medium to large sets of candidate software features. The method generates the final priority list of candidate software features, focusing on stakeholders’ asymmetric criteria of satisfaction and dissatisfaction, while emphasizing the value of each feature rather than its implementation cost. The primary motivation behind this method is to address the hesitant and uncertain perceptions that stakeholders often have when ranking medium to large sets of software features using an ordinal scale-based prioritization method.
The key feature of the proposed method is its translation of stakeholders’ rankings of features into Intuitionistic Fuzzy Numbers. Notably, the method calculates objective weights based on the total hesitation of stakeholders who express their rankings for the features. The underlying assumption is that the larger the hesitation associated with each stakeholder’s ranking, the smaller the weight of that ranking should be in determining the final features’ priorities. Objective weights for stakeholders’ rankings can be computed in various ways, allowing for sensitivity analysis.
While our case study is thorough, it is important to outline the limitations that may appear. Firstly, our approach might not work well for software projects with a very large number of candidate features or a very large number of stakeholders. Recommender system approaches could be more appropriate for large-scale software projects. Furthermore, the objectivity of the responses of the stakeholders to the qualitative survey might introduce variations, which could affect the results.
Our future work will involve implementing the tool supporting the method, the BSTV tool, as a web-based software. This transition aims to simplify the method’s application further by enabling a large number of stakeholders to provide their rankings remotely. This enhancement will support the application of the method in the context of distributed software development projects involving numerous stakeholders physically dispersed at various locations. Furthermore, we plan to examine various approaches for the expression of stakeholders preferences (e.g., linguistic terms) and analyze possible conflicts between stakeholders and their impact for the final prioritization result. Additionally, we plan to conduct further controlled experiments to evaluate the underlying principle of the approach, specifically the idea that more hesitation implies less importance weights for deciding the priorities of the features. We acknowledge that in certain cases, such as malformed features, this principle might not always hold, and further investigation is warranted.

Author Contributions

Conceptualization, V.C.G., D.T. and E.T.; Methodology, V.C.G., D.T., G.K., E.T., L.H.S. and A.K.; Software, V.C.G. and O.I.; Validation, V.C.G., D.T., G.K., E.T., O.I., L.H.S. and A.K.; Formal analysis, V.C.G.; Writing—original draft, V.C.G., D.T., G.K., E.T., O.I., L.H.S. and A.K.; Writing—review & editing, V.C.G., D.T., G.K., O.I., L.H.S. and A.K.; Supervision, V.C.G. and A.K.; Project administration, V.C.G. All authors have read and agreed to the published version of the manuscript.

Funding

This research received no external funding.

Data Availability Statement

No new data were created or analyzed in this study. Data sharing is not applicable to this article.

Conflicts of Interest

The authors declare no conflicts of interest.

References

  1. Wiegers, K.; Beatty, J. Software Requirements, 3rd ed.; Microsoft Press: Redmond, WA, USA, 2013. [Google Scholar]
  2. Chen, K.; Zhang, W.; Zhao, H.; Mei, H. An approach to constructing feature models based on requirements clustering. In Proceedings of the 3th IEEE International Conference on Requirements Engineering (RE’05), Paris, France, 29 August–2 September 2005; pp. 31–40. [Google Scholar]
  3. Achimugu, P.; Selamat, A.; Ibrahim, R.; Mahrin, M. A systematic literature review of software requirements prioritization research. Inf. Softw. Technol. 2014, 56, 568–585. [Google Scholar] [CrossRef]
  4. Hujainah, F.; Bakar, R.B.; Abdulgabber, M.A.; Zamli, K.Z. Software requirements prioritisation: A systematic literature review on significance, stakeholders, techniques and challenges. IEEE Access 2018, 6, 71497–71523. [Google Scholar] [CrossRef]
  5. Svensson, R.B.; Gorschek, T.; Regnell, B.; Torkar, R.; Shahrokni, A.; Feldt, R.; Aurum, A. Prioritization of quality requirements: State of practice in eleven companies. In Proceedings of the 19th IEEE International Requirements Engineering Conference, Washington, DC, USA, 29 August–2 September 2011; pp. 69–78. [Google Scholar]
  6. Karlsson, J.; Ryan, K. A cost-value approach for prioritizing requirements. IEEE Softw. 1997, 14, 67–74. [Google Scholar] [CrossRef]
  7. Lehtola, L.; Kauppinen, M.; Kujala, S. Requirements prioritization challenges in practice. In Product Focused Software Process Improvement; Springer: Berlin/Heidelberg, Germany, 2004; pp. 497–508. [Google Scholar]
  8. Hujainah, F.; Bakar, R.B.A.; Al-haimi, B.; Abdulgabber, M.A. Stakeholder quantification and prioritisation research: A systematic literature review. Inf. Softw. Technol. 2018, 102, 85–99. [Google Scholar] [CrossRef]
  9. Pohl, K. Requirements Engineering: Fundamentals, Principles, and Techniques; Springer: Berlin/Heidelberg, Germany, 2010. [Google Scholar]
  10. Lima, D.; Freitas, F.; Campos, G.; Souza, J. A fuzzy approach to requirements prioritization. In Proceedings of the Search Based Software Engineering: Third International Symposium, SSBSE 2011, Szeged, Hungary, 10–12 September 2011; Springer: Berlin/Heidelberg, Germany, 2011; pp. 64–69. [Google Scholar]
  11. Gerogiannis, V.C.; Tzikas, G. Using fuzzy linguistic 2-tuples to collectively prioritize software requirements based on stakeholders’ evaluations. In Proceedings of the 21st Panhellenic Conference on Informatics, Larissa, Greece, 28–30 September 2017. [Google Scholar]
  12. Gerogiannis, V.C.; Fitsilis, P.; Kakarontzas, G.; Borne, C. Handling vagueness and subjectivity in requirements prioritization. In Proceedings of the 22nd Panhellenic Conference on Informatics, Athens, Greece, 29 November–1 December 2018; pp. 150–155. [Google Scholar]
  13. Gerogiannis, V.C.; Tsoni, E.; Born, C.; Iatrellis, O. Software features prioritization based on stakeholders’ satisfaction/dissatisfaction and hesitation. In Proceedings of the 46th Euromicro Conference on Software Engineering and Advanced Applications, IEEE, Portoroz, Slovenia, 26–28 August 2020; pp. 265–271. [Google Scholar]
  14. Iatrellis, O.; Kameas, A.; Fitsilis, P. A novel integrated approach to the execution of personalized and self-evolving learning pathways. Educ. Inf. Technol. 2019, 24, 781–803. [Google Scholar] [CrossRef]
  15. Nayebi, M.; Ruhe, G. Asymmetric release planning: Compromising satisfaction against dissatisfaction. IEEE Trans. Softw. Eng. 2019, 45, 839–857. [Google Scholar] [CrossRef]
  16. Bebensee, T.; van de Weerd, I.; Brinkkemper, S. Binary priority list for prioritizing software requirements. In Requirements Engineering: Foundation for Software Quality: 16th International Working Conference, REFSQ 2010, Essen, Germany, 30 June–2 July 2010; Lecture Notes in Computer Science; Wieringa, R., Persson, A., Eds.; Springer: Berlin/Heidelberg, Germany, 2010; Volume 6182. [Google Scholar]
  17. Atanassov, K.T. Intuitionistic fuzzy sets. Fuzzy Sets Syst. 1986, 20, 87–96. [Google Scholar] [CrossRef]
  18. Atanassov, K.T. Intuitionistic Fuzzy Sets: Theory and Applications; Physica-Verlag: Heidelberg, Germany, 2010. [Google Scholar]
  19. Ladyzynski, P.; Grzegorzewski, P. Vague preferences in recommender systems. Expert Syst. Appl. 2015, 42, 9402–9411. [Google Scholar] [CrossRef]
  20. Bloch, M.; Blumberg, S.; Laartz, J. Delivering Large-Scale IT Projects on Time, on Budget, and on Value; Technical Report; McKinsey Digital: Berlin, Germany, 2012. [Google Scholar]
  21. Babar, M.A.; Ghazali, M.; Jawawi, D.N.A.; Shamsuddin, S.M.; Ibrahim, N. PHandler: An expert system for a scalable software requirements prioritization process. Knowl. Based Syst. 2015, 84, 179–202. [Google Scholar] [CrossRef]
  22. Hujainah, F.; Bakar, R.B.A.; Nasser, A.; Al-haimi, B.; Zamli, K. SRPTackle: A semi-automated requirements prioritisation technique for scalable requirements of software system projects. Inf. Softw. Technol. 2021, 131, 106501. [Google Scholar] [CrossRef]
  23. Carlshamre, P.; Sandahl, K.; Lindvall, M.; Regnell, B.; Natt och Dag, J. An industrial survey of requirements interdependencies in software product release planning. In Proceedings of the 5th IEEE International Symposium on Requirements Engineering (RE’01), Toronto, ON, Canada, 27–31 August 2001; pp. 84–91. [Google Scholar]
  24. Ma, B. The Effectiveness of Requirements Prioritization Techniques for a Medium to Large Number of Requirements: A Systematic Literature Review. Master’s Thesis, Auckland University of Technology, Auckland, New Zealand, 2009. [Google Scholar]
  25. Ahl, V. An Experimental Comparison of Five Prioritization Methods: iNvestigating Ease of Use, Accuracy And Scalability. Master’s Thesis, Blekinge Institute of Technology, School of Engineering, Department of Systems and Software Engineering, Karlskrona, Sweden, 2005. [Google Scholar]
  26. Vogelsang, A. Feature dependencies in automotive software systems: Extent, awareness, and refactoring. J. Syst. Softw. 2020, 160, 110458. [Google Scholar] [CrossRef]
  27. Hujainah, F.; Bakar, R.B.A.; Abdulgabber, M.A. StakeQP: A semi-automated stakeholder quantification and prioritisation technique for requirement selection in software system projects. Decis. Support Syst. 2021, 121, 94–108. [Google Scholar] [CrossRef]
  28. Lim, S.W.; Finkelstein, A. StakeRare: Using social networks and collaborative filtering for large-scale requirements elicitation. IEEE Trans. Softw. Eng. 2012, 38, 707–735. [Google Scholar]
  29. Rodríguez, P.; Urquhart, C.; Mendes, E. A theory of value for value-based feature selection in software engineering. IEEE Trans. Softw. Eng. 2020, 48, 466–484. [Google Scholar] [CrossRef]
  30. Bessey, A.; Block, K.; Chelf, B.; Chou, A.; Fulton, B.; Hallem, S.; Henri-Gros, C.; Kamsky, A.; McPeak, S.; Engler, D. A few billion lines of code later: Using static analysis to find bugs in the real world. Commun. ACM 2010, 53, 66–75. [Google Scholar] [CrossRef]
  31. Malgaonkar, S.; Licorish, S.; Savarimuthu, B. Understanding requirements prioritisation: Literature survey and critical evaluation. IET Softw. 2020, 14, 607–622. [Google Scholar] [CrossRef]
  32. Zhang, X.; Li, J.; Eres, H.; Zheng, C. Prioritizing and aggregating interacting requirements for product-service system development. Expert Syst. Appl. 2021, 185, 115636. [Google Scholar] [CrossRef]
  33. Zhang, J.; Wang, Y.; Xie, T. Software feature refinement prioritization based on online user review mining. Inf. Softw. Technol. 2019, 108, 30–34. [Google Scholar] [CrossRef]
  34. Rojas, L.A.; Macías, J.A. Toward collisions produced in requirements rankings: A qualitative approach and experimental study. J. Syst. Softw. 2019, 158, 110417. [Google Scholar] [CrossRef]
  35. Ibrahim, O.; Nosseir, A. A combined AHP and source of power schemes for prioritising requirements applied on human resources. MATEC Web Conf. 2016, 20, 04016. [Google Scholar] [CrossRef]
  36. Perini, A.; Susi, A.; Avesani, P.A. Machine learning approach to software requirements prioritization. IEEE Trans. Softw. Eng. 2012, 39, 445–461. [Google Scholar] [CrossRef]
  37. Shao, F.; Peng, R.; Lai, H.; Wang, B. DRank: A semi-automated requirements prioritization method based on preferences and dependencies. J. Syst. Softw. 2016, 126, 141–156. [Google Scholar] [CrossRef]
  38. Azar, J.; Smith, R.K.; Cordes, D. Value-oriented requirements prioritization in a small development organization. IEEE Softw. 2007, 24, 32–37. [Google Scholar] [CrossRef]
  39. Mizuno, S.; Akao, Y.; Ishihara, K. QFD: The Customer-driven Approach to Quality Planning & Deployment; Quality Resources: Richmond Heights, OH, USA, 1994. [Google Scholar]
  40. Kakar, A.K. Investigating the penalty reward calculus of software users and its impact on requirements prioritization. Inf. Softw. Technol. 2015, 65, 56–68. [Google Scholar] [CrossRef]
  41. Karlsson, J.; Wohlin, C.; Regnell, B. An evaluation of methods for prioritizing software requirements. Inf. Softw. Technol. 1998, 39, 939–947. [Google Scholar] [CrossRef]
  42. Sadiq, M.; Devi, V. Fuzzy-soft set approach for ranking the functional requirements of software. Expert Syst. Appl. 2021, 193, 116452. [Google Scholar] [CrossRef]
  43. Zhang, H.; Zhang, M.; Yue, T.; Ali, S.; Li, Y. Uncertainty-wise requirements prioritization with search. ACM Trans. Softw. Eng. Methodol. 2021, 30, 1–54. [Google Scholar] [CrossRef]
  44. Martinis, A.; Tzimos, D.; Gerogiannis, V.; Son, H.Y. A Multiple Stakeholders’ Software Requirements Prioritization Approach based on Intuitionistic Fuzzy Sets. In Proceedings of the 4th International Conference on Advances in Computer Technology, Information Science and Communications (CTISC), Suzhou, China, 22–24 April 2022; pp. 1–5. [Google Scholar]
  45. Singh, Y.V.; Kumar, B.; Chand, S.; Kumar, J. A comparative analysis and proposing ‘ANN fuzzy AHP model’ for requirements prioritization. Int. J. Inf. Technol. Comput. Sci. 2018, 4, 65. [Google Scholar] [CrossRef]
  46. Tzimos, D.; Gerogiannis, V.; Son, H.; Karageorgos, A. A Recommender System based on Intuitionistic Fuzzy Sets for Software Requirements Prioritization. In Proceedings of the 25th Pan-Hellenic Conference on Informatics (PCI 2021), Volos, Greece, 26–28 November 2021; Association for Computing Machinery: New York, NY, USA, 2022; pp. 466–471. [Google Scholar]
  47. Alrashoud, M.; Abhari, A. Planning for the next software release using adaptive network-based fuzzy inference system. Intell. Decis. Technol. 2017, 11, 153–165. [Google Scholar] [CrossRef]
  48. Regnell, B.; Höst, M.; Dag, J.N.; Beremark, P.; Hjelm, T. An industrial case study on distributed prioritisation in market-driven requirements engineering for packaged software. Requir. Eng. 2001, 6, 51–62. [Google Scholar] [CrossRef]
  49. Leffingwell, D.; Widrig, D. Managing Software Requirements: A Use Case Approach; Addison-Wesley: Boston, MA, USA, 2003. [Google Scholar]
  50. Chatzipetrou, P.; Angelis, L.; Rovegard, P.; Wohlin, C. Prioritization of issues and requirements by cumulative voting: A compositional data analysis framework. In Proceedings of the 36th EUROMICRO Software Engineering and Advanced Applications (SEAA) Conference, Lille, France, 1–3 September 2010; pp. 361–370. [Google Scholar]
  51. Ye, J. Fuzzy decision-making method based on the weighted correlation coefficient under intuitionistic fuzzy environment. Eur. J. Oper. Res. 2010, 205, 202–204. [Google Scholar] [CrossRef]
  52. Ma, J.; Fan, Z.P.; Huang, L.H. A subjective and objective integrated approach to determine attribute weights. Eur. J. Oper. Res. 1999, 112, 397–404. [Google Scholar] [CrossRef]
  53. EDUC8: Personalized and Self-Evolving Learning Pathways. Available online: http://www.cs.teilar.gr/EDUC8/ (accessed on 7 December 2023).
  54. Iatrellis, O.; Savvas, I.; Fitsilis, P.; Gerogiannis, V. A two-phase machine learning approach for predicting student outcomes. Educ. Inf. Technol. 2020, 26, 69–88. [Google Scholar] [CrossRef]
  55. Wohlin, C.; Runeson, P.; Höst, M.; Ohlsson, M.; Regnell, B.; Wesslén, A. Experimentation in Software Engineering; Springer Publishing Company: Berlin/Heidelberg, Germany, 2012. [Google Scholar]
  56. Marciuska, S.; Cencel, G.; Abrahamsson, P. Exploring how feature usage relates to customer perceived value: A case study in a startup company. In Proceedings of the Lecture Notes in Business Information Processing, Porto, Portugal, 7–8 February 2013; Volume 150. [Google Scholar]
  57. Chen, T.Y.; Li, C.H. Determining objective weights with intuitionistic fuzzy entropy measures: A comparative analysis. Inf. Sci. 2010, 180, 4207–4222. [Google Scholar] [CrossRef]
  58. Lee, H.C.; Chang, C.T. Comparative analysis of MCDM methods for ranking renewable energy sources in Taiwan. Renew. Sustain. Energy Rev. 2018, 92, 883–896. [Google Scholar] [CrossRef]
  59. Alvo, M.; Cabilio, P. Rank correlation methods for missing data. Can. J. Stat./La Rev. Can. De Stat. 1995, 23, 345–358. [Google Scholar] [CrossRef]
  60. Cleff, T. Exploratory Data Analysis in Business and Economics; Springer International Publishing: Cham, Switzerland, 2014. [Google Scholar]
  61. Bukhsh, F.; Bukhsh, Z.; Daneva, M. A systematic literature review on requirement prioritization techniques and their empirical evaluation. Comput. Stand. Interfaces 2019, 69, 103389. [Google Scholar] [CrossRef]
  62. Tsoni, E. Handling Uncertainty in Requirements Prioritization; Technical Report HOU-CS-UGP-2018-6; Hellenic Open University: Thermi, Greece, 2018. [Google Scholar]
Figure 1. Architecture of the EDUC8 System.
Mathematics 12 00680 g001
Figure 2. Tool for constructing binary search trees and implementing method computations.
Mathematics 12 00680 g002
Figure 3. Stakeholder #1—BST for ranking the features according to satisfaction.
Mathematics 12 00680 g003
Figure 4. Stakeholder #1—BST for ranking the features according to dissatisfaction.
Mathematics 12 00680 g004
Figure 5. Features prioritization comparison based on satisfaction.
Mathematics 12 00680 g005
Figure 6. Features prioritization comparison based on dissatisfaction.
Mathematics 12 00680 g006
Table 1. Example of feature rankings and corresponding IFNs.
FeatureRanking of Features
According to Satisfaction
Ranking of Features
According to Dissatisfaction
Position μ u π Position μ u π
f 1 10.88500.11530.4620.2690.269
f 2 20.8460.0380.11520.5770.1150.308
f 3 30.6150.0770.308N001.000
f 4 40.4620.3080.23110.73100.269
f 5 30.6150.0770.30810.73100.269
f 6 30.6150.0770.30820.5770.1150.308
f 7 30.6150.0770.30850.2690.4620.269
f 8 30.6150.0770.30820.5770.1150.308
f 9 30.6150.0770.308N001.000
f 10 40.4620.3080.23110.73100.269
f 11 40.4620.3080.23120.5770.1150.308
f 12 40.4620.3080.23130.4620.2690.269
f 13 50.3460.4620.19270.1150.6540.231
f 14 50.3460.4620.19280.0770.7310.192
f 15 50.3460.4620.19230.4620.2690.269
f 16 60.1920.5770.231900.7690.231
f 17 60.1920.5770.23170.1150.6540.231
f 18 60.1920.5770.23150.2690.4620.269
f 19 60.1920.5770.231900.7690.231
f 20 70.1150.7310.15460.1920.5770.231
f 21 70.1150.7310.154N001.000
f 22 80.0770.8080.11540.3850.3850.231
f 23 900.8460.15440.3850.3850.231
f 24 900.8460.15460.1920.5770.231
f 25 N001.000N001.000
f 26 N001.00050.2690.4620.269
f 27 N001.000N001.000
Total Hesitation = 8.230Total Hesitation = 10.692
Average Total Hesitation (Total
Hesitation/No. of Features) = 0.304
Average Total Hesitation (Total
Hesitation/No. of Features) = 0.396
Weight = 0.535Weight = 0.464
Table 2. Weighted correlation coefficients (final features’ priorities).
Feature   Results in the
Numerator
of Equation (11)
Results in the
Denumerator
of Equation (11)
WCC (Final
Features’
Priorities)
f 1 0.6880.4190.1330.5510.7430.926
f 2 0.7210.3840.1610.5450.7380.977
f 3 0.3290.20600.2060.4540.726
f 4 0.5870.1650.2480.4130.6430.913
f 5 0.6690.2060.2480.4540.6740.993
f 6 0.5980.2060.1610.3670.6060.987
f 7 0.4540.2060.1330.3390.5820.781
f 8 0.5980.2060.1610.3670.6060.987
f 9 0.3290.20600.2060.4540.726
f 10 0.5870.1650.2480.4130.6430.913
f 11 0.5150.1650.1610.3260.5710.903
f 12 0.4620.1650.1330.2970.5450.846
f 13 0.2390.1780.2050.3830.6190.386
f 14 0.2210.1780.2510.4290.6550.337
f 15 0.4000.1780.1330.3110.5580.717
f 16 0.1030.1980.2750.4730.6880.150
f 17 0.1570.1980.2050.4030.6350.247
f 18 0.2280.1980.1330.3310.5750.397
f 19 0.1030.1980.2750.4730.6880.150
f 20 0.1510.2930.1720.4650.6820.222
f 21 0.0620.29300.2930.5410.114
f 22 0.2200.3520.1380.4900.7000.314
f 23 0.1790.3830.1380.5210.7220.248
f 24 0.0890.3830.1720.5550.7450.120
f 25 000000
f 26 0.12500.1330.1330.3640.344
f 27 000000
Table 3. Candidate Features of EDUC8.
FeatureFeature NameDescription (Functional Goal)
f 1 Incomplete tasks viewView pending or incomplete tasks associated with a particular workflow
f 2 Push notificationsAdd push notifications as a way of alerting users to information from EDUC8
f 3 Multiple file upload mechanismUpload multiple files using a single input file element
f 4 Enhanced language optionsAdd a new menu as a language selector
f 5 Drag and drop featureCopy, reorder, and delete objects using the mouse in various sections
f 6 Handling multiple concurrent programsSupport the execution of multiple concurrent educational programs
f 7 Event viewer to track changesLog EDUC8 messages, including errors, information messages, and warnings
f 8 Search by programAllow users to filter search results by programs
f 9 Graphical learning pathway designerImplement an integrated Business Process Model Notation (BPMN) diagram tool
f 10 View individuals by categoryDisplay instances of a specific class
f 11 Built-in analyticsIncorporate predictive analytics modules to drive decision making
f 12 Email notificationsAutomated email notifications for specific tasks
f 13 Keyboard shortcutsAdd keyboard shortcuts that trigger specific actions
f 14 Graphical Semantic Web Rule Language (SWRL) rule designerImplement a visual modeling tool for the design and storage of semantic rules
f 15 What You See Is What You Get (WYSIWYG) editorsReplace simple text areas with WYSIWYG editors to enrich content creation
f 16 Single sign-onConnect with the University’s Lightweight Directory Access Protocol (LDAP) directory
f 17 Advanced search by studentNarrow student results by adding more search terms
f 18 Improve error handlingAdd error descriptions in clear and simple language
f 19 Human Resource Management System integrationIntegrate with the University’s human resource management system
f 20 Student Information System integrationIntegrate with the University’s student information system
f 21 Improve user profile settingsImplement a tabbed user interface
f 22 “Forgot password” functionalityAdd a password recovery option
f 23 Grant Management System integrationIntegrate with the grant management system
f 24 “Remember Me” login functionalityAllow users to store their login information on their local computer
f 25 Real-time chatProvide a live transmission of text messages between end-users
f 26 Fully responsive designPreserve the user experience and look and feel across all devices
f 27 GUI role-based adaptationShow or hide features for specific roles
Table 4. Stakeholders and their roles.
StakeholderRole
Stakeholder #1IT Team Head
Stakeholder #2Ontology Engineer
Stakeholder #3Academic Advisor
Stakeholder #4BPMN Process Analyst
Stakeholder #5Manager
Table 5. Features’ rankings and priorities based on satisfaction.
Features
(a)
Stakeholder #1Stakeholder #2Stakeholder #3Stakeholder #4Stakeholder #5Features’ Priorities (WCCs)
Based on Satisfaction
(v)
Final Priority
(w)
Ranking
(b)
μ
(c)
u
(d)
π
(e)
Ranking
(f)
μ
(g)
u
(h)
π
(i)
Ranking
(j)
μ
(k)
u
(l)
π
(m)
Ranking
(n)
μ
(o)
u
(p)
π
(q)
Ranking
(r)
μ
(s)
u
(t)
π
(u)
f 1 10.88500.11540.4620.3080.23130.3850.3460.26960.3460.5380.115N001.0000.70911
f 2 900.8850.11560.1920.5770.23150.1150.6920.192N001.000700.8080.1920.08927
f 3 900.8850.11540.4620.3080.23120.5770.1920.231N001.000700.8080.1920.31020
f 4 40.5380.2690.19260.1920.5770.23150.1150.6920.19240.5770.2690.15420.5770.1540.2690.64313
f 5 80.0770.7690.15460.1920.5770.23150.1150.6920.19280.1150.7690.11550.2310.5380.2310.20424
f 6 60.3460.5380.11560.1920.5770.231600.8080.19210.88500.11530.4230.3080.2690.53715
f 7 50.4230.4230.15470.1150.7310.154600.8080.19220.7690.0770.15410.73100.2690.56414
f 8 70.1920.6150.19270.1150.7310.154600.8080.19270.1920.6150.192N001.0000.16625
f 9 50.4230.4230.15440.4620.3080.23120.5770.1920.23120.7690.0770.15410.73100.2690.8952
f 10 80.0770.7690.15420.6920.1150.19220.5770.1920.23170.1920.6150.192N001.0000.48918
f 11 80.0770.7690.154N001.000N001.00080.1150.7690.11550.2310.5380.2310.14626
f 12 70.1920.6150.192800.8080.19210.73100.269900.8460.15460.0770.6540.2690.26022
f 13 30.6920.1540.15420.6920.1150.19230.3850.3460.26950.4230.3850.19230.4230.3080.2690.8594
f 14 60.3460.5380.11550.3460.4620.19210.73100.26910.88500.11540.3460.4620.1920.7698
f 15 N001.000800.8080.19240.2310.5380.23170.1920.6150.19240.3460.4620.1920.25123
f 16 30.6920.1540.15410.80800.19210.73100.26930.6920.1920.11510.73100.2690.9861
f 17 40.5380.2690.19230.6150.2310.15440.2310.5380.23140.5770.2690.15430.4230.3080.2690.7997
f 18 70.1920.6150.19220.6920.1150.19210.73100.269900.8460.15460.0770.6540.2690.45819
f 19 10.88500.11510.80800.19230.3850.3460.26960.3460.5380.115N001.0000.7559
f 20 20.8080.0770.11550.3460.4620.19230.3850.3460.26950.4230.3850.19220.5770.1540.2690.8156
f 21 40.5380.2690.192N001.000N001.00040.5770.2690.15460.0770.6540.2690.51916
f 22 20.8080.0770.11530.6150.2310.15440.2310.5380.23150.4230.3850.19220.5770.1540.2690.8195
f 23 30.6920.1540.15450.3460.4620.19230.3850.3460.26930.6920.1920.11520.5770.1540.2690.8603
f 24 N001.000800.8080.19240.2310.5380.23170.1920.6150.19230.4230.3080.2690.27821
f 25 70.1920.6150.19210.80800.19210.73100.269900.8460.15450.2310.5380.2310.51917
f 26 40.5380.2690.192N001.000N001.00050.4230.3850.19210.73100.2690.68512
f 27 50.4230.4230.15440.4620.3080.23120.5770.1920.23120.7690.0770.15460.0770.6540.2690.73510
Total Hesitation = 5.846Total Hesitation = 7.769Total Hesitation = 8.692Total Hesitation = 5.846Total Hesitation = 9.769
Weight = 0.218Weight = 0.198Weight = 0.189Weight = 0.218Weight = 0.177
Table 6. Features’ rankings and priorities based on dissatisfaction.
Features
(a)
Stakeholder #1Stakeholder #2Stakeholder #3Stakeholder #4Stakeholder #5Features’ Priorities (WCCs)
Based on Satisfaction
(v)
Final Priority
(w)
Ranking
(b)
μ
(c)
u
(d)
π
(e)
Ranking
(f)
μ
(g)
u
(h)
π
(i)
Ranking
(j)
μ
(k)
u
(l)
π
(m)
Ranking
(n)
μ
(o)
u
(p)
π
(q)
Ranking
(r)
μ
(s)
u
(t)
π
(u)
f 1 80.1150.7690.11590.0380.8460.11540.5770.3460.077N001.000900.8460.1540.22725
f 2 70.2310.6540.11550.3850.5000.1151100.9230.07770.1150.6540.231N001.0000.22026
f 3 20.7690.1150.115N001.00010.88500.11560.2310.5380.23170.1540.6920.1540.64113
f 4 70.2310.6540.11560.2690.5770.15460.3850.5380.07770.1150.6540.231N001.0000.35220
f 5 70.2310.6540.11550.3850.5000.11560.3850.5380.07770.1150.6540.231N001.0000.39119
f 6 80.1150.7690.11580.1150.7690.1151100.9230.077N001.00080.0770.7690.1540.08427
f 7 60.3460.5380.11590.0380.8460.115100.0770.8460.07740.5000.3080.192900.8460.1540.24124
f 8 60.3460.5380.11580.1150.7690.115100.0770.8460.07710.73100.26980.0770.7690.1540.33421
f 9 50.4620.3850.15470.1920.6920.11510.88500.11550.3460.3850.26950.3080.5000.1920.66311
f 10 30.6920.2310.0771000.9230.07710.88500.11530.5770.2310.19270.1540.6920.1540.60214
f 11 900.8850.11560.2690.5770.15490.1540.7690.077N001.00040.4230.4230.1540.24823
f 12 10.88500.11510.80800.19250.4620.4230.11510.73100.26930.5000.2690.2310.9204
f 13 80.1150.7690.11570.1920.6920.11540.5770.3460.077N001.00050.3080.5000.1920.39518
f 14 20.7690.1150.11530.5380.2690.19230.6540.2310.11560.2310.5380.23110.76900.2310.8735
f 15 50.4620.3850.15410.80800.19270.3080.6150.07750.3460.3850.26910.76900.2310.7789
f 16 N001.00020.6920.1540.15450.4620.4230.115800.7690.23120.6540.1540.1920.59815
f 17 900.8850.11560.2690.5770.15480.2310.6920.077800.7690.23140.4230.4230.1540.25222
f 18 10.88500.11510.80800.19230.6540.2310.11510.73100.26930.5000.2690.2310.9612
f 19 30.6920.2310.07710.80800.19220.7690.1150.11530.5770.2310.19230.5000.2690.2310.9503
f 20 20.7690.1150.115N001.00020.7690.1150.11560.2310.5380.23150.3080.5000.1920.70010
f 21 50.4620.3850.15440.4620.4230.11590.1540.7690.07750.3460.3850.26960.2310.6150.1540.50916
f 22 900.8850.11530.5380.2690.19280.2310.6920.077800.7690.23110.76900.2310.40117
f 23 60.3460.5380.11520.6920.1540.15420.7690.1150.11540.5000.3080.19220.6540.1540.1920.8686
f 24 40.6150.3080.07720.6920.1540.15470.3080.6150.07720.6540.1540.19220.6540.1540.1920.8387
f 25 10.88500.11530.5380.2690.19230.6540.2310.11510.73100.26910.76900.2310.9621
f 26 40.6150.3080.07740.4620.4230.115N001.00020.6540.1540.19260.2310.6150.1540.65412
f 27 50.4620.3850.15430.5380.2690.19250.4620.4230.11550.3460.3850.26930.5000.2690.2310.7918
Total Hesitation = 4.000Total Hesitation = 5.692Total Hesitation = 3.462Total Hesitation = 9.385Total Hesitation = 7.538
Weight = 0.219Weight = 0.203Weight = 0.224Weight = 0.168Weight = 0.185
Table 7. Features’ priorities and finally selected features.
Features
(a)
Priorities
Based on
Satisfaction
(b)
Priorities
Based on
Dissatisfaction
(c)
Features with
Priorities Higher than 0.5
Based on Satisfaction
(d)
Features with
Priorities Higher than 0.5
Based on Dissatisfaction
(e)
Selected
Features
(f)
f 1 0.7090.227 f 1
f 2 0.0890.220
f 3 0.3100.641 f 3
f 4 0.6430.352 f 4
f 5 0.2040.391
f 6 0.5370.084 f 6
f 7 0.5640.241 f 7
f 8 0.1660.334
f 9 0.8950.663 f 9 f 9 f 9
f 10 0.4890.602 f 10
f 11 0.1460.248
f 12 0.2600.920 f 12
f 13 0.8590.395 f 13
f 14 0.7690.873 f 14 f 14 f 14
f 15 0.2510.778 f 15
f 16 0.9860.598 f 16 f 16 f 16
f 17 0.7990.252 f 17
f 18 0.4580.961 f 18
f 19 0.7550.950 f 19 f 19 f 19
f 20 0.8150.700 f 20 f 20 f 20
f 21 0.5190.509 f 21 f 21 f 21
f 22 0.8190.401 f 22
f 23 0.8600.868 f 23 f 23 f 23
f 24 0.2780.838 f 24
f 25 0.5190.962 f 25 f 25 f 25
f 26 0.6850.654 f 26 f 26 f 26
f 27 0.7350.791 f 27 f 27 f 27
Table 8. Stakeholders weights based on satisfaction (with/without the effect of the positions of the tied features).
StakeholderHindet Calculated
Using Equation (6)
WeightHindet Calculated
Using Equation (8)
Weight
Stakeholder #15.8460.21813.0000.238
Stakeholder #27.7690.19814.6920.209
Stakeholder #38.6920.18917.8460.156
Stakeholder #45.8460.21812.7690.242
Stakeholder #59.7690.17717.8460.156
Average7.5840.20015.2310.200
St. Dev.1.7380.0162.5000.038
Table 9. Stakeholders’ feature ranking and final prioritization correlation.
StakeholderCorrelation Based on
Satisfaction
Correlation Based on
Dissatisfaction
Stakeholder #10.7990.806
Stakeholder #20.5450.752
Stakeholder #30.3020.647
Stakeholder #40.6700.556
Stakeholder #50.6910.662
Disclaimer/Publisher’s Note: The statements, opinions and data contained in all publications are solely those of the individual author(s) and contributor(s) and not of MDPI and/or the editor(s). MDPI and/or the editor(s) disclaim responsibility for any injury to people or property resulting from any ideas, methods, instructions or products referred to in the content.

