1. Introduction
For many years, the concept of a fault detection system has been a fundamental element in the quality control of manufacturing systems. Systematically ensuring the quality and reliability of the manufacturing process has been studied, as any defects can have significant financial and reputational implications [
1]. One of the most widely used fault detection techniques for this purpose in wiring harness manufacturing systems is Crimp Force Monitoring (CFM) [
2], which monitors the signals generated during the crimping termination process to enable instant determination of crimp quality [
3]. CFM analyzes crimp quality by using piezoelectric sensors to measure machine pressure.
A fundamental approach of the CFMis the comparison of the peak of the pressure data. A commonly employed CFM method is the aligning of each crimping datum with reference data. These reference data are manually collected and known to be of good quality, and the difference between the measured and reference data is then calculated using a specified metric, wherein discrepancies around the peaks of the data are given more weight. Quality requirements are met only if the difference is within an allowable tolerance range. This simple, albeit rigid methodology makes CFM a highly trusted tool in the manufacturing sector [
4]. Despite its simplicity and accuracy, CFM presents significant challenges. One of the challenges is its dependency on high-cost dedicated-equipment installation, necessitating substantial investment for each production line. This financial burden is further compounded by the frequent need for maintenance of the equipment. Furthermore, for high accuracy in fault detection, CFM requires a predefined tolerance range and the collection of reference data. Such a system demands considerable time to recalibrate with every change in the manufacturing process, while depending on the skills of the operators, increasing the scope for human error, and necessitating constant human involvement. The scalability of CFM is also a notable challenge. If production volumes and variety increase, the system may struggle to maintain efficiency and accuracy. This limitation hinders flexibility in manufacturing operations, especially in facilities that produce a wide range of products.
To address these challenges, fault detection systems can be integrated with Artificial Intelligence (AI). AI continually learns and adapts from real-time data, allowing it to adjust to a broad range of manufacturing processes and external conditions. This adaptability significantly decreases the need for frequent system recalibration [
5,
6]. Also, an AI-based system does not necessitate deep understanding and expertise in data processing, making it more accessible. AI can also enhance the scalability of manufacturing operations by efficiently managing data from multiple production lines and adapting to changes in product types without the need for extensive reconfiguration. This flexibility supports manufacturers in responding quickly to market demands and product diversification, maintaining high levels of efficiency and accuracy across diverse manufacturing scenarios. Clearly, the integration of AI has been used as a tool to optimize fault detection processes in various manufacturing industries, ranging from textiles to automobiles [
7,
8,
9]. Nevertheless, before introducing AI into real-world crimping manufacturing systems, there are several challenges that must be addressed. First, changes in the crimping manufacturing process can make existing AI models obsolete due to variations in data scales across diverse manufacturing settings. For example, changing the wire type, which varies in thickness, can alter the overall data scale, rendering previously established models ineffective. Furthermore, in real-world manufacturing systems, labeled defective data for AI model training are unavailable, because unpredictable defects can occur. The constraint of a limited training dataset significantly reduces the performance of AI models, and this issue is particularly noticeable with advanced machine learning algorithms, such as deep learning, which require substantial data and computational resources. Anomaly detection algorithms such as Isolation Forest that can be trained solely on normal data to detect unseen defects are available. But this may not guarantee sufficient detection accuracy for all potential faults, and such a limited performance makes such algorithms less applicable in real-world manufacturing quality control practice.
In response to these challenges, this paper proposes a fault detection system that employs AI with Regional Selective Data Scaling (RSDS). RSDS generates synthetic abnormal data from the reference data by performing upscaling or downscaling on specific regions of the reference data. This allows the fault detection system to efficiently train its AI model with a dataset comprised exclusively of normal operational data and still achieve high accuracy in detecting faults. In this study, a multilayer perceptron (MLP) classification model was trained exclusively on normal data and was able to effectively distinguish between normal and abnormal conditions. To validate the system, fifteen unique raw datasets from a real-world industrial facility were collected and tested with four anomaly detection algorithms: Isolation Forest, one-class Autoencoders, k-means, and a Histogram-Based Outlier Score (HBOS). In summary, this paper makes several significant contributions, including the following:
The development of the RSDS, which augments AI training by generating synthetic anomaly data, enriching the training dataset and model robustness.
A methodology for efficient model training that overcomes the challenges posed by the limited availability of reference data, ensuring comprehensive learning.
The implementation and validation of high-accuracy anomaly detection, employing an MLP trained only on data representing normal operational conditions.
An extensive validation of the proposed system using real-world industrial datasets, demonstrating its applicability and effectiveness in practical scenarios.
A comparative analysis that shows the superior performance of the proposed anomaly detection system against traditional anomaly detection methods, highlighting its potential to revolutionize industrial monitoring.
The rest of this paper is organized into the following sections: The Background section recaps notable studies on AI-based fault detection in manufacturing, while the Methodology section outlines the presented approach, focusing on anomaly detection and RSDS. The Results section then evaluates the proposed model’s performance in detecting faults and generating synthetic abnormal data. Finally, the Discussion and Conclusion sections encapsulate the key findings and implications and hint at potential future research directions.
2. Background and Related Works
Supervised learning has been utilized to detect faults in different industrial processes. Its ability to learn from labeled data and predict outcomes makes it a powerful tool for fault detection and classification, particularly in complex manufacturing processes [
10]. This approach has been used in sectors like semiconductor manufacturing, where the early detection of faults can offer significant time and cost savings [
5,
11]. The advantages of supervised learning extend to various applications within the manufacturing sector. For example, it has been used to monitor the condition of widely used industrial machines, such as industrial machines, by identifying faults at an early stage [
12]. Supervised learning has been employed in electric motor manufacturing to optimize processes such as hairpin winding, enhancing the quality of the final product [
13]. Moreover, the effectiveness of supervised learning has been demonstrated in the detection and classification of faults in rotating machinery. Techniques such as the Shapley Additive Explanation (SHAP) have been used to identify the most important features for fault detection, enhancing the interpretability of the model outcomes [
14]. Nevertheless, supervised learning demands a significant number of labeled data for training models, while the process of collecting and labeling data is both time-consuming and costly.
To handle such issues, unsupervised learning and outlier analysis methods can be considered. These methods can extract meaningful features from raw data and efficiently process large volumes of unlabeled data [
15]. They are useful for addressing the complexities of manufacturing environments, providing effective diagnostic tools without predefined labels [
16]. However, the utility of these unsupervised learning methods is not without limitations. Generally, the feature selection process may include noise or irrelevant features, impacting the diagnostic accuracy [
17]; it also demands a substantial volume of unlabeled data to achieve a satisfactory level of classification performance [
18].
To complement such drawbacks, semi-supervised learning techniques, which combine the strengths of both supervised and unsupervised learning by selectively incorporating labeled data from an uncertain unlabeled data pool into the training process, can be used [
19]. This approach effectively optimizes learning from limited data while further strengthening the fault diagnosis by integrating various classifiers, which can help mitigate the risk of incorporating noise or irrelevant features. This can increase the diversity and robustness of the learning process [
20]. Despite these advances, a critical challenge remains in the training model process. For fault detection, these models require data from both normal and abnormal classes for effective training. However, in real-world manufacturing processes, obtaining abnormal data is a significant challenge due to the unpredictable nature of defects [
21].
Anomaly detection algorithms can address the above issues by training models with only the normal class. Numerous anomaly detection techniques have been proposed to classify outliers within normal data [
22]. Typically, existing machine learning algorithms are employed for outlier detection. For example, Decision Trees offer a straightforward, rule-based approach to identifying anomalies by detecting deviations from typical patterns [
23]. These algorithms enable one-class training by learning the boundaries and characteristics of the normal class from a predominantly normal dataset. Neural networks can also be used for anomaly detection due to their ability to comprehend complex relationships. For example, Autoencoders can effectively utilize their reconstruction errors to differentiate abnormal status from normal data [
24]. Clustering techniques remain powerful for anomaly detection, such as k-means, which groups similar data and highlights outliers in less populated clusters [
25].
3. Proposed Methodology
Manufacturing sectors have extensively utilized supervised learning for fault detection and classification, given its efficacy in predicting outcomes from labeled data. While its capabilities are advanced, supervised learning poses challenges, such as the need for extensive labeled data, whose acquisition is a time-intensive and costly process. Unsupervised learning methods can mitigate some of these challenges by processing large volumes of unlabeled data. Semi-supervised learning presents a solution by combining the strengths of both techniques, but due to the unpredictable nature of defects, its utility is also limited by the challenge of acquiring abnormal data. To address the problem, anomaly detection algorithms are proposed to train models using only one-class data. However, in real-world manufacturing practice, there are only a few available reference data for training an AI model. Therefore, it is likely that the models trained solely on a small number of normal data will show low performance against diverse and previously unseen anomalies. Additionally, these algorithms can be subject to overfitting, especially when the available normal data are not comprehensive or representative of all possible normal behaviors. Setting up an appropriate threshold to classify anomalies is another challenge. Achieving high accuracy in fault detection requires a careful balance between a model’s sensitivity and specificity. Conclusively, even as anomaly detection provides a feasible solution, these challenges emphasize the need for a different paradigm for the AI model for fault detection. The proposed methodology is outlined in the following sequence:
Section 3.1 details the acquisition of raw data, setting the foundation for our analysis, while
Section 3.2 presents the architecture of the overall system, with a particular emphasis on the AI model. This section also covers the creation of synthetic abnormal data, integrating aspects of data augmentation to enhance the model’s robustness and accuracy.
3.1. Raw Data Acquisition and Analysis
To develop a practical fault detection system, it is essential to collect raw data from the actual manufacturing process, instead of mere theoretical simulation. For this research, raw data were collected from a wire harness crimping machine, specifically the JYP-P700 model, currently in operation at a real-world industrial facility.
The machine operates in multi-shift cycles and is dedicated to producing wire harnesses for a range of electronic components. The CFM system was used to collect the data due to the need for legitimately labeled data for AI training and testing. The CFM utilizes a piezoelectric sensor, attached to the side of the machine, to accurately measure the pressure during the crimping process, as shown in
Figure 1.
Fifteen distinct datasets were collected between 19 April and 8 May 2023, documenting daily recordings of each crimping operation from the integrated CFM system. The data collection process was thoroughly monitored by an operator for the research perforce, and it is assumed that all crimping operations were accurately labeled. This comprehensive collection resulted in a total of 23,383 individual crimp records over the period of study. The CFM system provides a timestamp, binary quality labels for crimping (categorized as “Good” or “Bad”), and 200 data points associated with each crimp. A total of 200 data points were collected at a frequency of 200 Hz, with a data point collected every 5 milliseconds. According to the classifications provided by the system, 23,286 entries were marked as “Good”, with the remaining 97 labeled as “Bad”. The “Bad” were mostly attributed to issues such as damaged insulation, which leads to exposed wires, and improper crimping resulting in weak electrical connections that can compromise the overall functionality of the wire harness.
Table 1 provides the details for each dataset with statistical information.
Table 1 demonstrates the variable nature of the raw datasets. The scales of the datasets, even those collected on the same day, are significantly different, which poses a substantial challenge to the development of a generalized AI model for defect detection. Data collected on 19 April, 26 April, and 4 May display clear discrepancies between the two occasions. This inconsistency is not just due to the variability in products but also arises from issues with sensor sensitivity and fluctuations in environmental conditions. Given these variable and inconsistent scales, it is crucial to reset the AI model for each unique manufacturing setup, ensuring accurate defect detection under these diverse and variable conditions.
3.2. Proposed Fault Detection System
Considering the constraints of traditional CFM and recognizing the complex challenges posed by conventional AI integration into fault detection, this paper presents a new paradigm: a fault detection system based on AI with RSDS. This paradigm offers a solution to challenges caused by unpredictable defects in the manufacturing process and limited training data for real-time fault detection by using an anomaly-detection-based algorithm.
The above
Figure 2 illustrates the process of using an AI model for fault detection in wiring harness crimping operation. Initially, reference data are manually collected by an operator. Then, RSDS is applied to the reference data to generate synthetic abnormal data by performing upscaling or downscaling on specific regions of the reference data. The data are then augmented using Laplace distribution to increase the volume of the dataset and improve the training robustness of the model. Afterward, an augmented dataset is used to train the AI model of the system, which utilizes a multilayer perceptron (MLP). An MLP consists of three layers: the input layer receives the initial data, the hidden layers process and transform these data through various computations, and the output layer provides the final result or prediction based on the processed information. Once the model is trained, it begins detecting faults in the remaining upcoming crimping data.
The following subsections briefly introduce the raw data used in this research and demonstrate how we preprocessed the data. They next present the analysis of the dataset, highlighting the unique challenges for fault detection in a wire harness crimping manufacturing process. They then detail RSDS’s unique method of training the AI model and conclude with an overview of the classification model used.
3.2.1. Artificial Intelligence Model
In practical manufacturing scenarios, fault detection systems often classify defects without prior knowledge of defective instances. For example, current CFM systems can conduct accurate fault detection using only thirty reference data from normal manufacturing operations, without any defect data. However, training any AI model with only thirty reference data is challenging. The primary reason for this is overfitting, where the model becomes excessively tailored to the limited training data, reducing its ability to detect unseen defects. Moreover, the absence of abnormal data in the initial set might hinder the AI’s ability to recognize and differentiate anomalous patterns from standard ones.
Considering these challenges, an MLP is a suitable and technically sound choice for several reasons. Firstly, due to its multifaceted approach, MLPs demonstrate high adaptability against diverse data patterns by modeling both linear and non-linear relationships through its structured layers of neurons. Each neuron in these layers processes input data with the calculation
where
is the activation of the
-th neuron in the
-th layer,
is an activation function capable of capturing non-linearities, and
and
represent the weights and biases, respectively, which are fine-tuned during training [
26]. The scalable architecture of the MLP allows for adjustable model complexity, ensuring a balance between accuracy and computational efficiency in its learning process. The MLP is trained by adjusting these weights and biases to minimize the cost function
using the backpropagation algorithm to compute the gradients
and
. These gradients inform how the weights
and biases
are updated, by
where
is the learning rate [
27]. Adjusting the number of layers and neurons allows the MLP to be more suited to particular manufacturing scenarios. Furthermore, the MLP can be easily integrated into other systems within the manufacturing setup, allowing it to function alongside other processes, provided that the data are appropriately preprocessed. This integration can enhance the overall efficiency of fault detection systems, leading to more reliable and timely identification of potential defectives.
3.2.2. Synthetic Abnormal Data Development
The MLP necessitates at least two classes for training, thus requiring the creation of synthetic abnormal data to effectively train the model. Generating and integrating synthetic abnormal data can introduce additional complexities and potential biases into the training process, demanding a careful and strategic approach to ensure genuine and meaningful learning. A feasible approach might involve up/downscaling of the original data to create synthetic fault data. Implementing up/downscaling randomly on the original data seems like a feasible solution for detecting unexpected defects. However, this technique can complicate the model by necessitating the integration of numerous fault data classes. This increases the model’s structural complexity while prolonging the training duration, potentially delaying deployment in practical manufacturing settings.
In contrast, uniformly applying scaling adjusts the entire dataset consistently, potentially simulating various defect scenarios by systematically deviating from the original “normal” manufacturing data. However, uniform scaling across the entire dataset might impede classification performance, as it counters the MLP’s intrinsic learning mechanism. Given that MLPs learn primarily by adjusting weights during the backpropagation process, uniform scaling, which inherently reduces differences in the data, could adversely impact the model’s ability to effectively differentiate and adjust weights, possibly compromising its predictive accuracy and classification ability. This can be explained through the weight adjustment equation
where
is the weight adjustment,
is the learning rate,
and
are the target and output values, respectively, and
represents the input value. The complication arising from uniformly incrementing input values (i.e., input values subjected to uniform scaling) is that since all inputs exhibit identical patterns of change, the MLP might struggle to determine how to independently adjust the weights for each input. Specifically, when
values ascend at a consistent rate, all weight adjustments
would likewise manifest identical patterns, which could hinder the MLP from learning each feature independently. Consequently, this uniform increment could adversely impact the MLP’s classification performance and predictive accuracy by distorting the relative disparities among each input feature.
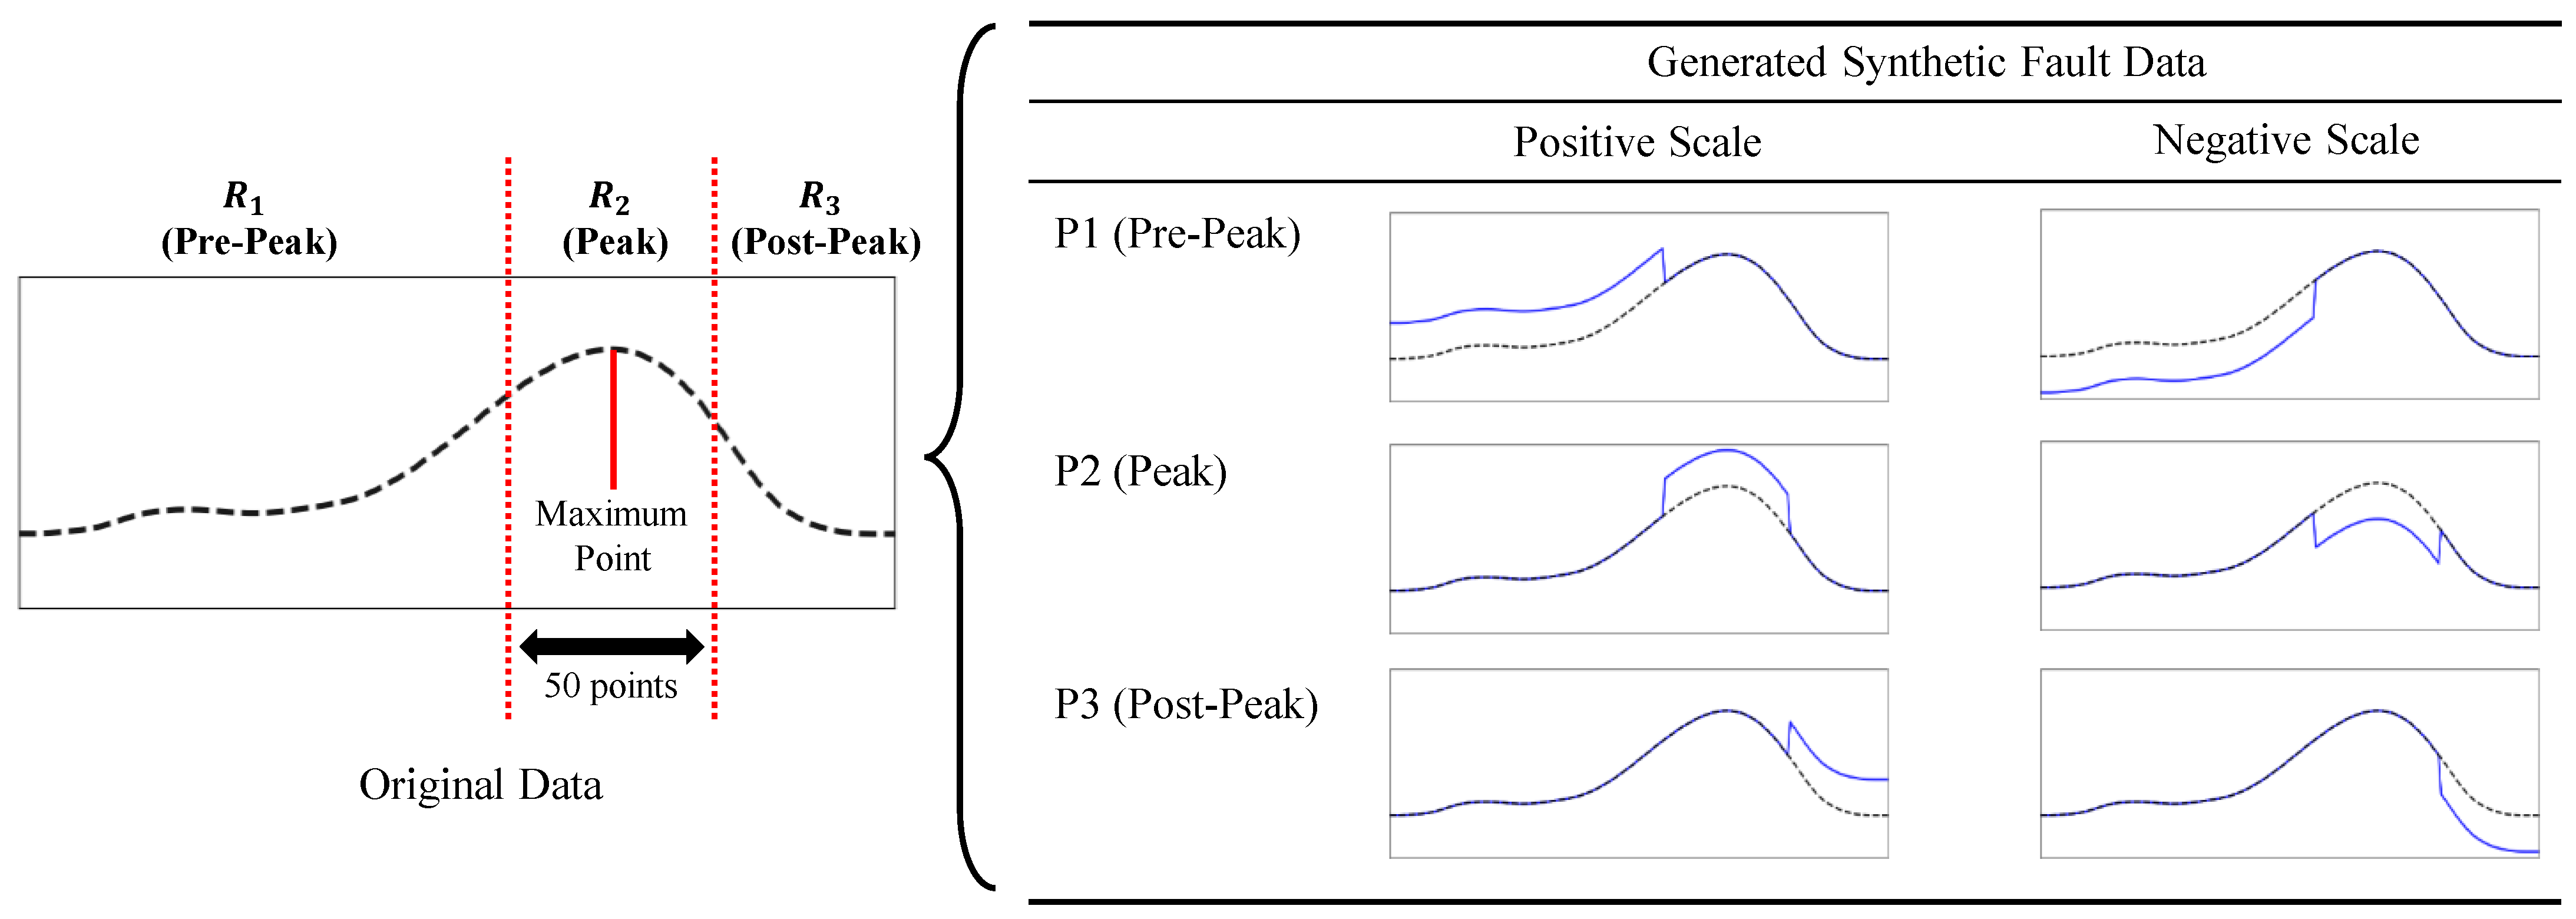
3.2.3. Regional Selective Data Scaling
Figure 3 shows the RSDS that this paper introduces to address these complexities as a strategy for generating synthetic abnormal data. The generated synthetic abnormal data can help to generalize AI models with few reference data. Rather than uniformly scaling the entire region, this approach divides the region into smaller sections and then selectively applies scaling. In this way, this approach addresses the challenges related to uniform scaling while also allowing for a more systematic simulation of various defect scenarios. RSDS plays a crucial role in creating synthetic abnormal data, allowing models to learn and adapt to different defect types, even when actual defective data are initially unavailable. In the context of wiring harness manufacturing, this approach involves strategically dividing the original dataset into three distinct regions, each representing a different phase in the data pattern:
(Pre-Peak),
(Peak), and
(Post-Peak). Positive and negative scalings are then applied to the regions based on the standard deviation of the normal dataset, yielding six distinct synthetic fault datasets and enriching the model’s learning spectrum. Using the standard deviation of normal data to scale synthetic faults ensures that they are distinct yet realistic enough for effective anomaly detection. The algorithm below delineates the specific implementation of this approach:
An algorithm designated for Regional Synthetic Fault Data Generation was developed to fabricate synthetic data and labels corresponding to the original dataset
, which has standard deviation
. The Scaler
is initialized to the range
, serving as a modifier to create defectives in the dataset. Introducing a multiplicative factor
allows for the adjustment of this scaling to tailor the model’s sensitivity to the specificities of the manufacturing process. The algorithm partitions the data into three distinct regions,
, based on the maximum index
, each with a specific range. It systematically traverses each scaler
in
and each region
in
, adjusting the data within the specified region by
and accumulating the altered datasets and corresponding labels in
and
, respectively. Each synthetic label,
, is calculated as
, representing specific fault types, and is paired with its corresponding synthetic data instance in the final output. The algorithm returns a synthetic abnormal dataset with labels, which can enhance the robustness of subsequent analyses and models (Algorithm 1).
| Algorithm 1. Regional Selective Data Scaling |
|
|
|
|
|
|
| do |
| do |
|
| //Scale the data |
|
| //Create the label |
|
| 13: end for |
| 14: end for |
|
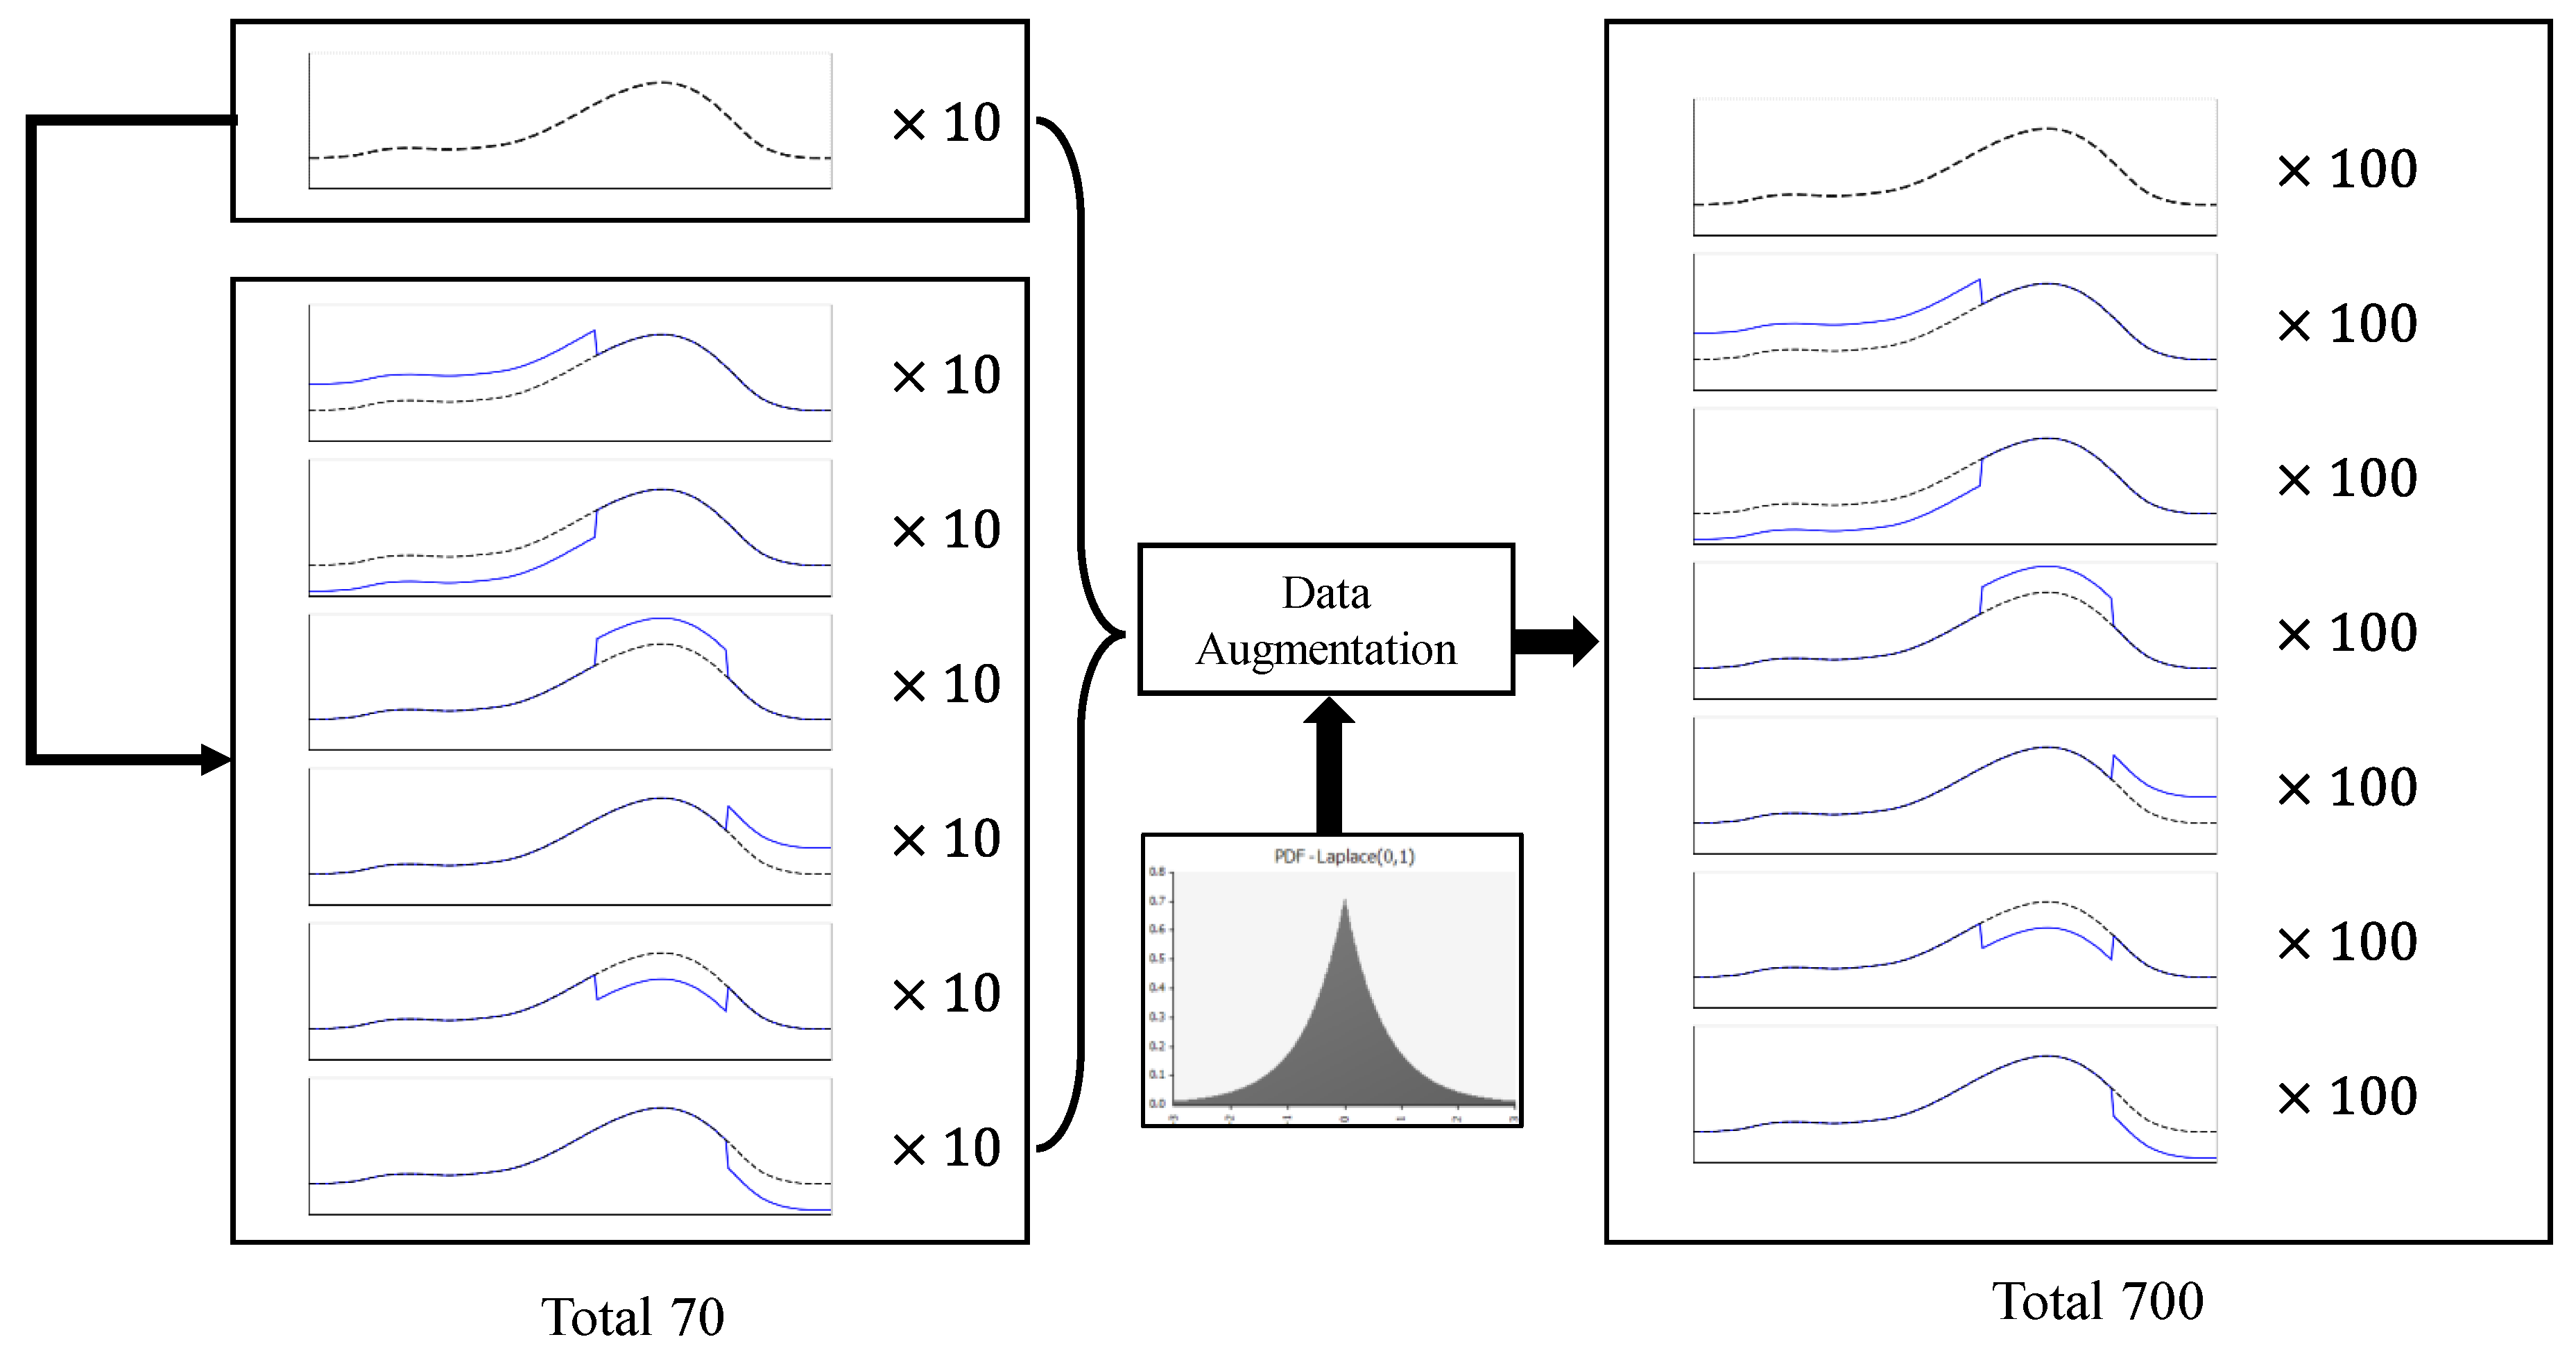
3.2.4. Data Augmentation
Given the outlined strategy for synthetic abnormal data generation, addressing the intrinsic data imbalance, notably with respect to abnormal data, is paramount. Merely replicating synthetic abnormal data might expand the dataset size but does not introduce the necessary variability for the MLP learning process. This could potentially disrupt the model’s learning during training as, due to the homogeneity of the presented data, the gradient descent might find itself trapped in local minima. Thus, complexity must be imposed upon the training dataset, ensuring quantity, quality, and diversity in the data to facilitate a more sophisticated learning mechanism. To meet this requirement, a data augmentation technique is implemented by introducing noise from the Laplace distribution:
where
and
denote the location and scale parameters, respectively, offering an effective approach to data augmentation due to its unique double-exponential nature. In contrast to the Gaussian distribution, the chosen Laplace distribution has sharper peaks and heavier tails, resulting in noise that is both localized and extreme. This generates a wider range of diverse and challenging samples. In the experimental setup, we set the location and scale parameters to 0 and 1.0, respectively. This location choice aligns the peak of the Laplace distribution with the mean of the original data, while the scale parameter ensures a balanced dispersion of the generated noise. This balance maintains the fundamental shape of the original data.
4. Results and Discussion
4.1. Results and Analysis
To validate the proposed fault detection system, a total of fifteen datasets, obtained from the manufacturing process of wiring harness crimping, were subjected to testing. The datasets utilized in this study were obtained from an actual manufacturing facility and were collected over a period spanning from 19 April to 8 May 2023. Within the dataset, there are a total of 24,249 entries, with 24,152 entries classified as “Good” and 97 entries classified as “Bad”. The CFM system facilitated the labeling process, thereby eliminating the requirement for labor-intensive and expensive manual labeling. It is important to highlight that while our AI model’s findings were not directly compared to the results of the CFM, the data annotated by the CFM proved to be extremely valuable for the purpose of testing our AI model. The CFM system exhibits a commendable level of accuracy; however, it is not exempt from potential errors. The labels obtained from CFM can be considered reliable with a confidence level of 99%, allowing for a minimal 1% possibility of inconsistencies.
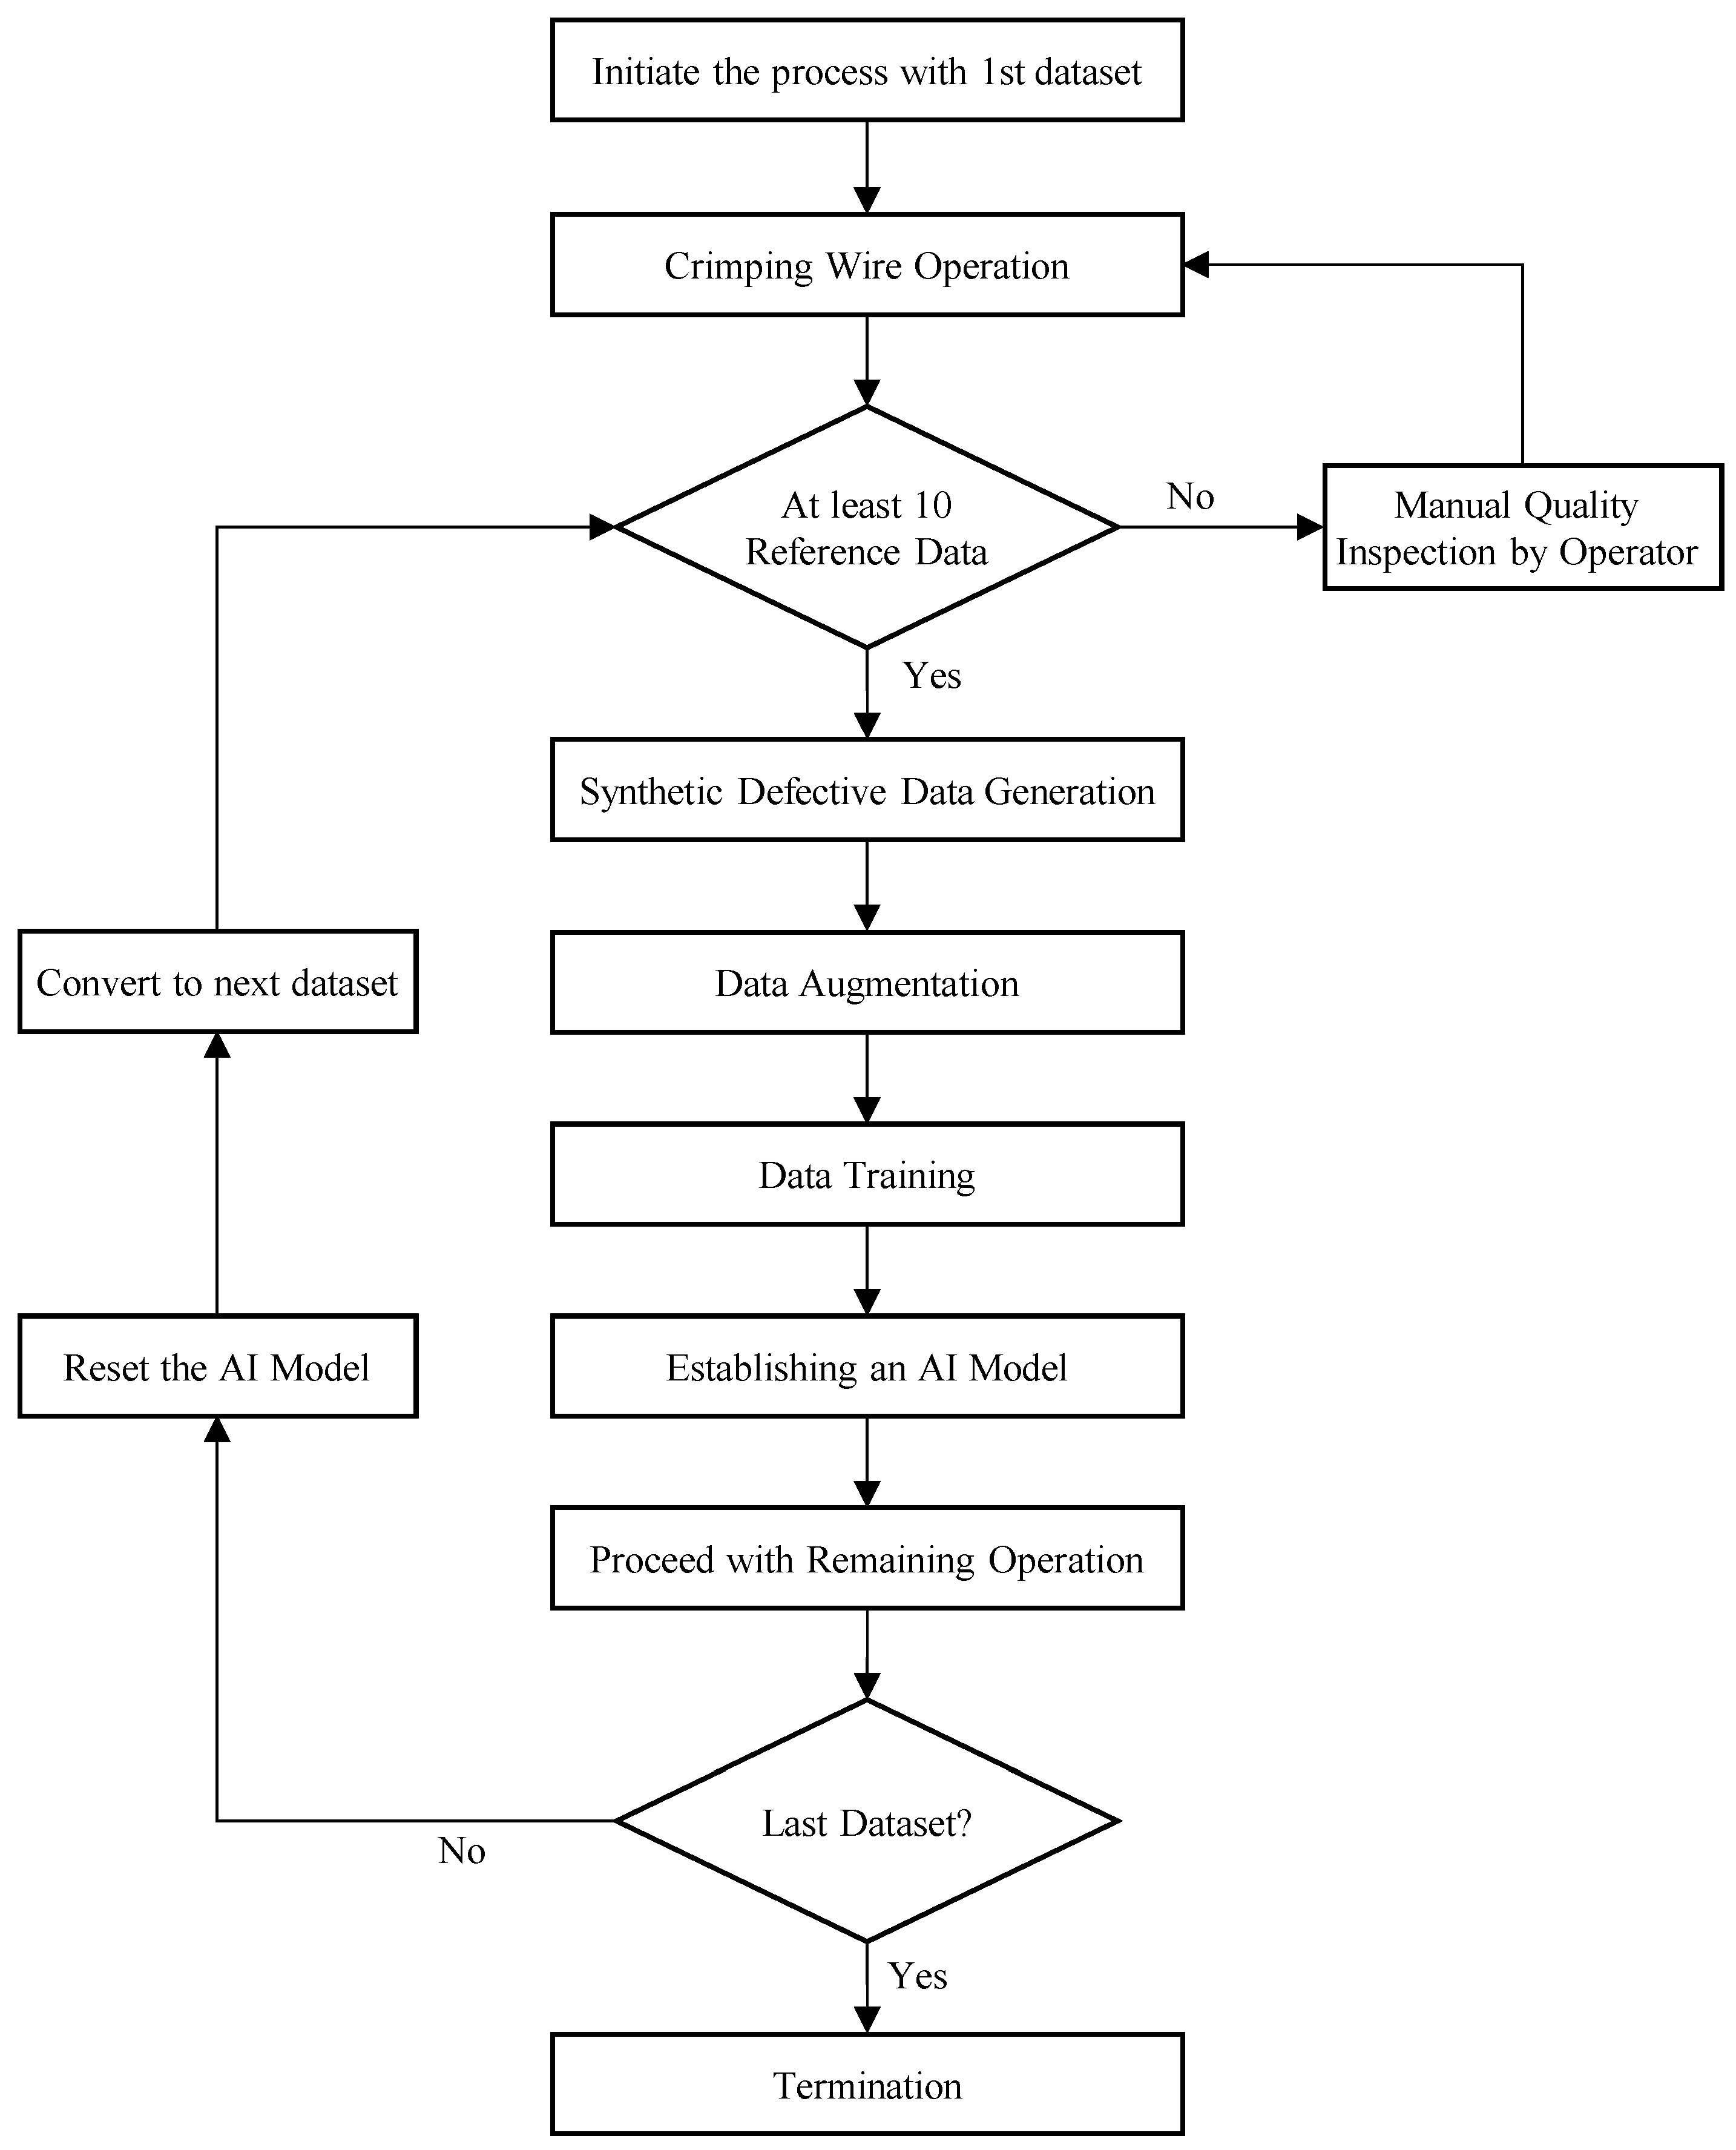
The experiments were conducted in a specific scenario to simulate real-world manufacturing.
Figure 4 depicts the manufacturing process, where the fault detection system analyzes each dataset sequentially. At the start, the system begins the process with the initial dataset and assesses the availability of at least ten reference data. It is assumed that the collection and assessment of reference data is performed manually by an operator. However, in the experimental setup, the first ten data from the normal label are utilized to simplify the experimental processes. After generating synthetic abnormal data from the reference data, an AI model is established in the following stage. If the system processes all the remaining data, it resets the AI model and moves on to the next dataset, until it processes the last dataset. This approach ensures that each dataset is paired with a dedicated AI model that is carefully calibrated to match its unique characteristics.
In the experiments conducted, the Python programming language was utilized along with the MLPclassifier library from sklearn to establish the AI model and evaluate the data. As seen in
Figure 5 above, a total of 60 datasets were generated from the ten reference data. These datasets were subsequently expanded to 700 datasets using data augmentation techniques. From the creation of six defective types, seven classes of labels were accordingly established, including the normal class. The training data consisted of a total of 770 fully labeled datasets, each classified into one of the seven classes. It is worth noting that only 10 out of the 770 datasets were original reference data. To maintain consistency in normalization, the MinMax scaler was employed. After scaling, the data were used to train a multilayer perceptron (MLP) model with 200 input neurons and two hidden layers consisting of 64 and 32 neurons, respectively. The model utilized the ReLU activation function and the “adam” optimization algorithm. An “adaptive” learning rate was employed, with the maximum iteration set at 500. For the evaluation, we chose accuracy and the True-Negative Rate (TNR) as the main metrics. Accuracy provides a comprehensive assessment of the model’s performance, whereas the TNR specifically evaluates the system’s proficiency in identifying defective items, a critical aspect in the domain of manufacturing quality control. The equations for accuracy and the TNR are as follow, where True-Positive is
, True-Negative is
, False-Positive is
, and False-Negative is
:
For comparative analysis, we utilized four well-known anomaly detection algorithms to evaluate their effectiveness in detecting defects: Isolation Forest, Autoencoder, k-means, and the Histogram-Based Outlier Score (HBOS). The Isolation Forest algorithm utilizes tree structures to effectively identify anomalies by focusing on shorter paths in comparison to normal instances. To optimize the performance of the Isolation Forest algorithm, we conducted a grid search to determine the most suitable hyperparameters. The k-means clustering algorithm, a commonly used unsupervised method in data analysis, was employed to partition the dataset into distinct clusters. In this approach, data points were flagged as anomalies if their distance to the cluster center exceeded a predetermined threshold set at the 95th percentile. Additionally, we implemented an Autoencoder, a neural network architecture that is renowned for its ability to perform dimensionality reduction. Anomalies were detected by assessing reconstruction errors that were significantly higher than the threshold set at the 95th percentile of training errors. Finally, the study utilized the HBOS, a convenient unsupervised technique that calculates outlier scores based on data distributions in a multi-dimensional space. Our selection comprised a range of methodologies, selected for their widespread use, effectiveness, and inclusion of diverse anomaly detection techniques. To maintain a controlled environment, the first ten data with a normal label were used as reference data for all algorithms. The table below shows the results.
4.2. Discussion
Table 2 and
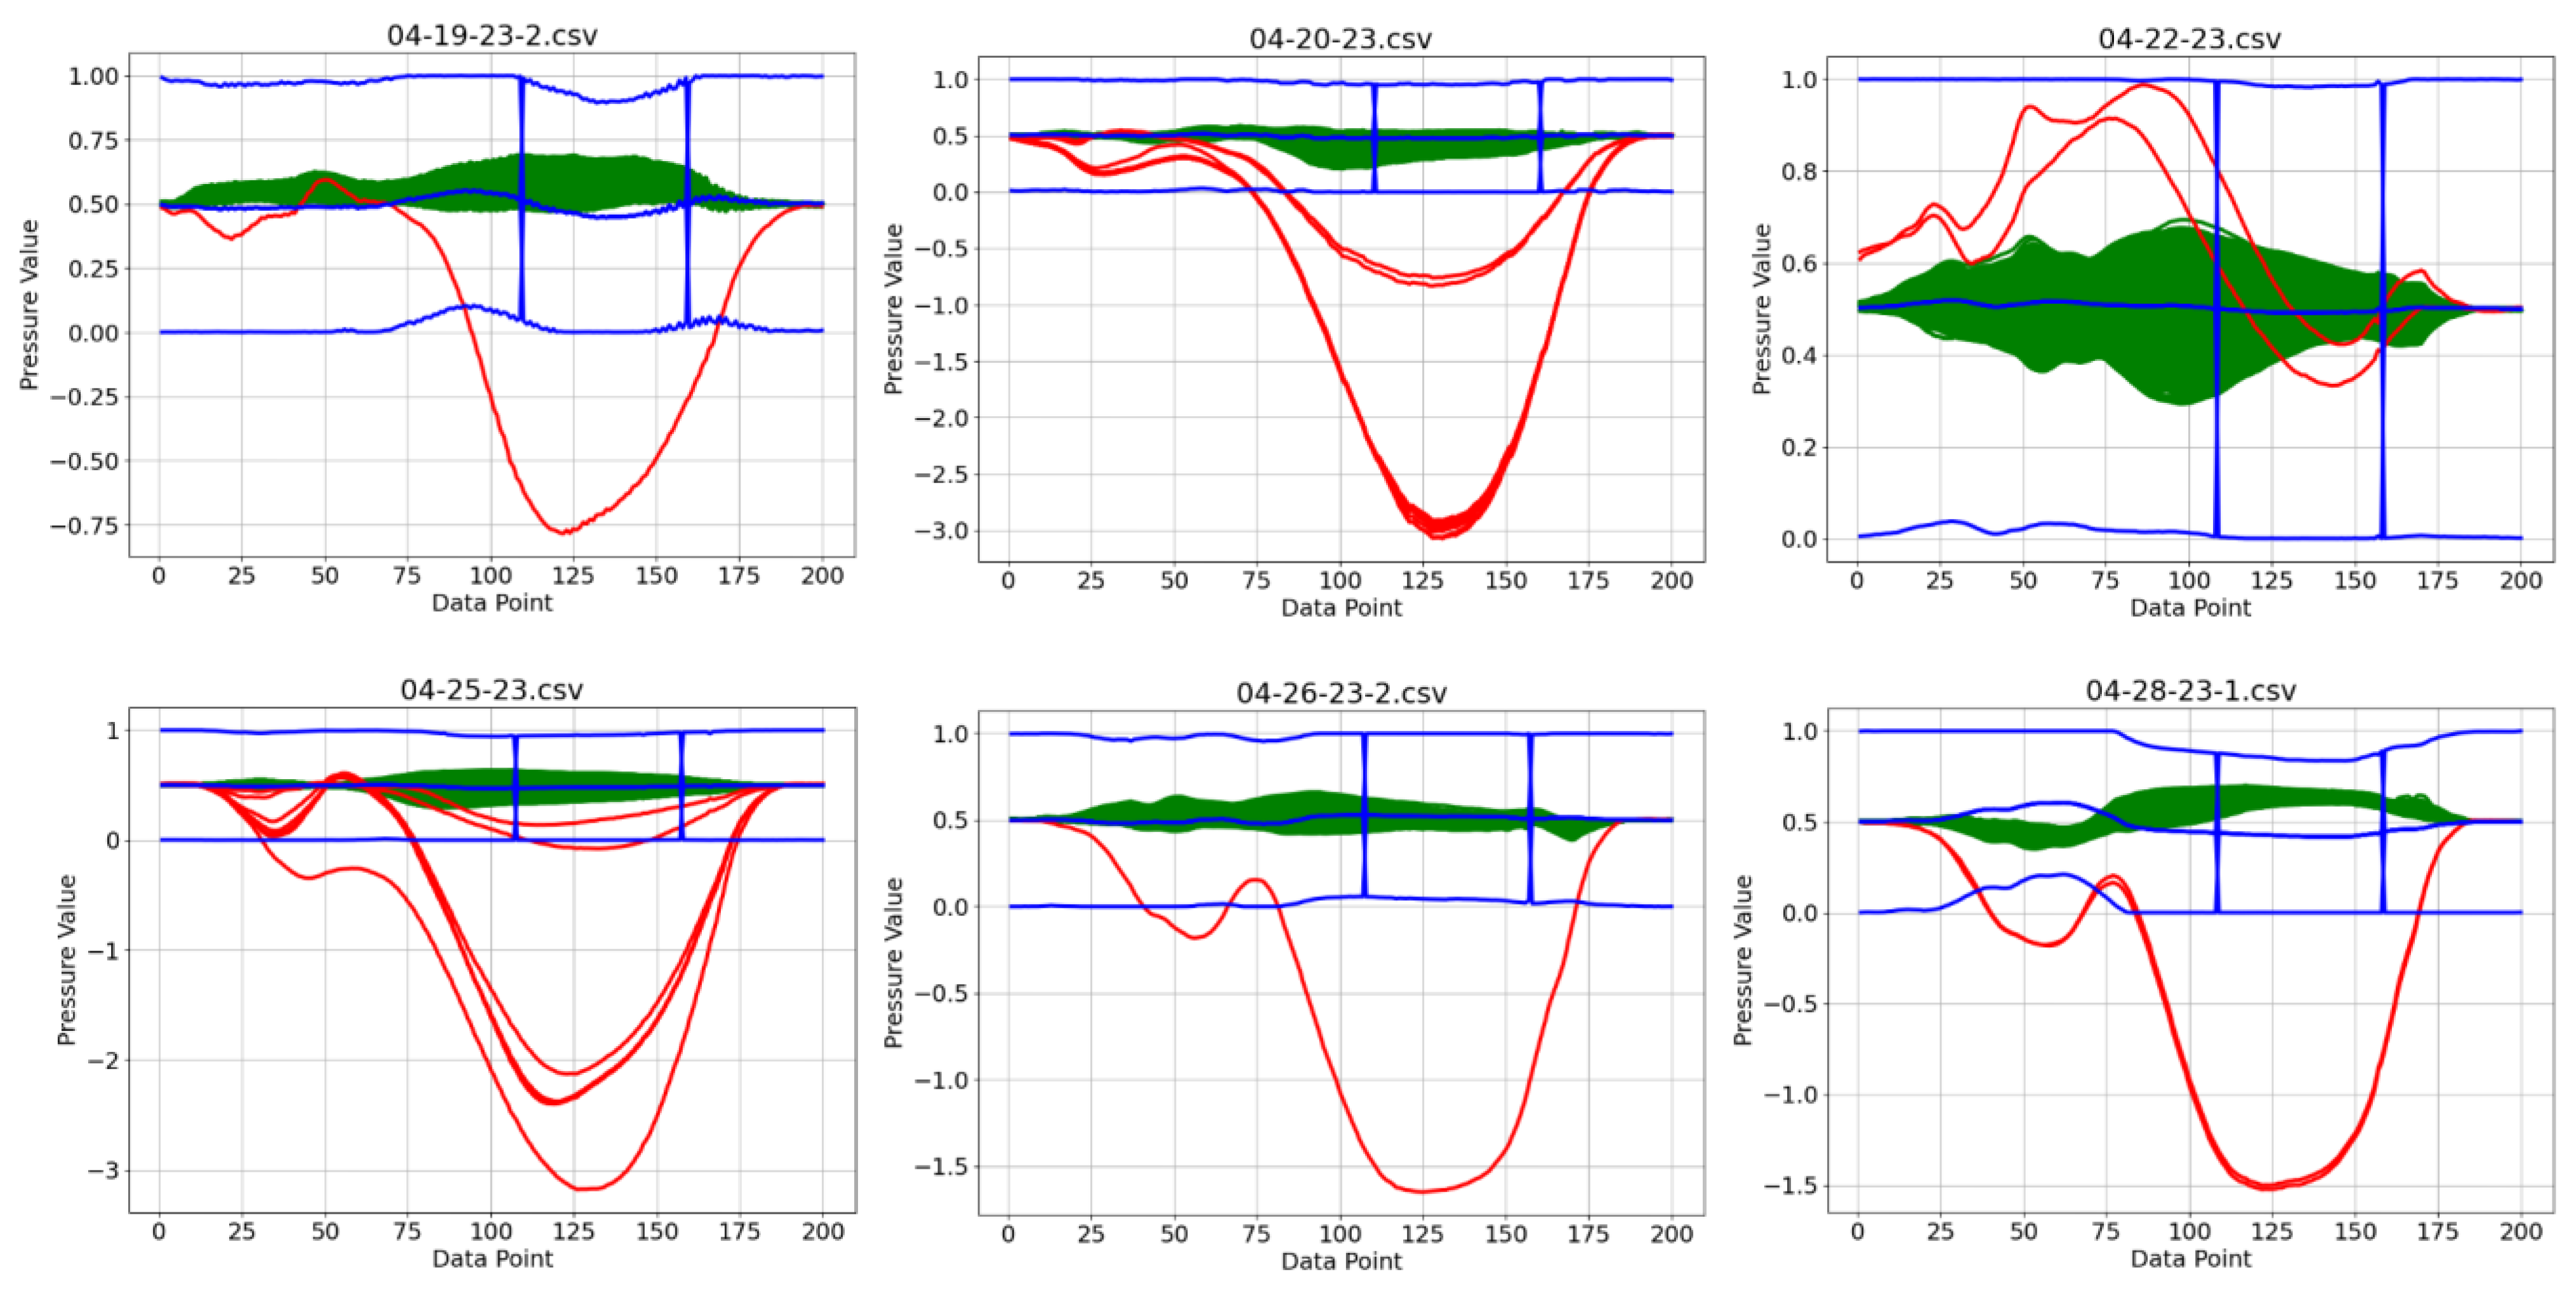
Figure 6 provide the performance details of the five fault detection algorithms. The proposed system is notable for its exceptional average accuracy of 99.95%. Its TNR stood at 85.72%, demonstrating its high sensitivity in detecting anomalies. The HBOS demonstrated an impressive accuracy rate of 99.56%. However, the TNR of 0% across all datasets indicates potential overfitting and a lack of effectiveness in detecting anomalies. The k-means algorithm, with 95.39% accuracy and 93.44% TNR, presents concerns in manufacturing contexts. Although its accuracy is close to the proposed system’s accuracy of 99.95%, in a test set of 24,152 normal data, this difference implies a substantial number of misclassifications, which is critical in terms of manufacturing practices. Moreover, while the k-means’ TNR seems better than the proposed system’s TNR of 85.72%, the small sample size of true and false negatives (only 97) suggests that the apparent advantage may not be significant. The results for the Isolation Forest and Autoencoder algorithms indicate a case of anti-fitting. Specifically, the Isolation Forest showed an average accuracy of 40.42% paired with a TNR of 96.0%, while the Autoencoder achieved an average accuracy of 68.92% with a TNR of 100.00%. In summary, the proposed system’s performance demonstrates impressive accuracy and high TNR value. A visualization of prediction results was prepared to help us understand how RSDS enables the establishment of models with only ten training data.
Figure 7 displays six representative prediction results, all accurately classified. The model accurately identified defects of different sizes and shapes. This effectiveness comes from an AI model that was calibrated using ten standard samples. The representativeness of the initial ten samples was a matter of concern; if they did not adequately capture the diversity of the dataset, it could compromise the classification. This challenge was addressed by incorporating synthetic abnormal data into the MinMax scaler. With this integration, normal data tend to converge toward a midpoint value of 0.5, because the synthetic abnormal data are intentionally scaled to always exceed the magnitude of the normal data. Consequently, the range of reference data are expanded, making them more representative. It is important to mention that when excluding defective data from the MinMax scaler, the scaler’s inherent constraints can amplify its deviant attributes. To ensure comprehensive defect detection, it is crucial to establish a synthetic scaling threshold for RSDS that slightly exceeds normal data.
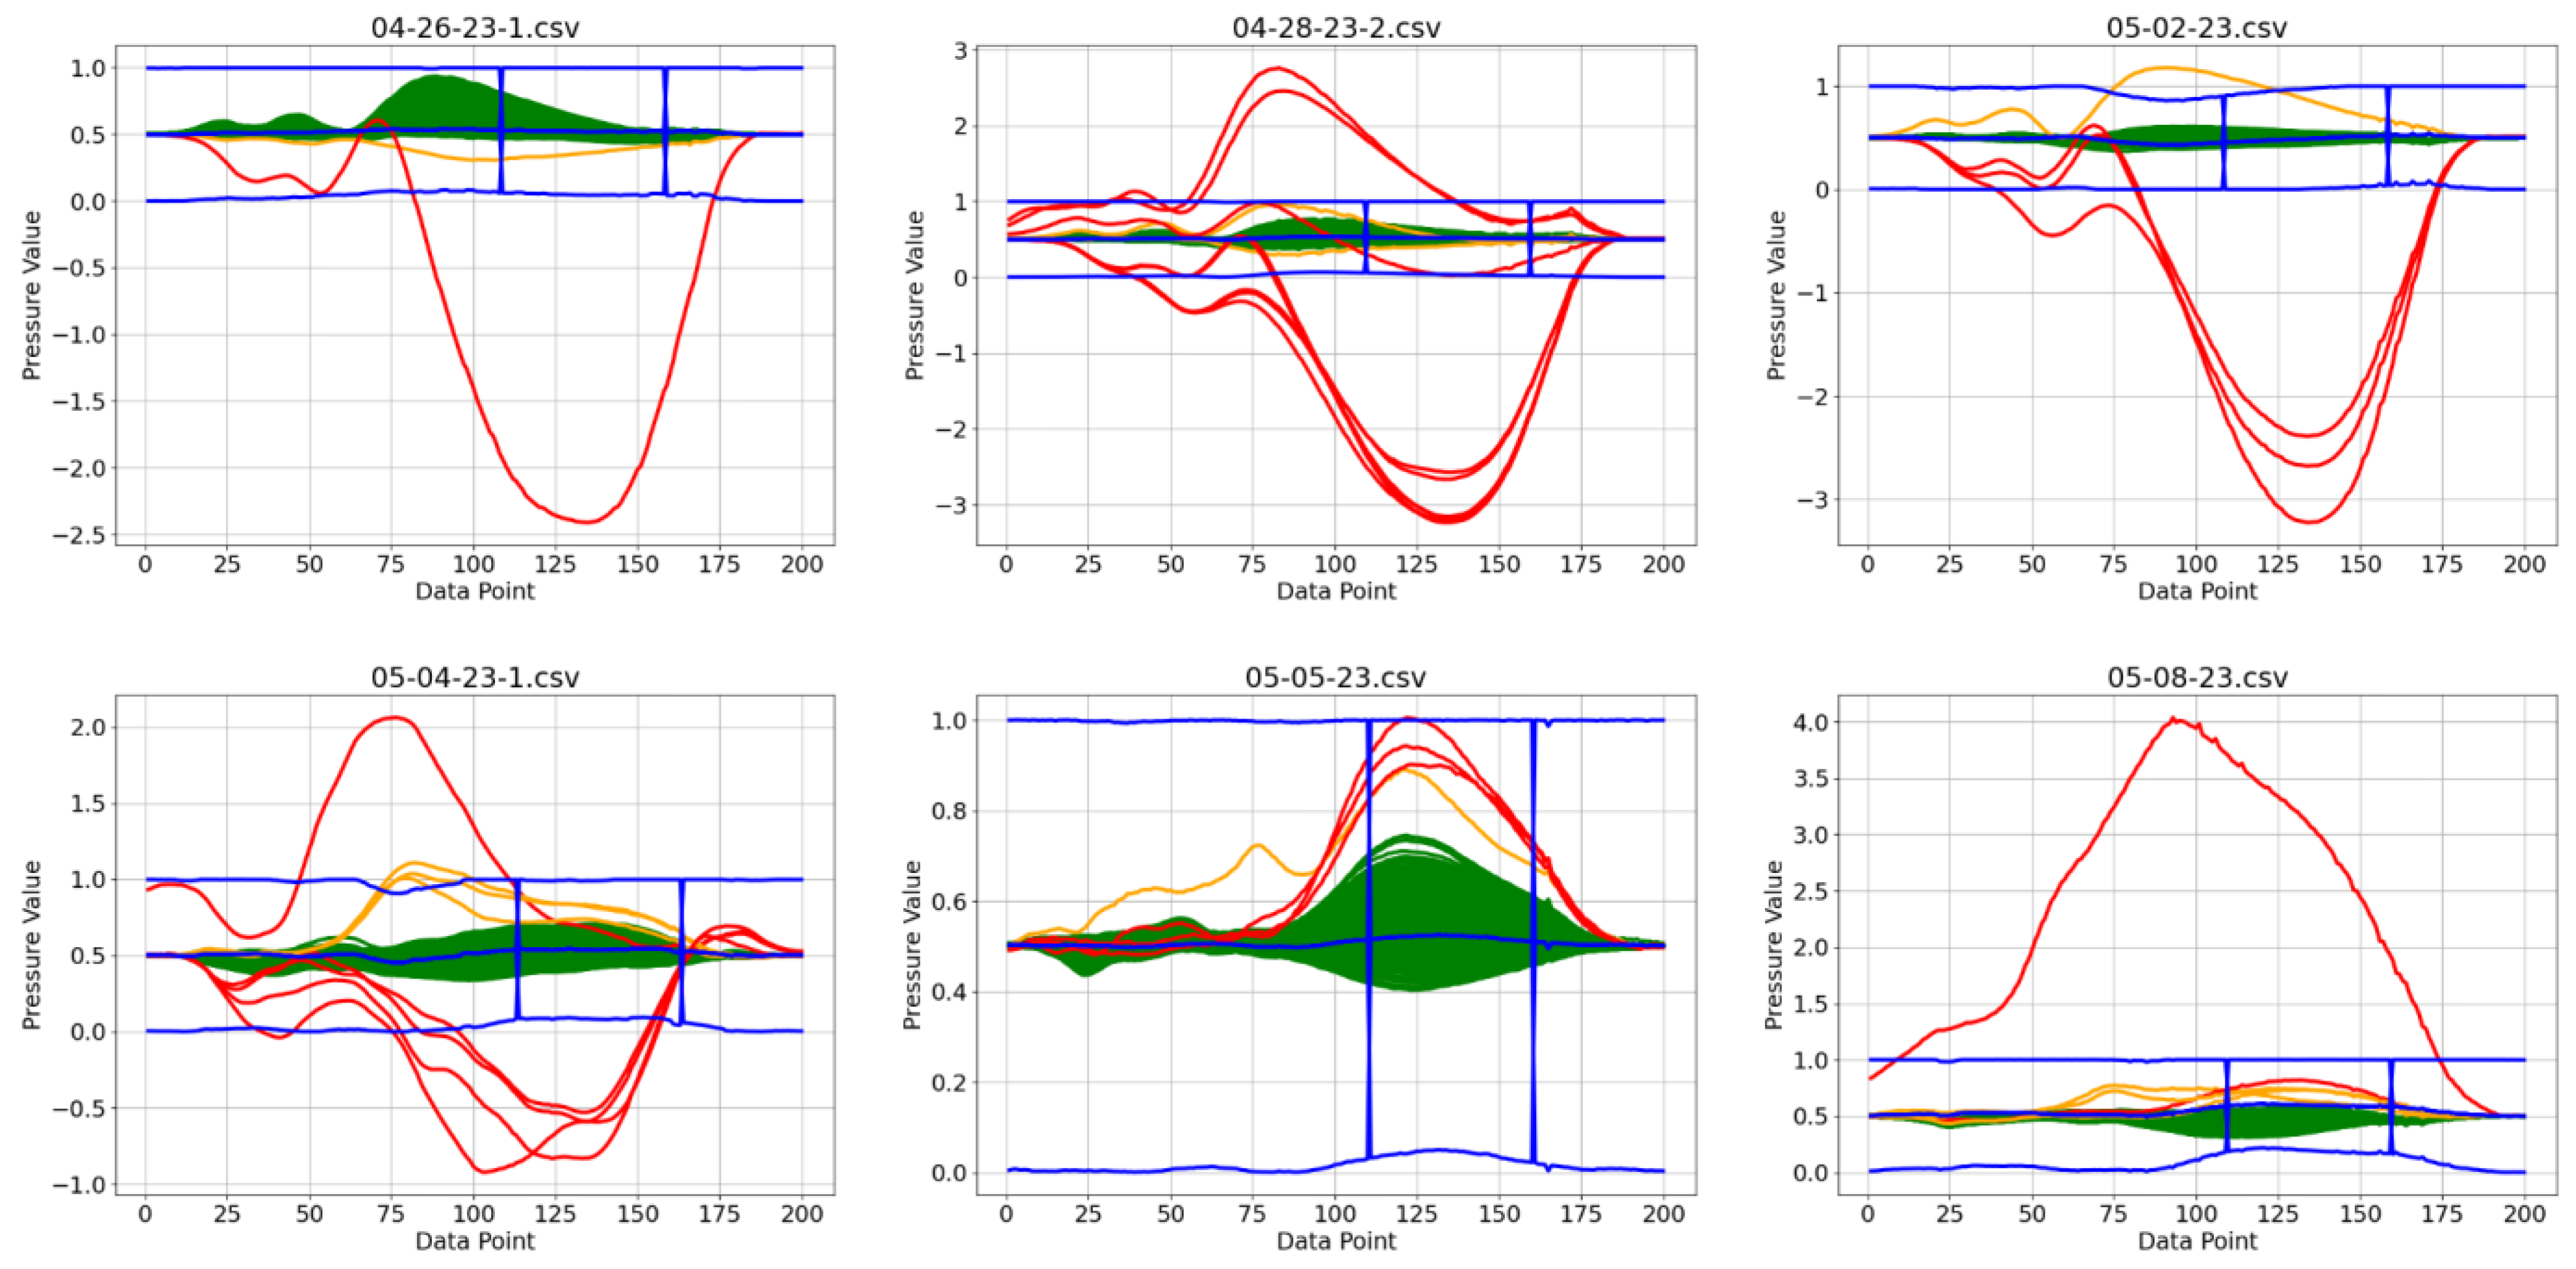
Our analysis of fifteen datasets displays six cases of
, as can be seen in
Figure 8. A consistent trend was observed, with these
s (orange color) often found in the intermediate range between normal data (green color) and synthetic abnormal data (blue color). The presence of this overlap suggests a potential ambiguity in the model’s perception, which could be attributed to the inadequate differentiation between synthetic and authentic data. To enhance the accuracy of our AI-based fault detection system in future research, the following key points can be considered: First, it is important to meticulously refine the RSDS process, especially in the context of its potential expansion or adaptation for broader manufacturing settings. Second, exploring more advanced methodologies may mitigate the occurrence of
. A reassessment of our methodologies for extracting features could potentially offer a clearer distinction between different categories of data. In this case, we can also compare our model’s performance with CFM. Lastly, the integration of continual learning mechanisms has the potential to enhance the adaptability of the model and improve the realism of our synthetic data generation.
5. Conclusions
Our study presents a concrete and systematic approach to improving quality control in wiring harness crimping manufacturing by integrating RSDS with AI. This approach utilizes the distinctive capability of RSDS to generate synthetic abnormal data, effectively addressing the challenge of having only limited labeled datasets available for robust AI training. The experimentation conducted on authentic industrial datasets demonstrated both a promising alternative to CFM and its advantage over traditional anomaly detection algorithms. Additionally, the practical implications of this system in a real production environment are significant, offering enhanced quality control and efficient integration into existing manufacturing processes. This suggests that the integration of AI can help improve manufacturing quality control. Based on the compelling findings of this study, there is significant potential for further exploration in this field. Adopting these methodologies may facilitate deeper insights, promoting the development of more efficient, adaptable, and accurate quality control systems. However, a limitation of this research is its reliance on specific conditions and datasets, which may not fully represent the diverse scenarios encountered in broader manufacturing contexts. Therefore, future research could further refine this approach by exploring the scalability of RSDS in larger manufacturing contexts or examining its compatibility with other emerging AI techniques.


