
Option Pricing under a Generalized Black–Scholes Model with Stochastic Interest Rates, Stochastic Strings, and Lévy Jumps


1
Department of Economics, IES Francisco Ayala, 18014 Granada, Spain
2
Department of Finance, University of North Carolina at Charlotte, 9201 University City Blvd., Charlotte, NC 28223-0001, USA
*
Author to whom correspondence should be addressed.
Mathematics 2024, 12(1), 82; https://doi.org/10.3390/math12010082
Submission received: 16 November 2023
/
Revised: 13 December 2023
/
Accepted: 20 December 2023
/
Published: 26 December 2023
(This article belongs to the Special Issue Financial Mathematics and Applications)
Abstract
:We introduce a novel option pricing model that features stochastic interest rates along with an underlying price process driven by stochastic string shocks combined with pure jump Lévy processes. Substituting the Brownian motion in the Black–Scholes model with a stochastic string leads to a class of option pricing models with expiration-dependent volatility. Further extending this Generalized Black–Scholes (GBS) model by adding Lévy jumps to the returns generating processes results in a new framework generalizing all exponential Lévy models. We derive four distinct versions of the model, with each case featuring a different jump process: the finite activity lognormal and double–exponential jump diffusions, as well as the infinite activity CGMY process and generalized hyperbolic Lévy motion. In each case, we obtain closed or semi-closed form expressions for European call option prices which generalize the results obtained for the original models. Empirically, we evaluate the performance of our model against the skews of S&P 500 call options, considering three distinct volatility regimes. Our findings indicate that: (a) model performance is enhanced with the inclusion of jumps; (b) the GBS plus jumps model outperform the alternative models with the same jumps; (c) the GBS-CGMY jump model offers the best fit across volatility regimes.
1. Introduction
It is well documented that the Black–Scholes option pricing formula ([1]) is founded on several assumptions which, while simplifying, are frequently misaligned with empirical evidence. For instance, the constant risk-free interest rate assumption is not supported by the observed dynamics of market interest rates (enhancements to include stochastic interest rates in option pricing models are developed in [2,3]). Similarly, the assumption that underlying security prices follow geometric Brownian motions with constant volatility is challenged by the time- and strike-dependent volatilities implied by the Black–Scholes formula using market option prices.
However, financial practice has devised an accommodation in the form of the volatility surface that allows the Black–Scholes formula to maintain a central role as a real-world modeling tool. The volatility surface for options on a given underlying security is a three-dimensional graph of the values of implied volatility, varying in the dimensions of moneyness and the expiration of the options ([4]). Given a volatility surface, if we consider a specific expiration, we obtain a graph of implied volatility as a function of moneyness, which turns out to be a convex curve called volatility smile or skew.
Subsequent studies have produced option pricing models that avoid certain simplifying assumptions of the Black–Scholes model in order to explain the behavior of volatility skews. Some of them introduce stochastic volatility ([5,6,7]), others include jumps ([8,9,10,11,12]), and a few models present both features ([13,14]).
Several studies in the financial econometrics literature have refined methodologies to disentangle jumps from continuous volatility in price trajectories, yielding robust evidence of jump discontinuities in equity prices ([15,16]). Indeed, one explanation for a non-constant volatility surface is that the Black–Scholes-implied volatilities include not only continuous volatility but also the effects of omitted risk factors such as jumps in the prices of underlying securities.
In [14], Bakshi, Cao, and Chen (BCC) derived an option pricing formula for a model that features stochastic volatility, stochastic interest rates, and random jumps in the stock price process. The BCC model nests many of the closed-form option pricing formulas in the literature and thus serves well as a benchmark for the comparative evaluation of option pricing models. Their findings suggest that the configuration featuring both stochastic volatility and jumps (the so-called SVJ) outperforms all other specifications nested in the BCC framework, with the traditional Black–Scholes model ranking least favorably.
In a recent paper, Ref. [17] introduces a novel generalization of the Black–Scholes model incorporating stochastic interest rates and stochastic string shocks ([18,19]). Termed the generalized Black and Scholes (GBS) model, this new framework yields a Black–Scholes-like formula for European call option prices in which volatility is a function of the expiration times of underlying options. Such a specification offers an explanation for the variability of implied volatilities in the dimension of option expiry, the so-called term structure of implied volatilities.
The effect of option expiration times on underlying price dynamics is motivated in [17] by the “pin risk” phenomenon, in which underlying volatility is accentuated in proximity to the strike price as expiration looms. Recent empirical research on the nascent zero-day-to-expiry options market sheds additional light on this mechanism. In [20], evidence is presented that an increment in the trading volume of zero-day-to-expiry options results in an increase in the volatility of the underlying. This finding lends support to the existence of a feedback mechanism whereby trading in options affects the underlying volatility. The introduction of stochastic string shocks in the GBS model allows for the expiration times of options to be explicitly incorporated in the underlying dynamics.
Given this backdrop, our paper contributes to the debate on the necessity of stochastic volatility in option pricing models to account for observed option skews. Could a model combining expiration-dependent volatility with random jumps in the underlying price outperform a model with stochastic volatility and random jumps? To investigate this question, we extend the GBS model by incorporating pure jump Lévy processes into the stochastic string-driven price dynamics, thereby relaxing the three most contentious assumptions of the Black–Scholes model: constant volatility, static interest rates, and continuous sample paths.
Note that our model cannot be embedded into the framework of [14], since they use the Brownian motion as the source of continuous risk in the price processes, whereas our model is based on stochastic string processes, which are more general and, in fact, subsume Brownian motion as a particular case. Moreover, our model is not limited to compound Poisson jumps with lognormal distributions; instead, it is versatile enough to accommodate any pure jump Lévy process.
In order to determine which type of jump best captures observed discontinuities in observed security prices, we study four different examples of pure-jump Lévy processes used in the option pricing literature: compound Poisson processes with lognormally (LN) distributed jumps ([8]) and with a double-exponential (DE) distribution of jumps ([9]), generalized hyperbolic Lévy motion (GHLM) ([11]), and CGMY ([10]). First, we obtain closed or semi-closed form expressions for European call option prices under each type of jump, and verify the coherence with their established Brownian and no-jump benchmarks. Subsequently, we conduct the in-sample empirical comparisons of our extended GBS model against a suite of alternative models, both with and without jump components. The competing models are Black–Scholes and Heston, and their respective extensions include LN jumps, which correspond, respectively, to [8] and to the SVJ model in [14]. We also include in the comparison the pure jump models used. To check the robustness of our approach, we perform the comparison under three distinct historical volatility regimes.
Our results show that the GBS model augmented with CGMY jumps outperforms the alternative models (with or without jumps), except in the high volatility scenario in which the Heston model with jumps (SVJ) performs better, albeit at the cost of estimating one additional parameter. Nevertheless, when we compare the SVJ model with a GBS plus CGMY model with the same number of parameters, we find that the latter provides the best fit.
The remainder of the paper is structured as follows. Section presents the mathematical prerequisites for the rest of this paper: stochastic string and Lévy processes, and the GBS model. Section 3 explores the mathematical characteristics of the processes we are working with, which are special semi-martingales, but not Lévy processes in general. Section 4 leads to the general expression for the underlying dynamics under the GBS model with jumps. Section 5 contains the results related to option pricing with the GBS model with the four different types of jumps. Section 6 develops the main characteristics and results of the models alternative to GBS in the empirical tests. Section 7 includes the calibration results of all competing models. Section 8 summarizes and concludes.
2. Preliminaries
In this section, we recall definitions and briefly summarize relevant facts about the GBS model, stochastic strings, and Lévy processes that we will use in this paper. For stochastic string processes, the main references are [18,19]. The GBS model was introduced in [17]. For Lévy processes, there are many excellent references, including [21] (Chapter 1).
Let be a filtered probability space. The specific form of the filtration will be determined later, and we consider that , where is the finite time horizon. We will assume the existence of risk-free security, , whose evolution satisfies , , where is the stochastic risk-free rate. In order to preclude arbitrage opportunities, we will also assume the existence of a probability measure , equivalent to , such that asset prices discounted with are -martingales. We will call this measure the equivalent martingale measure.
2.1. Stochastic String Processes
A stochastic string process is an infinite-dimensional stochastic process (or random field) consisting of a continuum of adapted stochastic processes indexed by a (second) time parameter, x. Specifically,
where . Henceforth, we will drop the explicit mention of the dependence on .
The stochastic string process Z is assumed to satisfy the following properties:
- (a)
- The stochastic processes and are continuous for each and for each , respectively.
- (b)
- The process is a martingale for each .
- (c)
- The process is differentiable for each .
- (d)
- For each , it is the case that
where is an admissible, continuous, and differentiable correlation function for each t. Here, admissibility means that for each t, is symmetric, positive semidefinite, and satisfies and ([18]).
Properties (a), (b), and (d), jointly with Lévy’s Theorem guarantee that, for each , the process is a Brownian motion.
2.2. The Generalized Black–Scholes Model
Stochastic string processes are used in [17] to obtain a generalization of the Black–Scholes model that accounts for volatilities dependent on option expirations and stochastic interest rates. Concretely, the no-arbitrage dynamics for the discounted underlying, is given by
where is the stochastic string volatility and is a stochastic string process under . The parameter u should be interpreted as representing times until the expiration of options written on the underlying stock. In the case in which there are no options written on the stock, we have , where is the Dirac delta, recovering Merton’s model [2]. If we go further and make and , Equation (2) reduces to the Black–Scholes dynamics [1].
From Equation (2), the explicit expression for the discounted stock price at time is obtained as
where we have defined .
Taking into account the definitions
the previous expression for can be rewritten in a more compact form as
In order to obtain a closed-form expression for a call option price, [17] introduces the additional assumptions of Gaussian interest rates, the deterministic term-structure of volatilities and correlations, and the independence of interest rates and discounted stock prices. Under these assumptions, we have that is deterministic, and that
and
under on .
With these assumptions, the time t price of a European call option with maturity T and strike K on the underlying S, is obtained as
where is the price, at time t, of a zero-coupon bond maturing at T, and
with
Under constant interest rates, , we have the same Equation (6), but with and replaced by and given by
Moreover, assuming that can be written as a power series of , the call option price can be obtained by modifying the Black–Scholes option pricing formula so that the constant volatility parameter is replaced by the following deterministic function for the term-structure of volatility
where is the time until option expiration, and and the are constants.
2.3. Lévy Processes
A real-valued stochastic process, , that is adapted to the filtration of the probability space is a Lévy process if
- ;
- For and , the random variables , , are independent (independent increments);
- For any , for all (stochastic continuity);
- Sample paths are right-continuous with left-limits (RCLL).
A number of interesting facts about the sample path behavior can be deduced from the definition of a Lévy process. For instance, the stochastic continuity implies that the probability of a jump at any fixed time in the future is 0. On any interval of finite length , the property that paths are RCLL implies that (1) the number of jumps is at most countably infinite, and (2) for fixed , there can be only finitely many jumps on with magnitudes greater than .
A Lévy process can be decomposed as the sum of a linear drift, a Brownian motion, and a jump process. The Lévy triple corresponding to these three parts, with being the drift rate, being the diffusion coefficient, and being a measure with support on such that , called a Lévy measure. Given a Lévy measure , it follows that for all , . Thus, a probability measure can be defined by restricting and normalizing so that total mass is 1, that is,
If , then (since has no mass at 0), and the Lévy process is said to have finite activity since sample paths of have only finitely many jumps on any closed interval . In this case, the jump part of is necessarily a compound Poisson process and , where is the arrival rate and F is the distribution function of the jump size. Alternatively, if is singular in some neighborhood of 0, then and the Lévy process is said to have infinite activity since the sample paths of almost surely have a countably infinite number of jumps on any closed interval .
By the Lévy-Khintchine Theorem, has characteristic exponent given by
where is a truncation function which is required in some cases when , depending on the behavior of near 0. The characteristic function of a Lévy process can be defined in terms of its characteristic exponent, . Thus, a Lévy process is completely determined by its characteristic exponent.
Now, we specialize to the case of a Lévy process, , with Lévy triple (no Brownian motion part). The Lévy–Itô decomposition of can be written as
where N is a Poisson random measure and is the product measure of Lebesgue measure, , and the Lévy measure, . The first jump term represents large jumps (arbitrarily defined as being in magnitude) and the second jump term represents small compensated jumps (with jumps of size 0 disallowed). The representation of in (8) corresponds to the truncation function .
The Lévy processes that we consider in this paper have finite first moments, that is, . In this case, the Lévy–Itô decomposition of can be written as
corresponding to . Here, the jump part with the compensator is a martingale. The integral in (9) cannot be split into two terms unless the jumps have finite variation, which is implied by . In this case, a truncation function is not needed for the process to be well defined. Thus, we can choose , , , or . In the case of , the jump process is uncompensated and (9) becomes
The and Lévy measure are invariant for a given Lévy process, and once an appropriate truncation function is chosen, the Lévy triple is unique. In this paper, we will follow the convention of offsetting through any changes to the linear drift due to compensating the jump process. That is, when we give Lévy triples for specific Lévy processes, the linear drift coefficient will be .
3. Combining Stochastic Strings and Jump Processes
A stochastic process on is called a semimartingale if it can be written
where is a process with RCLL sample paths of finite variation and is a local martingale. (a property is said to hold locally for a stochastic process X if there exists a sequence of stopping times such that, for all n, the stopped process has the property). A locally integrable semimartingale is called a special semimartingale, in which case a decomposition as in (11) exists with being a predictable process of finite variation. Moreover, the local martingale can be written as a sum of a continuous local martingale and a purely discontinuous local martingale. Thus, a special semimartingale has the decomposition
where , is a predictable process of finite variation, is a continuous local martingale, and is a local martingale orthogonal to all continuous local martingales.
Lévy processes are semimartingales and it is proven in [19] that stochastic integrals with respect to stochastic string processes are continuous martingales. Thus, if is the sum of a stochastic string integral and a Lévy process with Lévy triple and finite first moment, then it is a semimartingale. Moreover, such a process is a special semimartingale since it has decomposition as in (12) with
Special semimartingales with decompositions as in (13) are the focus of this paper. It is important to note that is not a Lévy process, in general, because the term with the stochastic integral does not appear in the Lévy–Itô decomposition. It only becomes a Lévy process in the particular case in which the stochastic string integral becomes a stochastic integral with respect to Brownian motion (see Section 2.2 ). Therefore, the results of our model can be seen as generalizations of all the (exponential) Lévy models.
It will be useful to state an Itô’s lemma for such special semimartingales. We first recall Itô’s lemma for a general one-dimensional semimartingale. This result can be found in [21] (Chapter 1).
Theorem 1.
Let be a semimartingale and a function. Then, the stochastic process is also a semimartingale and
To describe the dynamics of a one-dimensional process driven by a stochastic string, the inherent multidimensionality of the stochastic string must be recognized. For the semimartingale decomposition above, with
we have
In the case of the stochastic string plus a Lévy process with finite first moment, it can be shown that (14) becomes
4. Option Pricing with the Generalized Black and Scholes Model with Jumps
In this section, we specify the general form for the stochastic processes we will use to model underlying price dynamics. We posit two independent random processes in the underlying security price consisting of a stochastic string process and a Lévy process . The instantaneous interest rate is driven by a standard Brownian motion that is assumed to be independent of both the stochastic string and the Lévy process. The available information at any time is given by the filtration
We start by including the Lévy process in Expression (4) for the discounted underlying price of the GBS model in the form
where and is a deterministic term which accounts for the martingale property of . Applying this property, we have
from where we obtain . Replacing this value in (15), we obtain
which can be rewritten as
Equation (16) is the general expression for the price dynamics in our model.
5. Jump Processes
In this section, we present four specific cases of the Lévy jumps, in order to obtain different option pricing models. The first two are finite-activity Lévy processes, that is, compound Poisson processes, with lognormal ([8]) and double-exponential ([9]) distributions of jumps, respectively. The other two jump processes are Lévy processes of infinite activity: the generalized hyperbolic Lévy motion ([11]) and the CGMY process ([10]).
We will defer to Section 7 the numerical calculation of option prices through the characteristic function of Gaussian string plus jump dynamics.
5.1. Compound Poisson Process with Lognormal Jumps
Consider a compound Poisson process, , where is a Poisson process with parameter (the jump intensity) and are the jump sizes. The compound Poisson process has sample paths of bounded variation and its characteristic function is given by ([22], Proposition 3.4)
where f is the jump size distribution. In our case, as in [8], the jump sizes are i.i.d. with , and thus, we have
Replacing these expressions for the compound Poisson process in (16), we obtain
where , the Poisson process that counts the jumps of , is independent from r and Z, and the jump sizes, , are also independent from r, Z, and N.
Theorem 2.
The price, , of a European call option with payoff , is given by
where is the call option price of the GBS model, Equation (6), and
Proof.
By risk-neutral valuation, we have
Conditioning on the number of jumps between t and T, , we can write the option value as follows
where we have defined . Taking into account that and on under , and using standard calculations with lognormal random variables, we have
where we have taking into account that ([17], proof of Theorem 1). □
Corollary 1.
Proof.
The no-jumps case can be obtained by making , from where we obtain , , and then . The Black–Scholes case with jumps correspond to making the substitutions , and . From these changes, we obtain , , and . Replacing them in the expression of Theorem 2, we arrive at the call option price in the [8] model. □
5.2. Compound Poisson Process with Double-Exponential Jumps
In [9], a finite activity jump-diffusion model is presented in which the density function of the jump size is given by
In this case, the characteristic exponent of the jump process, , is given by
from which it follows that
Using this expression in Equation (16), we obtain
where
Theorem 3.
The price, , of a European call option with payoff , is given by
with
where , , and
for , , , , and for all
if and , and
if and , where is defined for by
and Φ is the cumulative distribution function of a standard normal random variable.
Proof.
The risk-neutral price of the option is given by
In order to obtain the first expectation, we need to work under the measure , defined by the Radon–Nikodym derivative . By Bayes formula, we have
Applying the Bayes formula again and using the martingale property of , it is not difficult to show that the inverse of the discounted price is a martingale under , namely . Replacing this in (18), we obtain
Now, to obtain the conditional probability, we need to work with expression (17) under . The stochastic string shock under a measure equivalent to , , is given by
with being a function that is determined by ([19], Lemma 4.8). Imposing that is a –martingale, it can be shown that and then
With this change, we can write , with , and Equation (17) reads
Applying the Bayes rule and the independence assumption, it can be shown that the conditional mean and variance of do not change under the measure . Moreover, under this same measure, . Thus, applying Proposition B.3 and Theorem B.1 in [9], we obtain .
For the second expectation, taking into account the properties of the T-forward measure, , we have
In order to obtain this last probability, we need to know the conditional distribution of under . From [19], we know that , where is the stochastic string shock under the T-forward measure. Replacing this equality in Equation (3), and then in (17), we obtain
where . Now, we need to study the behavior under of the terms in the exponential of (19), except for , which is deterministic, and , whose distribution is assumed to be the same, independent of the (equivalent) measure. Taking into account that is deterministic, we have that under on . In order to obtain the distribution of under that measure, we need to elaborate some more.
The dynamics of the discounted bond price in the stochastic string framework is given by ([19])
whose solution is
With these preliminaries, we can now explicitly find that , and the conditional expectation of under , as
where we have used Equation (20). On the other hand, from [17], we know that, for Gaussian models, we have . Solving for and replacing in the previous equation, we can identify , and write
Performing a similar calculation using Equation (21), we arrive at
Taking into account that, under our framework, conditional variances remain the same under a change of measure, we conclude that under on . The remaining term with the triple integral in (19) is equal to zero. To see this, considering (20) and the expression for , we can write
and
Taking conditional covariance and applying the conditional Itô isometry, after some calculations, we arrive at
which is zero by our independence assumption.
In summary, we have
and . Now, again applying Proposition B.3 and Theorem B.1 in [9], we arrive at , which concludes the proof. □
As in the case of lognormal jumps, we have the following consistency result.
Corollary 2.
Proof.
Working as in the proof of Corollary 1, in the no-jump case (), we obtain , , and then . For the Black–Scholes case with jumps, we had , , and . Replacing them in the expression of Theorem 3, we arrive at the call option price in the model of [9]. □
5.3. Generalized Hyperbolic Lévy Motion
The generalized hyperbolic Lévy motion is a Lévy process, , such that , the distribution of , has the density of a generalized hyperbolic distribution, , given by
where
and is the modified Bessel function of the third kind with index :
The parameter determines the shape, , with , denotes the skewness, denotes the location, is a scaling parameter, and characterizes certain subclasses. The value corresponds to the subclass of hyperbolic distributions, which was the first used in finance. When , we obtain the normal inverse Gaussian distribution, which has the gamma distribution as a special case ([11]).
The moment-generating function of the generalized hyperbolic distribution is given in ([11]) as
from which we obtain the characteristic function, , as . From this expression, for , we can easily obtain the characteristic exponent of the generalized hyperbolic Lévy motion as .
We know from the definition that is the density of , but does not have the same density and it has to be obtained from its characteristic function, by Fourier inversion (The exception is the case , for which we only have to make the substitutions and in the density ).
Denoting by the density function associated with , we can define, for each , a new density, , by
Under the corresponding probability, , the process is again a Lévy process, called the Esscher transform of the original process. We will choose the value of the parameter that makes an equivalent martingale measure. Taking into account Expression (16), we have
where is the moment generating function of . Taking into account that , and using Equation (23), we can rewrite the previous expression as
As this equality must hold for every , we arrive at the following equation that determines the value of :
Theorem 4.
The price, , of a European call option with pay-off , is given by
where
Proof.
The value of the call option, , is given by
For the first expectation, we obtain
where, in the third step, we have used that and under on , and in the last step, we used the equality .
For the second expectation:
Replacing both expectations in Equation (26), we obtain the desired result. □
Remark 1.
The consistency result in this case is as follows.
Corollary 3.
5.4. CGMY
In [10], an infinite activity pure-jump Lévy process called the CGMY process is introduced. This process has the Lévy measure given by
where , , , and . Its characteristic function is
from which we can obtain the characteristic exponent as
where is the gamma function. The CMGY process has Lévy–Itô decomposition given by
Using (27), we can rewrite Expression (16) for the CGMY process as
with
The parameters C, G, M, and Y determine the properties of the process ([10]). Specifically, G and M control the rate of exponential decay on the right and the left of the Lévy density, respectively. The parameter is a measure of the overall level of activity, and in the case of symmetric Lévy measure (), it determines the kurtosis of the distribution of the process. The parameter Y characterizes the fine structure of the stochastic process. For example, implies a completely monotone Lévy density, allowing large jumps to arrive less frequently than small jumps. When , we recover the variance gamma process, and if , the process has infinite activity and infinite variation.
In order to obtain a closed-form expression for the call option price under our model, we will follow [23], which, to the best of our knowledge, presents the unique closed-form solution of the CGMY model for European options. In the following theorem and proof, * denotes the convolution product.
Theorem 5.
The price, , of a European call option with payoff , is given by
where , , ,
and is the stable Lévy density given by
where is the H-function introduced in [24], and given by
with , or , ; ; and L is a suitable contour separating the poles of the gamma functions and (a detailed study of the H-function can be found in the references [25,26,27]).
Proof.
The call option value is given by
where and .
Making use of the Fourier transform of the payoff
we can write
By the independence assumption, we can factorize the expectation and calculate the expectation of each factor separately. For the first expectation, we have
For the second expectation, taking into account that under on , we obtain
The third expectation can be directly obtained as
For the fourth expectation, taking into account that under on , we obtain under on , and then
where we have used that, for Gaussian models, ([17]).
Replacing these expectations in (29), we have
where we have applied the convolution theorem for inverse Fourier transforms, and we defined , and .
For the two first inverse transforms, we obtain
and
where, for the first one, we have applied the shift theorem for inverse Fourier transforms. For the two remaining transforms, we apply Lemma 3.1 of [23] to obtain
and
With these inverse transforms, we can obtain explicitly the first convolution in (30) as
As in the previous examples of jump processes, we have a consistency result for stochastic strings plus CGMY jumps.
Corollary 4.
Proof.
The no jumps case is given by , and then and
Replacing these results in (28), and taking into account that , we arrive at the call option price in [17]. On the other hand, in the case of CGMY jumps and no diffusion part, we have , , , , ; and then, the two normal cumulative distribution functions in (28) tend to . Introducing all these changes in (28), we recover the call option price expression in [23]. □
6. Alternative Models
In this section, we present, for completeness, a brief summary of each of the benchmark models that will be used for comparison with our GBS plus jumps model. These models are the Merton jump-diffusion model and the Heston stochastic volatility model with jumps.
6.1. Merton Jump-Diffusion Model
Starting from the price dynamics of [1]
where the parameters and are constants, and is a standard Brownian motion under the physical probability measure , ref. [8] adds lognormally distributed jumps, so that
where is a Poisson process with parameter , and . Under , (34) becomes
where is the risk-free interest rate and is a Brownian motion under an equivalent martingale measure.
The solution to (35) is given by
and the price of a European call option with exercise price K and time-to-maturity is given by ([22])
where is the Black–Scholes price of a call option with the same strike, underlying price S, and volatility , , and .
The addition of jumps makes the model much more flexible and capable of capturing the skew and kurtosis observed in the empirical distributions of asset returns. The calibration of the Merton jump-diffusion model entails the estimation of four parameters (, , m, ).
6.2. Heston Model with Jumps
For the Heston stochastic volatility model with jumps, we have taken the stochastic volatility, stochastic interest rates and random jumps (SVSR-J) model of [14]. This model is an extension of the model in [7] with the addition of the CIR stochastic interest rates, and the compound Poisson jumps with the lognormal distribution of jump sizes. This model provides a semi-closed form expression for the price of a European call option, and generalizes most of the models with closed or semi-closed formulas for the option price.
The Heston model with jumps is defined by the following equations:
where:
- is the instantaneous variance of returns (conditional of no jumps occurring);
- and are standard -Brownian motions with ;
- is the percentage jump size (conditional on jump occurring), with ;
- is a Poisson jump counter with intensity ;
- , and are, respectively, the mean-reversion speed, the long-run mean, and the volatility coefficient of the variance process;
- , and are, respectively, the mean-reversion speed, the long-run mean, and the volatility coefficient of the risk-free interest rate process;
- is a -Brownian motion uncorrelated with any other process.
The time-t price of a European call option written on S, with strike price K, and time-to-maturity , , is given by
where the conditional probabilities and can be obtained from
and are the characteristic functions, whose explicit expression can be found in [14].
Setting , we recover the [7] model and, therefore, the Heston model with jumps generalizes the original Heston model to stochastic interest rates and jumps. Moreover, when , the Heston model with jumps reduces to the Merton jump-diffusion model. Nevertheless, we will keep on using the Merton model in order to assess the effect of introducing stochastic volatility.
In order to calibrate the Heston model with jumps (excluding the CIR model), we need to estimate eight parameters ().
7. Empirical Tests
Given the characteristic functions for underlying returns processes, a variety of Fourier transform techniques, such as those developed in [28] or [29], can be used to price European options. Under the assumption that , , and are mutually independent, we can calibrate a short-rate model for interest rates separately from the model for the returns of the underlying security, and then combine them when calculating option values. Specifically, we calibrate a CIR short-rate model using zero coupon bond (ZCB) yield curve data for each pricing date. Then, for each expiration, a constant yield-to-maturity (YTM) is implied from the calibrated ZCB price. Options are priced with the constant but expiration-dependent short-rate equal to the YTM. This is consistent with [14] in their SVJ case, but not with SVSR-J, which estimates the CIR parameters at the same time as the stock parameters. So our empirical study does not consider SR models, but rather models with constant but maturity-dependent interest rates estimated from an SR model. There are two main reasons for which we take this approach. First, estimating CIR and underlying stock parameters simultaneously adds three additional parameters to each optimization. Since our focus is on combining strings with jumps to model the dynamics of the underlying security, we prefer to keep the models as parsimonious as possible in order to focus on the marginal improvements achieved by changing the parameterizations of the underlying dynamics. Second, Ref. [14] finds little to no tangible improvement from including SR, either in their study of in-sample fit or in their study of hedging performance.
The characteristic function for the return process of the Gaussian string model under the –measure, , is given by
with , as defined in (7), and .
If is the characteristic function for under , then the characteristic function for the string plus jumps process is given by the product,
The price of a European call option can then be expressed as a Black–Scholes style formula as derived in [29]
where
and
7.1. The Carr and Madan Methods for Fourier Transform Pricing
In [28], Carr and Madan derive two Fourier transform pricing methods to be applied depending on the moneyness of the call option to be priced. For the in-the-money case, they begin with the following formula for the call option price
where and is the density function for . However, is not square-integrable, so they work with a dampened call price function
where . Now, the Fourier transform of exists and it can be shown that
For , is undefined at . Thus, must be nonzero. The call price can then be found by Fourier inversion
For pricing out-of-the money options, [28] proceeded as follows. If , define
which is the price of a call option if or the price of a put option if . Now, let be the Fourier transform of ,
The pricing formula follows after applying the Fourier inversion to
to obtain
In both moneyness cases, prices can be calculated easily using the fast Fourier transform and standard numerical integration procedures. Given the efficiency and accuracy of the Fourier methods developed in [28], we will use them to calculate option prices in the empirical part of this study.
7.2. Calibrating Models to Option Market Data
The calibration of option pricing models to market data constitutes a critical empirical test of their validity. We conduct a calibration exercise using actual option data to assess the value of including jumps in the stochastic string option pricing model. In this exercise, we utilize the Option Metrics volatility surface for the S&P 500 index to evaluate the merit of incorporating jumps into the stochastic string option pricing framework. We select three distinct dates— 3 February 2021, representing moderate market volatility; 30 August 2017, indicative of a low volatility climate; and 5 November 2008, a period of heightened volatility—to anchor our analysis. The corresponding 30-day 50 delta Black–Scholes-implied volatilities for these dates were 19.1%, 9.1%, and 45.5%, respectively. The closing levels of the S&P 500 index for these dates were, respectively, , , and .
For each date, we extract option prices for eight expirations—spanning from one to twelve months (30, 60, 91, 122, 152, 182, 273, and 365 days)—and for each expiration, we collect call option prices (and strike prices) for calls with deltas ranging in moneyness from 10% to 90% in increments of 5%. Thus, for each trading date, we have 17 call option prices for each expiration, for a total of 136 call option prices per trading date. Our objective is, for each date, to estimate a single constant parameter set that optimally aligns model-generated option prices with prices observed in the market, minimizing the root mean square error (RMSE) across all expirations. The calibration is extended to include a Cox–Ingersoll–Ross (CIR) model for the short-rate, fitted to the zero-coupon U.S. Treasury yield curve on each selected date.
The RMSE, a goodness-of-fit measure for a calibrated model, is computed as:
where denotes the model-predicted call option prices, denotes the market-observed prices, and n denotes the aggregate count of observations. The minimization task is formulated as an optimization problem:
wherein:
- symbolizes the vector of model parameters, with representing the permissible parameter space;
- , for , is the price of a call option as determined by the model for given parameters , underlying asset price , strike price , and time to expiration ;
- , for , is the corresponding market price of the option.
For each market scenario, we calibrated a suite of option pricing models, considering various configurations of underlying price dynamics and jump components. The computational implementation of the Carr and Madan Fourier transform methods using the Python programming language is detailed in [30]. The optimization of the calibration function is carried out via the Nelder–Mead simplex algorithm, a gradient-free method well suited for application to nonlinear optimization problems. The algorithm employs a simplex or an N-dimensional polytope, to probe the objective function at its vertices and iteratively apply transformations—reflection, expansion, contraction, or shrinkage—based on the function’s evaluated results. This iterative process continues until some termination criterion is met, such as convergence to a specified tolerance level or the exhaustion of a maximum number allotted iterations.
The following list summarizes the various model configurations we will consider:
- Underlying models without jumps:
- Only jumps:
- Underlying models plus jumps:
- –
- Brownian motion plus CGMY (BM+CGMY) (five parameters);
- –
- Brownian motion plus GHLM (BM+GHLM) (six parameters);
- –
- BS plus lognormal compound Poisson (BS+LN) ([8]) (four parameters);
- –
- BS plus double-exponential compound Poisson (BS+DE) ([9] ) (five parameters);
- –
- HSV plus lognormal compound Poisson (HSV+LN) ([14]) (eight parameters);
- –
- GBS plus lognormal compound Poisson (GBS+LN) (five and six parameters);
- –
- GBS plus double-exponential compound Poisson (GBS+DE) (six and seven parameters);
- –
- GBS plus CGMY (GBS+CGMY) (six and seven parameters);
- –
- GBS plus GHLM (GBS+GHLM) (seven and eight parameters).
We report the RMSEs in Table 1 and optimal parameter values for the calibrated models are reported in Table 2, Table 3 and Table 4. In Figure 1, Figure 2, Figure 3, Figure 4 and Figure 5, we plot option prices from calibrated models compared to market prices for a selection of the models.
The calibration exercise yields several key insights, not only about the comparative performance of the option pricing models under different market conditions, but also about the fine structure of the stochastic processes underlying equity price dynamics. Based on the RMSEs reported in Table 1, the addition of jump processes to models without jumps such as Black–Scholes (BS), Heston’s Stochastic Volatility (HSV), and generalized Black–Scholes (GBS) consistently improves the fit across all three volatility regimes. This fact supports the hypothesis of the presence of jumps in price dynamics.
Moreover, the GBS(3) model augmented with any jump process (lognormal, double-exponential, CGMY, GHLM) consistently outperforms its pure jump counterparts, as well as its continuous sample path alternatives. These results indicate that GBS plus jump models can indeed provide robust fits for the market prices of options across moneyness and expiry, simultaneously.
Specifically, the GBS(3) model with CGMY jumps provides superior fits of option skews compared to the alternative models considered in two out of the three volatility environments. The Heston model with jumps of [14] outperforms in the high volatility case, although it has one more parameter than GBS(3)+CGMY. Adding an additional stochastic string parameter to the GBS model with CGMY jumps, so that it has a total of eight parameters, results in dramatic reductions in RMSEs across all three volatility environments, with improvements exceeding 50% in the moderate- and high-volatility cases. In particular, the GBS(4)+CGMY model outperforms HSV+LN in each case. Close scrutiny of the plots in Figure 6 reveals that, in the high volatility case, the GBS(4)+CGMY is better able to fit the skews for out-of-the-money (OTM) calls with short expiries, while the HSV+LN appears to provide a better fit for deep OTM calls with 273 and 365 days until expiration. Overall, we can conclude that, on an equal parameter count basis, the GBS model with CGMY jumps provides the best in-sample fits, across all three volatility environments, compared to any of the alternative models reported in Table 2, Table 3, Table 4 and Table 5.
Parameter estimation from the calibrated models shows that the jump component in the GBS(4)+CGMY model, which has the best overall performance, exhibits a variance gamma process-like behavior under moderate volatility conditions. The Lévy density is skewed in the three scenarios, with the left tail heavier than the right tail , indicating a predominance of left-tail risk across all volatility scenarios. The parameter Y delineates distinct properties related to the fine structure of the stochastic process ([10]). In the high-volatility scenario (), the process is not completely monotone and has finite activity, while for moderate volatility (), the process is completely monotone with finite activity. In the low-volatility case () the process has a completely monotone Lévy density with infinite activity and finite variation. The parameter C reflects the intensity of jumps within the CGMY process, with a markedly higher level of activity in the high volatility regime () compared to the moderate and low volatility scenarios ( and , respectively), suggesting the existence of a volatility-dependent jump intensity in market dynamics.
8. Conclusions
In this paper, we present a new model for pricing European options that extends the Black–Scholes framework to include stochastic interest rates, stochastic string dynamics, and jump processes. Our model synthesizes the generalized Black–Scholes model proposed by [17] with an array of pure jump Lévy processes. Thus, our model is also a generalization of exponential Lévy models. We derive closed or semi-closed form pricing formulas for European call options in GBS plus jump models with four different types of jumps: compound Poisson processes with lognormal and double-exponential jumps ([8,9]), the CGMY process of [10], and the generalized hyperbolic Lévy motion of [11]. We also show that these expressions are reduced to those obtained in the literature for the cases of Black–Scholes dynamics or in the absence of jumps.
In order to assess the performance of the GBS model with jumps, we conduct in-sample empirical tests against several alternative models consisting of fitting the skews of options on S&P 500 under three different volatility scenarios. The results of the test can be summarized as follows: (a) including jumps improves the performance of all the models; (b) the GBS plus jumps model outperforms alternative models with the same jump distributions; (c) the GBS model with CGMY jumps (seven parameters) provides superior in-sample fits of option skews than the alternative models considered in two out of the three volatility regimes. The Heston model with jumps of [14] (eight parameters) is better in the high volatility regime, although it has one more parameter to estimate. Adding an additional stochastic string parameter to the GBS model with CGMY jumps, so that it has a total of eight parameters outperforms all alternative models in each of the three volatility regimes.
The findings of this paper not only firmly support the presence of random jump discontinuities in equity index dynamics, but also challenge the necessity of stochastic volatility in option pricing models. Our empirical results suggest that models combining continuous dynamics featuring a deterministic volatility function conditioned on option expirations, in addition to random jump processes, can yield equal or superior performance compared to alternatives that specify volatility as a stochastic process. The blend of simplicity and precision offered by the GBS model with jumps is well suited for practical application under diverse market conditions.
Building on the models developed in this paper, there are a number of interesting directions for future research. For instance, the utility of GBS plus jumps models for dynamic hedging applications could be investigated. Using the Black–Scholes hedge ratio combined with GARCH volatility estimates, Ref. [31] documented that delta-neutral portfolios consisting of long positions in index call options delta-hedged by short-index positions, on average, experience negative returns. This finding provides evidence of a negative volatility risk premium. Since a calibrated GBS model contains an estimated term-structure of volatility, conducting a dynamic hedging study using a GBS-derived hedge ratio could yield further insights on the pricing of volatility risk.
Additionally, the pricing of American and Asian options, as well as several types of exotic options, with a GBS plus jumps model could be investigated with simulation methods. Such a study would necessitate the development of Monte Carlo methods combining stochastic strings with pure jump Lévy processes. Ref. [18] simulated forward interest rates in a stochastic string model by discretizing stochastic string shocks as increments of correlated Brownian motion. They performed the simulation with three different parametric correlations. Efficient Monte Carlo methods for simulating the sample paths of the underlying price as exponential Lévy processes are developed in [32] and applied to price barrier options and fixed and floating strike lookback options. With the simulated paths of the underlying price, the least-squares Monte Carlo (LSM) technique of [33] can be applied to price American options for underlying dynamics given by a stochastic string plus jumps. In fact, the examples of derivative pricing using the LSM technique presented in [33] include both an American put when the underlying price follows a jump-diffusion, as well as the deferred American swaption in a 20-factor string model of the term structure. Moreover, as studied in [34], a modified LSM technique can be applied to price a variety of exotic path-dependent options.
Author Contributions
Methodology, A.B.-G. and S.P.C.; Software, S.P.C.; Formal analysis, A.B.-G. and S.P.C.; Investigation, A.B.-G. and S.P.C.; Data curation, S.P.C.; Writing—original draft, A.B.-G. and S.P.C.; Writing—review & editing, A.B.-G. and S.P.C.; Visualization, S.P.C. All authors have read and agreed to the published version of the manuscript.
Funding
This research received no external funding.
Data Availability Statement
The datasets that were used in this study are from OptionMetrics accessed on 21 November 2022 through Wharton Research Data Services (WRDS) at https://wrds-www.wharton.upenn.edu/.
Conflicts of Interest
The authors declare no conflict of interest.
References
- Black, F.; Scholes, M. The pricing of options and corporate liabilities. J. Political Econ. 1973, 81, 637–654. [Google Scholar] [CrossRef]
- Merton, R.C. Theory of rational option pricing. Bell J. Econ. Manag. Sci. 1973, 4, 141–183. [Google Scholar] [CrossRef]
- Amin, K.; Jarrow, R. Pricin options on risky assets in a stochastic interest rate economy. Math. Financ. 1992, 2, 217–237. [Google Scholar] [CrossRef]
- Gatheral, J. The Volatility Surface: A Practitioner’s Guide; Wiley Finance Series: Hoboken, NJ, USA, 2006. [Google Scholar]
- Hull, J.; White, A. The pricing of options with stochastic volatilities. J. Financ. 1987, 42, 281–300. [Google Scholar] [CrossRef]
- Stein, E.; Stein, J. Stock price distributions with stochastic volatility. Rev. Financ. Stud. 1991, 4, 727–752. [Google Scholar] [CrossRef]
- Heston, S.L. A closed-form solution for options with stochastic volatility with applications to bond and currency options. Rev. Financ. Stud. 1993, 6, 327–343. [Google Scholar] [CrossRef]
- Merton, R.C. Option pricing when underlying stock returns are discontinuous. J. Financ. Econ. 1976, 3, 125–144. [Google Scholar] [CrossRef]
- Kou, S.G. A jump-diffusion model for option pricing. Manag. Sci. 2002, 48, 1086–1101. [Google Scholar] [CrossRef]
- Carr, P.; Geman, H.; Madan, D.B.; Yor, M. The fine structure of asset returns: An empirical investigation. J. Bus. 2002, 75, 305–332. [Google Scholar] [CrossRef]
- Eberlein, E. Applications of Generalized Hyperbolic Lévy Motions to finance. In Lévy Processes: Theory and Applications; Barndorff-Nielsen, O.E., Resnick, S.I., Mikosch, T., Eds.; Birkhäuser: Boston, MA, USA, 2001; pp. 319–336. [Google Scholar]
- Bates, D. The crash of 87: Was it expected? The evidence from options markets. J. Financ. 1991, 46, 1009–1044. [Google Scholar] [CrossRef]
- Bates, D. Jumps and stochastic volatility: Exchange rate processes implicit in Deutschemark options. Rev. Financ. Stud. 1996, 9, 69–108. [Google Scholar] [CrossRef]
- Bakshi, G.; Cao, C.; Chen, Z. Empirical performance of alternative option pricing models. J. Financ. 1997, 52, 2003–2049. [Google Scholar] [CrossRef]
- Aït-Sahalia, Y.; Jacod, J. Testing for jumps in a discretely observed process. Ann. Stat. 2009, 37, 184–222. [Google Scholar] [CrossRef]
- Bollerslev, T.; Law, T.H.; Tauchen, G. Risk, jumps, and diversification. J. Econom. 2008, 144, 234–256. [Google Scholar] [CrossRef]
- Bueno-Guerrero, A. Black–Scholes and Heston Models with Stochastic Interest Rates and Term Structure of Volatilities. J. Deriv. 2019, 27, 32–48. [Google Scholar] [CrossRef]
- Santa-Clara, P.; Sornette, D. The dynamics of the forward interest rate curve with stochastic string shocks. Rev. Financ. Stud. 2001, 14, 149–185. [Google Scholar] [CrossRef]
- Bueno-Guerrero, A.; Moreno, M.; Navas, J.F. Stochastic string models with continuous semimartingales. Phys. A Stat. Mech. Appl. 2015, 433, 229–246. [Google Scholar] [CrossRef]
- Brogaard, J.; Han, J.; Won, P.Y. How Does Zero-Day-To-Expiry Options Trading Affect the Volatility of Underlying Assets? SSRN 4426358; SSRN: Rochester, NY, USA, 2023. [Google Scholar]
- Aït-Sahalia, Y.; Jacod, J. High-frequency financial econometrics. In High-Frequency Financial Econometrics; Princeton University Press: Princeton, NJ, USA, 2014. [Google Scholar]
- Cont, R.; Tankov, P. Financial modelling with jump processes. In Financial Modelling with Jump Processes; Chapman & Hall/CRC: Boca Raton, FL, USA, 2004. [Google Scholar]
- Chen, W.; Du, M.; Xu, X. An explicit closed-form analytical solution for European options under the CGMY model. Commun. Nonlinear Sci. Numer. Simul. 2017, 42, 285–297. [Google Scholar] [CrossRef]
- Fox, C. The G and H functions as symmetrical Fourier kernels. Trans. Am. Math. Soc. 1961, 98, 395–429. [Google Scholar]
- Mathai, A.; Saxena, R. The H-Function with Applications in Statistics and Other Disciplines; Wiley Eastern: New Delhi, India; Halsted Press: Hoboken, NJ, USA, 1978. [Google Scholar]
- Prudnikov, A.; Brychkov, Y.; Brychkov, I.; Marichev, O. Integrals and Series: More Special functions; Gordon and Breach Science Publishers: Philadelphia, PA, USA, 1986; Volume 3. [Google Scholar]
- Kilbas, A.A.; Saigo, M. H-Transforms: Theory and Applications; Chapman & Hall/CRC: Boca Raton, FL, USA, 1986. [Google Scholar]
- Carr, P.; Madan, D. Option valuation using the fast Fourier transform. J. Comput. Financ. 1999, 2, 61–73. [Google Scholar] [CrossRef]
- Lewis, A.L. A Simple Option Formula for General Jump-Diffusion and other Exponential Lévy Processes; SSRN 282110; SSRN: Rochester, NY, USA, 2001. [Google Scholar]
- Hilpisch, Y. Derivatives Analytics with Python: Data Analysis, Models, Simulation, Calibration and Hedging; John Wiley & Sons: Hoboken, NJ, USA, 2015. [Google Scholar]
- Bakshi, G.; Kapadia, N. Delta-hedged gains and the negative market volatility risk premium. Rev. Financ. Stud. 2003, 16, 527–566. [Google Scholar] [CrossRef]
- Ribeiro, C.; Webber, N. Correcting for simulation bias in Monte Carlo methods to value exotic options in models driven by Lévy processes. Appl. Math. Financ. 2006, 13, 333–352. [Google Scholar] [CrossRef]
- Longstaff, F.A.; Schwartz, E.S. Valuing American options by simulation: A simple least-squares approach. Rev. Financ. Stud. 2001, 14, 113–147. [Google Scholar] [CrossRef]
- Wang, Y.; Caflisch, R. Pricing and hedging American-style options: A simple simulation-based approach. J. Comput. Financ. 2009, 13, 95–125. [Google Scholar] [CrossRef]
Figure 1.
European call option prices from the calibrated Black–Scholes model are overlaid on market observed option prices for the given pricing dates. For each pricing date, model calibration is carried out using pricing data for eight expirations spanning from one to twelve months (30, 60, 91, 122, 152, 182, 273, and 365 days), and for each expiration, calls with deltas ranging in moneyness from 10% to 90% in increments of 5%. A total of 136 call option prices per trading date are used in the calibration. Model prices are depicted as distinct points, while observed market prices are depicted using interpolating curves. Option expiration is color-coded according to the legend in Panel (a).

Figure 2.
European call option prices from the calibrated GBS(3) model are overlaid on market observed option prices for the given pricing dates. For each pricing date, the model calibration is carried out using pricing data for eight expirations spanning from one to twelve months (30, 60, 91, 122, 152, 182, 273, and 365 days), and for each expiration, calls with deltas ranging in moneyness from 10% to 90% in increments of 5%. A total of 136 call option prices per trading date are used in the calibration. Model prices are depicted as distinct points, while observed market prices are depicted using interpolating curves. Option expiration is color-coded according to the legend in Panel (a).

Figure 3.
European call option prices from the calibrated BS+LN model are overlaid on market observed option prices for the given pricing dates. For each pricing date, model calibration is carried out using pricing data for eight expirations spanning from one to twelve months (30, 60, 91, 122, 152, 182, 273, and 365 days), and for each expiration, calls with deltas ranging in moneyness from 10% to 90% in increments of 5%. A total of 136 call option prices per trading date are used in the calibration. Model prices are depicted as distinct points, while observed market prices are depicted using interpolating curves. Option expiration is color-coded according to the legend in Panel (a).
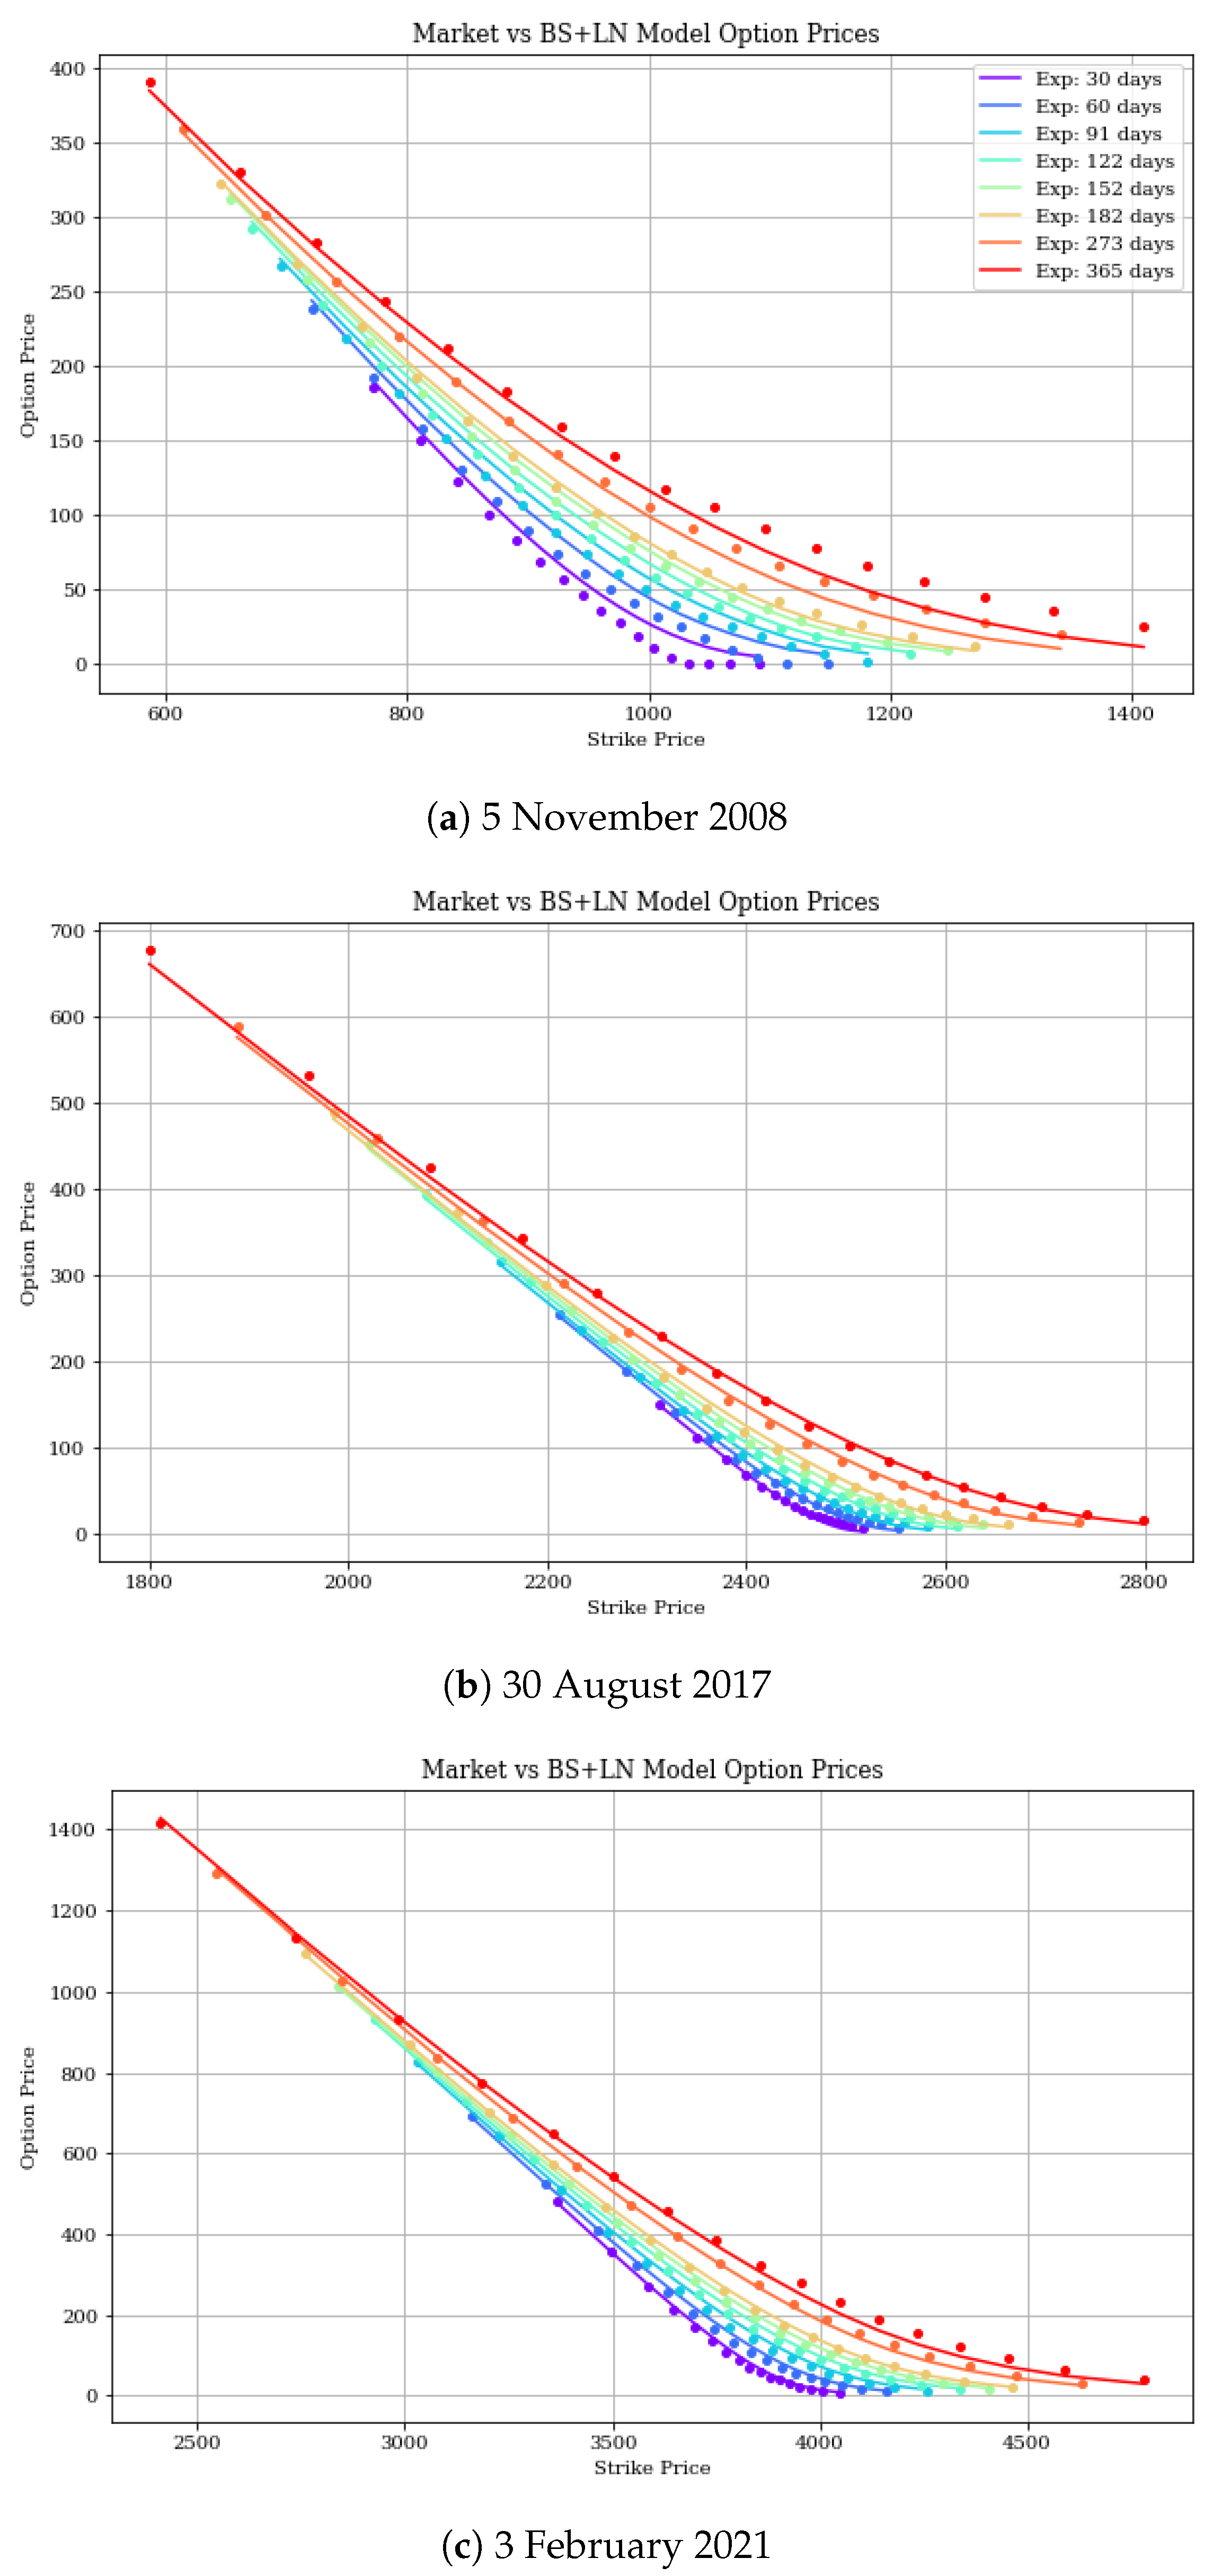
Figure 4.
European call option prices from the calibrated GBS(3)+LN model are overlaid on market observed option prices for the given pricing dates. For each pricing date, model calibration is carried out using pricing data for eight expirations spanning from one to twelve months (30, 60, 91, 122, 152, 182, 273, and 365 days), and for each expiration, calls with deltas ranging in moneyness from 10% to 90% in increments of 5%. A total of 136 call option prices per trading date are used in the calibration. Model prices are depicted as distinct points, while observed market prices are depicted using interpolating curves. Option expiration is color-coded according to the legend in Panel (a).

Figure 5.
European call option prices from the calibrated GBS(3)+CGMY model are overlaid on market observed option prices for the given pricing dates. For each pricing date, model calibration is carried out using pricing data for eight expirations spanning from one to twelve months (30, 60, 91, 122, 152, 182, 273, and 365 days), and for each expiration, calls with deltas ranging in moneyness from 10% to 90% in increments of 5%. A total of 136 call option prices per trading date are used in the calibration. Model prices are depicted as distinct points, while observed market prices are depicted using interpolating curves. Option expiration is color-coded according to the legend in Panel (a).

Figure 6.
Market option prices vs. model prices on 5 November 2008 for two eight-parameter models, namely HSV+LN and GBS(4)+CGMY.
Figure 6.
Market option prices vs. model prices on 5 November 2008 for two eight-parameter models, namely HSV+LN and GBS(4)+CGMY.


Table 1.
Comparative analysis of in-sample model performance for different volatility conditions: This table reports the root mean square errors (RMSEs) of various option pricing models calibrated against market data from three distinct volatility environments. The RMSEs serve as a quantitative metric for the precision of each model’s fit to the observed option prices. The calibration exercise spans models without jump processes, models exclusively featuring jumps, and hybrid models combining the underlying price dynamics with jumps. Lower RMSE values denote a more accurate representation of market prices by the model. The volatility regimes are defined by the dates: low volatility on 3 February 2021, moderate volatility on 30 August 2017, and high volatility on 5 November 2008.
| Underlying Models without Jumps | Parameters | Low Vol | Moderate Vol | High Vol |
|---|---|---|---|---|
| Black–Scholes (BS) | 1 | 36.040 | 12.619 | 10.388 |
| Heston stochastic volatility (HSV) | 5 | 13.031 | 4.088 | 3.901 |
| Generalized Black–Scholes (GBS(3)) | 3 | 35.794 | 11.879 | 8.117 |
| Only Jumps | Parameters | Low Vol | Moderate Vol | High Vol |
| CGMY | 4 | 9.563 | 1.284 | 8.339 |
| Generalized hyperbolic Lévy motion (GHLM) | 5 | 11.815 | 3.521 | 9.437 |
| Underlying Models Plus Jumps | Parameters | Low Vol | Moderate Vol | High Vol |
| BS plus lognormal compound Poisson (BS+LN) | 4 | 10.530 | 4.858 | 8.204 |
| BS plus double-exponential compound Poisson (BS+DE) | 5 | 8.491 | 1.138 | 8.606 |
| Brownian motion plus CGMY (BM+CGMY) | 5 | 9.410 | 1.165 | 8.280 |
| Brownian motion plus GHLM (BM+GHLM) | 6 | 10.268 | 2.907 | 8.867 |
| GBS plus lognormal compound Poisson (GBS(3)+LN) | 6 | 4.632 | 1.465 | 2.175 |
| GBS plus double-exponential compound Poisson (GBS+DE) | 7 | 3.700 | 1.083 | 3.577 |
| GBS plus CGMY (GBS(3)+CGMY) | 7 | 3.630 | 1.050 | 3.403 |
| HSV plus lognormal compound Poisson (HSV+LN) | 8 | 6.128 | 2.116 | 2.293 |
| GBS plus GHLM (GBS(3)+GHLM) | 8 | 6.512 | 2.892 | 4.828 |
| GBS plus CGMY (GBS(4)+CGMY) | 8 | 3.536 | 1.049 | 2.006 |
Table 2.
Parameter estimation for calibrated models under high-volatility conditions: This table presents the estimated parameter values for a range of option pricing models calibrated to the S&P 500 index options data from 5 November 2008—a date characterized by high market volatility.
Table 2.
Parameter estimation for calibrated models under high-volatility conditions: This table presents the estimated parameter values for a range of option pricing models calibrated to the S&P 500 index options data from 5 November 2008—a date characterized by high market volatility.
| Underlying Models without Jumps | Parameters | ||||||||
|---|---|---|---|---|---|---|---|---|---|
| Black–Scholes | 1 | ||||||||
| 0.356 | |||||||||
| Stochastic string model (GBS(3)) | 3 | ||||||||
| 0.459 | −0.222 | 0.117 | |||||||
| Heston stochastic volatility (HSV) | 5 | ||||||||
| 1.216 | 0.073 | 0.420 | −0.938 | 0.176 | |||||
| Only Jumps | Parameters | ||||||||
| CGMY | 4 | C | G | M | Y | ||||
| 71.234 | 12.546 | 5624.007 | −0.574 | ||||||
| GHLM | 5 | ||||||||
| 9.990 | −2.819 | 1.428 | −1.182 | 0.320 | |||||
| Underlying Models Plus Jumps | Parameters | ||||||||
| Brownian motion plus CGMY (BM+CGMY) | 5 | C | G | M | Y | ||||
| 0.01 | 71.234 | 12.546 | 5624.007 | −0.574 | |||||
| Brownian motion plus GHLM (BM+GHLM) | 6 | ||||||||
| 0.216 | 10.829 | −3.785 | 0.169 | 4.258 | 0.272 | ||||
| BS plus lognormal compound Poisson (BS+LN) | 4 | ||||||||
| 0.038 | 6.929 | −0.130 | 0.062 | ||||||
| BS plus double-exponential compound Poisson (BS+DE) | 5 | p | |||||||
| 0.368 | 0.010 | 0.226 | 2.096 | 0.001 | |||||
| HSV plus lognormal compound Poisson (HSV+LN) | 8 | ||||||||
| 6.487 | 0.009 | 0.116 | −1.000 | 0.189 | 0.522 | −0.444 | |||
| GBS plus lognormal compound Poisson (GBS(3)+LN) | 6 | ||||||||
| 0.367 | −0.264 | 0.142 | 0.947 | -0.364 | 0.005 | ||||
| GBS plus double-exponential compound Poisson (GBS+DE) | 7 | p | |||||||
| 0.486 | 0.001 | −0.261 | 0.013 | 0.001 | 2.100 | 0.121 | |||
| GBS plus CGMY (GBS(3)+CGMY) | 7 | C | G | M | Y | ||||
| 0.301 | −0.112 | 0.023 | 477.300 | 11.023 | 78.750 | −2.324 | |||
| GBS plus GHLM (GBS(3)+GHLM) | 8 | ||||||||
| −0.178 | 0.075 | 0.320 | 9.998 | −4.818 | 0.028 | 3.352 | 0.357 | ||
| GBS plus CGMY (GBS(4)+CGMY) | 8 | C | G | M | Y | ||||
| 0.362 | −0.330 | 0.274 | −0.076 | 1589.635 | 12.836 | 6343.843 | −2.756 |
Table 3.
Parameter estimation for calibrated models under low-volatility conditions: This table presents the estimated parameter values for a range of option pricing models calibrated to the S&P 500 index options data from 30 August 2017—a date characterized by low-market volatility.
Table 3.
Parameter estimation for calibrated models under low-volatility conditions: This table presents the estimated parameter values for a range of option pricing models calibrated to the S&P 500 index options data from 30 August 2017—a date characterized by low-market volatility.
| Underlying Models without Jumps | Parameters | ||||||||
|---|---|---|---|---|---|---|---|---|---|
| Black–Scholes | 1 | ||||||||
| 0.120 | |||||||||
| Stochastic string model (GBS(3)) | 3 | ||||||||
| 0.086 | 0.020 | −0.01 | |||||||
| Heston stochastic volatility (HSV) | 5 | ||||||||
| 1.840 | 0.028 | 0.323 | −1.000 | 0.013 | |||||
| Only Jumps | Parameters | ||||||||
| CGMY | 4 | C | G | M | Y | ||||
| 0.092 | 2.909 | 53.105 | 0.841 | ||||||
| GHLM | 5 | ||||||||
| 8.571 | 4.610 | 0.064 | 0.072 | 0.069 | |||||
| Underlying Models Plus Jumps | Parameters | ||||||||
| Brownian motion plus CGMY (BM+CGMY) | 5 | C | G | M | Y | ||||
| 0.046 | 0.470 | 5.282 | 1008.237 | 0.207 | |||||
| Brownian motion plus GHLM (BM+GHLM) | 6 | ||||||||
| 0.046 | 12.714 | −7.301 | 0.002 | 0.639 | 0.076 | ||||
| BS plus lognormal compound Poisson (BS+LN) | 4 | ||||||||
| 0.085 | 0.089 | −0.498 | 0.001 | ||||||
| BS plus double-exponential compound Poisson (BS+DE) | 5 | p | |||||||
| 0.057 | 0.091 | 0.000 | 33.941 | 9.963 | |||||
| HSV plus lognormal compound Poisson (HSV+LN) | 8 | ||||||||
| 32.743 | 0.005 | 0.000 | 0.089 | 0.004 | 0.261 | −0.252 | 0.001 | ||
| GBS plus lognormal compound Poisson (GBS(3)+LN) | 6 | ||||||||
| 0.060 | 0.001 | −0.001 | 0.533 | −0.153 | 0.106 | ||||
| GBS plus double-exponential compound Poisson (GBS+DE) | 7 | p | |||||||
| 0.055 | 0.001 | −0.001 | 0.091 | 0.000 | 26.920 | 9.938 | |||
| GBS plus CGMY (GBS(3)+CGMY) | 7 | C | G | M | Y | ||||
| 0.048 | −0.001 | 0.719 | 5.900 | 6199.174 | 0.044 | ||||
| GBS plus GHLM (GBS(3)+GHLM) | 8 | ||||||||
| 0.051 | 0.000 | 0.001 | 10.168 | −5.410 | −0.000 | 0.504 | 0.062 | ||
| GBS plus CGMY (GBS(4)+CGMY) | 8 | C | G | M | Y | ||||
| 0.049 | −0.001 | 0.813 | 6.089 | 639.277 | −0.004 |
Table 4.
Parameter estimation for calibrated models under moderate-volatility conditions: This table presents the estimated parameter values for a range of option pricing models calibrated to the S&P 500 index options data from 3 February 2021—a date characterized by moderate market volatility.
Table 4.
Parameter estimation for calibrated models under moderate-volatility conditions: This table presents the estimated parameter values for a range of option pricing models calibrated to the S&P 500 index options data from 3 February 2021—a date characterized by moderate market volatility.
| Underlying Models without Jumps | Parameters | ||||||||
|---|---|---|---|---|---|---|---|---|---|
| Black–Scholes | 1 | ||||||||
| 0.222 | |||||||||
| Stochastic string model (GBS(3)) | 3 | ||||||||
| 0.086 | 0.020 | −0.01 | |||||||
| Heston stochastic volatility (HSV) | 5 | ||||||||
| 0.701 | 0.160 | 0.473 | −1.000 | 0.042 | |||||
| Only Jumps | Parameters | ||||||||
| CGMY | 4 | C | G | M | Y | ||||
| 0.052 | 0.238 | 122.079 | 1.277 | ||||||
| GHLM | 5 | ||||||||
| 8.571 | 4.610 | 0.064 | 0.072 | 0.069 | |||||
| Underlying Models Plus Jumps | Parameters | ||||||||
| Brownian motion plus CGMY (BM+CGMY) | 5 | C | G | M | Y | ||||
| 0.050 | 0.043 | 0.083 | 201.355 | 1.291 | |||||
| Brownian motion plus GHLM (BM+GHLM) | 6 | ||||||||
| 0.086 | 4.653 | −4.286 | 0.187 | −0.987 | 0.151 | ||||
| BS plus lognormal compound Poisson (BS+LN) | 4 | ||||||||
| 0.127 | 0.384 | −0.380 | 0.202 | ||||||
| BS plus double-exponential compound Poisson (BS+DE) | 5 | p | |||||||
| 0.134 | 0.279 | 0.347 | 71.226 | 3.885 | |||||
| HSV plus lognormal compound Poisson (HSV+LN) | 8 | ||||||||
| 3.122 | 0.005 | 0.016 | 0.145 | 0.028 | 0.280 | −0.494 | 0.006 | ||
| GBS plus lognormal compound Poisson (GBS(3)+LN) | 6 | ||||||||
| 0.150 | −0.020 | 0.005 | 0.521 | −0.302 | 0.240 | ||||
| GBS plus double-exponential compound Poisson (GBS+DE) | 7 | p | |||||||
| 0.147 | −0.016 | 0.003 | 0.234 | 0.221 | 789.440 | 4.195 | |||
| GBS plus CGMY (GBS(3)+CGMY) | 7 | C | G | M | Y | ||||
| 0.122 | −0.015 | 0.000 | 0.227 | 1.537 | 74.000 | 0.550 | |||
| GBS plus GHLM (GBS(3)+GHLM) | 8 | ||||||||
| 0.136 | −0.016 | 0.004 | 7.491 | −5.848 | 0.043 | 0.162 | 0.149 | ||
| GBS plus CGMY (GBS(4)+CGMY) | 8 | C | G | M | Y | ||||
| 0.123 | 0.017 | 0.002 | 0.273 | 1.653 | 15.638 | 0.383 |
Table 5.
Model parameter estimates on 5 November 2008 for two 8-parameter models, HSV+LN and GBS(4)+CGMY.
Table 5.
Model parameter estimates on 5 November 2008 for two 8-parameter models, HSV+LN and GBS(4)+CGMY.
| Underlying Model | Parameters | |||||||||
|---|---|---|---|---|---|---|---|---|---|---|
| HSV plus lognormal compound Poisson (HSV+LN) | 8 | |||||||||
| 2.293 | 6.487 | 0.009 | 0.116 | −1.000 | 0.189 | 0.522 | −0.444 | |||
| GBS plus CGMY (GBS(4)+CGMY) | 8 | C | G | M | Y | |||||
| 2.006 | 0.366 | −0.338 | 0.287 | −0.082 | 1648.945 | 12.840 | 5503.566 | −2.787 |
Disclaimer/Publisher’s Note: The statements, opinions and data contained in all publications are solely those of the individual author(s) and contributor(s) and not of MDPI and/or the editor(s). MDPI and/or the editor(s) disclaim responsibility for any injury to people or property resulting from any ideas, methods, instructions or products referred to in the content. |
© 2023 by the authors. Licensee MDPI, Basel, Switzerland. This article is an open access article distributed under the terms and conditions of the Creative Commons Attribution (CC BY) license (https://creativecommons.org/licenses/by/4.0/).
Share and Cite
MDPI and ACS Style
Bueno-Guerrero, A.; Clark, S.P. Option Pricing under a Generalized Black–Scholes Model with Stochastic Interest Rates, Stochastic Strings, and Lévy Jumps. Mathematics 2024, 12, 82. https://doi.org/10.3390/math12010082
AMA Style
Bueno-Guerrero A, Clark SP. Option Pricing under a Generalized Black–Scholes Model with Stochastic Interest Rates, Stochastic Strings, and Lévy Jumps. Mathematics. 2024; 12(1):82. https://doi.org/10.3390/math12010082
Chicago/Turabian StyleBueno-Guerrero, Alberto, and Steven P. Clark. 2024. "Option Pricing under a Generalized Black–Scholes Model with Stochastic Interest Rates, Stochastic Strings, and Lévy Jumps" Mathematics 12, no. 1: 82. https://doi.org/10.3390/math12010082
Note that from the first issue of 2016, this journal uses article numbers instead of page numbers. See further details here.