Article

One-Shot Learning for Optical Coherence Tomography Angiography Vessel Segmentation Based on Multi-Scale U2-Net

School of Computer and Information Engineering, Tianjin Chengjian University, Tianjin 300384, China
*
Author to whom correspondence should be addressed.
Mathematics 2023, 11(24), 4890; https://doi.org/10.3390/math11244890
Submission received: 15 November 2023 / Revised: 4 December 2023 / Accepted: 5 December 2023 / Published: 6 December 2023

Abstract

:
Vessel segmentation in optical coherence tomography angiography (OCTA) is crucial for the detection and diagnosis of various eye diseases. However, it is hard to distinguish intricate vessel morphology and quantify the density of blood vessels due to the large variety of vessel sizes, significant background noise, and small datasets. To this end, a retinal angiography multi-scale segmentation network, integrated with the inception and squeeze-and-excitation modules, is proposed to address the above challenges under the one-shot learning paradigm. Specifically, the inception module extends the receptive field and extracts multi-scale features effectively to handle diverse vessel sizes. Meanwhile, the squeeze-and-excitation module modifies channel weights adaptively to improve the vessel feature extraction ability in complex noise backgrounds. Furthermore, the one-shot learning paradigm is adapted to alleviate the problem of the limited number of images in existing retinal OCTA vascular datasets. Compared with the classic U2-Net, the proposed model gains improvements in the Dice coefficient, accuracy, precision, recall, and intersection over union by 3.74%, 4.72%, 8.62%, 4.87%, and 4.32% respectively. The experimental results demonstrate that the proposed one-shot learning method is an effective solution for retinal angiography image segmentation.

1. Introduction

Optical coherence tomography (OCT) [1,2] is a non-invasive, interferometric imaging method that allows for in vivo volumetric imaging of the anterior [3] and posterior [4] parts of the eye. Optical coherence tomography angiography (OCTA) has gained popularity because it allows for vascular imaging without the use of dye injection [5]. OCTA image quality is also important, which can facilitate disease diagnosis. OCTA technology actively aids in identifying various ocular illnesses, such as diabetic retinopathy [6], glaucoma [7], age-related macular degeneration [8], and retinal vascular occlusion [9]. However, usually, there is a trade-off between image quality and data acquisition time for OCTA imaging. The identification and diagnosis of numerous eye disorders depend on vessel segmentation.
A large dataset is generally required for high accuracy in medical image segmentation. However, labeling retinal blood vessels is complex and time-consuming, and considering the privacy of the sampled patients, the number of such datasets is limited. One-shot learning [10] is used for small dataset medical image segmentation. Wu et al. [11] proposed a self-learning and one-shot learning-based framework for 3D medical image segmentation. Zhang et al. [12] used one-shot learning comparison networks for similarity matching between query and support images. Chen et al. [13] applied one-shot generative adversarial learning for MRI segmentation of craniomaxillofacial bony structures. The above methods prove that one-shot learning can be applied to medical image segmentation, but few studies focus on utilizing such a paradigm in retinal OCTA blood vessel segmentation at present. Therefore, we apply one-shot learning for competent retinal OCTA vessel segmentation.
In recent years, classic methods such as the region growing method [14], morphological operations [15], region-based segmentation [16], Block-Matching and 3D filtering (BM3D) [17], etc., have been applied to medical image segmentation. These methods have shown effectiveness in segmenting larger target structures in medical images but have limited performance when dealing with intricate blood vessels.
Deep learning has been applied to OCT [18,19] images, particularly in the field of blood vessel segmentation [20] and vessel image enhancement [21]. Many techniques [22,23,24] based on fully convolutional networks (FCNs) [25,26,27] have been applied to medical image segmentation, among which U-Net [28] has achieved outstanding results in medical image segmentation using the symmetrical U-shaped structure of an encoder and decoder [29]. Even though U-Net achieves considerable performance, it is still insufficient for the challenges of retinal vessel segmentation. Firstly, the size of blood vessels varies greatly, so it is necessary to extract multi-scale features. U-Net++ [30] introduced a recursive down-sampling and up-sampling module, while Attention U-Net [31] incorporated attention mechanisms, and DeepLabv3+ [32] used hole convolution to enlarge the receptive field. However, the fixed receptive fields still restrict the performance of the aforementioned approaches when dealing with multi-scale retinal blood vessels [30,31,32]. The second issue arises from the direct integration of local information into skip connections, leading to the generation of excessive background noise. ResU-Net [33] aimed to introduce residual blocks in both the encoder and decoder to mitigate gradient disappearance issues. TransUNet [34] enhanced global feature extraction capabilities for medical images. OCTA-Net [35] presented a split-based coarse-to-fine vessel segmentation network. U2-Net [36] elevated network depth while preserving high-resolution feature maps by nesting two tiers of U-shaped networks. Although those methods reduce noise during segmentation, the local characteristics of blood vessels are lost, while the connectivity of blood vessels is also affected [33,34,35,36].
To cope with the above issues, we propose a segmentation method called the retinal angiography multi-scale segmentation network (RAMS-Net) to solve the problems of the large range of vessel sizes, significant background noise, and small datasets under a one-shot learning paradigm. Specifically, the inception module (INC) enables the model to adapt to convolution kernels of different sizes, allowing it to extract complex and comprehensive vessel features. The squeeze-and-excitation module (SE) captures useful vascular information within the feature map and enhances the segmentation performance by improving the interaction of semantic information across different layers. In terms of the Dice coefficient, accuracy, precision, recall, and intersection over union (IOU), our experimental results demonstrate that RAMS-Net outperforms the existing approaches. In summary, three main contributions are made in this paper:
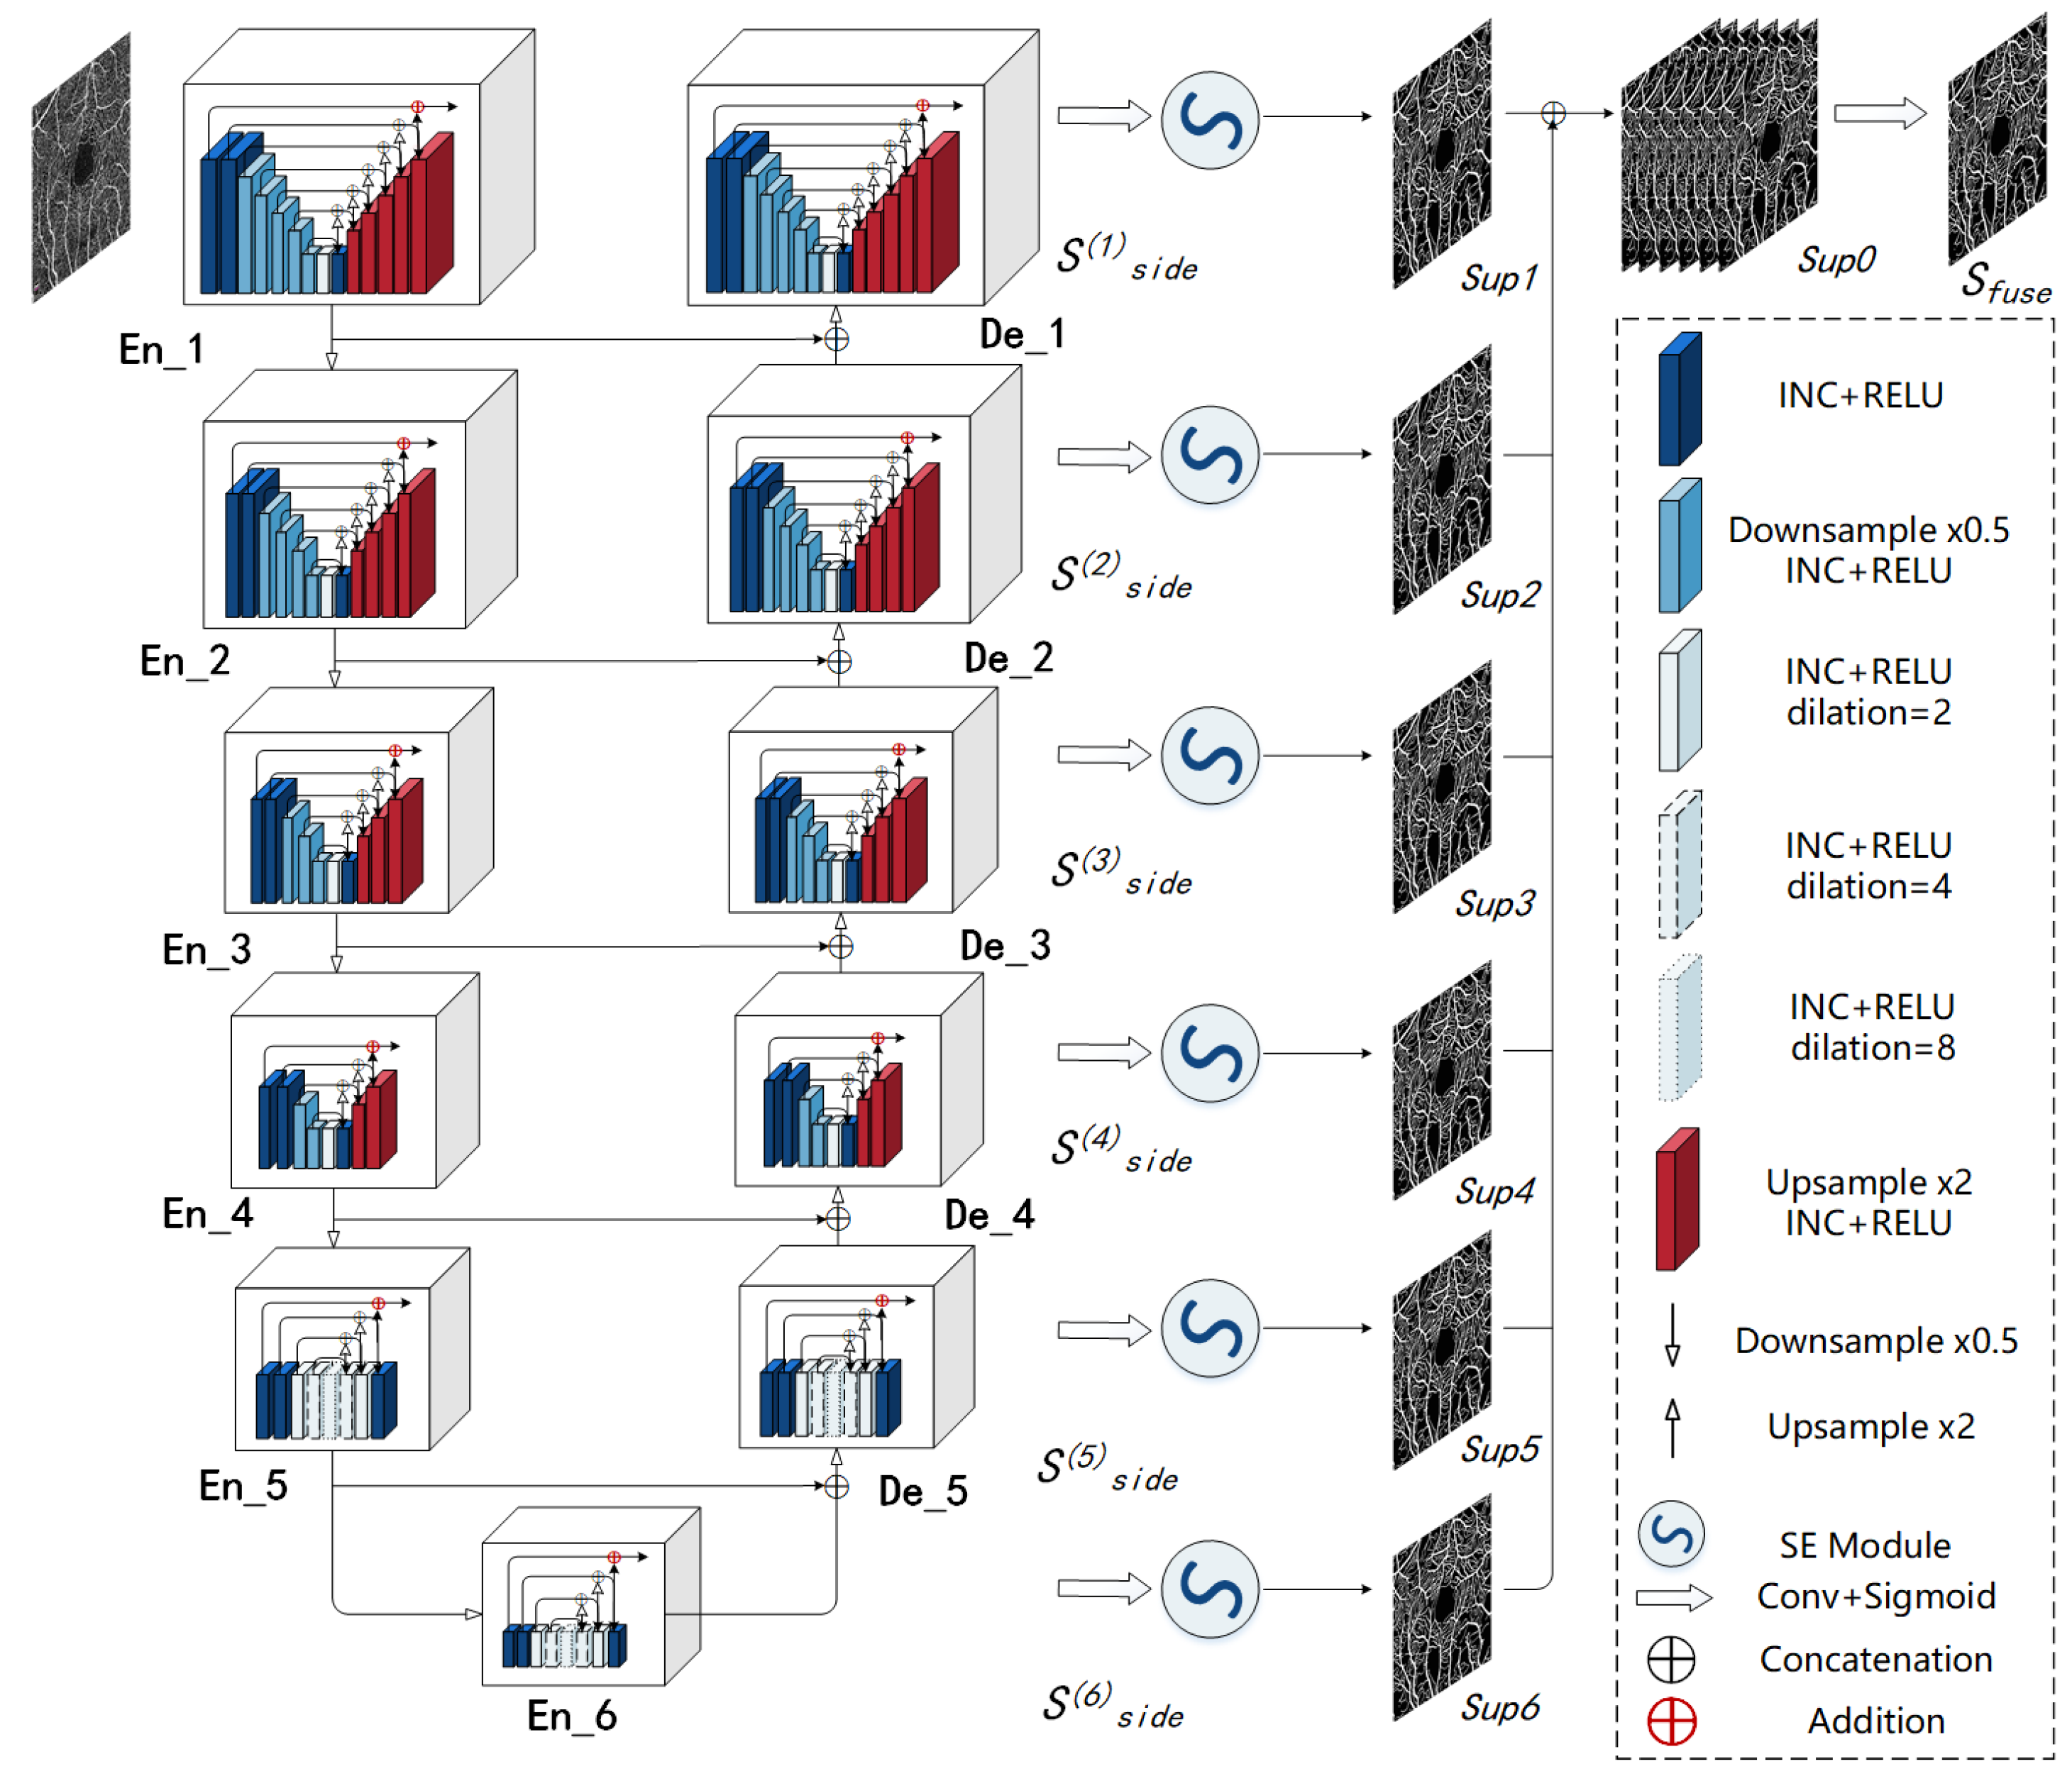
  • We propose a retinal angiography multi-scale segmentation network (RAMS-Net) for OCTA vessel segmentation under a one-shot learning paradigm, which achieves promising improvement over previous works.
  • The INC module is used to extract multi-scale features by expanding the receptive field to preserve the integrity of blood vessels with different sizes in retinal angiography images.
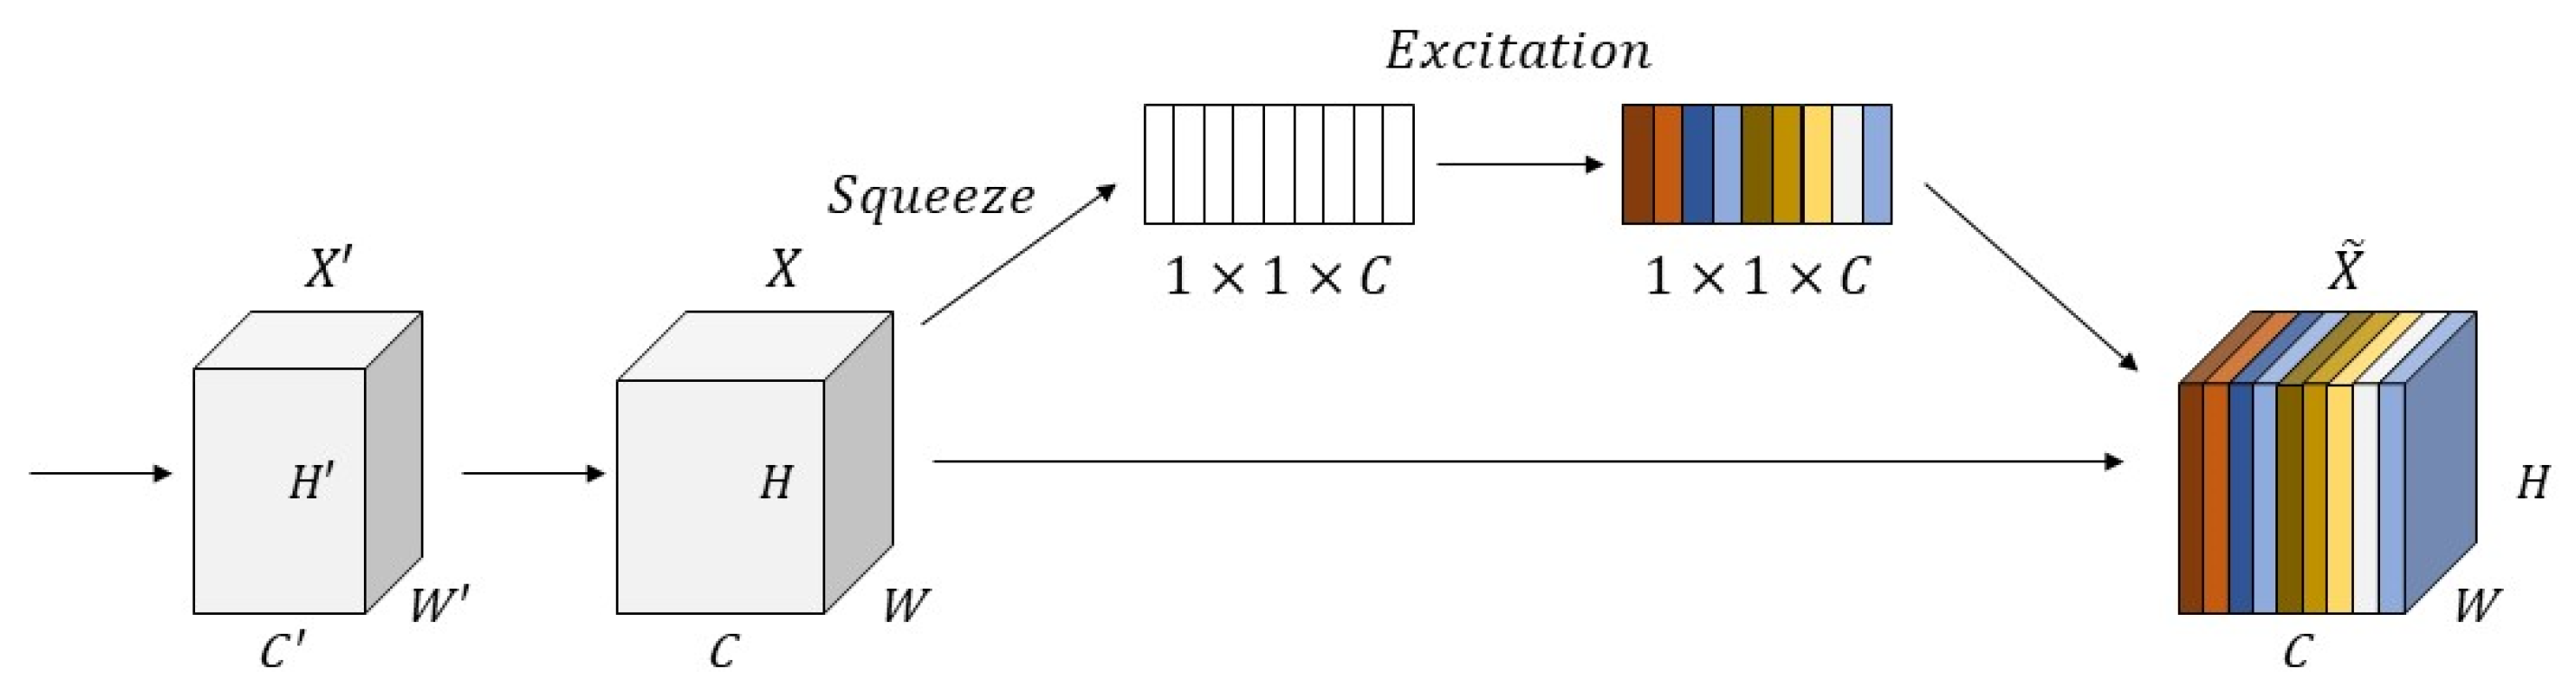
  • The SE module is introduced to adjust the weights of each channel adaptively to alleviate ambiguous vessel segmentation under complex noise backgrounds.
The rest of this paper is organized as follows. Section 2 describes our materials and methods. Section 3 introduces the experimental information and results. Section 4 contains a discussion.

2. Materials and Methods

2.1. Dataset

The proposed model is evaluated using the Retinal OCT-Angiography Vessel SEgmentation (ROSE) dataset [35], which includes two subsets named ROSE-1 and ROSE-2. We selected 30 sets of images from ROSE-1 as our experimental data. However, some areas of the blood vessels were not marked, as shown in Figure 1. The manual annotations of these vascular networks were graded by image experts and clinicians, and their consensus was then used as the ground truth. The content labeled basically covers all major blood vessels, and it agrees with our labeling standards, so we also chose the above image dataset for the experiment. For training and testing, we chose to use the first image in the dataset of ROSE-1 as the one-shot learning dataset. The remaining 29 images were reserved for testing.

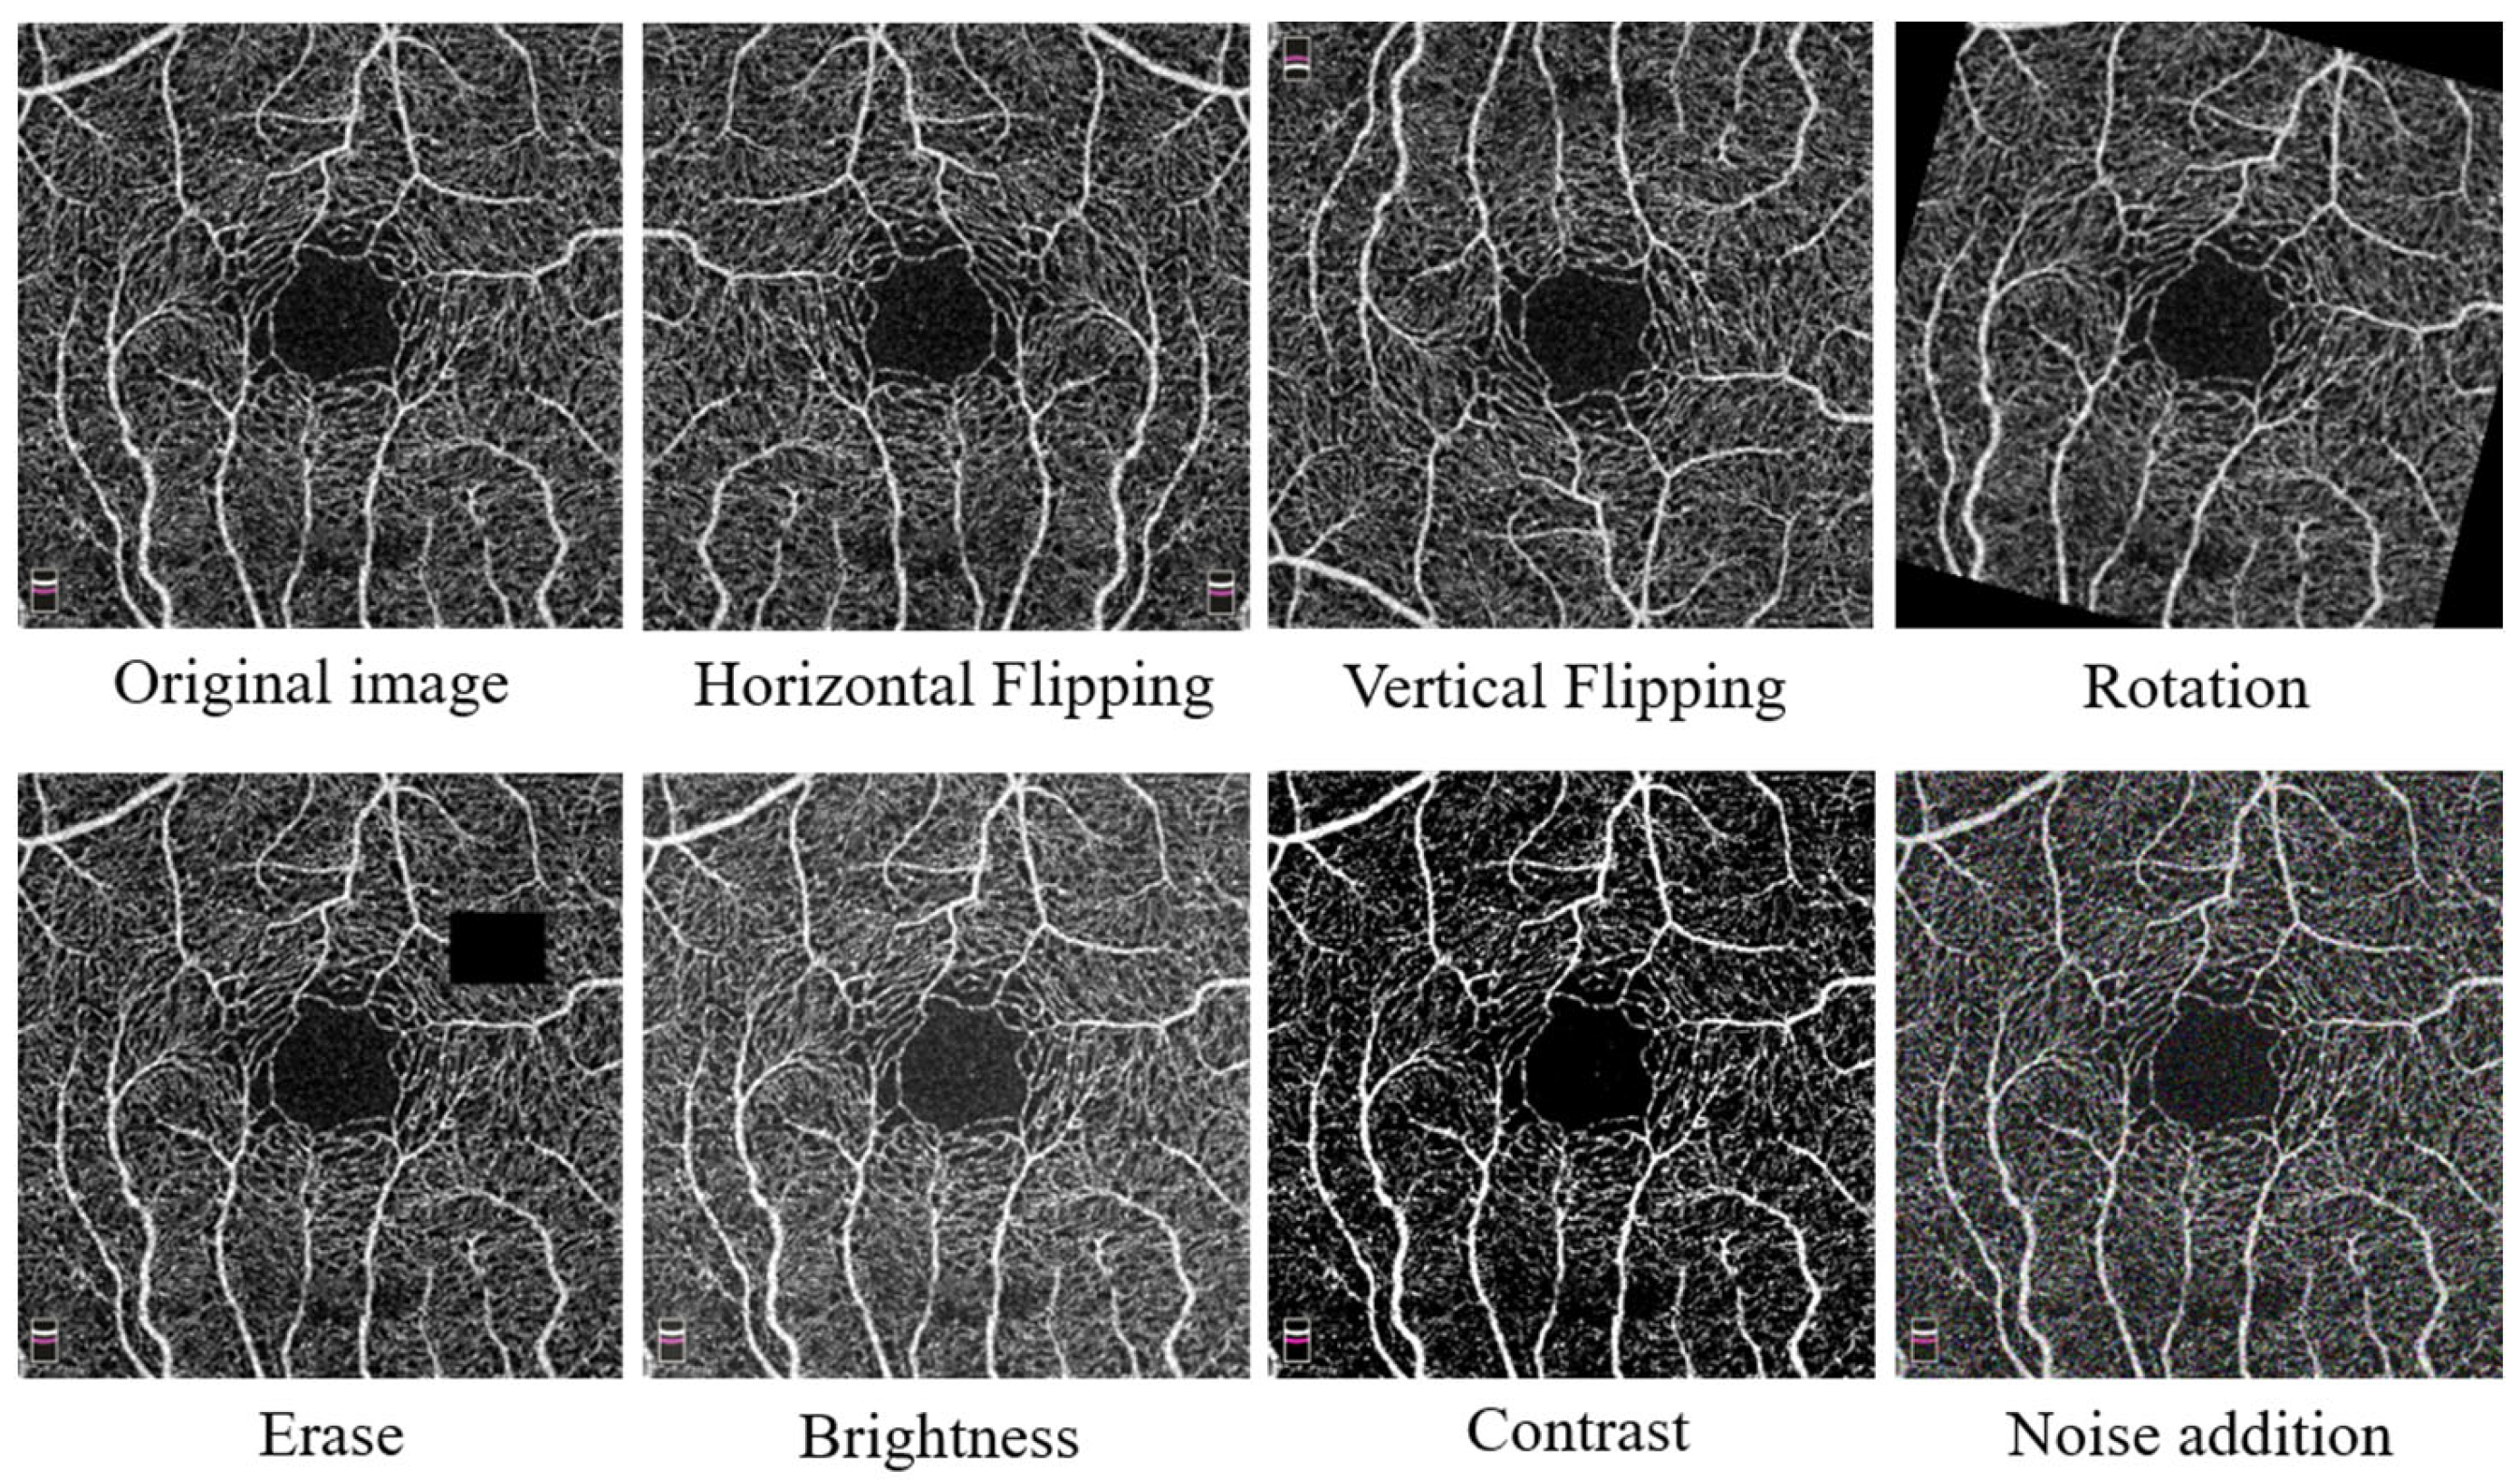
2.2. Data Augmentation

Before one-shot training, we applied data augmentation procedures to reduce overfitting and increase the generalizability of the network. We first resized all input images to 304 × 304 and performed a sharpening of the original image to enable the blood vessel vein to be displayed. Then, seven data augmentation strategies were used to augment the datasets, including horizontal and vertical flipping, random rotation, and random adjustments to the image’s contrast, brightness, and noise addition. During the training process, a random erase was also used to force the model to be more sensitive to boundary information. We expand one image to be trained to 20 images with data augmentation.
Figure 2 depicts the images after data augmentation. There are no major post-processing steps in our implementation, and pre-trained backbone feature extractors are not required.

2.3. Retinal Angiography Multi-Scale Segmentation Network (RAMS-Net)

The overall architecture of the proposed RAMS-Net is shown in Figure 3, which is implemented based on a large U-shape structure and consists of two modules: INC and SE. Notably, our innovations lie in the utilization of the INC module within the encoder stages (En_1 to En_6) and decoder stages (De_1 to De_5) to capture multi-scale features and the incorporation of the SE module for enhancing feature representation in both the decoder stages and the final encoder stage (En_6). These improvements contribute to the effectiveness of our RAMS-Net in generating saliency probability maps.
The RAMS-Net structure developed in this paper is constructed based on the multi-scale U2-Net architecture, as shown in Figure 3. The network comprises a six-stage encoder and a five-stage decoder with residual and inception U-blocks, incorporating dilated versions in stages with lower resolution. A squeeze-and-excitation module generates side-output saliency maps. A fusion module involving upsampling and concatenation procedures is then used to generate a final saliency probability map. The entire process ensures effective saliency prediction while preserving contextual information across different network stages. The details of each module are introduced as follows.

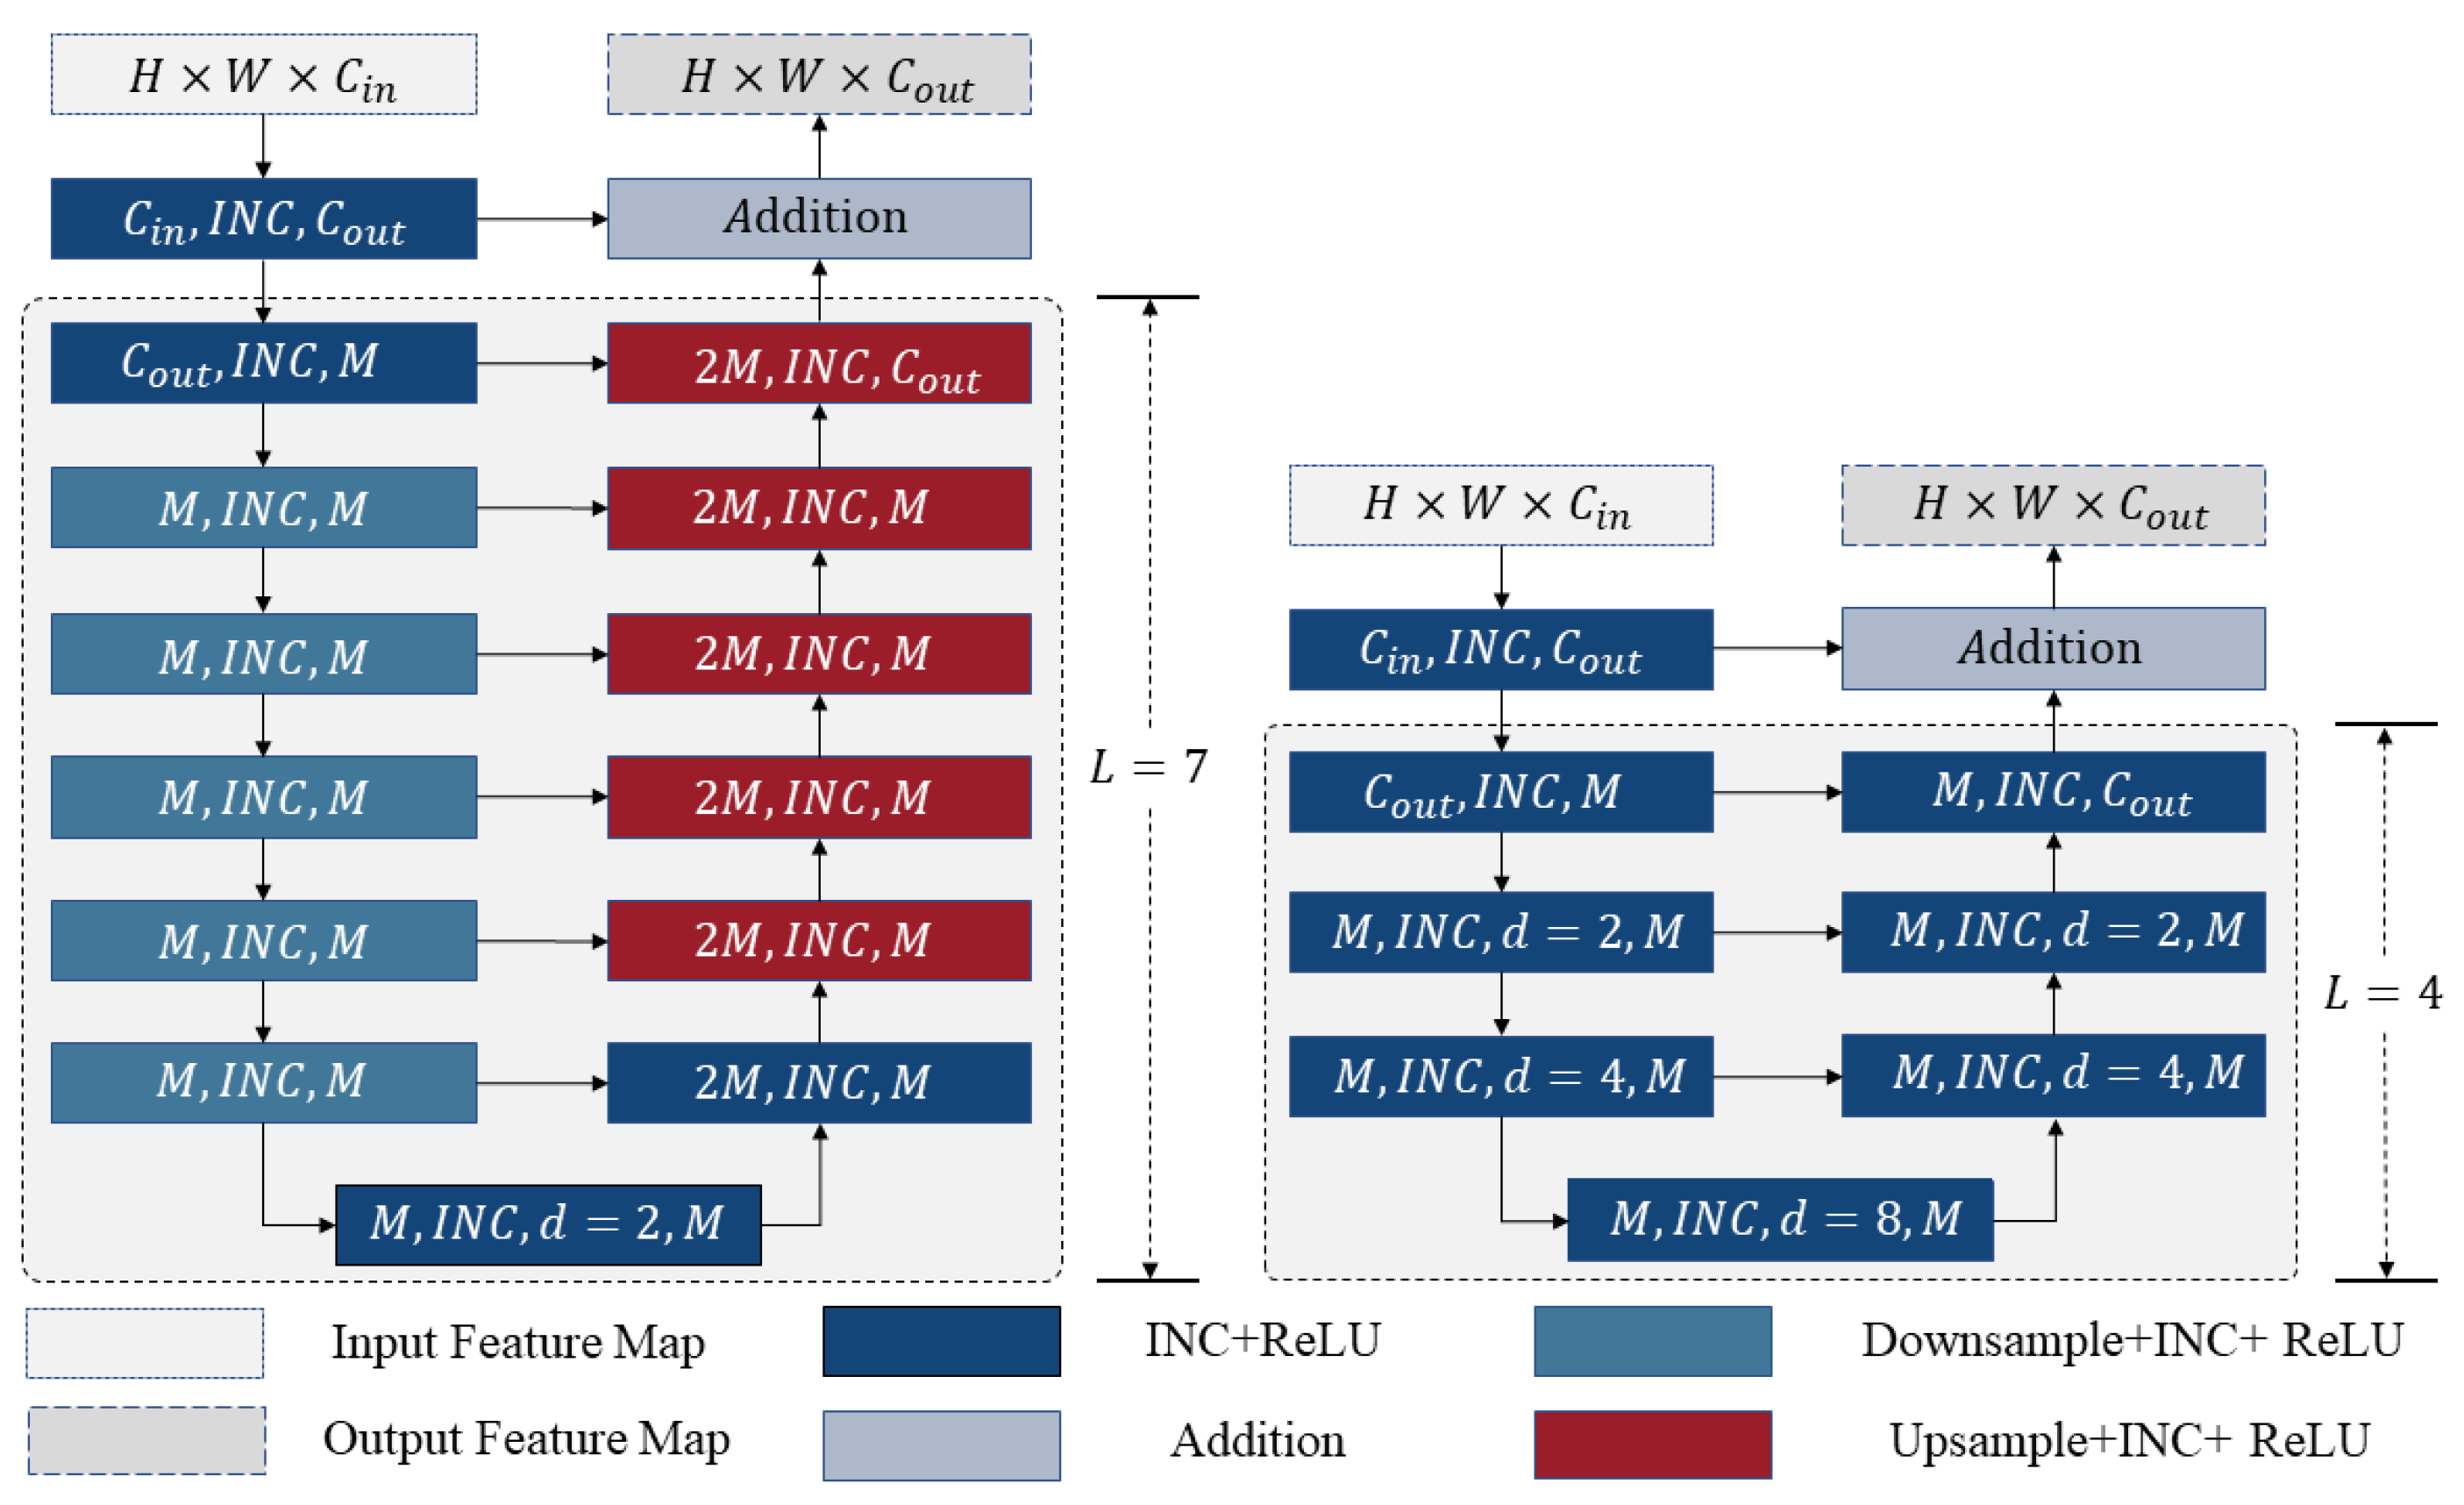
2.3.1. Inception Module

The structure of the INC module is shown in Figure 4 and consists of four branches. By providing feature diversity, this structure gives a scientifically justifiable method. Each branch concentrates on a different component of feature extraction, such as vascular structures, anomalous regions, and other fine details in OCTA images. The model can adapt to different image types and increase its overall performance thanks to this hierarchical structure. In this approach, the original convolutional layer is replaced with convolutional and pooling layers of different scales. This allows the module to adapt to convolution kernels of different sizes, which can extract more complex image features compared with fixed-size kernels. This assures the integrity and connection of the blood vessel segmentation used in retinal angiography.
The original input data are the previous layer’s output data, with a spatial height of H , a spatial width of W , and C channels. Branch 1 specifies a convolutional layer that uses a 1 × 1 kernel to carry out the convolution, thereby decreasing the total number of channels to one-fourth of the number of channels used for the output data. The number of channels changes from C to C / 4 . This branch is largely responsible for the extraction of shallow features from the input data using convolutional kernel coverage that is rather low. Branch 2 makes use of two convolutional layers, the first of which is the same as branch 1, and the second of which makes use of a 3 × 3 convolutional kernel with variable dilated convolution. Branch 2 is a multi-layered neural network. This increases the distance between elements inside the convolutional kernel, which in turn increases the size of the receptive field and allows for the extraction of more detailed feature information from the input data. The first two convolutional layers of Branch 3 are the same as those found in Branch 2 and are used to extract similar medium-level characteristics. Branch 3 consists of three convolutional layers. To extract high-level features from the input data, the third convolutional layer uses variable dilated convolution, similar to the previous two layers. Lastly, Branch 4 features a convolutional layer in addition to an average pooling layer. The average pooling layer is responsible for downsampling and compressing the features, in addition to performing a 3 × 3 average pooling operation on the input. The number of channels is subsequently cut down to one-fourth of the total number of output data channels by the convolutional layer, which uses a 1 × 1 kernel. The output feature maps that are generated with the four different branches are concatenated in the direction of the channel. The Concat box in Figure 4 represents the concatenate operation.
In general, the INC module makes the model adjust to varying kernel sizes, enabling it to extract increasingly intricate features from the input data. One-shot learning under the application of the INC module eliminates the iteration of worthless features and extracts multi-scale features throughout the image training process.

2.3.2. Residual and Inception U-Block (RIU)

We designed a new RIU block to capture multi-scale features and extract information about retinal vascular properties. In contrast to the Residual U-block (RSU) block [32], we substitute the INC module for the initial plain convolutional layer. It is better able to capture multi-scale and more intricate characteristics. The structure of the RIU-L is shown in Figure 5, where L is the number of layers in the encoder or decoder. In Figure 6, the input and output channels are denoted by C i n and C o u t , and the number of channels in the internal layers of the RIU is denoted by M .
Specifically, in the RIU block, the input feature mapping ( H × W × C i n ) is first converted into an intermediate mapping F 1 ( x ) with the channel of C o u t by convolution layers. This is a normal convolutional layer for extracting local features. Secondly, a U-shaped-structured symmetric encoder of height 7 takes the intermediate feature mapping F 1 ( x ) as input and learns to extract and encode the multi-scale contextual information U ( F 1 ( x ) ) , where U stands for U-Net structure. We use multi-scale convolution of the INC module instead of ordinary convolution. A larger perceptual field and richer global and local features are obtained using multi-scale convolution. Progressive upsampling, concatenation, and convolution are used to extract the multi-scale features from successively downsampled feature maps and encode them into high-resolution feature maps. Using this method, the loss of fine features brought on by direct upsampling at large scales is reduced. The following equation can be used to summarize the entire RIU block operation:
H R I U = U F 1 x + F 1 x ,
where x denotes the original features of the image, H R I U denotes the expected mapping of the input features x ,   F 1 x denotes the local features extracted after the INC module convolution operation, and U F 1 x denotes the multi-scale features among the image extracted with the U-shaped block after the INC convolution operation.

2.3.3. Squeeze-and-Excitation Module (SE Module)

The structure of the SE module is depicted in Figure 6 [37]. The original input data are denoted as X , possessing a spatial height of H , a spatial width of W , and C channels. Applying convolution generates a feature map represented by X , with a spatial height of H , a spatial width of W , and C channels. The feature map is then compressed using the S q u e e z e operation and stimulated using the E x c i t a t i o n operation, resulting in feature recalibration denoted by X ~ . Notably, the operations of feature compression and recalibration are critical steps that can effectively enhance model performance while reducing computational costs.
The Squeeze operation uses global averaging pooling to expand the perceptual field, encode the entire spatial feature in one dimension as a global feature, and obtain the weights for each channel. The E x c i t a t i o n operation uses global averaging pooling to expand the perceptual field, encode the entire spatial feature in one dimension as a global feature, and obtain the weights for each channel. Its formal representation is shown below:
z = F s q x = 1 H × W i = 1 H j = 1 W x i , j ,
where z represents the global feature, F s q denotes the squeeze operation, x denotes the input feature map, and H and W denote the height and width of the feature map, respectively. Moreover, x i , j represents the feature vector of the pixel located in row i and column j . The S q u e e z e operation plays a significant role in obtaining the global description of the features, while the E x c i t a t i o n operation helps in establishing the correlation between channels. This, in turn, allows for retaining the channels that contain the most relevant information while suppressing the channels that carry less meaningful information. Its formal representation is shown below:
s = F e x z , W = σ W 2 δ W 1 z ,
where s represents the incentive score vector and F e x represents the incentive operation. W 1 R C r × C and W 2 R C × C r represent the weight matrix of C r rows by C columns and C rows by C r columns, respectively. r denotes the scaling factor, σ is the sigmoid function, and δ is the ReLU activation function.
The SE module focuses and retains the channel for the importance of the feature. It properly captures useful vascular information in the feature map and improves the segmentation performance of the model by improving the interplay of semantic information between multiple layers. The SE module provides the complete segmentation of blood vessels in the presence of complicated background noise while segmenting retinal angiograms. One-shot learning under the application of the SE module can adjust the feature weights more finely, which helps focus on key features when segmenting other new images.

2.3.4. Loss Function

In the training process, we use deep supervision similar to HED [38], which manages multiple phases in the network, in addition to solving the problems of gradient disappearance and slow convergence of the training process. Our training loss is defined as:
I L o s s = n = 1 N w s i d e n l s i d e n + w f u s e l f u s e ,
where l s i d e ( n ) ( M = 6 , as the Sup1, Sup2, ···, Sup6 in Figure 4) is the loss of the side output saliency map S s i d e ( n ) and l f u s e (Sup7 in Figure 4) is the loss of the final fusion output saliency map S f u s e . w s i d e ( n ) and w f u s e are the weights of each loss term. For each term l , we use the standard binary cross-entropy to calculate the loss:
l = ( r , c ) ( H , W ) P G r , c l o g P S r , c + 1 P G r , c l o g 1 P S r , c ,
where ( r , c ) is the pixel coordinates of the OCTA retinal vasculature image and ( H , W ) is the image size: height and width. P G r , c and P S ( r , c ) are the pixel values of the blood vessel annotation image and the predicted saliency probability map, respectively. The training procedure aims to reduce the loss I _ L o s s of Equation (4). We settled on the fusion output as our final saliency map after completing testing.

3. Results

3.1. Evaluation Metrics

The experimental results are analyzed quantitatively using several metrics, including the Dice coefficient, intersection over union (IOU), precision, recall, and accuracy (Acc). The terms TPs (true positives), FPs (false positives), FNs (false negatives), and TNs (true negatives) refer to the sets of correctly identified blood vessel pixels, incorrectly identified background pixels, incorrectly labeled blood vessel pixels, and correctly identified background pixels, respectively. TPs and FPs denote the number of blood vessel pixels correctly segmented with the model and the number of background pixels incorrectly segmented with the model, respectively. TNs represent the number of correctly segmented background pixels, and FN represents a blood vessel pixel that has been incorrectly labeled as a background pixel.
The Dice coefficient is one of the most commonly used evaluation indicators for medical image segmentation. A high Dice coefficient typically indicates that a model has accurately segmented vessels in the image. It is a commonly used and effective metric for evaluating the performance of segmentation algorithms. It measures the similarity of two samples on a scale of 0 to 1 and is calculated as:
D i c e x , y = 2 x y x + y = 2 T P 2 T P + F P + F N ,
where x and y represent the set of pixels predicted with the model for the retinal vessel region and the actual annotated region, respectively, and x and y denote their cardinalities.
The Jaccard index is also known as the intersection over union (IOU) or Jaccard similarity coefficient. It is similar to the Dice coefficient and is also a measure of the similarity of sets. A high IOU metric indicates a strong alignment between the predicted and actual regions, signifying a more accurate segmentation. It is a measure used to compare the similarity of sets. The formula is shown below:
I O U x , y = x y x y = T P T P + F P + F N .
Precision, recall, and accuracy are calculated using the following equations:
P r e c i s i o n = T P T P + F P ,
R e c a l l = T P T P + F N ,
A c c = T P + T N T P + T N + F N + F P .
Precision quantifies the accuracy of positive predictions generated with the model. It calculates the ratio of true positive predictions (i.e., correctly identified positive samples) to all predicted positive samples. In the context of retinal vessel segmentation, precision assesses the precision of positive predictions, specifically emphasizing the accurate identification of blood vessels. Maintaining high precision is crucial, particularly when the cost of misclassifying background pixels as vessels is significant. This ensures our model delivers precise and reliable positive predictions. Recall measures the model’s effectiveness in identifying positive instances and determining the ratio of true positive predictions to all actual positive samples. In retinal imaging, a high recall indicates that our model adeptly identifies the majority of true-positive blood vessels. This is paramount in medical applications where overlooking a true positive could lead to severe consequences. Thus, recall underscores the model’s capacity to minimize false negatives, guaranteeing a comprehensive detection of actual positive instances. Accuracy gauges the overall performance of the model, calculating the ratio of correct predictions (both true positives and true negatives) to all samples. In retinal image segmentation, accuracy evaluates the model’s competency in making accurate predictions across both positive and negative samples. While precision and recall focus on specific aspects, accuracy provides a holistic assessment of the model’s global performance. A high accuracy score signifies a well-rounded model that excels across all samples, making it a valuable metric for an overarching evaluation of the model’s proficiency [39].

3.2. Implementation Details

Our envisioned RAMS-Net was developed on the PyTorch framework and a 10 GB NVIDIA RTX 3080Ti graphics card. The loss function was optimized using the Adam [40] optimizer, and the initial learning rate of the network was set to 0.001, in which case the weight decay was set to 0.001. Given a training batch size of two, the best accuracy was achieved by iterating through 150 epochs.

3.3. Ablation Studies

We conduct ablation studies to validate the effect of each component. The visual results for different components and statistical comparisons are shown in Figure 7 and Table 1, respectively. As mentioned in Section 2, the RAMS-Net contains two critical components: the inception module (INC) and the squeeze-and-excitation module (SE). In our ablation study, we used a U2-Net network consisting of a six-stage encoder and a five-stage decoder as our Baseline.

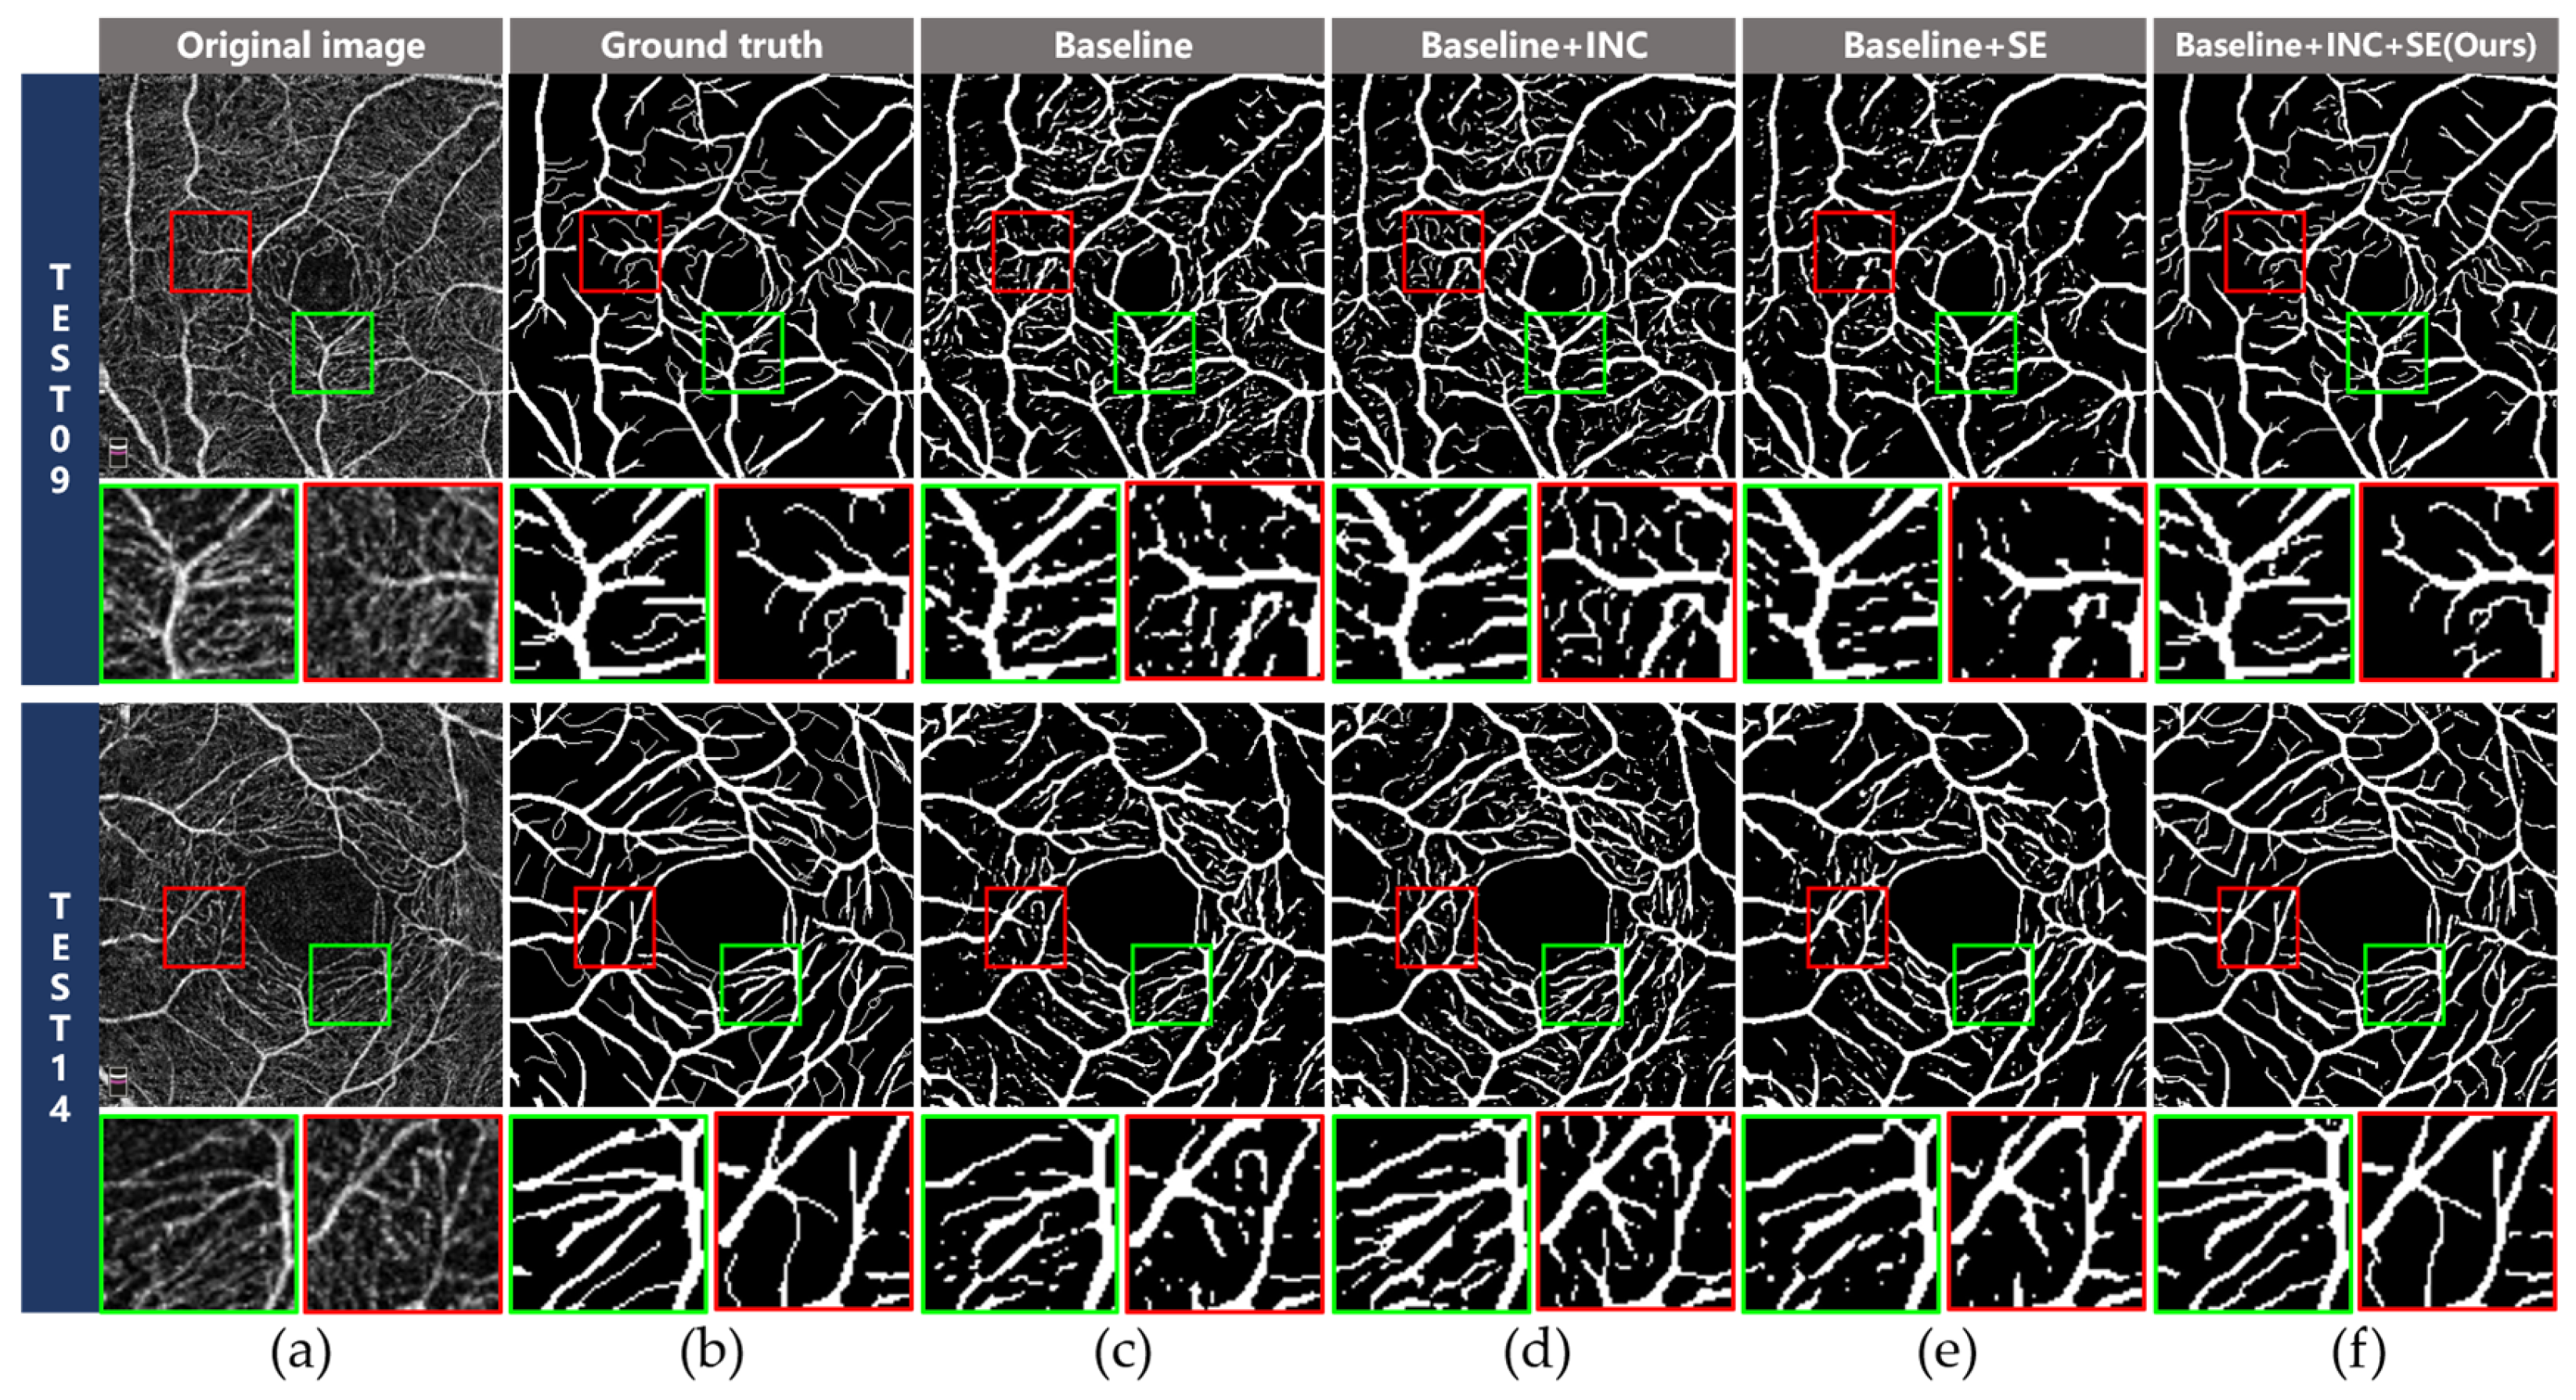
3.3.1. Effectiveness of the INC Module

We incorporated the proposed INC module into the Baseline (referred to as Baseline + INC) and applied it to the OCTA retinal angiography images dataset. Figure 7 depicts a typical example of retinal angiography segmentation results, which demonstrate that our proposed INC module can effectively segment angiography at various scales while maintaining connectivity at the vessel breaks, and the capillaries are separated intact. As shown in Table 2, compared with the Baseline, Baseline + INC improves Dice/Acc performance from 66.51%/85.15% to 67.79%/87.41%, demonstrating that multi-scale feature extraction is required to improve segmentation accuracy. Our experimental results show that the INC module allows the model to adapt to different-sized convolutional kernels and to extract more complex image features than fixed-sized kernels. In retinal angiography image segmentation, the issues with vessel blurring and vessel breaking of vessels of varying sizes were resolved.

3.3.2. Effectiveness of the SE Module

We investigated the effectiveness of the SE module. Compared with the Baseline, the proposed SE module (referred to as Baseline + SE) increases the Dice/Acc by 0.58%/1.99% (from 66.51%/85.15% to 67.09%/87.14%). As shown in Figure 7, when compared with the Baseline, the model with the SE module is able to produce results for vascular segmentation that are more reliable and comprehensive, indicating that the SE module can direct the fusion of features at various levels to extract more semantics from the target vessels while capturing a relatively complete topology. The retinal angiogram obtained by adding the SE module to the network has connectivity, and the capillaries are segmented. Our experimental results show that clear and accurate retinal angiography information is obtained with the SE module, and useless background noise information is suppressed. These findings demonstrate the efficacy of the proposed SE module in enhancing the performance of the model.
We further embedded both INC and SE into the Baseline (referred to as Baseline + INC + SE). The segmentation accuracy increased, as shown in Table 2, with an improvement of 3.74%/4.72% in terms of Dice/Acc, proving the effectiveness of the combination of INC and SE in our RAMS-Net.

3.4. Comparisons with the Other Methods

We compared our proposed RAMS-Net to six regularly utilized and cutting-edge approaches, including Bicubic + BM3D [17], U-Net [28], U-Net++ [30], TransUNet [34], OCTA-Net [35] and U2-Net [36]. We used a consistent experimental setup and training strategy for all six methods and conducted experiments on the retinal OCTA vasculature image dataset to ensure comparability and rigor in our evaluation.
The experimental results of our method and those of other competing methods on retinal OCTA vessel images are presented in Figure 8. According to the graph analysis, it is evident that traditional bicubic interpolation and the BM3D algorithm fail to effectively eliminate the influence of background noise in retinal angiography images. The blood vessel imaging corresponding to the red box selection position is blurred and difficult to distinguish. U-Net and U-Net++ can be seen in the boxed portion of the figure where only the main vessels are segmented and the vessel branches are not. In the figure for OCTA-Net, the large blood vessels are segmented but the capillaries are not. Furthermore, according to the corresponding green box selection, although TransUNet and U2-Net have clearly segmented blood vessels, there is some incorrect blood vessel segmentation information. In contrast, our RAMS-Net, shown on the far right in Figure 8, segments blood vessels of various diameters with great accuracy in recognizing capillaries and effectively extracting multi-scale characteristics. Our approach also reduces the influence of background noise, resulting in a clean blood vessel segmentation image. It is worth noting that these performance characteristics were consistent throughout several studies.

3.5. Data Augmentation Studies

To further explore the impact of data augmentation on the one-shot learning performance of RAMS-Net, we conducted an additional set of experiments. In this section, we present the results of comparing the model’s performance with and without data augmentation. Figure 9 shows that the use of data augmentation results in clearer vessel segmentation with complete vascular information. Conversely, without data augmentation, vessel information is incomplete, with disconnected vessels. As can be seen in Table 3, one-shot learning after adding data augmentation results in an improvement in metrics, confirming the effectiveness of data augmentation.

4. Discussion

We propose the RAMS-Net for the segmentation of retinal angiography images. We enhanced the structure of U2-Net by incorporating INC into the residual structure block, expanding the perceptual field, improving the overall and contextual information comprehension of the image, and gathering the global features and semantic information. The retinal angiograms acquired with the incorporation of the INC module into the network exhibit enhanced connectivity, and blood vessels of varying sizes are segmented intact. At the same time, the SE module is added for processing to extract the general semantics of target blood vessels before fusing each feature layer. Under the application of our INC and SE modules, we effectively utilize one-shot learning within our retinal angiography vessel segmentation scenario, learning from very few samples and adapting to the segmentation of new samples. This accurately segregates the vessel information against the complicated noise backdrop of retinal vessel images. The results of the experiments indicate that the network described in this study has a high level of accuracy, outperforms the majority of the currently available advanced vessel image segmentation algorithms, and is able to extract the main vessels and capillaries in retinal angiography images in a more accurate and comprehensive manner.

4.1. Advantages of RAMS-Net

  • Accurate complex vessel segmentation: RAMS-Net outperforms U-Net and U-Net++ in accurately capturing and delineating complex vascular structures, thus minimizing segmentation inaccuracies.
  • Multi-scale vascular segmentation: Thanks to the innovative INC module, RAMS-Net excels in detecting small blood vessels, surpassing U2-Net in ensuring the comprehensive segmentation of vessels across a wide range of sizes.
  • Effective noise mitigation: Due to the application of the SE module, in contrast to traditional bicubic interpolation and the BM3D algorithm, RAMS-Net effectively mitigates the impact of background noise in retinal angiography images, resulting in improved segmentation accuracy.
  • Microvascular connectivity: RAMS-Net effectively minimizes microvascular disconnectivity and incompleteness, contributing to its overall superior performance compared with OCTA-Net.
It was revealed that RAMS-Net outperforms the other six methods in terms of Dice (70.25%), Acc (89.87%), precision (67.51%), recall (73.26%), and IOU (54.14%) scores, as shown in Table 2. These metrics demonstrate favorable performance in comparison with the six advanced algorithms, supporting the effectiveness of our approach and the reliability of our model in accurately identifying and segmenting a target object. Traditional bicubic interpolation and the BM3D algorithm struggle to effectively mitigate the impact of background noise. This limitation becomes evident through observable phenomena such as blood vessel fractures and blurred vessel patterns, along with segmented results containing excessive and irrelevant noise. While U-Net and U-Net++ perform well when segmenting primarily vessels, they struggle to precisely capture and delineate complicated vascular structures, which can lead to inaccurate segmentation. OCTA-Net demonstrates the capability to distinguish between thick and thin vessels, but it faces challenges when segmenting small capillaries. The adaptation of TransUNet and U2-Net to intricate vascular architecture is hindered by restrictions arising from their network structures, despite their capacity to partition capillaries.
In contrast, the RAMS-Net method excels in detecting small blood vessels, primarily attributable to the incorporation of the innovative INC module. The INC module empowers the network to adjust its receptive field based on the input target size, facilitating effective multiscale feature extraction. Consequently, RAMS-Net demonstrates exceptional capabilities in detecting blood vessels of varying sizes, including the smallest ones. Furthermore, our RAMS-Net demonstrates a differentiation between the target and background, with the blood vessels being accurately delineated in their connectivity using the SE module. Our approach effectively minimizes non-vascular misclassification errors. It is worth noting that these performance characteristics persist consistently across multiple experiments.

4.2. Limitations

Firstly, the inclusion of additional modules may lead to an increase in the computational complexity of the network, potentially impacting its performance in real-time applications. Secondly, RAMS-Net performance is reliant on the availability and quality of training data. The utilization of more diverse and extensive datasets has the potential to further enhance its capabilities. In addition, we used the labeled images of the original dataset, and some blood vessels are not necessarily labeled accurately, and there are cases of wrong labeling and missing blood vessels. Thus, we can consider relabeling blood vessels for experiments in the future. These limitations should be taken into account in practical applications, and they also provide avenues for future research to address these issues and improve their applicability.

4.3. Future Improvements and Applications

In future research, there are several opportunities for improvement and broader applications. One avenue for advancement lies in enhancing network efficiency, with efforts focused on streamlining the network structure to reduce computational demands while preserving high segmentation accuracy. Furthermore, the extension of RAMS-Net to work with other medical imaging modalities, such as MRI, holds the potential to provide valuable insights and diagnostic capabilities in various medical fields. The exploration of transfer learning techniques to adapt the model to specific datasets or medical imaging tasks is another promising direction. This adaptability could further enhance the versatility and utility of RAMS-Net, making it a valuable tool for a wide range of medical imaging applications. In summary, our RAMS-Net offers a robust foundation for further research, with the potential to significantly contribute to the field of medical image segmentation and analysis.

Author Contributions

Conceptualization, S.L., B.G. and S.G.; methodology, B.G. and S.G.; software, B.G.; validation, J.C., S.G. and Z.G.; formal analysis, S.G. and Y.Y.; investigation, S.L.; resources, B.G.; data curation, B.G.; writing—original draft preparation, S.G.; writing—review and editing, S.G., Z.G. and B.G.; visualization, S.G. and B.G.; supervision, B.G.; project administration, S.L.; funding acquisition, S.L. All authors have read and agreed to the published version of the manuscript.

Funding

This research was funded by Tianjin Sci-Tech Projects (22YDTPJC00840).

Data Availability Statement

The data for this study were obtained from the publicly available “ROSE: A Retinal OCT-Angiography Vessel SEgmentation Dataset”. We acknowledge and adhere to the dataset’s terms and conditions. Further inquiries can be directed to the corresponding authors.

Conflicts of Interest

The authors declare no conflict of interest.

References

  1. Huang, D.; Swanson, E.A.; Lin, C.P.; Schuman, J.S.; Stinson, W.G.; Chang, W.; Hee, M.R.; Flotte, T.; Gregory, K.; Puliafito, C.A.; et al. Optical coherence tomography. Science 1991, 254, 1178–1181. [Google Scholar] [CrossRef]
  2. Sampson, D.M.; Dubis, A.M.; Chen, F.K.; Zawadzki, R.J.; Sampson, D.D. Towards standardizing retinal optical coherence tomography angiography: A review. Light Sci. Appl. 2022, 11, 63. [Google Scholar] [CrossRef] [PubMed]
  3. Li, P.; An, L.; Lan, G.; Johnstone, M.; Malchow, D.; Wang, R.K. Extended Imaging Depth to 12 mm for 1050-nm Spectral Domain Optical Coherence Tomography for Imaging the Whole Anterior Segment of the Human Eye at 120-kHz A-scan Rate. J. Biomed. 2013, 18, 016012. [Google Scholar] [CrossRef] [PubMed]
  4. An, L.; Li, P.; Lan, G.; Malchow, D.; Wang, R.K. High-Resolution 1050 nm Spectral Domain Retinal Optical Coherence Tomography at 120 kHz A-scan Rate with 6.1 mm Imaging Depth. Biomed. Opt. Express 2013, 4, 245–259. [Google Scholar] [CrossRef] [PubMed]
  5. Spaide, R.F.; Fujimoto, J.G.; Waheed, N.K.; Sadda, S.R.; Staurenghi, G. Optical coherence tomography angiography. Prog. Retin. Eye Res. 2018, 64, 1–55. [Google Scholar] [CrossRef]
  6. Hwang, T.S.; Jia, Y.; Gao, S.S.; Bailey, S.T.; Lauer, A.K.; Flaxel, C.J.; Wilson, D.J.; Huang, D. Optical coherence tomography angiography features of diabetic retinopathy. Retina 2015, 35, 2371. [Google Scholar] [CrossRef] [PubMed]
  7. Rao, H.L.; Pradhan, Z.S.; Weinreb, R.N.; Reddy, H.B.; Riyazuddin, M.; Dasari, S.; Palakurthy, M.; Puttaiah, N.K.; Rao, D.A.; Webers, C.A. Regional Comparisons of Optical Coherence Tomography Angiography Vessel Density in Primary Open-Angle Glaucoma. Am. J. Ophthalmol. 2016, 171, 75–83. [Google Scholar] [CrossRef] [PubMed]
  8. Jia, Y.; Bailey, S.T.; Wilson, D.J.; Tan, O.; Klein, M.L.; Flaxel, C.J.; Potsaid, B.; Liu, J.J.; Lu, C.D.; Kraus, M.F. Quantitative Optical Coherence Tomography Angiography of Choroidal Neovascularization in Age-Related Macular Degeneration. Ophthalmology 2014, 121, 1435–1444. [Google Scholar] [CrossRef] [PubMed]
  9. Patel, R.C.; Wang, J.; Hwang, T.S.; Zhang, M.; Gao, S.S.; Pennesi, M.E.; Bailey, B.J.; Lujan, X.; Wang, X.; Wilson, D.J. Plexus-specific detection of retinal vascular pathologic conditions with projection-resolved OCT angiography. Ophthalmol. Retin. 2018, 2, 816–826. [Google Scholar] [CrossRef] [PubMed]
  10. Vinyals, O.; Blundell, C.; Lillicrap, T.; Wierstra, D. Matching networks for one shot learning. Adv. Neural Inf. Process. Syst. 2016, 29, 3630–3638. [Google Scholar]
  11. Wu, Y.; Zheng, B.; Chen, J.; Chen, D.Z.; Wu, J. Self-learning and One-shot Learning based Single-slice Annotation for 3D Medical Image Segmentation. In International Conference on Medical Image Computing and Computer-Assisted Intervention; Springer: Cham, Switzerland, 2022; pp. 244–254. [Google Scholar]
  12. Zhang, X.; Wei, Y.; Yang, Y.; Huang, T.S. Sg-one: Similarity guidance network for one-shot semantic segmentation. IEEE Trans. Cybern. 2020, 50, 3855–3865. [Google Scholar] [CrossRef] [PubMed]
  13. Chen, X.; Lian, C.; Wang, L.; Deng, H.; Fung, S.H.; Nie, D.; Thung, K.H.; Yap, P.T.; Gateno, J.; Xia, J.J.; et al. One-shot generative adversarial learning for MRI segmentation of craniomaxillofacial bony structures. IEEE Trans. Med. Imaging 2019, 39, 787–796. [Google Scholar] [CrossRef] [PubMed]
  14. Lu, Y.; Jiang, T.; Zang, Y. Region Growing Method for the Analysis of Functional MRI Data. NeuroImage 2003, 20, 455–465. [Google Scholar] [CrossRef] [PubMed]
  15. Chudasama, D.; Patel, T.; Joshi, S.; Prajapati, G.I. Image segmentation using morphological operations. Int. J. Comput. Appl. 2015, 117, 16–19. [Google Scholar] [CrossRef]
  16. Pratondo, A.; Chui, C.K.; Ong, S.H. Integrating machine learning with region-based active contour models in medical image segmentation. J. Visual Commun. Image Represent. 2017, 43, 1–9. [Google Scholar] [CrossRef]
  17. Dabov, K.; Foi, A.; Katkovnik, V.; Egiazarian, K. Image denoising with block-matching and 3D filtering. Image Process. Algorithms Syst. Neural Netw. Mach. Learn. 2006, 6064, 354–365. [Google Scholar]
  18. Zhang, H.; Yang, J.; Zhou, K.; Li, F.; Hu, Y.; Zhao, Y.; Zheng, C.; Zhang, X.; Liu, J. Automatic Segmentation and Visualization of Choroid in OCT with Knowledge Infused Deep Learning. IEEE J. Biomed. Health 2020, 24, 3408–3420. [Google Scholar] [CrossRef]
  19. Kepp, T.; Sudkamp, H.; von der Burchard, C.; Schenke, H.; Koch, P.; Hüttmann, G.; Roider, J.; Heinrich, M.; Handels, H. Segmentation of retinal low-cost optical coherence tomography images using deep learning. SPIE Med. Imaging 2020, 11314, 389–396. [Google Scholar]
  20. Pekala, M.; Joshi, N.; Liu, T.A.; Bressler, N.M.; DeBuc, D.C.; Burlina, P. Deep learning based retinal OCT segmentation. Comput. Biol. Med. 2019, 114, 103445. [Google Scholar] [CrossRef]
  21. Yuan, X.; Huang, Y.; An, L.; Qin, J.; Lan, G.; Qiu, H.; Yu, B.; Jia, H.; Ren, S.; Tan, H.; et al. Image Enhancement of Wide-Field Retinal Optical Coherence Tomography Angiography by Super-Resolution Angiogram Reconstruction Generative Adversarial Network. Biomed. Signal Process. Control. 2022, 78, 103957. [Google Scholar] [CrossRef]
  22. López-Linares, K.; Aranjuelo, N.; Kabongo, L.; Maclair, G.; Lete, N.; Ceresa, M.; Ballester, M.A.G. Fully automatic detection and segmentation of abdominal aortic thrombus in post-operative CTA images using deep convolutional neural networks. Med. Image Anal. 2018, 46, 202–214. [Google Scholar] [CrossRef] [PubMed]
  23. Milletari, F.; Navab, N.; Ahmadi, S.A. V-Net: Fully Convolutional Neural Networks for Volumetric Medical Image Segmentation. In Proceedings of the 2016 Fourth International Conference on 3D Vision (3DV), Stanford, CA, USA, 25–28 October 2016; pp. 565–571. [Google Scholar]
  24. Zhang, J.; Liu, M.; Wang, L.; Chen, S.; Yuan, P.; Li, J.; Shen, S.G.; Tang, Z.; Chen, K.C.; Xia, J.J.; et al. Context-guided fully convolutional networks for joint craniomaxillofacial bone segmentation and landmark digitization. Med. Image Anal. 2020, 60, 101621. [Google Scholar] [CrossRef] [PubMed]
  25. Long, J.; Shelhamer, E.; Darrell, T. Fully convolutional networks for semantic segmentation. In Proceedings of the IEEE Conference on Computer Vision and Pattern Recognition (CVPR), Boston, MA, USA, 7–12 June 2015; pp. 3431–3440. [Google Scholar]
  26. Çiçek, Ö.; Abdulkadir, A.; Lienkamp, S.S.; Brox, T.; Ronneberger, O. 3D U-Net: Learning Dense Volumetric Segmentation from Sparse Annotation. In Proceedings of the 19th International Conference on Medical Image Computing and Computer-Assisted Intervention (MICCAI 2016), Part II, Athens, Greece, 17–21 October 2016; Springer International Publishing: Berlin/Heidelberg, Germany, 2016; pp. 424–432. [Google Scholar]
  27. Khened, M.; Kollerathu, V.A.; Krishnamurthi, G. Fully convolutional multi-scale residual DenseNets for cardiac segmentation and automated cardiac diagnosis using ensemble of classifiers. Med. Image Anal. 2019, 51, 21–45. [Google Scholar] [CrossRef] [PubMed]
  28. Ronneberger, O.; Fischer, P.; Brox, T. U-net: Convolutional networks for biomedical image segmentation. In Medical Image Computing and Computer-Assisted Intervention–MICCAI 2015: 18th International Conference, Munich, Germany, 5–9 October 2015, Proceedings, Part III 18; Springer International Publishing: Berlin/Heidelberg, Germany, 2015; pp. 234–241. [Google Scholar]
  29. Dai, J.; Li, Y.; He, K.; Sun, J. R-FCN: Object Detection via Region-based Fully Convolutional Networks. Adv. Neural Inf. Process. Syst. 2016, 29. [Google Scholar]
  30. Zhou, Z.; Siddiquee, M.M.R.; Tajbakhsh, N.; Liang, J. Unet++: A nested u-net architecture for medical image segmentation. In Deep Learning in Medical Image Analysis and Multimodal Learning for Clinical Decision Support; Springer International Publishing: Berlin/Heidelberg, Germany, 2018; pp. 3–11. [Google Scholar]
  31. Ktay, O.; Schlemper, J.; Folgoc, L.L.; Lee, M.; Heinrich, M.; Misawa, K.; Rueckert, D. Attention U-Net: Learning where to look for the pancreas. arXiv 2018, arXiv:1804.03999. [Google Scholar]
  32. Chen, L.C.; Zhu, Y.; Papandreou, G.; Schroff, F.; Adam, H. Encoder-decoder with atrous separable convolution for semantic image segmentation. In Proceedings of the European Conference on Computer Vision (ECCV), Munich, Germany, 8–14 September 2018; pp. 801–818. [Google Scholar]
  33. He, K.; Zhang, X.; Ren, S.; Sun, J. Deep residual learning for image recognition. In Proceedings of the IEEE Conference on Computer Vision and Pattern Recognition, Las Vegas, NV, USA, 27–30 June 2016; pp. 770–778. [Google Scholar]
  34. Chen, J.; Lu, Y.; Yu, Q.; Luo, X.; Adeli, E.; Wang, Y.; Zhou, Y. Transunet: Transformers make strong encoders for medical image segmentation. arXiv 2021, arXiv:2102.04306. [Google Scholar]
  35. Ma, Y.; Hao, H.; Fu, H.; Zhang, J.; Yang, J.; Zhao, Y.; Wang, Z.; Liu, J.; Zheng, Y. ROSE: A retinal OCT-angiography vessel segmentation dataset and new model. IEEE Trans. Med. Imaging 2020, 40, 928–939. [Google Scholar] [CrossRef]
  36. Qin, X.; Zhang, Z.; Huang, C.; Dehghan, M.; Zaiane, O.R.; Jagersand, M. U2-Net: Going deeper with nested U-structure for salient object detection. Pattern Recognit. 2020, 106, 107404. [Google Scholar] [CrossRef]
  37. Hu, J.; Shen, L.; Sun, G. Squeeze-and-excitation networks. In Proceedings of the IEEE Conference on Computer Vision and Pattern Recognition, Salt Lake City, UT, USA, 18–22 June 2018; pp. 7132–7141. [Google Scholar]
  38. Xie, S.; Tu, Z. Holistically-nested edge detection. In Proceedings of the IEEE International Conference on Computer Vision, Santiago, Chile, 13–16 December 2015; pp. 1395–1403. [Google Scholar]
  39. Mustofa, F.; Safriandono, A.N.; Muslikh, A.R. Dataset and Feature Analysis for Diabetes Mellitus Classification Using Random Forest. J. Comput. Theor. Appl. 2023, 1, 41–48. [Google Scholar] [CrossRef]
  40. Kingma, D.P.; Ba, J. Adam: A method for stochastic optimization. arXiv 2014, arXiv:1412.6980. [Google Scholar]
Figure 1. Retinal OCTA vessel segmentation dataset and annotation image: (a) original image and (b) manually marked image as ground truth [35].
Mathematics 11 04890 g001
Figure 2. Data augmentation strategies for data augmentation, including vertical flipping, horizontal flipping, random rotation, random erase, and random enhancements of brightness, noise addition, and contrast.
Mathematics 11 04890 g002
Figure 3. Illustration of our proposed RAMS-Net architecture.
Mathematics 11 04890 g003
Figure 4. Architecture diagram of the INC module.
Mathematics 11 04890 g004
Figure 5. Architecture diagram of RIU block.
Mathematics 11 04890 g005
Figure 6. Architecture of the SE module.
Mathematics 11 04890 g006
Figure 7. Visualization of ablation results from left to right: (a) original image, (b) ground truth, (c) Baseline, (d) Baseline + INC, (e) Baseline + SE, and (f) Baseline + INC + SE (ours).
Mathematics 11 04890 g007
Figure 8. Comparison of the segmentation results of different algorithms on the retinal OCTA vasculature images dataset from left to right: (a) original image, (b) ground truth, (c) Bicubic+BM3D, (d) U-Net, (e) U-Net++, (f) TransUNet, (g) OCTA-Net, (h) U2-Net, and (i) RAMS-Net (ours).
Mathematics 11 04890 g008
Figure 9. Impact of data augmentation on one-shot learning performance from left to right: (a) original image, (b) ground truth, (c) no data augmentation, and (d) data augmentation.
Mathematics 11 04890 g009
Table 1. Statistical comparison of ablation studies on the OCTA retinal angiography images dataset.
MethodDice (%)Acc (%)Precision (%)Recall (%)IOU (%)
Baseline66.51 ± 0.0585.15 ± 0.1358.89 ± 0.2568.39 ± 0.0349.82 ± 0.17
Baseline + INC67.79 ± 0.0487.41 ± 0.0461.36 ± 0.0271.29 ± 0.0750.14 ± 0.04
Baseline + SE67.09 ± 0.0387.14 ± 0.0760.14 ± 0.0970.86 ± 0.1250.48 ± 0.08
Baseline + INC + SE (ours)70.25 ± 0.0189.87 ± 0.0267.51 ± 0.0373.26 ± 0.0454.14 ± 0.01
Bolded values represent the best obtained scores for each metric.
Table 2. Statistical comparison with state-of-the-art methods on the retinal vasculature images dataset.
MethodDice (%)Acc (%)Precision (%)Recall (%)IOU (%)
Bicubic+BM3D64.57 ± 0.1785.03 ± 0.1954.63 ± 0.0858.94 ± 0.2347.68 ± 0.05
U-Net64.05 ± 0.0478.58 ± 0.1160.21 ± 0.0658.89 ± 0.0347.12 ± 0.10
U-Net++56.85 ± 0.0479.47 ± 0.0354.89 ± 0.0558.93 ± 0.0750.20 ± 0.05
TransUNet65.28 ± 0.0279.32 ± 0.0664.53 ± 0.0358.07 ± 0.0448.46 ± 0.16
OCTA-Net65.49 ± 0.0379.59 ± 0.1166.64 ± 0.0257.17 ± 0.0648.69 ± 0.04
U2-Net66.51 ± 0.1285.15 ± 0.0158.89 ± 0.0768.39 ± 0.0449.82 ± 0.13
RAMS-Net (ours)70.25 ± 0.0189.87 ± 0.0267.51 ± 0.0373.26 ± 0.0454.14 ± 0.01
Bolded values represent the best obtained scores for each metric.
Table 3. Statistical comparison of the effect of data augmentation on one-shot learning performance.
MethodDice (%)Acc (%)Precision (%)Recall (%)IOU (%)
No data augmentation54.65 ± 0.0471.14 ± 0.1150.23 ± 0.0860.34 ± 0.0353.35 ± 0.07
Data augmentation70.25 ± 0.0189.87 ± 0.0267.51 ± 0.0373.26 ± 0.0454.14 ± 0.01
Bolded values represent the best obtained scores for each metric.
Disclaimer/Publisher’s Note: The statements, opinions and data contained in all publications are solely those of the individual author(s) and contributor(s) and not of MDPI and/or the editor(s). MDPI and/or the editor(s) disclaim responsibility for any injury to people or property resulting from any ideas, methods, instructions or products referred to in the content.

