Abstract
This paper deals with the construction of a discrete dynamic population model addressed to estimate the expected size of the immigration population in a finite short period of time in Spain. By paying attention to a special subpopulation of interest, such as an irregular immigrant, unaccompanied minor immigrant and regular immigrant, a vector discrete population model is built after the discussion and introduction of proper hypotheses linked to economy, host and country of origin regulation policies, political interest and others. The model allows us to study the change of the results under variation of the parameters.
Keywords:
mathematical immigration population model; discrete dynamical model; difference system; robustness parameter simulation MSC:
39A06; 39A60; 97M10; 97M70
1. Introduction
The movement of human populations is an ancient universal phenomenon that involves moving from places with worse possibilities of life to others where they are better, perhaps due to climate conditions or to access resources, and this phenomenon has always been linked with human evolution. Even when humans stopped living a nomadic lifestyle and settled, major advances were made in agriculture, taming animals, dividing work, and also in the invention of more efficient hunting weapons and tools to make life easier [1,2,3,4].
Evidently there are certain similarities in human population movements and those of animals, such as searching for food and water, or suitable climates to better reproduce. However, differences stemming from the effect of the culture, religion, policies of human societies are also evident [5], which makes modelling the movement of human and animal populations difficult. However, it is still necessary to study this phenomenon to avoid crises, poverty and social pressure. The movement of animal populations also occurs due to fleeing from and due to the fear of predators, which is the opposite to having to move to search for a resource gradient which, with the movements of human populations, occurs by fleeing from war zones. Thus the role of invaders’ arms is similar to the role of animal predators hunting their prey. The wars of Libya, Iraq, Syria, Afghanistan, etc., have led millions of people to move away from war zones. After World War II, it was estimated that more than 30 million people had moved all over the European continent.
The 20th century has been a century filled with major migratory movements with wars in Yugoslavia in 1980 and 1990, apart from the two World Wars [6]. Migratory movements are frequent on frontiers between Mexico and the USA, although the migrant population comes from Central American countries, and something similar occurs from South-eastern Asia to Australia, to mention just a few. Other types of migratory movements take place for politico-economic reasons. One such case is millions of people from Venezuela fleeing to other South American countries, or an exodus background in Mariel Port in Cuba in 1980, where thousands of Cubans were allowed to flee to Florida because of a conflict that arose from the Peruvian Embassy in Havana. Migratory phenomena take place to escape political repression whenever dictatorial governments appear. The fact that no migratory policy exists in the European Union (EU) means that some politics use the migration phenomena as political weapons to provoke artificial population movements on EU frontiers in exchange for economic and/or political compensation. For instance, the Turkish President Erdogan places pressure on Syrian immigrants for them to the EU in exchange for money and political advantages. Belarus President Lukasenko does something similar by taking immigrants to the frontier with Poland for the EU to do away with the political sanctions that it has placed on his country, and he is supported by Russia. Moreover, mafias do business with the migratory phenomenon by charging immigrants to take them to EU borders. This takes place in permissive countries with immigration like Spain. All this makes the migratory movements of human populations much more complex than those of animals, and they need to be more carefully analysed.
Despite the wide range of cases in different continents and periods of time, migratory population movements share common characteristics that allow migratory models to be built. By way of example, we cite the reference of E. Ravenstein [7] and his basic migration laws. Later, Lee [8] reviewed Ravenstein’s laws from the 19th century and proposed new analytical aspects. Migratory movements are multidisciplinary, and include economics, demography, geography, politics, psychology and sociology, among others.
A dynamic mathematical model of migration is an approach to the reality, but described in mathematical terms, in which relevant variables, populations and movements are quantified in equations that predict the magnitude of relevant populations. As this is an economic-social phenomenon, and because the economy is susceptible to analyse macro- and microlevels, these approaches produce different types of models [9]. At the macrolevel, the migration pattern of a whole population or of certain social groups is studied in the context of a given territory, and is based on census data or statistics. Possible changes are analysed in different economic growth scenarios in the countries that emigrate. At the microlevel, studies centre on individuals’ migratory behaviour in an attempt to explain potential immigrants’ decision-making process. By bearing in mind the modelling approach, we can distinguish stochastic or determinist models that are predicted or assumed either with or without ambiguity or uncertainty according to changes that take place among the involved populations.
It is also possible to distinguish between static and dynamic depending on whether interactions change with time or remain set. We can also distinguish dynamic models as being continuous or discrete in accordance with changes over time being measured as continuous or discrete variables. This leads to mathematical models being described by differential equations of partial derivatives for continuous cases, or by difference equations or dynamic discrete systems for discrete models. Abstract approaches based on the principles of Physics, such as Newton’s Law of Gravitation, give way to the so-called gravitational models [10]. Lee’s models consider factors for and against migrants’ movements between two areas and the corresponding occurrence probabilities. Other abstract models based on the Systems Theory [11,12] and the Complex Systems Theory can be found [13].
The movement of human populations has been the centre of attention and research for many years. Initially, interest was shown due to the concerns for the possible negative consequences of accessing few resources due to uncontrolled population growth [14,15]. The fact that a resources gradient mobilises populations has enabled mathematical models to be developed for ecological populations’ spatio-temporal dynamics [15,16], which act as a starting point to describe human populations [17,18,19], employing models described by fuzzy partial derivative equations where the fuzzy term corresponds to the individuals’ random movement [20]. In the present article, we build a discrete deterministic mathematical model to quantify the immigrant population in Spain during a relatively short finite time to put forward reliable economic hypotheses during the study period. More specifically, the presented mathematical model is a difference equations system. This method was developed while processing other recent social problems, such as spreading addictions [21,22], school bullying [23] or political corruption [24]
This paper is organized as follows: Section 2 deals with the statement of hypotheses, the identification of relevant sub populations involved in the immigration phenomenon, the selection of main drivers, and the study of the dynamic sub population changes. Theses issues allow the construction of a vector discrete dynamic population model. Numerical results sizing the evolution of each sub population are shown. As some of the drivers are difficult to calibrate accurately, it is convenient to introduce simulations in order to study the robustness of the results under small changes of these parameters. In addiction, Section 2.3 includes an estimation of the social budget needed to attend and care for the sub population of unaccompanied minor immigrants. Section 3 addresses the conclusions of the paper.
2. Hypothesis, Model Construction and Results
Recent war conflicts in Middle East and Africa North have increased the amount of migrant populations in Europe due to the lack of a unified migrant policy in the European Union (EU). European Mediterranean countries are especially gates for immigrants, in particular Greece, Italy and Spain. Recently, Turkey and Poland have become hot places due to political interest conflicts among EU and other neighbour countries such as the Republic of Belarus.
For the case of Spain, we focus our interest on the immigration of minors due to the combination of social, political and humanitarian issues. An unaccompanied minor is a child or adolescent younger than 18 years who migrates without their legal guardians (UAM). Our target population is all of the immigrant population in Spain, split into three subpopulations: unaccompanied minor, irregular and regular migrants.
An important issue is the length of the period of time, not only in order to get reliable results but also because it is necessary for assuming economic hypotheses in the next few years. Our period of study starts in December 2018 and ends in December 2025.
We split the time period in semesters where corresponds to December 2018 and denotes the end of the period. Let us denote the three dimensional population vector
where means the amount of unaccompanied minor immigrants in Spain at the end of the n-th semester, represents the amount of irregular adult immigrants in Spain at the end of the n-th semester and denotes the amount of regular immigrants in Spain at the end of the n-th semester.
The population transition is derived from the equation
The transit from the n-th to -th semester depends on several main factors: economy, politics, trend in recent past, regulation laws in Spain, and age of immigrants for the case of an unaccompanied minor migrant when they become 18 years old transiting to adulthood.
2.1. Matching Modelling Flows
We begin by matching the historic data from 1999 to 2020, acquired from the Statistics Spanish Institute [25], Homeland Spanish Ministry [26], and the statistics web page [27]. Table 1 contains the quoted data registered yearly.

Table 1.
Incoming Irregular Immigration.
Paying attention to the data, one can identify a global increasing linear trend combined with an eight year periodic behaviour corresponding with the change of the Spanish government. In addition, three eventual jumps corresponding to pull effects due to decisions of the Spanish or Morocco governments appear. These jumps are the Cayuco crisis in the Canary Islands in 2006. Later, in June 2018, it appeared due to a kind of call effect coincident with the arrival of a new government in Spain, and in November 2020 with a new characteristic of an important population of unaccompanied minor immigrants. These empirical evidences suggest matching the historic data to a parametric function of the type
Since the linear part behaviour is chosen so that the value at the time where the first government change occurs in our period of study, the summer of 2004, and the data in Table 1 gives us this value, we only need one parameter capturing the slope to match the data. The periodicity part described by the sine-square sinusoidal function requires another parameter measuring the intensity of the wave. The other three remaining parameters correspond with the intensity of the three historic jumps described by the Gaussian functions centred at the historic times and the small width parameters capturing the peaks .
Once the parametric matching function is modelled using the Find Fit Mathematica algorithm, one gets the fitting parameters
Figure 1 shows the point cloud and the matching function given by (3) and (4) describes the incoming irregular immigration behaviour.
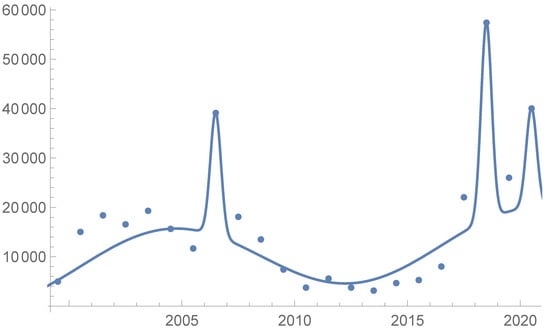
Figure 1.
Incoming irregular immigration.
Now we address the model fitting of the net balance legal migratory behaviour in Spain for the period of study linked to the economy of the host country, Spain. The chosen economic indicator is the unemployment rate.
In Table 2, we enclose the data of the net legal immigration balance and the unemployment rate per semester.
Table 2.
Net Balance vs. Unemployment rate.
Figure 2 shows the point cloud net balance y versus unemployment rate per semester x and suggests a linear correspondence . The resulting least mean square matching function becomes
with a Pearson’s correlation coefficient .
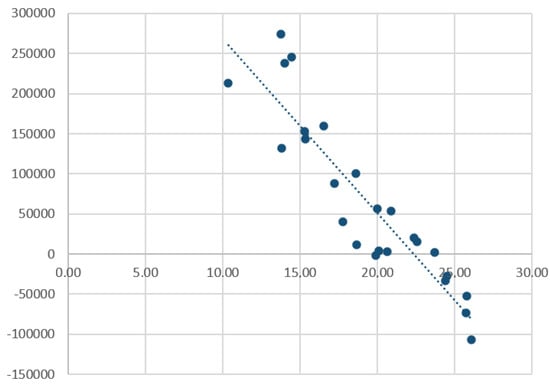
Figure 2.
Linear correspondence between unemployment rate and net legal migration balance.
Matching of both the irregular and regular incoming immigration using historic data has been performed, but as the period of study is covered until December 2025, we need to assume reasonable hypotheses with respect to both factors: the economy behaviour and the host government profile. Here it becomes clear as to why it is important to manage a short period of time in order to describe a realistic social neighbourhood.
Dealing with the irregular incoming immigration, we assume:
H1:
There is no change of political government profile from 2018 to 2025, as it occurs in Spain in the last quarter of century.
In the last years, sudden jumps took place in summer for the incoming immigration population, we therefore assume:
H2:
There are summer jumps of the incoming immigration population from 2021 to 2025, with the same intensity of the year 2018.
These hypotheses mean that in the historic matching function (3) and (4), we add five terms corresponding to the summertime from 2021 to 2025, resulting in
Figure 3 represents the incoming irregular population for the complete period after assuming the quoted hypotheses.
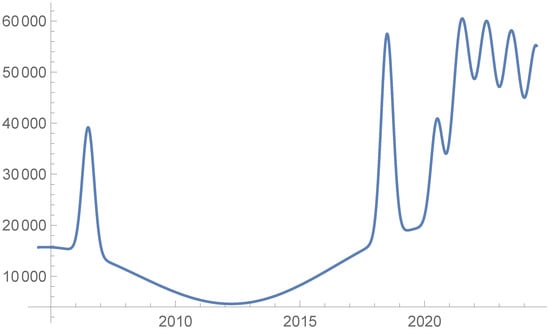
Figure 3.
Incoming irregular immigration forecast.
Taking into account the economic forecast of the International Monetary Fund (IMF), and the one of the Spanish economic organization FUNCAS, we assume the expected unemployment rates for the period 2021–2025, listed in Table 3.
Table 3.
Expected unemployment rates for the period 2021–2025.
H3:
Assuming that the linear correlation among the economy and regular immigration balance is the one described by (5).
Once the hypotheses about the uncertain factors have been stated, in the next subsection we develop the mathematical model construction.
2.2. Model Construction
The dynamics of the immigration population change described symbolically by (2) is going to be explicitly developed for each subpopulation. The variation from semester n to the -th, of the UAM population is as follows. Population is equal to one of the previous semesters plus the new arrivals and minus the amount of minor individuals who transit to legality once they achieve adulthood.
where is the proportion of the population achieving adulthood, which, according to historic data, has been calibrated as
In (7), represents the incoming irregular immigration flow throughout the n-th semester ending at the beginning of -th semester. Thus, taking into account the matching function given in (6), one gets .
Coefficient means the proportion of UAM people of all the irregular incoming immigration population . Although the value of is difficult to estimate and surely variable, we have used the known historical data from [27], obtaining its real value up to and we have calibrated it for . This value is
In spite of the difficulty of estimating this coefficient , we will later study the change of the results of the model under the change of this coefficient.
The variation of the adult irregular immigrants is given by
where is the proportion of adult irregular immigrants who achieve legality during the n-th semester. This coefficient has been calibrated, taking into account several regularization items such as social roots, labour, or family roots and political asylum criteria, Ref. [25], and obtaining the estimation
Finally, the variation of the regular immigrant population is described by
where is the amount of incoming regular immigrants.
Summarizing, the dynamic change of all the populations can be written in a vector compact form
where is given in (1), and
The initial population corresponding to at the end of 2018 is given by
see [25].
2.3. Results, Simulations and Applications
The mathematical model (8)-(9)-(11)-(13)-(16) allows for the explicit and direct computation of the population vector starting from . Table 4 below shows the results.
Table 4.
Subpopulations in the studied period.
Figure 4 shows the population evolution during the period of study.
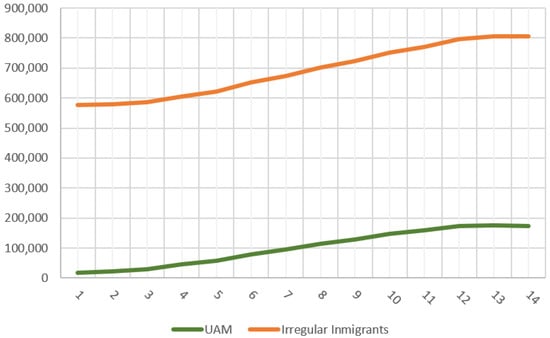
Figure 4.
Population evolution.
Theory of perturbation of solution of difference systems under parameter perturbation [28] guarantees that a small variation of the parameters yields a small variation of the population vector . The following Figure 5 and Figure 6 show the dynamic change under parameter perturbation of the population due to the outstanding social and humanitarian interest, although the simulation is available for all of the subpopulations.
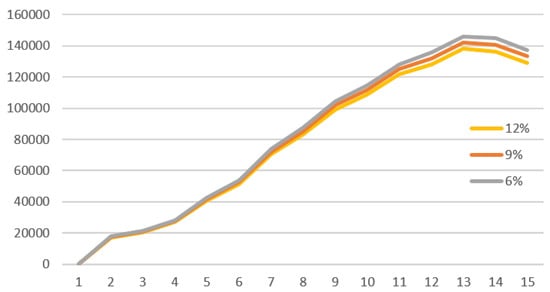
Figure 5.
Comparative results for the different for the UAM population.
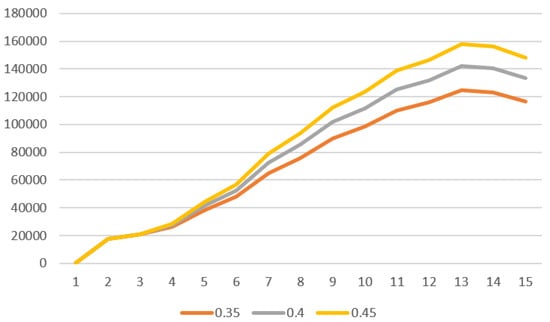
Figure 6.
Comparative results for the different for the UAM population.
One of the most important and direct applications of the model is the estimation of the budget of the Spanish Ministry of Inclusion, Social Security and Migrations, for the next few years, related to the care of the unaccompanied minor population. Although the cost per UAM depends on the region of the country (for instance, in Madrid or Barcelona it is much higher than in Andalucía) a lower average estimated monthly cost of EUR 2000 per UAM yields the following budget evolution, see Table 5.
Table 5.
Semester approximate economic cost for the care of the UAM population.
3. Conclusions
There are some relevant facts related to the mathematical model constructed in the paper.
The first conclusion is to quantify the expected size of the subpopulation of irregular immigrants, unaccompanied minor immigrants, and regular immigrants, not only at the end of the period but for each semester. Apart from economy and the regulation laws of the host country, political issues are relevant from both the host and the country of origin. In addition, there is a business effect, because, due to humanitarian reasons, some organizations make money helping irregular immigrants achieve their destination. Historic data are collected under these influences, which means that they follow a pattern and are not data without information. This fact allows us to suggest matching functions of certain types.
The second conclusion is that the model allows the possibility to simulate the changes of the results by introducing changes of the parameters. As has been shown, the results can be useful to estimate the social budgets of governments.
Finally, the paper suggest a way to construct models to study the immigration in other geographical areas, taking into account the peculiarities of the region.
Author Contributions
Conceptualization, S.T., R.C. and L.J.; Investigation, S.T. and L.J.; Methodology, S.T., R.C. and L.J.; Project administration, R.C.; Software, S.T., R.C. and L.J.; Supervision, S.T. and L.J.; Writing—original draft, S.T., R.C. and L.J.; Writing—review & editing, S.T., R.C. and L.J. The authors contributed equally to this work. All authors have read and agreed to the published version of the manuscript.
Funding
This research has been funded by the Spanish Ministerio de Economía, Industria y Competitividad (MINECO), the Agencia Estatal de Investigación (AEI) and Fondo Europeo de Desarrollo Regional (FEDER UE) grant MTM2017-89664-P.
Conflicts of Interest
The authors declare no conflict of interest.
References
- Turney, C.S.; Brown, H. Catastrophic early Holocene sea level rise, human migration and the Neolithic transition in Europe. Quat. Sci. Rev. 2007, 26, 2036–2041. [Google Scholar] [CrossRef]
- Graf, K.E. Hunter-gatherer dispersals in the mammoth-steppe: Technological provisioning and land-use in the Enisei River valley, south-central Siberia. J. Archaeol. Sci. 2010, 37, 210–223. [Google Scholar] [CrossRef]
- Kupiszewski, M.; Kupiszewska, D. MULTIPOLES: A revised multiregional model for improved capture of international migration. In Population Dynamics and Projection Methods; Springer: Dordrecht, The Netherlands, 2011; pp. 41–60. [Google Scholar]
- Rogers, A. Introduction to Multiregional Mathematical Demography; Krieger Publishing Company: Malabar, FL, USA, 1975. [Google Scholar]
- Turchin, P.; Currie, T.E.; Turner, E.A.; Gavrilets, S. War, space, and the evolution of Old World complex societies. Proc. Natl. Acad. Sci. USA 2013, 110, 16384–16389. [Google Scholar] [CrossRef] [PubMed]
- Weimer, D.R. A flexible, IMF dependent model of high-latitude electric potentials having “space weather” applications. Geophys. Res. Lett. 1996, 23, 2549–2552. [Google Scholar] [CrossRef]
- Ravenstein, E.G. The laws of migration. J. Stat. Soc. Lond. 1885, 48, 167–235. [Google Scholar] [CrossRef]
- Lee, E.S. A theory of migration. Demography 1966, 3, 47–57. [Google Scholar] [CrossRef]
- Aleshkovski, I.A. Illegal Immigration as a Structural Factor of Global Development; Grinin, L.E., Ilyin, I.V., Korotayev, A.V., Eds.; Uchitel Publishing House: Volgograd, Russia, 2013; pp. 243–256. [Google Scholar]
- Ninković, V.; Keković, Z. Dynamic Migration Flow Modelling. Secur. Dialogues 2017, 8, 149–167. [Google Scholar]
- De Haas, H. Irregular Migration from West Africa to the Maghreb and the European Union: An Overview of Recent Trends; International Organization for Migration: Geneva, Switzerland, 2008; Volume 32. [Google Scholar]
- Caselles, A.; Sanz, M.T. Trying to control migration between zones in the world. In Proceedings of the 2019 4th World Conference on Complex Systems (WCCS), Ouarzazate, Morocco, 22–25 April 2019. [Google Scholar]
- Chávez, J.C.; Rodríguez, J.C.; Wilkie, J.W. A System Dynamics Model of Employment and Migration for Michoacán. PROFMEX J. Mex. World 2011, 17. [Google Scholar]
- Malthus, T.R.; Winch, D.; James, P. Malthus: An Essay on the Principle of Population; Cambridge University Press: Cambridge, UK, 1992. [Google Scholar]
- Murray, J.D. Mathematical Biology I. An Introduction; Springer Science & Business Media: Berlin/Heidelberg, Germany, 2002. [Google Scholar]
- Malchow, H. Spatiotemporal Patterns in Ecology and Epidemiology: Theory, Models, and Simulation; Chapman and Hall/CRC: Boca Raton, FL, USA, 2007. [Google Scholar]
- Shigesada, N.; Kawasaki, K. Biological Invasions: Theory and Practice; Oxford University Press: Oxford, UK, 1997. [Google Scholar]
- Turchin, P. Quantitative Analysis of Movement; Sinauer: Sunderland, MA, USA, 1998. [Google Scholar]
- Hengeveld, R. Dynamics of Biological Invasions; Springer Science & Business Media: Berlin/Heidelberg, Germany, 1989. [Google Scholar]
- Volpert, V.; Petrovskii, S.; Zincenko, A. Interaction of human migration and wealth distribution. Nonlinear Anal. 2017, 159, 408–423. [Google Scholar] [CrossRef]
- De la Poza, E.; Del Líbano, M.; García, I.; Jódar, L.; Merello, P. Predicting workaholism in Spain: A discrete mathematical model. Int. J. Comput. Math. 2014, 91, 233–240. [Google Scholar] [CrossRef][Green Version]
- Merello, P.; De la Poza, E.; Jódar, L. Explaining shopping behavior in a market economy country: A short-term mathematical model applied to the case of Spain. Math. Methods Appl. Sci. 2020, 43, 8089–8104. [Google Scholar] [CrossRef]
- De la Poza, E.; Jódar, L.; Ramírez, L. Modelling bullying propagation in Spain: A quantitative and qualitative approach. Qual. Quant. 2018, 52, 1627–1642. [Google Scholar] [CrossRef]
- De la Poza, E.; Jódar, L.; Merello, P. Modeling Political Corruption in Spain. Mathematics 2021, 9, 952. [Google Scholar] [CrossRef]
- National Statistics Institute (INE). Continuous Register Statistic. 2020. Available online: https://www.ine.es (accessed on 1 July 2020).
- Ministerio del Interior. 2020. Available online: http://www.interior.gob.es (accessed on 1 July 2020).
- Web Statista. 2020. Available online: https://es.statista.com/temas/5988/inmigracion-ilegal-en-espana (accessed on 1 July 2020).
- Agarwal, R.P. Difference Equations and Inequalities: Theory, Methods, and Applications; CRC Press: Boca Raton, FL, USA, 2000. [Google Scholar]
Publisher’s Note: MDPI stays neutral with regard to jurisdictional claims in published maps and institutional affiliations. |
© 2022 by the authors. Licensee MDPI, Basel, Switzerland. This article is an open access article distributed under the terms and conditions of the Creative Commons Attribution (CC BY) license (https://creativecommons.org/licenses/by/4.0/).