What Biological Visualizations Do Science Center Visitors Prefer in an Interactive Touch Table?


Department of Science and Technology (ITN), Linköping University, Campus Norrköping, Norrköping 60174, Sweden
*
Author to whom correspondence should be addressed.
Educ. Sci. 2018, 8(4), 166; https://doi.org/10.3390/educsci8040166
Submission received: 30 June 2018
/
Revised: 3 September 2018
/
Accepted: 24 September 2018
/
Published: 6 October 2018
(This article belongs to the Special Issue Biology Education)
Abstract
:Hands-on digital interactivity in science centers provides new communicative opportunities. The Microcosmos multi-touch table allows visitors to interact with 64 image “cards” of (sub)microscopic biological structures and processes embedded across seven theme categories. This study presents the integration of biological content, interactive features and logging capabilities into the table, and analyses visitors’ usage and preferences. Data logging recorded 2,070,350 events including activated category, selected card, and various finger-based gestures. Visitors interacted with all cards during 858 sessions (96 s on average). Finger movements covered an average accumulated distance of 4.6 m per session, and about 56% of card interactions involved two fingers. Visitors made 5.53 category switches per session on average, and the virus category was most activated (average 0.96 per session). An overall ranking score related to card attractive power and holding power revealed that six of the most highly used cards depicted viruses and four were colourful instrument output images. The large finger traversal distance and proportion of two-finger card interaction may indicate the intuitiveness of the gestures. Observed trends in visitor engagement with the biological visualizations are considered in terms of construal level theory. Future work will examine how interactions are related to potential learning of biological content.
1. Introduction
The digital revolution is providing novel ways for communicating scientific knowledge to citizens. This raises the hypothesis that hands-on interactive exploration in digital science center contexts could provide new knowledge-building experiences. Herein, one advantage of interactive science center exhibits is their potential to induce engagement through curiosity and exploration [1,2]. In turn, doing so also offers citizens new opportunities for engaging and learning about objects, processes and systems that are beyond direct human vision [3]. Recent research indicates that interactions afforded by modern technologies play a critical and highly relevant role in scientific meaning-making [4]. Moreover, recent work [5,6,7] also shows that analytical tools that track and log users’ behavioural interactions can produce fine-grained information about how bodily processes of interaction could map onto processes of engagement and learning.
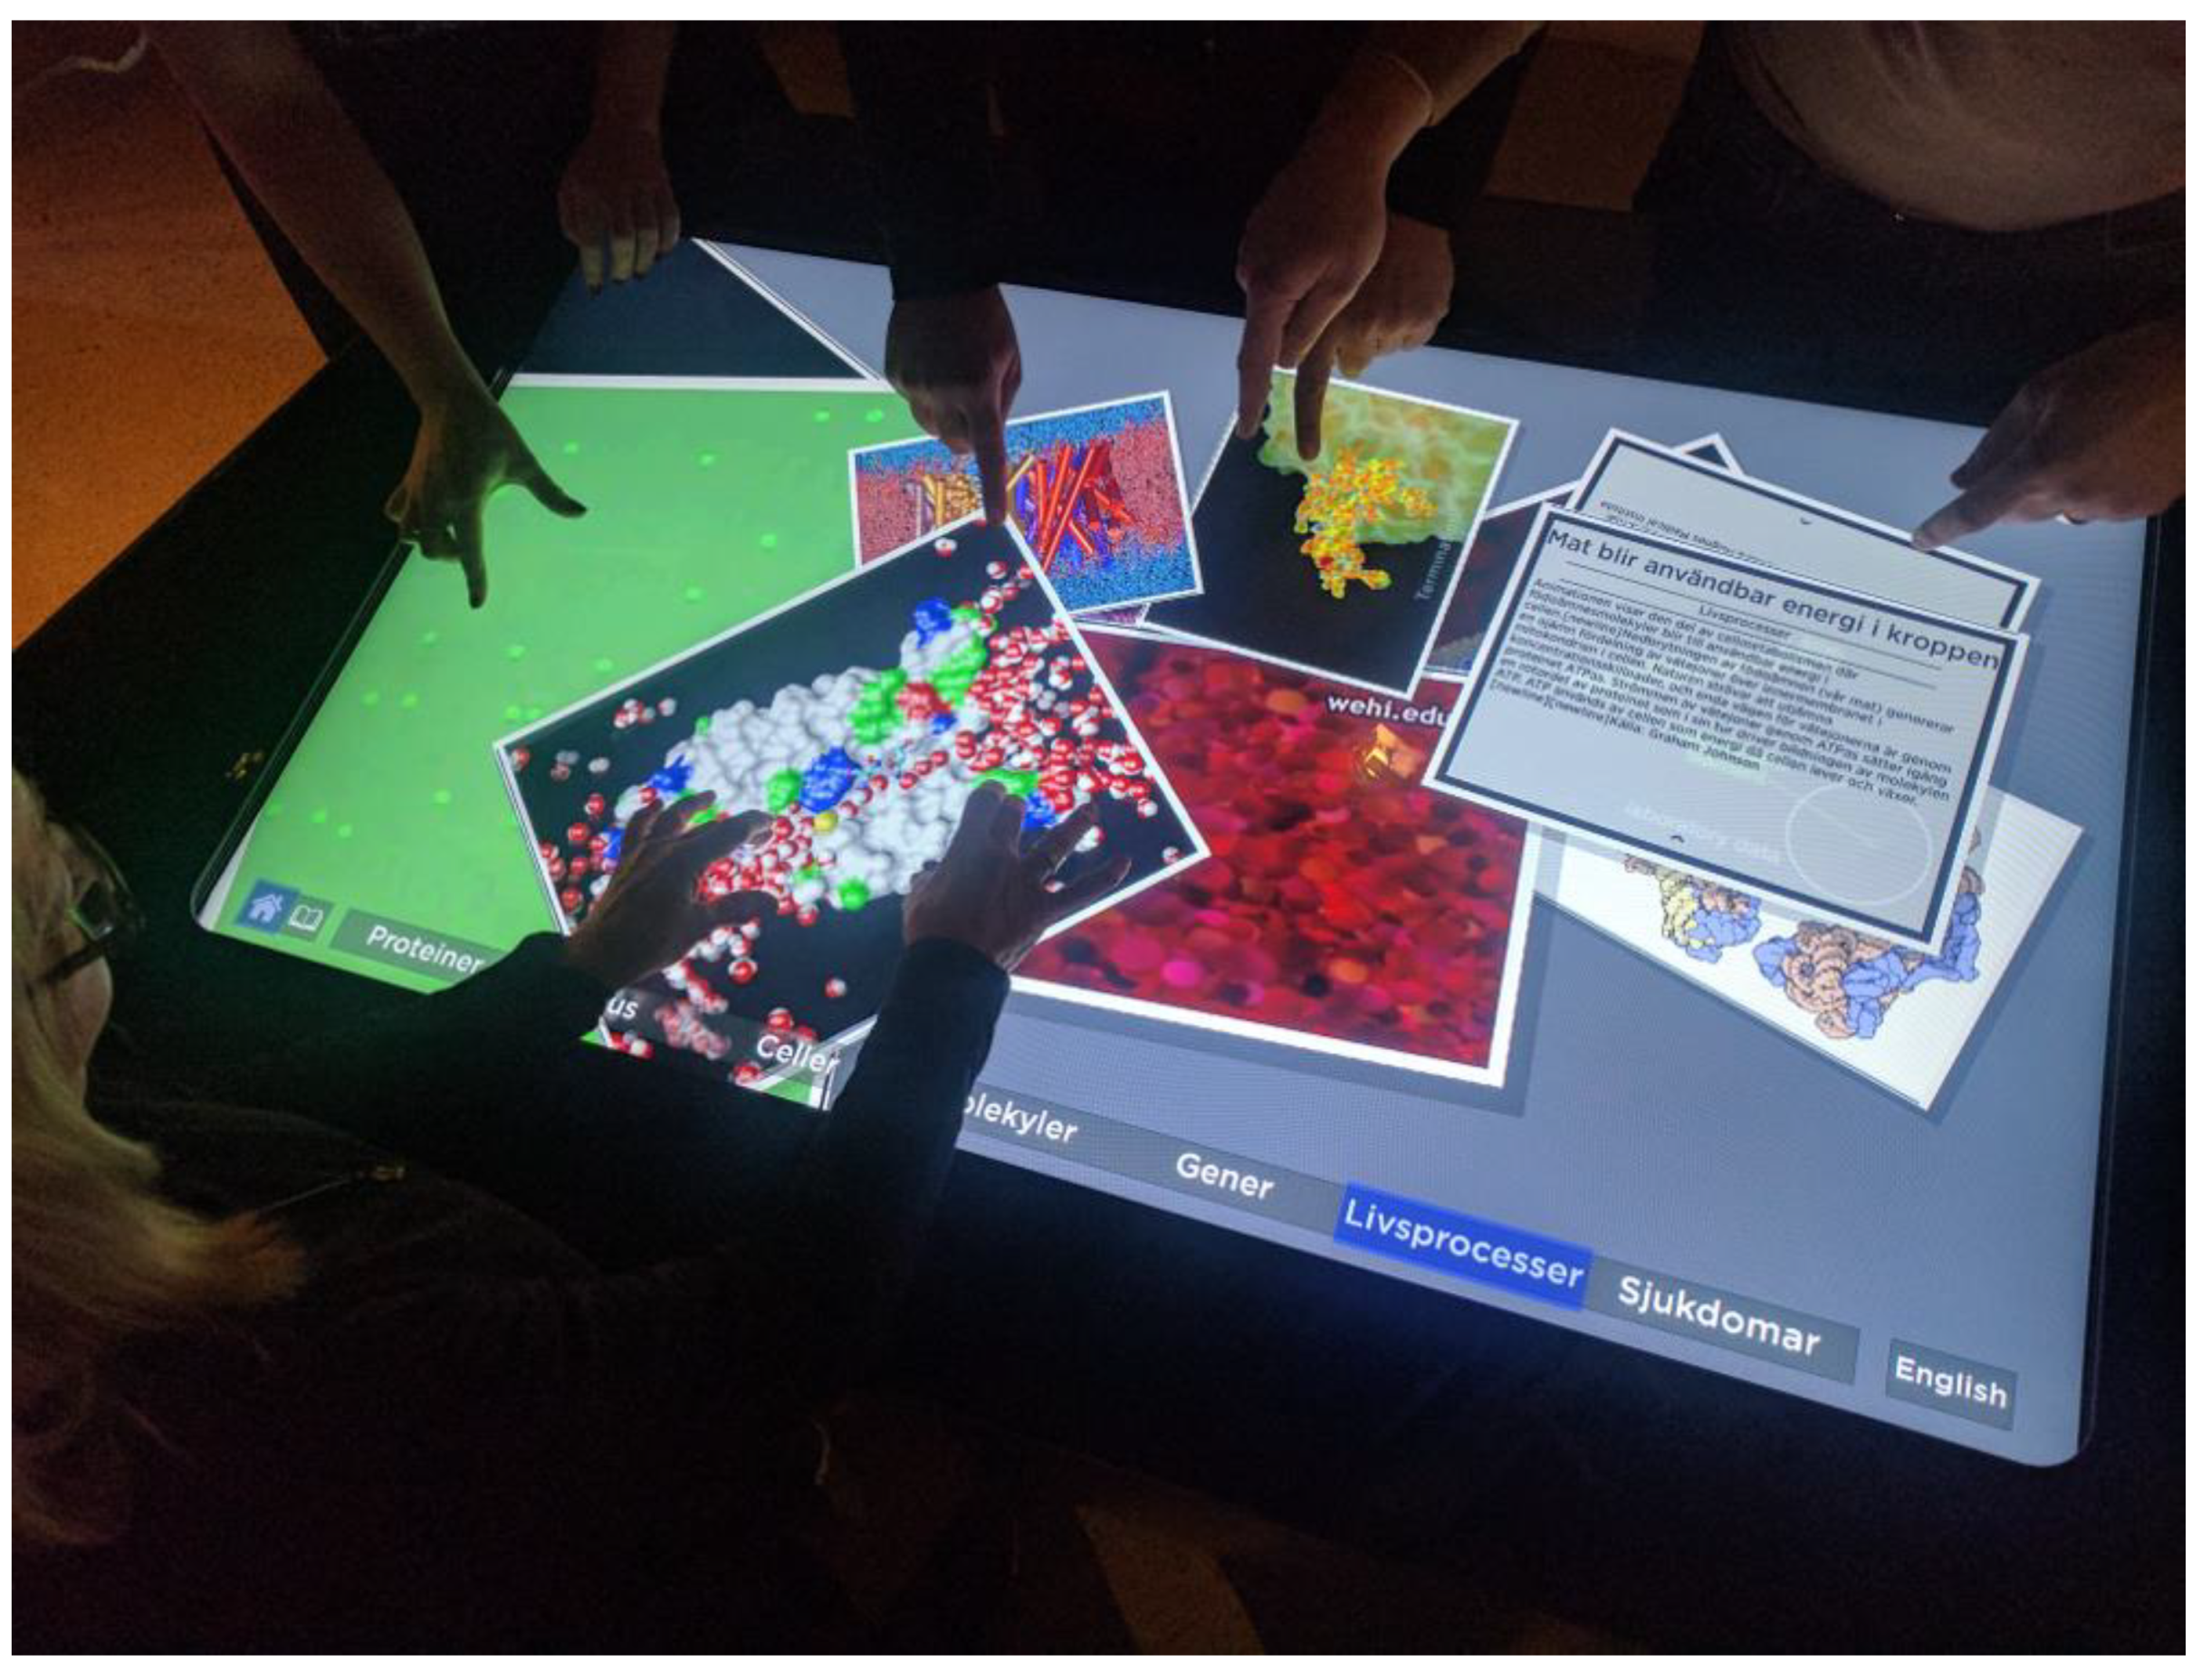
Modern science center and museum environments across the world such as Science Centre Singapore and London’s Science Museum, incorporate various immersive interactive exhibits to communicate science, allowing for new active opportunities for engagement and discovery [8]. The Visualization Center C in Sweden develops interactive visualization platforms to communicate scientific phenomena. One such technology is the digital table interface, which affords multi-touch interaction with embedded content. For example, the “Microcosmos” table (Figure 1) has been developed to provide public visitors with an individual and/or collaborative opportunity to access, view and manipulate embedded visualizations of (sub)microscopic biological structures and processes.
As curators and pedagogues aim to pursue the communicative and potential educational benefits of museum and science center environments in the digital age, increasing research attention is on measuring aspects such as attraction, engagement, holding power and dwell time of interactive exhibits [9,10,11,12]. Another developing area is probing how visitors actually use and interact with the digital platforms, and what the nature of interaction may eventually imply for learning [5,7,13].
This paper reports the first findings from an overall research programme investigating how visual content can be incorporated into an interactive digital touch table to communicate (sub)microscopic biological phenomena. In addition, the research aims to explore the preference and engagement attributes of the embedded biological visualizations through logging visitors’ interaction with features and content of the table interface. The future phase of the work will examine how users’ interactions are related to any potential learning of biological concepts and processes.
1.1. Research on Interactive Multi-Touch Tables in Science Center and Museum Settings
Digital interactivity is changing the way scientific content is discovered, accessed, communicated and explored [14,15]. Experiences afforded by modern digital technologies play a critical role in how science topics evoke interest and engagement during individual and collaborative interaction [12,16,17]. The last decade or so has witnessed the rapid emergence of finger-based multi-touch tables (e.g., Figure 1) as communication interfaces in science centers and museums [12,13,18]. In such contexts, touch interfaces are more than mere “modes of display”—they physically and digitally mediate between science communicator and user through various interactive features [8,19]. At the same time, given that interactive digital platforms respond dynamically to user inputs, researchers are finding it increasingly relevant to explore what choices users make during interaction [20]. In this regard, data logging techniques offer a means to obtain information about how users interact with a system. Recently, logging has been applied to research contexts where real-time recording of user actions reveals fine-grained detail about interactive and exploratory preferences [5,6,7,21].
Seven selected studies concerned with engagement, communication and learning properties of multi-touch table interfaces that concern visitors’ interaction with the technology in science center and museum contexts are reviewed below. Their review is not intended as an exhaustive account of research on human interaction with multi-touch digital tables at large. In a study by Zaharias et al. [22], a 3D multi-touch table comprising a mirror reflecting a projected image onto a horizontal table surface, and an infrared camera that tracked user finger movements, was used to represent the “Walls of Nicosia” in a municipal museum in Cyprus. The aim of interacting with the table was to provide the user with a virtual tour of the fortifications of Nicosia while facilitating users’ engagement and participation. Features of the table included navigating through visualized content by pressing virtual buttons. Additional two-finger gestures also allowed zooming, panning, and tilting of the perceived view. A comparison between a group of 5th-year school students (“control” group) that learned the content through paper-based materials with another (“virtual” group) that interacted with the table showed no significant differences in learning outcomes. However, the group that interacted with the touch table revealed a significantly more favourable user experience than the control group [22].
As part of another museum context, Ynnerman et al. [8] have combined CT scanning and volumetric visualization to produce the “Gebelein Man”—a virtual human mummy that users can interact with on a multi-touch table interface. Interactive features of the touch table include rotation in the horizontal axis, clipping planes, zooming with two-finger pinching and stretching, and using a slider to display embedded graphics. While present as an interactive exhibit (alongside the original physical mummy) in the Early Egypt Gallery of the British Museum, an evaluation study with the virtual Gebelein Man showed a 40% increase in visitors’ dwell time in the gallery. The results revealed an average 2:09 interaction time with the table and visitors scored overall ease of use of the table at 90%. The findings have implications for engagement and pedagogical possibilities offered by multi-touch interactive displays in public settings. For example, an earlier study by Jönsson et al. [18] that evaluated users’ gesture-based exploration of volumetric data rendered on a touch table interface at a science center in Sweden, provides implications for formulating design recommendations that could improve factors such as exhibit dwell time. With respect to work investigating the role of gesture in interactions with multi-touch digital tables, Hinrichs and Carpendale [13] have studied visitors’ engagement with “Collection Viewer” at the Vancouver Aquarium. The application contains a distributed collection of image, video and animation media that communicate content about the biology and environment of the Arctic. Users interact individually or collaboratively with the table surface through a set of multi-touch gestures that include translation, rotation, scaling and flicking. Ethnographic analysis of 943 gesture events demonstrated that rather than performed in isolation, gestures were often intricately linked with, and influenced by, previous and subsequent interactive sequences. The results have important implications for the implementation of gesture sets in public interactive tables aimed at communicating scientific content (cf. [23]).
Through a multi-touch table exhibit called “DeepTree” [7,10], users can explore evolutionary relationships between species in a visualized “tree of life”. Users can display different domains of life by moving “horizontally” in the virtual tree or moving “vertically” to delve into time and locate the branch point where speciation occurred. Learners can also discover the last common ancestor of any two species. While present as an exhibit at the Harvard Museum of Natural History (HMNH), an evaluation of the interface by Block et al. [10] showed that dwell times were higher than for other exhibits, and that interaction with the table induced various positive affective responses. In further work conducted at the California Academy of Sciences, a systematic observational analysis by Block et al. [12] on visitors’ interaction with the technology has pointed towards various design guidelines related to visitors’ engagement with communicated scientific content. Among other findings, and by also incorporating event logging of user actions, a follow-up study [7] at HMNH and the Field Museum in Chicago showed a significant relationship between physical interaction with the touch table and verbal utterances related to the embedded content. The results of this research indicate that carefully designed interactive features in touch table interfaces can be used to meaningfully “encode” complex scientific concepts.
Overall, the reviewed studies probe pertinent questions on how users interact with multi-touch tables to access and explore scientific content aimed at the public. In turn, the work provides inroads into how content and interactive features can be designed to improve intuitive gesture-based exploration of visualized data for science communication. However, the literature suggests that more work is required to further explore the factors that influence the nature of interaction and collaboration around multi-touch digital tables [12,23]. Moreover, from a content perspective, little is known about the role of such tools in visitors’ exploration of aperceptual phenomena that are beyond our direct visual experience, such as the microscopic structures and processes constituting the biological world. It is this juncture that motivates an empirical inquiry into science center visitors’ engagement, preferences, and interactions with visualized (sub)microscopic biological content communicated through interactive touch table technology.
1.2. Aim of the Study
The setting of the current study is in Sweden, where science centers are recognised components of the educational infrastructure, and seen as potential agents for increasing visitors’ interest in science [24]. The aim of this study is to analyse public visitors’ interaction with a digital touch table when exploring visualized (sub)microscopic biological content.
2. Methods
2.1. Integrating Content and Interactive Features into a Multi-Touch Digital Table—Microcosmos
The Microcosmos touch table investigated in this study is a further development of an application that was originally designed for the opening of the Visualization Center C in Norrköping, Sweden in 2010. The aim of the application is to provide visitors with access to the wide range of imagery used in life science to represent objects and processes that are too small to be seen with the naked eye. Among the static images and dynamic visuals are photomicrographs, electron microscopy images, computer-generated molecular models based on experimental data, animations, videos, illustrations and paintings. The system was designed to allow multi-user exploration of the content as well as provide a flexible interface for explanations given by science center guides.
Designing Microcosmos involved embedding 64 visualization “cards” in the form of 43 static and 21 dynamic images (animations and videos) into an interactive system displayed in full HD resolution (Figure 1). The cards are grouped within seven thematic categories (proteins, viruses, cells, molecules, genes, processes of life and diseases) that can be selected by touching the respective category on the bar at the base of the display interface (see Figure 1). Activating a category visualizes the group of cards associated with that biological theme. In a similar fashion to earlier designed multi-touch tables reported by Shen et al. [25] and Hinrichs and Carpendale [13], a suite of interactive features allows visitors to (collaboratively) interact with a single (or multiple) card(s) through finger-based gestures that include selecting, moving, zooming and rotating. For example, a card can be selected and moved with a single finger, and touching respective text and image symbols on each card switches between the visualization (“front” of the card) and a textual description (“back” of the card). Two fingers are used to zoom (increase or decrease the card size) or to rotate a card (see Figure 1). In the default state of the system the cards “float” freely on the display area, based on the integration of a physics engine. The system returns to this state 10 s after any interaction activities have ceased, and switches to a new category if no user interacts with the table within 90 s.
The development of the software used an Agile approach with incremental rounds of testing and refining the table system until it performed as per the intended design described above. The resulting software was structured into six main parts, with functions related to handling cards, rendering images and videos, video playback, menu interactions and logging. Logging was achieved by including a function that monitored data received from the hardware and software output to allow capture of predefined variables. These included activated theme category, selected card, as well as card and finger coordinates related to contact (“finger down”) and release (“finger up”), movement, rotation and zooming. The logging was executed in the code that handles cards and consists of writing a text row to a log file for each finger update from the hardware. The program was written in C++, using the lightweight Simple DirectMedia Layer library to provide low level access to graphics (via OpenGL support) and touch interaction. FFmpeg was used for video playback, while XML files with media metadata were read using RapidXml. Hardware comprised a standard tower computer with a graphics card (NVIDIA GeForce 680) and a 55-inch LCD display. Light sources in the display frame creates a grid across the table surface. The system detects any intersections of the grid and feeds the data to the program. The number of simultaneously detected grid intersections is limited to six different objects.
2.2. Logging and Analysing Visitors’ Interaction with Microcosmos
The Microcosmos table was an unguided exhibit available for open-ended visitor exploration in the Visualization Center C during data collection for this study. The data corpus consists of anonymously logged data for the period 1–31 July 2017. Parameters of users’ engagement with the table were calculated from the log files using spreadsheet software (Microsoft Excel).
As a first step, the log data were parsed into “sessions” [26], defined here as periods of interaction separated by at least 60 s of table inactivity. Variables for describing overall usage included the average session time, average session finger movement and average number of theme category switches per session. Before calculating averages, pre-processing of the log files was performed in the spreadsheet software to calculate the time since session start, the distance traversed by finger movements, and the number of theme category switches, respectively, for each session. An indication of how often users interacted with multiple fingers was achieved by calculating the fraction of interactions in which multi-touch interaction (i.e., zoom and rotate) was evident from logged changes in the states for cards.
As a second step, the log data was analyzed at the level of individual cards. Three different measures were calculated for each card as indicators of how engaging each respective card was for visitors. Two of these measures are related to the attractive power of cards to induce visitors’ interaction: the number of sessions that a card was used in, and the number of sessions in which a card was used as the first card. The third measure is related to the holding power of cards and was calculated as the mean number of log entries associated with a card in the sessions wherein it was used. On cross-examining the log files and card database it was discovered that two cards had accidentally been assigned identical names. These cards were removed from analysis since they could not be separated in the log data.
As a third step, a ranking score was calculated to allow sorting of the cards with respect to visitor engagement (e.g., Table 1). The calculation involved three steps. Firstly, the measures of attractive power were adjusted for each card by dividing the value with the number of theme categories that the card was a member of. Doing so accounts for the increased likelihood that a visitor encounters a card that is present in multiple categories, which could otherwise introduce a bias when comparing cards that are not members of the same number of categories. The holding power measure is not affected by this bias since it only considers cases where a card has already been encountered and selected for interaction by the user. Secondly, the three measures of engagement were normalized with respect to the ranges of values for each measure. The resulting normalized values range from 0 for the least used card to 1 for the most highly used card for each measure. Thirdly, the ranking score for each card was calculated by summing the normalized values produced in the previous two steps, resulting in possible ranking scores ranging from 0–3. The ranking scores were sorted to produce lists of the ten highest and the ten lowest scores, representing cards that users engaged with the most and the least, respectively. The two lists of cards were analysed with respect to features that may be linked to users’ differential engagement.
3. Results and Discussion
3.1. Visitors’ Interaction with the Microcosmos Table
Analysis of the month-long log sample, consisting of two million (2,070,350) log events, suggested that visitors interacted with all of the available cards, during 858 sessions. The average session time was 96 s, which compares favourably with other reported exhibit holding times in science center and museum contexts [11,18]. Furthermore, visitors engaged all the available interactive features in the system throughout the study period, including all the biological theme categories. Finger movements covered an average accumulated distance of 4.6 m per session, and the majority of interactions with the table interface (approximately 56%) were performed using two fingers (e.g., zooming and rotating). This may indicate the intuitiveness of the zooming and rotation finger gestures for exploring the biological visualizations. Together with the large finger distance traversed on the table surface, this also suggests a potentially important role of bodily interaction in engaging and exploring visualized biological content for education [3].
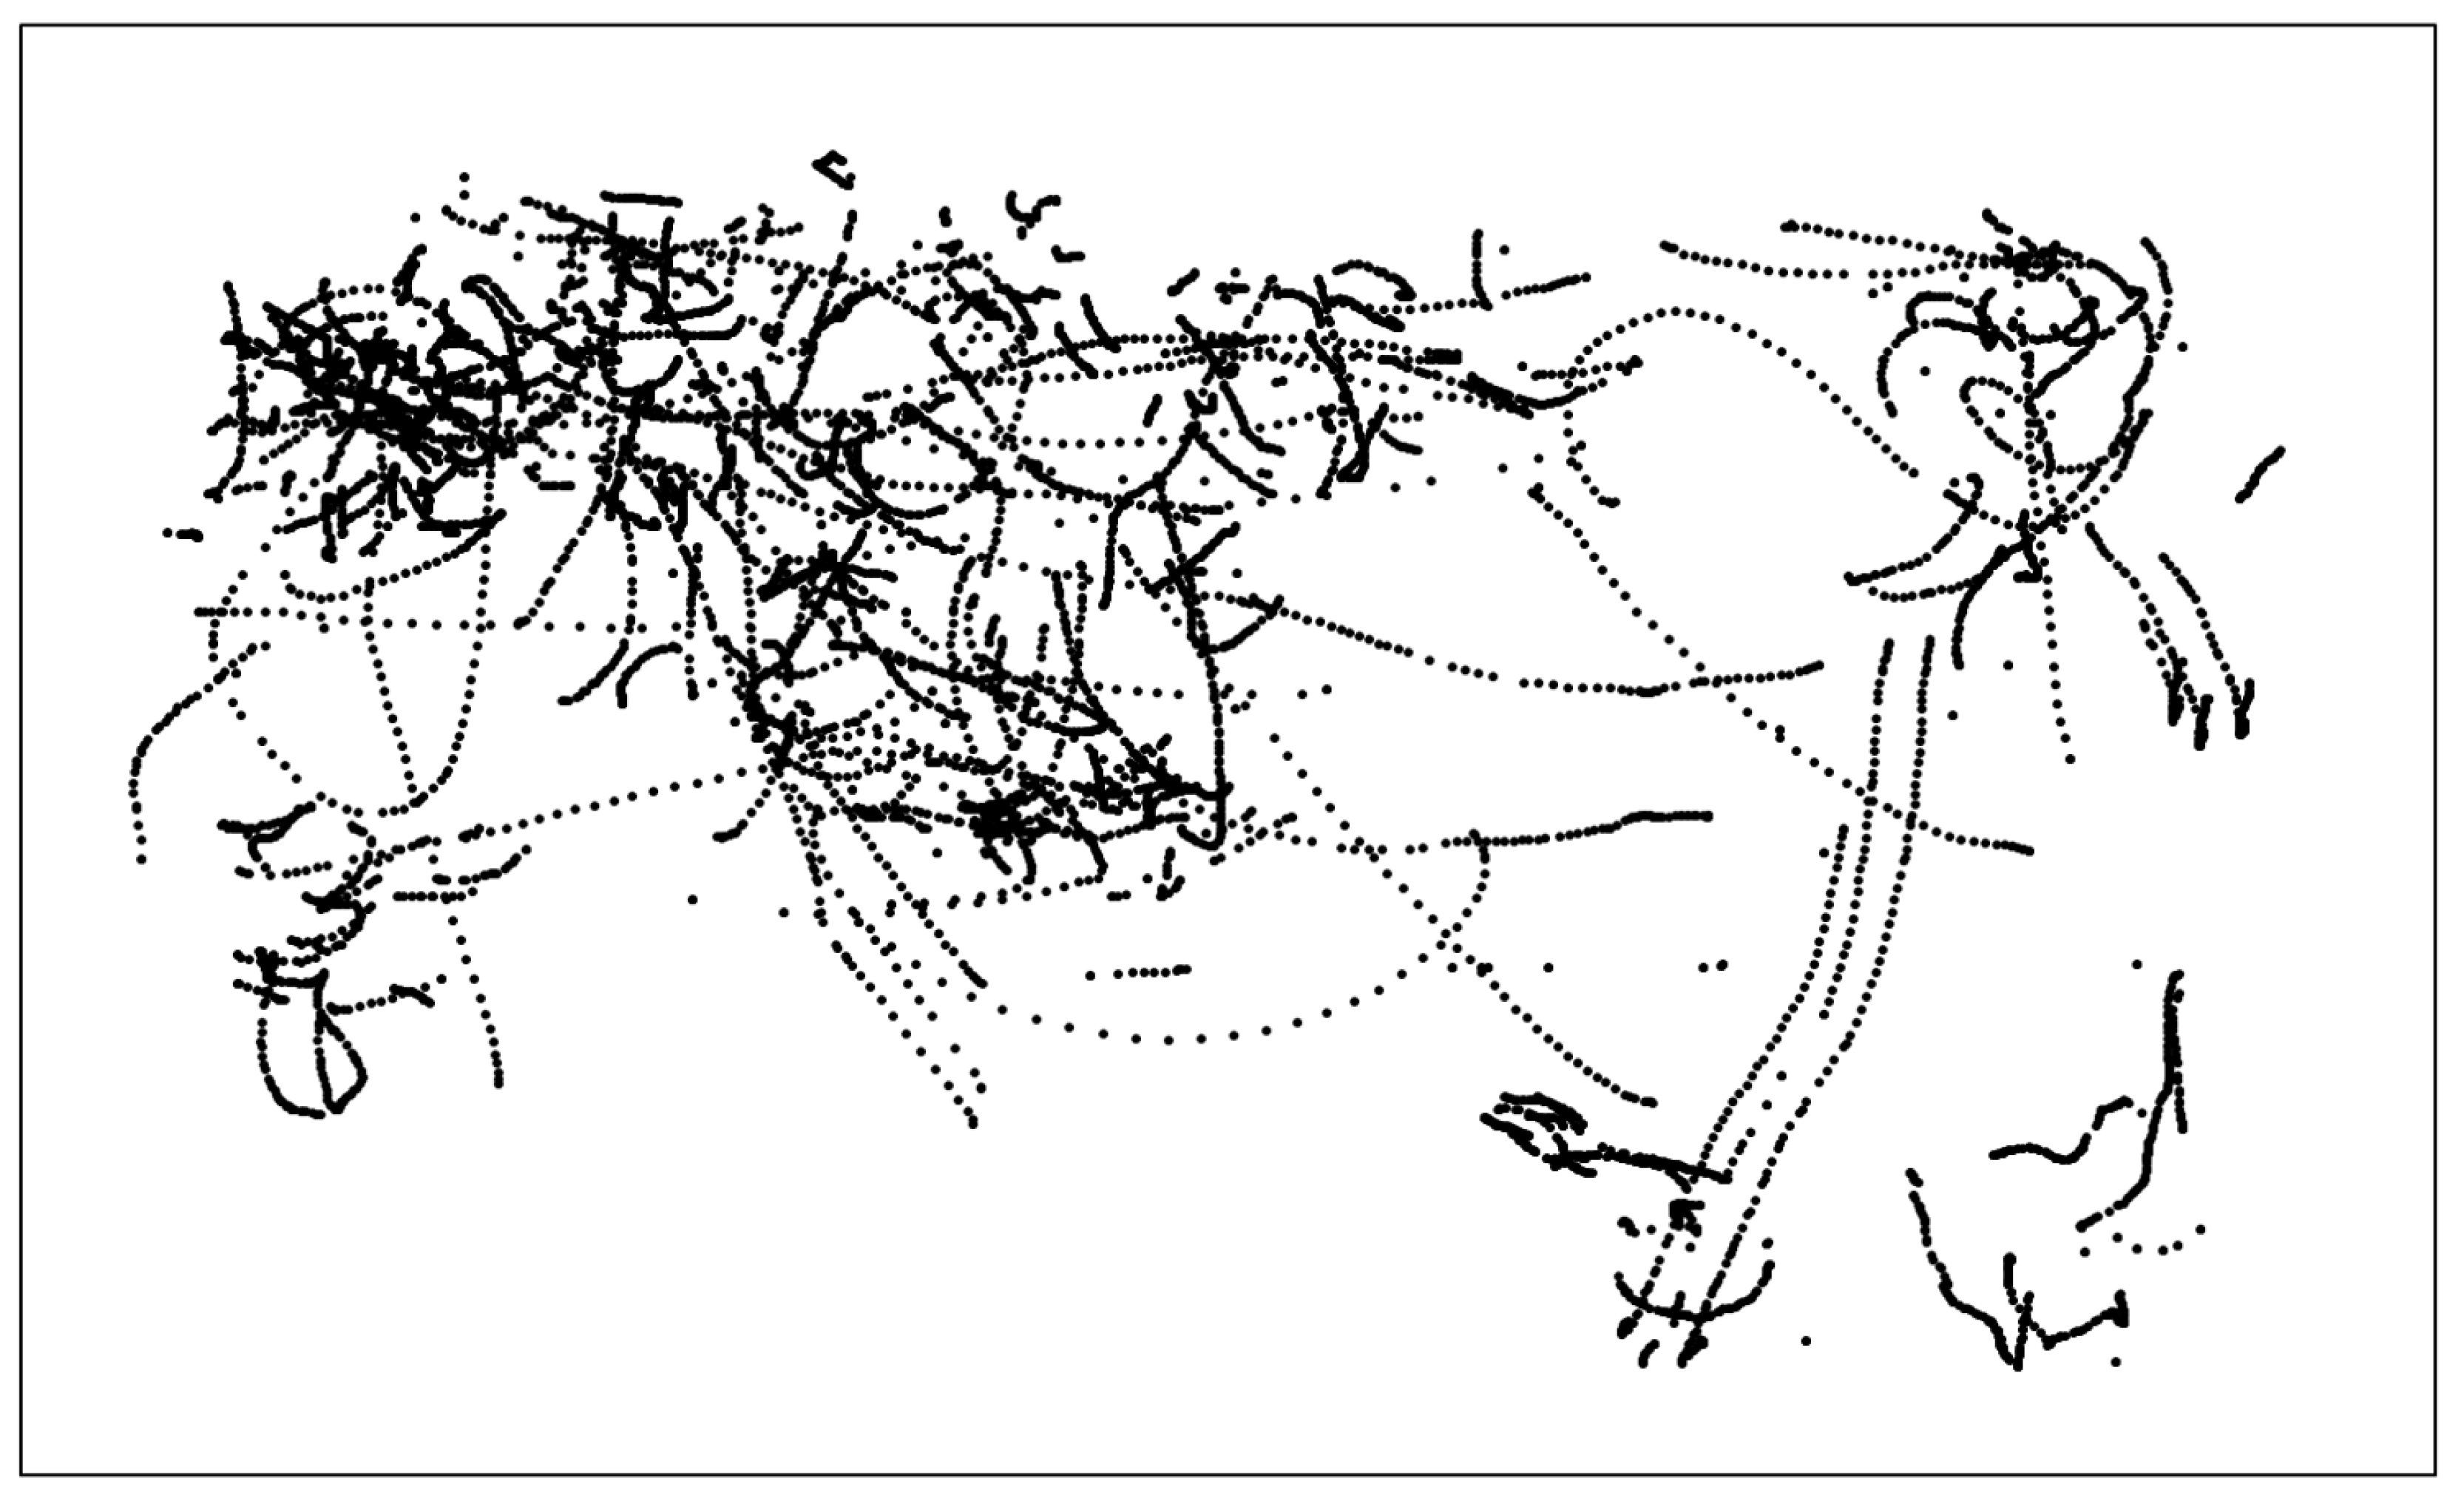
The session construct was applied since there are no “natural” units of analysis associated with the table or readily available in the data [26]. This is a consequence of the multi-user and multi-touch features of the table, where usage may range from a single individual interacting with the table for a well-defined period to groups of individuals that interact with variable levels of cooperation (cf. [12]). Also, the anonymous data does not contain any information about the composition of users at any one time. Figure 2 provides an example of the distribution of data points generated by users’ interaction with the touch table during one session. It is intended to demonstrate that the captured data relates to interactive finger-based gestures such as selecting, moving, zooming and rotating. In this example, multiple users (probably at least three, positioned at the top left, top right, and lower right corners of the table surface, respectively) are engaged with the exhibit during the session, and interacting across large parts of the touch table surface. The higher density of data points in the upper left corner indicates that a particularly active person (or persons) was positioned there, while a person(s) standing close to the lower right corner were less active.
In summary, results from the overall usage data analysis indicates that visitors engaged with the exhibit to an extent comparable to typical exhibits. In addition, they utilized the multi-touch functionality and actively interacted with the table.
3.2. Visitors’ Preferences for Visualized Biological Content
The log files contained an average of 5.53 category switches per session. In terms of biological content, the virus category was the most frequently activated (0.95 activations per session on average). The other categories were less frequently activated, with average number of activations per session ranging from 0.72 to 0.80 (Table 2).
Interaction with individual cards varied greatly. For example, the number of sessions was seven times larger for the most frequently activated card than for the least frequently activated card. Similarly, the number of times a card was accessed first during a session ranged from 0 to 48, while interaction with cards yielded average numbers of log entries that varied by a factor of almost 5. The difference in average number of entries between the most (median = 141) and the least (median = 6) used cards was statistically significant (Mann-Whitney U = 551, p < 0.001). The differences in interaction between different cards indicate that there were systematic differences in how users chose to engage with the visualized content. In the following, trends in those differences will be described and interpreted.
The overall ranking score, based on the two attractiveness measures and the measure of holding power, yielded a list of the ten most highly accessed cards and the ten least accessed cards (Table 3 and Table 4). Six of the most highly used cards (images 3, 4, 5, 7, 9, 10 in Table 3) concerned viruses, while none of the least activated cards (Table 4) concerned viruses. The only cards among the highly accessed cards that depicted cells did so in the context of virus infection with only parts of a cell visible (image 9 in Table 3), while the three depictions of cells among the least used images and videos portrayed whole cell structures (images 55, 56, 60 in Table 4). Apart from the difference in scientific content, there were also clear differences in representational style preference. Most notably, the highly accessed images and videos contain a larger number that integrate colour, sharper contrasts, and are brighter than the less accessed images and videos. For example, all four images among the highly accessed that are based on instrument output (e.g., electron microscopy) are colourful (images 1, 6, 9, 10 in Table 3), while the three transmission electron microscopy images among the least accessed images have a greyscale appearance (images 56, 60, 61 in Table 4). Interestingly, an exception to the trend towards lower brightness and colour intensity among less used cards are images that use a watercolour style to represent complex molecular scenes (images 57, 58, 59 in Table 4).
A possible explanation for the revealed trends in engagement may be offered by construal level theory [27]. According to construal level theory, the level at which humans construe objects and events is influenced by the psychological distance to that object, the distance from an egocentric reference point in the here and now. In particular, objects that are at a close psychological distance to the person will be construed at a low level, which means that concrete details and contextual factors will be emphasized in the construal. By contrast, objects that are at a larger psychological distance will be construed in a more abstract manner, emphasizing the central, overarching aspects of an object. Multiple psychological distances may be involved in this effect, including spatial, temporal, social, and hypotheticality distances [27]. In terms of users’ interaction with visualizations in the present study, properties of the visualizations may be related to differences in psychological distance and corresponding differences in construal level. In turn, we propose that low and high construal levels may be associated with different user behaviours in exploring the content.
Lee et al. [28] propose that black-and-white images may be associated with a larger psychological distance than colour images in at least two ways. Firstly, black-and-white may connote a greater temporal distance, given that historical events that took place before the invention of colour reproduction are often displayed in greyscale. Secondly, black-and-white may also connote a larger social distance, since most people experience their everyday surroundings in colour. In addition, they add that black-and-white may tend to highlight contours and shapes, which might reinforce the same cognitive processing that is associated with high-level construal [28]. Taken together, this would tend to induce a high-level construal of black-and-white images and a low-level construal of colour images.
The above reasoning does not explain the appearance of brightly coloured images among the less engaged images. We propose that hypotheticality may be an important dimension in this regard. Objects that are psychologically close on the hypotheticality dimension are more real and associated with a higher probability, while imagined or unlikely objects and events are more distant [27]. In relation to the present study, images that appear more like physical objects (e.g., 3D-models and electron micrograph images) may be perceived as more real (closer on the hypotheticality dimension) compared to 2D paintings (more distant on the hypotheticality dimension), which could induce a difference in construal level between different types of coloured images. The presence of one image that also uses a watercolour style to display a virus (image 4, Table 3) indicates that other mechanisms may also be involved. For example, familiarity with the portrayed objects may influence the psychological distance in relation to another dimension, namely the information distance [29]. It is reasonable to suggest that the spherical virus-particle portrayed in image 4 (Table 3) is more familiar than the protein complexes shown in image 57, 58 and 59 (Table 4), respectively. Pre-knowledge may also have other effects that are unrelated to the effects from psychological distance on construal level.
We argue that the findings in this study could be explained by differences in psychological distance associated with the images leading to different levels of construal. However, the ranking of images and videos was based on a measure of interactive engagement rather than level of construal per se. Hence, applying construal level theory to the results of the study would imply an association between level of construal and interactive behaviour. Given that a low-level construal tends to focus on details, it may be reasonable to expect that users would interactively explore the details to a higher degree than images that are construed at a high level. Conversely, a high level of construal focuses on central properties, for example form, and the relevant processing of the images may therefore not require as much interaction. Further research is needed to investigate the relations between levels of construal and interactive behaviour among users.
4. Conclusions
This study has provided insight into engagement and preference factors related to exploration of visualizations of the biological microcosmos through interactive multi-touch digital table technology. The findings indicate that the Microcosmos interactive touch table (Figure 1) attracts visitor attention, is highly usable, and that it may afford important embodied experiences of interacting with biological representations. Visitors showed a preference for virus-related content, as indicated by both card use and theme category switch data. “Realistic” images (e.g., micrographs) were shown to be highly engaging, provided they integrated coloured elements. Further preferences included colourful images, while cards with dark or greyscale colours and low contrast were less preferred. An interesting contradiction to this trend is the observation that complex biological scenes portrayed using a watercolour style seemed to induce low engagement among the visitors. A possible explanatory framework for this finding is construal level theory [27], which posits that differences in psychological distance between stimuli engender different levels of construal. The implications for design, engagement and learning with scientific visualizations warrant further investigation.
Future work will probe the urgent empirical challenge of systematically exploring how the interactive features of modern visualization technologies impact learning outcomes [20]. In this regard, interaction and narrative are becoming two critical components of interactive visualization at public venues [8] that require continued inspection. Future work will use the revealed preference and interactive trends from this study to inform the design and integration of science narratives [30] into the table interface as an additional tool for communicating biological phenomena to visitors. This will entail complementing logged data with think-aloud interview protocols, to aid the analysis of any relationships between visitors’ interaction and learning of biology.
Author Contributions
All authors conceptualized and wrote the manuscript. H.F. coded and integrated the software and was responsible for the technical upkeep of the table interface. G.E.H. performed the main analysis, and K.J.S. and L.A.E.T. provided feedback during the process. K.J.S. performed the literature review and synthesized the current state of the art. L.A.E.T. sourced the visuals. K.J.S., G.E.H. and L.A.E.T. acquired funding for the project.
Funding
This research was funded by Norrköpings fond för Forskning och Utveckling grant number NK KS 2016/0417.
Acknowledgments
Images in Table 3 and Table 4 are used with permission. Image credits: 1. Image data courtesy of Olympus Corporation https://www.olympus-lifescience.com/; 2. Svilen Milev; 3. Animech AB, Jonas Törnros; 4. David S. Goodsell, the Scripps Research Institute; 5. Image made with VMD by researchers at the NIH Center for Macromolecular Modeling and Bioinformatics, Beckman Institute, University of Illinois; 6. Lena Tibell; 7. Howard Hughes Medical Institute, Copyright 2007. All rights reserved. www.BioInteractive.org; 8. Emad Tajkhorshid, NIH Center for Macromolecular Modeling and Bioinformatics, University of Illinois at Urbana-Champaign; 9. Dennis Kunkel Microscopy/Science Photo Library; 10. Centers for Disease Control and Prevention, Influenza Laboratory; 55. HAAP Media, SXC.hu; 56. National Institutes of Health (NIH); 57. David S. Goodsell, RCSB PDB; 58. David S. Goodsell, the Scripps Research Institute; 59. David S. Goodsell, the Scripps Research Institute; 60. Todd Jarry, Ambrose Cheung, Louisa Howard; 61. Per Hammarström and Peter Nilsson, IFM, Linköping University; 62. MRC Laboratory of Molecular Biology, Cambridge, UK; 63. RISE Interactive C-Studio and Lena Tibell; 64. Stefano Forli, The Scripps Research Institute. The authors thank Visualization Center C for providing public access to the Microcosmos exhibit. The authors also thank Karljohan Lundin Palmerius for early conceptual input and technical advice.
Conflicts of Interest
The authors declare no conflict of interest. The funders had no role in the design of the study; in the collection, analyses, or interpretation of data; in the writing of the manuscript, and in the decision to publish the results.
References
- Stocklmayer, S.M.; Rennie, L.J.; Gilbert, J.K. The roles of the formal and informal sectors in the provision of effective science education. Stud. Sci. Educ. 2010, 46, 1–44. [Google Scholar] [CrossRef] [Green Version]
- Ynnerman, A.; Löwgren, J.; Tibell, L. Exploranation: A new science communication paradigm. IEEE Comput. Graph. Appl. 2018, 38, 13–20. [Google Scholar] [CrossRef] [PubMed]
- Johnson-Glenberg, M.C.; Birchfield, D.A.; Tolentino, L.; Koziupa, T. Collaborative embodied learning in mixed reality motion-capture environments: Two science studies. J. Educ. Psychol. 2014, 106, 86. [Google Scholar] [CrossRef]
- Lui, M.; Slotta, J.D. Immersive simulations for smart classrooms: Exploring evolutionary concepts in secondary science. Technol. Pedagogy Educ. 2014, 23, 57–80. [Google Scholar] [CrossRef]
- Schönborn, K.; Höst, G.; Lundin Palmerius, K.; Flint, J. Development of an interactive immersion environment for engendering understanding about nanotechnology: Concept, construction, and implementation. Int. J. Virtual Pers. Learn. Environ. 2014, 5, 40–56. [Google Scholar] [CrossRef]
- Schönborn, K.J.; Bivall, P.; Tibell, L.A.E. Exploring relationships between students’ interaction and learning with a haptic virtual biomolecular model. Comput. Educ. 2011, 57, 2095–2105. [Google Scholar] [CrossRef] [Green Version]
- Horn, M.S.; Phillips, B.C.; Evans, E.M.; Block, F.; Diamond, J.; Shen, C. Visualizing biological data in museums: Visitor learning with an interactive tree of life exhibit. J. Res. Sci. Teach. 2016, 53, 895–918. [Google Scholar] [CrossRef] [Green Version]
- Ynnerman, A.; Rydell, T.; Antoine, D.; Hughes, D.; Persson, A.; Ljung, P. Interactive visualization of 3D scanned mummies at public venues. Commun. ACM 2016, 59, 72–81. [Google Scholar] [CrossRef]
- Thuneberg, H.; Salmi, H. To know or not to know: Uncertainty is the answer. Synthesis of six different science exhibition contexts. J. Sci. Commun. 2018, 17, A01. [Google Scholar] [CrossRef]
- Block, F.; Horn, M.S.; Phillips, B.C.; Diamond, J.; Evans, E.M.; Shen, C. The DeepTree exhibit: Visualizing the tree of life to facilitate informal learning. IEEE Trans. Vis. Comput. Graph. 2012, 18, 2789–2798. [Google Scholar] [CrossRef] [PubMed]
- Sandifer, C. Technological novelty and openendedness: Two characteristics of interactive exhibits that contribute to the holding of visitor attention in a science museum. J. Res. Sci. Teach. 2003, 40, 121–137. [Google Scholar] [CrossRef]
- Block, F.; Hammerman, J.; Horn, M.; Spiegel, A.; Christiansen, J.; Phillips, B.; Diamond, J.; Evans, E.M.; Shen, C. Fluid grouping: Quantifying group engagement around interactive tabletop exhibits in the wild. In Proceedings of the 33rd Annual ACM Conference on Human Factors in Computing Systems, Seoul, Korea, 18–23 April 2015; ACM: New York, NY, USA, 2015; pp. 867–876. [Google Scholar]
- Hinrichs, U.; Carpendale, S. Gestures in the wild: Studying multi-touch gesture sequences on interactive tabletop exhibits. In Proceedings of the SIGCHI Conference on Human Factors in Computing Systems, Vancouver, BC, Canada, 7–12 May 2011; ACM: New York, NY, USA, 2011; pp. 3023–3032. [Google Scholar]
- Livingstone, S.; Sefton-Green, J. The Class: Living and Learning in the Digital Age; New York University: New York, NY, USA, 2016. [Google Scholar]
- Sundén, E.; Lundgren, I.; Ynnerman, A. Hybrid Virtual Reality Touch Table—An immersive collaborative platform for public explanatory use of cultural objects and sites. In Proceedings of the GCH’17 EUROGRAPHICS Workshop on Graphics and Cultural Heritage, Graz, Austria, 27–29 September 2017. [Google Scholar]
- Mishra, P.; Koehler, M.J. Technological pedagogical content knowledge. Teach. Coll. Rec. 2006, 108, 1017. [Google Scholar] [CrossRef]
- Falk, J.; Storksdieck, M. Using the contextual model of learning to understand visitor learning from a science center exhibition. Sci. Educ. 2005, 89, 744–778. [Google Scholar] [CrossRef] [Green Version]
- Jönsson, D.; Falk, M.; Ynnerman, A. Intuitive exploration of volumetric data using dynamic galleries. IEEE Trans. Vis. Comput. Gr. 2016, 22, 896–905. [Google Scholar] [CrossRef] [PubMed]
- Barry, M. Please do touch: Discourses on aesthetic interactivity in the exhibition space. Particip. J. Audience Recep. Stud. 2014, 11, 216–236. [Google Scholar]
- Pedra, A.; Mayer, R.E.; Albertin, A.L. Role of interactivity in learning from engineering animations. Appl. Cognit. Psychol. 2015, 29, 614–620. [Google Scholar] [CrossRef]
- Buckley, B.C.; Gobert, J.D.; Kindfield, A.C.H.; Horwitz, P.; Tinker, R.F.; Gerlits, B.; Wilensky, U.; Dede, C.; Willett, J. Model-based teaching and learning with BioLogica: What do they learn? How do they learn? How do we know? J. Sci. Educ. Technol. 2004, 13, 23–41. [Google Scholar] [CrossRef]
- Zaharias, P.; Machael, D.; Chrysanthou, Y. Learning through multi-touch interfaces in museum exhibits: An empirical investigation. Educ. Technol. Soc. 2013, 16, 374–384. [Google Scholar]
- Hornecker, E. “I don’t understand it either, but it is cool”—Visitor interactions with a multi-touch table in a museum. In Proceedings of the 3rd IEEE International Workshop on Horizontal Interactive Human Computer Systems, Amsterdam, The Netherlands, 1–3 October 2008; IEEE: Piscataway, NJ, USA, 2008; pp. 113–120. [Google Scholar]
- Swedish National Agency for Education. Science Centers—A Memo about an Evaluation of Technology and Science Education; Science Centers—PM om en utvärdering av teknik- och naturvetenskap; Skolverket: Stockholm, Sweden, 2013.
- Shen, C.; Vernier, F.D.; Forlines, C.; Ringel, M. DiamondSpin: An extensible toolkit for around-the-table interaction. In Proceedings of the SIGCHI Conference on Human Factors in Computing Systems, Vienna, Austria, 24–29 April 2004; ACM: New York, NY, USA, 2004; pp. 167–174. [Google Scholar]
- Peltonen, P.; Kurvinen, E.; Salovaara, A.; Jacucci, G.; Ilmonen, T.; Evans, J.; Oulasvirta, A.; Saarikko, P. It’s mine, don’t touch! Interactions at a large multi-touch display in a city centre. In Proceedings of the SIGCHI Conference on Human Factors in Computing Systems, Florence, Italy, 5–10 April 2008; pp. 1285–1294. [Google Scholar]
- Trope, Y.; Liberman, N. Construal-level theory of psychological distance. Psychol. Rev. 2010, 117, 440–463. [Google Scholar] [CrossRef] [PubMed]
- Lee, H.; Deng, X.; Unnava, H.R.; Fujita, K. Monochrome forests and colorful trees: The effect of black-and-white versus color imagery on construal level. J. Consum. Res. 2014, 41, 1015–1032. [Google Scholar] [CrossRef]
- Fiedler, K. Construal level theory as an integrative framework for behavioral decision-making research and consumer psychology. J. Consum. Psychol. 2007, 17, 101–106. [Google Scholar] [CrossRef]
- Murmann, M.; Avraamidou, L. Narrative as a learning tool in science centers: Potentials, possibilities and merits. JCOM J. Sci. Commun. 2014, 13, A02. [Google Scholar] [CrossRef]
Figure 1.
Public visitors’ collaborative multi-touch interaction with the Microcosmos table in a digital science center context.
Figure 1.
Public visitors’ collaborative multi-touch interaction with the Microcosmos table in a digital science center context.

Figure 2.
Logged finger positions on the horizontal table surface obtained from a session of users’ interaction with Microcosmos. The tracked data were captured during a session that lasted 6 min, in which the users moved their fingers a collective distance of approximately 16 m.
Figure 2.
Logged finger positions on the horizontal table surface obtained from a session of users’ interaction with Microcosmos. The tracked data were captured during a session that lasted 6 min, in which the users moved their fingers a collective distance of approximately 16 m.


Table 1.
Procedure for calculating ranking scores for users’ engagement with cards in the Microcosmos touch table exhibit, with one example image from among the most engaged cards and one from the least engaged cards, respectively.
Table 1.
Procedure for calculating ranking scores for users’ engagement with cards in the Microcosmos touch table exhibit, with one example image from among the most engaged cards and one from the least engaged cards, respectively.
| Operation | Variable | 1. Liquid Crystalline DNA (in 1 Category) | 60. Staphylococcus (in 2 Categories) |
|---|---|---|---|
| Adjustment by category occurrence | |||
| Sessions | 116/1 = 116 | 122/2 = 61 | |
| First usage | 19/1 = 19 | 8/2 = 4 | |
| Entries/session | 339 | 150 | |
| Normalization by range of adjusted values | |||
| Sessions (range 36–116) | (116 − 36)/80 = 1.00 | (61 − 36)/80 = 0.31 | |
| First usage (range 0–19) | 19/19 = 1.00 | 4/19 = 0.21 | |
| Entries/session (range 93–452) | (339 − 93)/359 = 0.68 | (150 − 93)/359 = 0.16 | |
| Summing of values | |||
| Ranking score | 1.00 + 1.00 + 0.68 = 2.68 | 0.31 + 0.21 + 0.16 = 0.68 |
Table 2.
Users’ total and average category activations across the seven theme categories embedded in the Microcosmos touch table.
Table 2.
Users’ total and average category activations across the seven theme categories embedded in the Microcosmos touch table.
| Category | Total Activations | Average Activations per Session |
|---|---|---|
| Viruses | 812 | 0.95 |
| Cells | 687 | 0.80 |
| Diseases | 677 | 0.79 |
| Molecules | 673 | 0.78 |
| Genes | 649 | 0.76 |
| Proteins | 630 | 0.73 |
| Life processes | 619 | 0.72 |
Table 3.
Most highly accessed cards based on two measures related to attractiveness and one measure related to holding power, presented in order of rank score. (Image credits are provided in the Acknowledgements).
Table 3.
Most highly accessed cards based on two measures related to attractiveness and one measure related to holding power, presented in order of rank score. (Image credits are provided in the Acknowledgements).
| Card Name | Media Type | Rank Score | Visual Appearance |
|---|---|---|---|
| 1. Liquid Crystalline DNA | Image | 2.68 |  |
| 2. DNA molecule | Image | 2.15 |  |
| 3. Virus | Image | 2.11 |  |
| 4. HIV virus | Image | 2.07 |  |
| 5. Poliovirus with human cell receptors | Image | 2.05 |  |
| 6. EC-SOD—protect cells from oxygen radical damage | Image | 1.90 |  |
| 7. HIV virus infecting a cell | Video | 1.81 |  |
| 8. Water transport channel | Image | 1.80 |  |
| 9. HIV virus infecting a cell | Image | 1.78 |  |
| 10. Swine flu virus (H1N1) | Image | 1.73 |  |
Table 4.
Least highly accessed cards based on two measures related to attractiveness and one measure related to holding power, presented in order of rank score. (Image credits are provided in the Acknowledgements).
Table 4.
Least highly accessed cards based on two measures related to attractiveness and one measure related to holding power, presented in order of rank score. (Image credits are provided in the Acknowledgements).
| Card Name | Media Type | Rank Score | Visual Appearance |
|---|---|---|---|
| 55. Red blood cells | Image | 0.85 |  |
| 56. Stem cell | Image | 0.77 |  |
| 57. Antibodies binding to foreign protein | Image | 0.75 |  |
| 58. Cytoplasm | Image | 0.74 |  |
| 59. Muscle sarcomere | Image | 0.69 |  |
| 60. Staphylococcus | Image | 0.68 |  |
| 61. Electron micrograph of amyloid fibrils | Image | 0.63 |  |
| 62. The ribosome - the protein factory | Video | 0.61 |  |
| 63. Transport over a cell membrane | Video | 0.50 |  |
| 64. Adenosine receptor | Image | 0.00 |  |
© 2018 by the authors. Licensee MDPI, Basel, Switzerland. This article is an open access article distributed under the terms and conditions of the Creative Commons Attribution (CC BY) license (http://creativecommons.org/licenses/by/4.0/).
Share and Cite
MDPI and ACS Style
Höst, G.E.; Schönborn, K.J.; Fröcklin, H.; Tibell, L.A.E. What Biological Visualizations Do Science Center Visitors Prefer in an Interactive Touch Table? Educ. Sci. 2018, 8, 166. https://doi.org/10.3390/educsci8040166
AMA Style
Höst GE, Schönborn KJ, Fröcklin H, Tibell LAE. What Biological Visualizations Do Science Center Visitors Prefer in an Interactive Touch Table? Education Sciences. 2018; 8(4):166. https://doi.org/10.3390/educsci8040166
Chicago/Turabian StyleHöst, Gunnar E., Konrad J. Schönborn, Henry Fröcklin, and Lena A. E. Tibell. 2018. "What Biological Visualizations Do Science Center Visitors Prefer in an Interactive Touch Table?" Education Sciences 8, no. 4: 166. https://doi.org/10.3390/educsci8040166
Note that from the first issue of 2016, this journal uses article numbers instead of page numbers. See further details here.