Does the Middle School Model Make a Difference? Relating Measures of School Effectiveness to Recommended Best Practices


Center for Education Research and Policy Studies, College of Education, The University of Texas at El Paso, 500 W University, El Paso, TX 79968, USA
*
Author to whom correspondence should be addressed.
Educ. Sci. 2018, 8(4), 160; https://doi.org/10.3390/educsci8040160
Submission received: 25 July 2018
/
Accepted: 21 September 2018
/
Published: 24 September 2018
(This article belongs to the Special Issue Middle Grades Education)
Abstract
:Since the emergence of middle schools as distinct educational settings in the 1960s, proponents of the model have advocated for structures and approaches that best meet the particular developmental needs of young adolescents. Middle school researchers have developed frameworks of best practices for schools that have been widely, if not uniformly, adopted. However, there is a paucity of large-scale quantitative research on the efficacy of such best practices. In this study we used state-level administrative data from Texas to estimate the school-level contribution to standardized test scores in math and language arts, along with absenteeism. We then regressed these value-added quantities on indicators of middle school structures, along with research-supported predictors of school efficacy. Results showed that schools with fewer classes in the school day and higher quality teachers performed better, among other indicators. Findings from models using the campus contribution to absenteeism were similar. These results indicate that while elements of the middle school model may help transform individual schools, the equitable distribution of resources and the undoing of de facto segregation are vital to the success of all young adolescents.
1. Introduction
Middle schools are distinct educational settings which educate young adolescent learners. The idea of separate schools for young adolescents, separate from primary and high schools, emerged in the 1960s [1]. Since that time, the middle school movement has waxed and waned, vulnerable to political and social pressures related to education [2]. Starting in the 1980s, the National Middle School Association defined and refined what it means to be a middle school which provides an education that meets the needs of all young adolescent learners [3]. Their “This We Believe” framework has driven many small and large scale reform efforts, while also providing guidance for research in middle level education [2]. This framework argues that education for young adolescents should be developmentally responsive, challenging, empowering, and equitable, and that middle schools should be structured in such a way as to provide education that meets these tenets [3,4].
Educational systems have shifted education services for young adolescents towards the middle school model to varying degrees, and it is now the predominant structure for schools that serve students of this age [5]. Recent research has suggested that middle schools that adhere more closely to the middle school model are more successful than those which do not [6]. The success of middle grades reform is contingent upon school-wide adoption of middle grades practices and perspectives [7]. Although this strand of research provides guidance to the operationalization of the middle school model, as noted by leaders in the field of middle school research, large scale quantitative investigations and evaluations of the middle school model are lacking [8]. While the middle school model continues to dominate the landscape, there is limited research connecting the prescribed tenets of middle schools to educational outcomes. However, recently, education researchers have been able to leverage large-scale administrative data and emerging computational techniques to address these types of questions [9]. Such data allow research to investigate numerous elements of schools along with multiple outcomes for students.
While academic achievement is an important outcome of an educational system, other elements of student experience are important for their future successes. As highlighted by Balfanz and colleagues [10], school attendance in the middle grades is a useful predictor of high school graduation and long-term success. However, teachers and schools that are effective in promoting higher academic achievement are not necessarily effective in supporting and promoting higher attendance [11]. To truly understand the efficacy of middle schools in preparing young learners for success, researchers need to consider non-academic, as well as academic measures of middle schools.
Although the middle school movement is well established, large-scale quantitative research into tenets central to the movement remains limited. The purpose of this study was to measure the relationships between characteristics of middle schools aligned with the middle grades movement and student achievement and attendance. In doing so we took direction from the recently published guidance from leaders in the field of middle grades research that identified the need for investigation of the ways in which middle school structures foster or hinder student outcomes [12]. In this pursuit, we were guided by two research questions:
1. To what extent are middle schools that are effective in supporting student growth in achievement also effective in supporting student growth in attendance?
2. What characteristics of middle schools, including characteristics that are promoted by the middle grades movement, are significant predictors of a school support for student growth in academic achievement and attendance?
2. Background
2.1. Middle Schools and Young Adolescents
The middle school movement has emerged over the past 50 years, built on a foundational premise that schools that teach the middle grades should be particularly structured to meet the needs of young adolescents [2]. Early adolescence is a time for physical, intellectual, emotional, physiological, social, and moral development [13]. To support this development, middle school advocates have identified numerous features of middle schools and best practices in middle school teaching [3,4]. One such feature vital for the success of middle schools is the presence of educators who value young adolescents and are prepared to teach them. This indicates the need for highly qualified teachers, particularly those who are prepared specifically for the middle grades [4]. Middle grades researchers have consistently supported the importance of middle grades-specific preparation for teachers to be successful [14,15,16].
Young adolescence is a time of rapid identity development [17,18]. This identity development can be influenced by the identities that are present in the school and the connections that are made possible to students. Racially and ethnically diverse school settings in the middle school years can support identity development for young adolescents, allowing them to develop their own individual identity [19,20]. The same is true with regard to diversity of socioeconomic class [21]. In addition to a diverse setting, identity development can be supported through close connections with teachers who can serve as role models and mentors. Such relationships can be fostered in smaller classroom settings. Additionally, school schedules with fewer classes in the day support curriculum and approaches to education that allow students to take deep dives into subject matter, further exploring and developing their identities [22,23].
Shifts towards middle school structures are more successful when such shifts are implemented at the school or district level, rather than in small teams within schools [14]. This allows for school schedules and curriculum aligned with the middle grades approach [22]. Districts need simple and complex resources to implement and support such reforms, along with funds to support rich activities for students. Appropriate levels of funding, along with other incentives which can be developed in a resource-rich environment, can also help to attract and retain high quality teachers [24,25]. These teachers can grow in their efficacy as they gain experience and further become invested in the education of young adolescents.
In summary, the middle school model is characterized by structures and approaches that meet the needs of young adolescents. Among these structures and approaches are the presence of educators who are well prepared to teach students of this age, a supportive and diverse community, a schedule that allows for exploration, and adequate funding to help build capacity and support teaching and learning conditions. The purpose of this study was to evaluate whether the presence of these features is associated with greater middle school effectiveness, as measured by value-added modeling of student achievement and attendance.
2.2. Value Added Measures
Value added measures (VAMs) consider the impact of teachers, schools, and districts on student growth, rather than cross sectional student achievement. As summarized by Hanushek and Rivkin [26], these types of models can incorporate control variables to narrow in on the differences in the value added effects on growth associated with individual teachers. These models control for student demographic characteristics along with classroom characteristics to isolate the variance in growth related to the teacher from students’ background characteristics and peer effects. Such models can identify high quality teachers who have a long-lasting positive influence on students [27]. Recently, researchers have started to examine teacher value added effects associated with non-academic outcomes, including attendance [11]. These models also control for demographic characteristics, peer effects and student achievement.
A related line of research models the effects of individual schools on student outcomes [28,29]. This approach takes in to account school-level intangibles that might not be captured at the teacher level, including structural and intangible qualities, such as school culture. Recently, in a related study, we found that in the middle grades, the variance in the value added effect at the school level was as high or higher than for teachers, indicating the importance of examining middle schools as the unit of analysis, rather than individual teachers [29]. While precursors and characteristics of teachers with varying levels of VAMs have previously been explored [11], researchers have not previously undertaken such an investigation of middle schools.
2.3. Texas Context
The size and characteristics of Texas make it a ripe site for research. Texas is the second largest state in the United States in terms of student population, with over five million K-12 students, more than 1.5 million of whom are in the middle grades [30]. Additionally, the state student body is racially and ethnically diverse. With regard to schools, there are over 8000 public schools in over 1000 districts [30]. These schools are in communities with varying population densities and different community values. To enable such research, the Texas government has made available large amounts of administrative data, of the type described by Filgio and colleagues that “open up new questions that could not previously have been studied, allow us to reevaluate existing questions with new and more compelling empirical approaches and identification strategies, and permit analysis of questions of specific interest to particular localities” [9].
3. Materials and Methods
3.1. Sample
The sample for this study consisted of 1735 schools that can be considered as serving primarily young adolescent learners based on data from the 2014–2015 school year. We pooled data over the school years from 2011-2012 through 2014–2015. Only those schools that were present for all years included in the time frame were kept in the sample. Table 1 presents characteristics of these schools, along with the teacher and student populations, that are relevant to this study. In general, student and teacher characteristics are consistent with the overall state of Texas.
3.2. Measures
For this study, we used student-level longitudinal data for middle school students in Texas for the years from 2011–2012 through 2014–2015. Linked data sets from the Texas Education Agency’s Public Education Information Management System are available through the Education Research Center at the University of Texas at Austin. These data included student demographic information, attendance records, and achievement in math and English language arts (ELA) as measured by the State of Texas Assessment of Academic Readiness (STAAR) standardized exams. This data set also links individual students to teachers, classrooms, and districts.
Using this student-level data, along with teacher-, campus-, and district-level administrative data sets, we were able to identify and construct our variables of interest consistent with the purpose of this study. These student independent variables included the percent of the student population eligible for free and reduced-price lunch; the percent who self-identified as White, Black or African American, and Latinx not White; and the income and racial segregation present at the school. The independent variables describing the teacher population were the percentage of teachers at the school who were novice or veteran teachers, the percentage of teachers in the highest and lowest decile of certification exam scores, and the percentage of teachers specifically prepared to teach middle school. The campus independent variables included the number of classes in the day, class size, campus enrollment, and school funding levels. All these variables were used in our models to examine the relationship between middle school features recommended as best practices and student outcomes.
We used teacher-level data sets to measure teacher experience based on employment records. Following prior work with VAMs and teacher efficacy [31], we identified teachers with 2 or fewer years of experience as “novice”, and teachers with 10 or more years of experience as “veteran”. We also gathered teacher scores on certification exams that measured pedagogy and professional responsibilities, standardized such scores by year, and identified teachers who scored in the top and bottom decile. We used classroom enrollment data to determine teacher class sizes. Finally, we used teacher certification information to identify teachers specifically prepared to teach the middle grades. Texas does not have a middle school teaching endorsement, so we identified these teachers by flagging those teachers with a minimum grade certification between grade 4 and grade 8, and a maximum grade certification of greater than grade 5. These boundary measures identified teachers specifically certified to teach the middle grades.
For campus characteristics, we used a number of existing and derived measures. To measure the number of classes in a day, we identified the number of unique courses reported for each student at the school within the first semester, trimester, or quarter. We then averaged this across the student body and rounded to the nearest integer. We gathered state and local revenue per pupil, total revenues per pupil, and expenditures per pupil from the state financial data. Campus enrollment, including race and ethnicity data, were taken directly from administrative data. Dissimilarity or segregation indices were calculated following Reardon [32]. This first takes the ratio of number of students who identify as being part of a particular group at a campus to the number of students who identify as that group statewide. The difference between this ratio and the same ratio in the reference group is then found and divided by two, yielding the dissimilarity index. We calculated the index for socioeconomic status using an indicator of free and reduced-price lunch. We also calculated two indices for race and ethnicity, comparing the number of students who identified as Latinx with the number of students who identified as White, and the number of students who identified as Black or African American and the number of students who identified as White. We also included the percentage of the student body that was identified as these different groups in our modeling.
3.3. Analytical approach
The analysis in this study consisted of two steps. First, we estimated a school value added model using data from schools that teach primarily young adolescents pooled over 4 years. We designed this model based on prior analyses of teacher and school-level value added measures of effectiveness [26,28]. We estimated separate models for school effects on achievement and attendance, for student in school for year :
In Equation (1), represents campus value added effects and represents year fixed effects. The vectors and are student and classroom covariates, including students’ prior attendance and achievement, race/ethnicity, income level, and gender. This model is similar to the district value added effects models estimated by Chingos and colleagues [28], which we have adapted for use at the school level. This model was estimated separately using the attendance and achievement outcomes. We converted both outcome measures to student-level standard deviations to allow for comparisons between attendance and achievement effects. The standard deviation of school value added effect based on student scores in math and ELA, along with the combined achievement value added effect and the value added effect based on attendance are presented in Table 2. We note that, consistent with prior research, the standard deviation for the value added effect for math is larger than that for ELA [26,28]. For comparison, we also present these same values for the model estimated using only one year of the data in the table. The value added effects were first calculated within grade level and subject area, and then the value added effects within each grade level and content area present at the school were aggregated to yield one value for achievement for each campus. The same was done for attendance.
In the second step of the analysis, we regressed the school value added effect on the previously defined predictor variables. We regressed the outcome on each predictor variable independently in order to observe the differences across schools viewed only through the lens of each individual indicator. This procedure was conducted separately for the achievement value added effect and the attendance value added effect. All regressions were weighted by campus enrollment.
4. Results
Findings are shown in Table 3 and Table 4. Table 3 presents the correlations between the campus-level value added effects using mathematics, ELA, and attendance as student-level outcomes. In the top panel of Table 3 we present the results using sample pooled over the 4 years of data as well as the one-year data for 2014–2015. These results demonstrate the moderate level of correlation (, pooled sample) between the math and ELA value added effects, indicating that schools which support growth in mathematics achievement also tend to support growth in ELA achievement. However, the correlation coefficients between the value added effects for academic achievement and the value added effects for achievement are lower, for both the ELA and attendance () and math and attendance (). While these values are lower, they remain statistically significant (). These results can be interpreted as showing that middle schools which support academic growth in one discipline tend to support academic growth in other disciplines. However, the extent to which a school supports academic achievement is less predictive of the extent to which a school supports attendance.
The bottom panel of Table 3 presents the correlation of one-year value added effects with values from the prior academic year. This analysis shows that the value for these value added effects based on the same outcome year after year is relatively stable (). This indicates the relative constancy of the value added effect associated with an individual school for academic achievement and attendance as students age in to and matriculate from the middle school.
To identify characteristics associated with the values of these value added effects, we next regressed the campus value added effect on each individual predictor variable, in a series of bivariate regressions. The results of these analyses are presented in Table 4. In general, schools with higher levels of segregation had higher values for academic value added effects. With regard to teacher variables, schools with greater percentages of novice teachers and teachers in the bottom decile of certification exam scores had lower values of academic value added effects.
The relationships between the variables constructed to investigate the middle school model and the values of the academic value added effects were mixed. The percentage of teachers at a campus certified to teach students in the middle grades specifically was not a statistically significant predictor. This was also true for the total number of students served by a teacher. Alternately, in this bivariate regression, a larger enrollment and fewer classes in the school day were associated with higher campus-level value added effects.
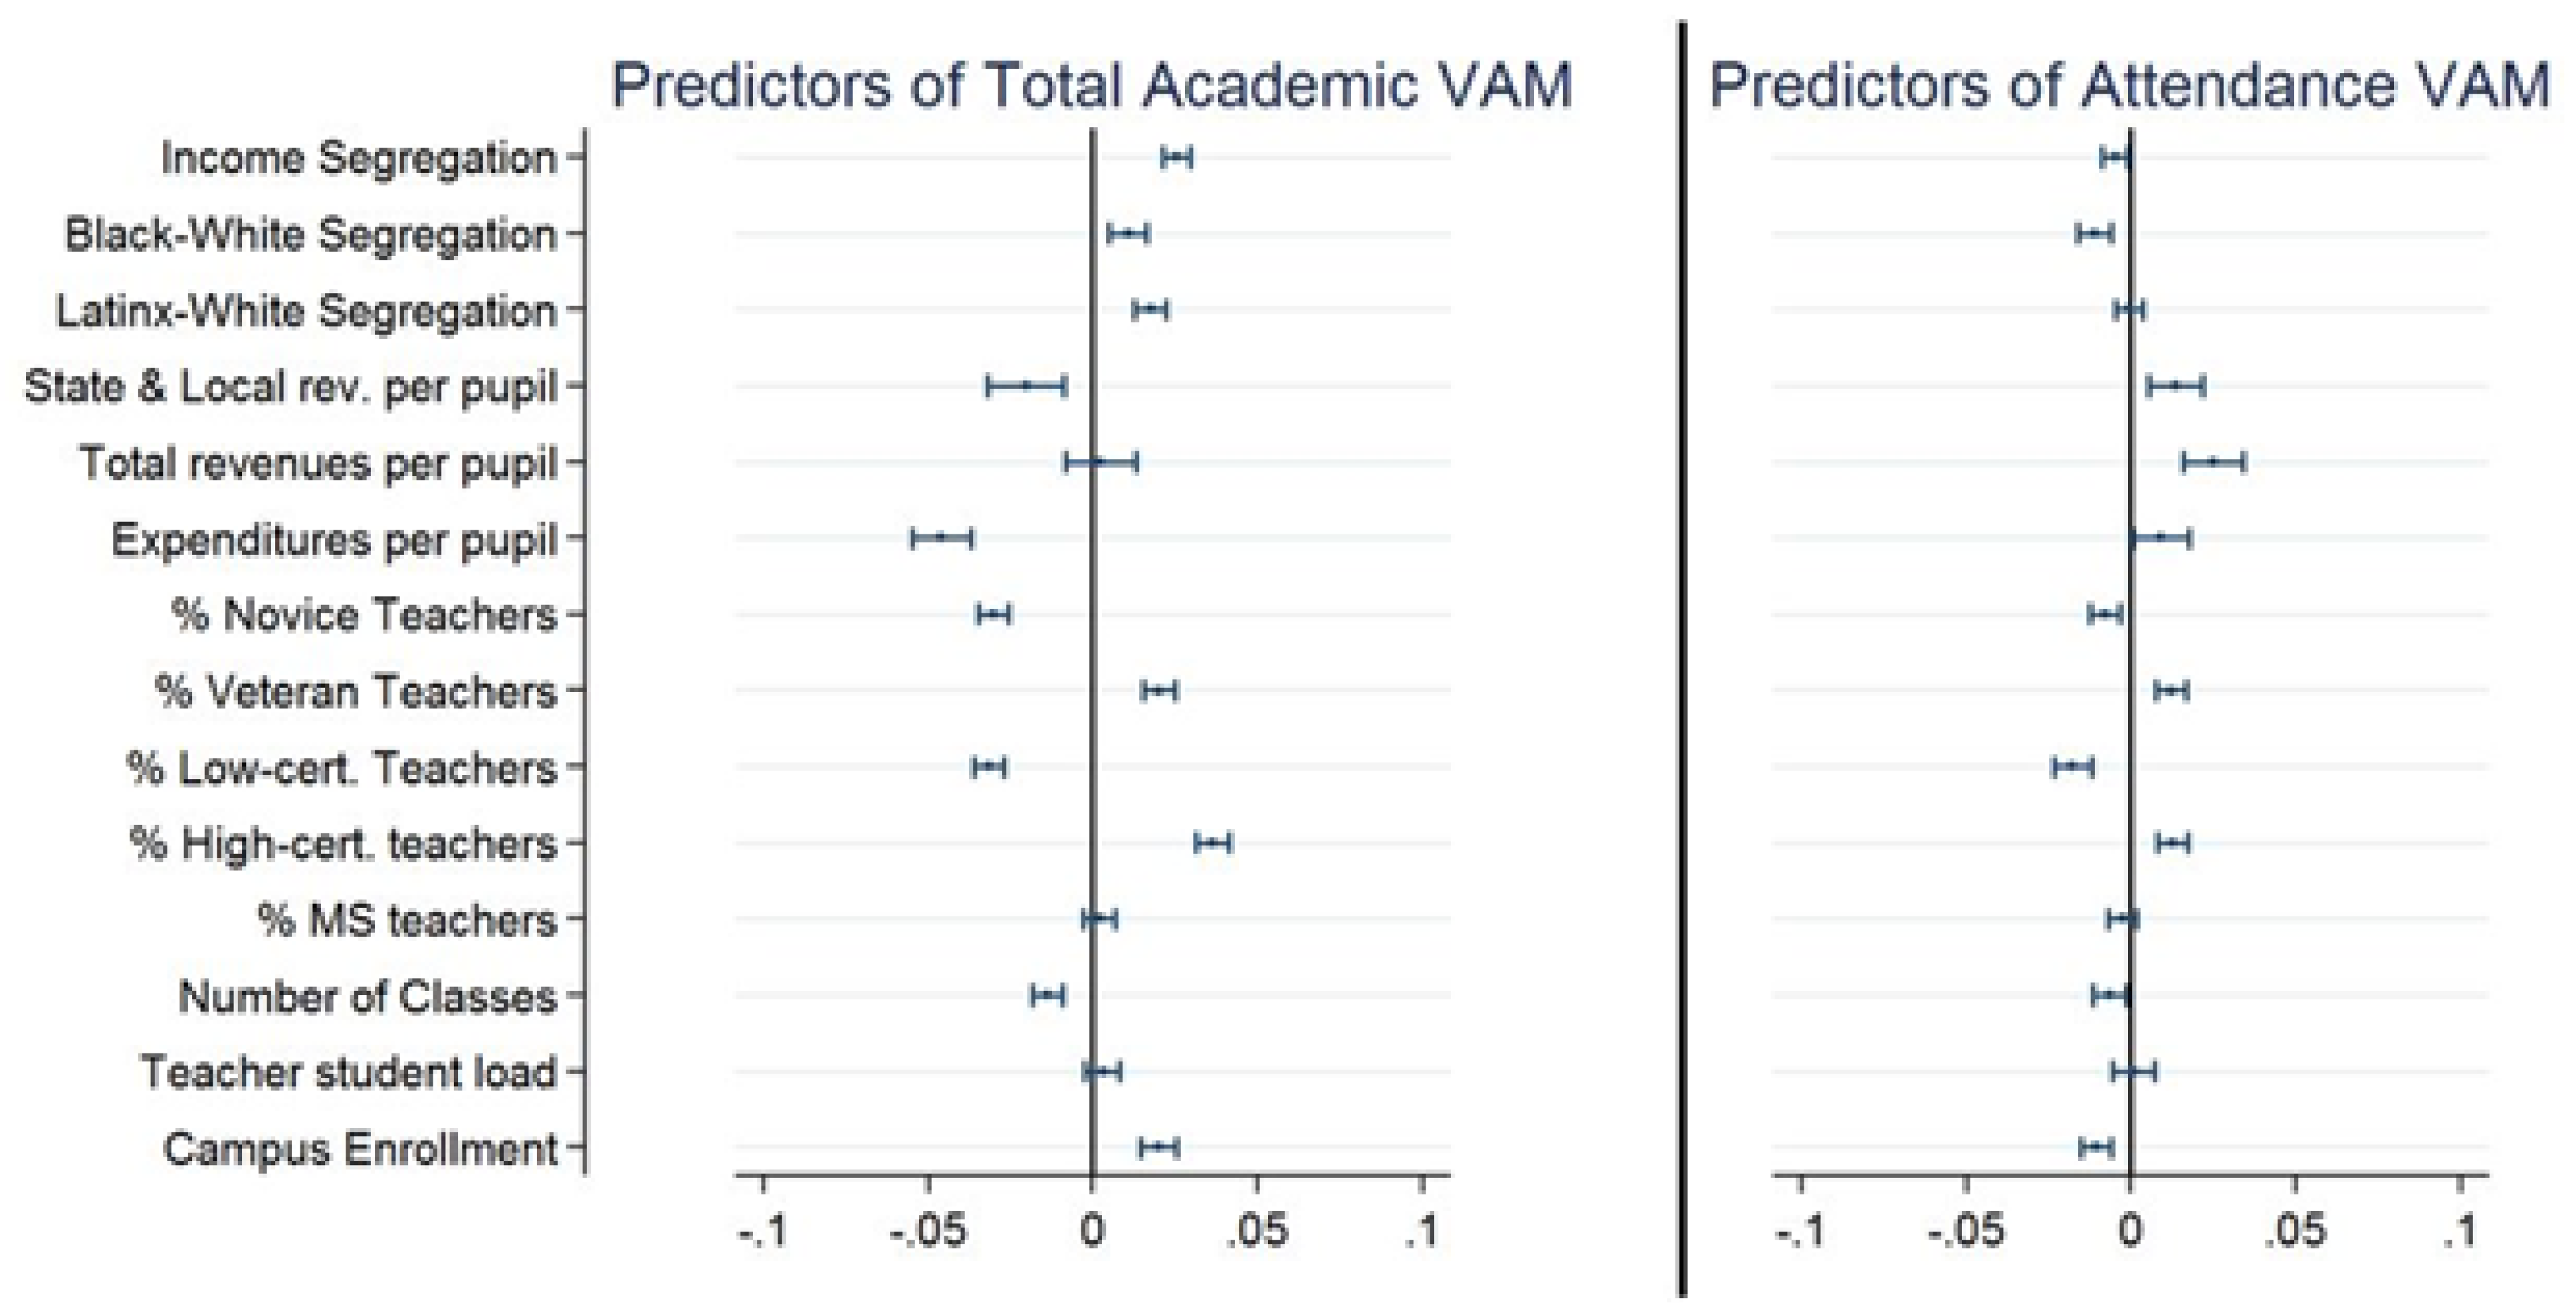
Attendance value added effects generally mirrored academic value added effects, with a few notable exceptions. Higher values of income segregation and Black-White segregation were associated with lower values for attendance value added effects, opposite of the academic values. Additionally, while larger campuses were positively associated with academic value added effects, campus enrollment was negatively associated with attendance value added effects. These results show that smaller schools may be better at encouraging students to come to school, while larger schools are associated with higher growth on test scores. All these values, along with their confidence intervals, are presented in Figure 1. This table provides a summary of the coefficients from the individual bivariate regressions, along with their 95% confidence intervals.
5. Discussion
The purpose of this study was to measure the relationships between characteristics of middle schools and the value added at the school level for academic achievement and attendance. To do this we used value added modeling to generate values for the portion of student growth in math, ELA, and attendance attributable to schools. We then regressed these values on variables related to school efficacy and the middle grades movement. Figure 1 provides a useful visual summary of the results of the bivariate regressions, which allow for comparisons of schools based only on the independent variable in question.
In response to the first research question, to what extent are middle schools that are effective in supporting student growth in achievement also effective in supporting student growth in attendance, we found evidence that schools that support academic growth are not necessarily the same schools that support attendance. While the correlations between the math value added effects and the ELA value added effects were relatively high, the correlations between the academic value added effects and the attendance value added effects were low. While there are some middle schools that support both academics and attendance, in general this is not the case.
Our second research question asked which characteristics of middle schools, including characteristics that are promoted by the middle grades movement, are significant predictors of academic and attendance value added effects. In general, schools that are more highly segregated than the demographics of the state would predict have higher values for academic value added effects, but lower values for the attendance value added effects.
Middle school movement proponents frequently argue for school schedules with fewer classes that allow students to take deeper dives into material. As shown in Figure 1, we find that schools with fewer classes in the day have significantly higher values for academic and attendance value added effects. Middle school researchers have argued that fewer classes allow for young adolescent students to explore and develop their identities [22,23]; these results provide evidence that such schedules also support measureable growth on academic and non-academic measures. While this study does not point to the mechanism for this phenomenon, these findings support continued advocacy for such shifts.
The Association for Middle Level Education advocates that young adolescents have educators who are prepared to teach them [3,4]. Our results highlight the necessity of high quality teachers. When schools have higher percentages of veteran teachers and higher percentages of teachers who have demonstrated high levels of pedagogical knowledge via exams, the school is better able to support the academic growth of students. Alongside this finding we show that schools with larger populations of these teachers also support attendance, which is vital as students are developing their identities as learners and determining how to function as students [10]. However, our results indicate that the percentage of teachers at a middle school with middle-grades specific certification is not as predictive of these measures of school efficacy. While it is important to have experienced and highly qualified teachers, certification specifically for the middle grade is not as predictive as more general measures of teacher quality. Future research in a similar vein using data from a state with middle-grades endorsements or with highly-developed middle grades teacher education curriculum could provide further insight on the importance of such specialized preparation.
During the young adolescent years, students explore and develop their own identity. Settings that are diverse along dimensions of race and class are important for this identify development [19,20,21]. Our results indicate that campuses with higher rates of segregation have higher value added effects for academics, but that such settings are potentially detrimental to supporting attendance, particularly in schools with high levels of Black-White segregation. This finding is striking, particularly given the importance of attendance at the young adolescent stage for future outcomes [10]. While additional research is necessary to disentangle the intersections of racial and economic segregation, and the larger impact on communities, our results provide an indication that such segregation may have very real negative impacts on students’ non-academic skills.
There are a number of limitations to this study, First, it is difficult to form a tangible interpretation of the regression coefficients in this model. While the literature generally considers a third of a standard deviation in a value added effect generated from a value added model as corresponding with a year of academic progress, the actual values are norm-referenced, rather than standard referenced. Resultantly, the coefficients reported in Table 4 are useful for comparative purposes. Second, the student revenue and expenditures variables are also difficult to interpret. Schools with higher needs are allotted more funding in the Texas financial model, but this funding is based on student, school, and district characteristics. Local revenues in the Texas model are also subject to recapture and distribution by the state, based on historic and current community characteristics and tax rates. Given this complexity and the focus of this study, no formal interpretation of these coefficients is offered here. Additional research focused specifically on these financial variables would be necessary to disentangle these differential effects. Finally, this study does not directly identify the adoption of a middle school model. As noted by middle school advocates, the middle school model is necessarily a holistic endeavor [7,33]. Future research that identifies such school-wide adoptions and utilizes longitudinal data to measure trends in values of school-level value added effects before and after the adoption could provide important perspective on the overall efficacy of the middle school model.
6. Conclusions
Over the past 50 years, proponents of the middle school model have argued for an education model for young adolescents that is particularly suited to their needs. Evidence to the success of the middle school model has largely been built on a research base that did not make use or large-scale quantitative analyses [8]. While this research has described the value of middle school practices through numerous lenses, for middle school advocates to make their case to policymakers and other stakeholders who are generally informed by quantitative research, we must incorporate such methodologies. The results from this study can be viewed in conjunction with the existing literature base, to help build a larger portrait of the efficacy of the middle schools. Our results support some elements of the middle school model while proving inconclusive for others. Viewed independently, such findings may support a “cafeteria” style approach to middle grades reform. It is only through interactions with existing and emerging research that we can hope to fully understand the strengths and challenges of the middle school model, to improve education continuously for young adolescents.
Author Contributions
Conceptualization, M.O.; Data curation, M.O.; Formal analysis, M.O. and D.K.; Funding acquisition, D.K.; Investigation, M.O.; Methodology, M.O. and D.K.; Project administration, D.K.; Resources, M.O. and D.K.; Software, M.O.; Supervision, D.K.; Validation, M.O. and D.K.; Visualization, M.O.; Writing—original draft, M.O.; Writing—review & editing, D.K.
Acknowledgments
The authors disclose receipt of the following financial support for the research, authorship, and/or publication of this article: This material is based upon work supported by the National Science Foundation under Grant No. 1661097 and Grant No. 1740695. Any opinions, findings, and conclusions or recommendations expressed in this material are those of the authors and do not necessarily reflect the views of the National Science Foundation.
Conflicts of Interest
The authors declare no conflict of interest.
References
- Smith, T.W.; McEwin, C.K. The Legacy of Middle School Leaders: In Their Own Words; The handbook of resources in middle level education; Information Age Pub: Charlotte, NC, USA, 2011. [Google Scholar]
- Schaefer, M.B.; Malu, K.F.; Yoon, B. An Historical Overview of the Middle School Movement, 1963–2015. RMLE Online 2016, 39, 1–27. [Google Scholar] [CrossRef]
- National Middle School Association. This We Believe; National Middle School Association: Columbus, OH, USA, 1982. [Google Scholar]
- National Middle School Association. This We Believe: Successful Schools for Young Adolescents; National Middle School Association: Westerville, OH, USA, 2003. [Google Scholar]
- Juvonen, J.; Le, V.-N.; Kaganoff, T.; Augustine, C.; Constant, L. Focus on the Wonder Years: Challenges Facing The American Middle School; RAND Corporation: Santa Monica, CA, USA, 2004. [Google Scholar]
- McEwin, C.K.; Greene, M.W. The Status of Programs and Practices in America’s Middle Schools: Results from Two National Studies; Association for Middle Level Education: Westerville, OH, USA, 2011. [Google Scholar]
- Erb, T.O. Enacting comprehensive middle grades reform. In This We Believe in Action: Implementing Successful Middle Level Schools; Erb, T.O., Ed.; National Middle School Association: Westerville, OH, USA, 2005; pp. 1–10. [Google Scholar]
- Mertens, S.B.; Caskey, M.M.; Flowers, N. The Need for Large-Scale, Longitudinal Empirical Studies in Middle Level Education Research. Middle Grades Rev. 2016, 2, 1–11. [Google Scholar]
- Figlio, D.; Karbownik, K.; Salvanes, K. The Promise of Administrative Data in Education Research. Educ. Financ. Policy 2017, 12, 129–136. [Google Scholar] [CrossRef]
- Balfanz, R.; Bridgeland, J.M.; Hornig Fox, J.; DePaoli, J.L.; Ingram, E.S.; Maushard, M. Building a Grad Nation: Progress and Challenge in Ending the High School Dropout Epidemic; America’s Promise Alliance: Washington, DC, USA, 2014. [Google Scholar]
- Gershenson, S. Linking teacher quality, student attendance, and student achievement. Educ. Financ. Policy 2016, 11, 125–149. [Google Scholar] [CrossRef]
- Middle Level Education Research Special Interest Group. The MLER SIG Research Agenda; American Educational Research Association: Washington, DC, USA, 2016. [Google Scholar]
- Scales, P.C. Characteristics of young adolescents. In This We Believe: Successful Schools for Young Adolescents; National Middle School Association: Westerville, OH, USA, 2003; pp. 43–51. [Google Scholar]
- McEwin, C.K.; Greene, M.W. Results and recommendations from the 2009 national surveys of randomly selected and highly successful middle level schools. Middle Sch. J. 2010, 42, 49–63. [Google Scholar] [CrossRef]
- Mertens, S.B.; Anfara, V.A.; Caskey, M. The Young Adolescent and the Middle School (Handbook of Research in Middle Level Education); IAP-Information Age Pub: Charlotte, NC, USA, 2007. [Google Scholar]
- Jackson, A.; Davis, G.A.; Abeel, M.; Bordonaro, A. Turning Points 2000: Educating Adolescents in the 21st Century; Teachers College Press: New York, NY, USA, 2000. [Google Scholar]
- Erikson, E.H. Identity: Youth and Crisis; W.W. Norton: New York, NY, USA, 1968. [Google Scholar]
- Nakkula, M.J. Identity and possibility: Adolescent development and the potential of schools. In Adolescents at School: Perspectives on Youth, Identity, and Education; Sadowski, M., Ed.; Harvard Education Press: Cambridge, MA, USA, 2003; pp. 7–18. [Google Scholar]
- Noguera, P. “Joaquín’s Dilemma”: Understanding the link between racial identity and school-related behaviors. In Adolescents At School: Perspectives On Youth, Identity, And Education; Sadowski, M., Ed.; Harvard Education Press: Cambridge, MA, USA, 2003; pp. 19–30. [Google Scholar]
- Brown, D.F.; Leaman, H. Recognizing and responding to young adolescents’ ethnic identity development. In The Young Adolescent And The Middle School (Handbook Of Research In Middle Level Education); IAP-Information Age Pub: Charlotte, NC, USA, 2007; pp. 219–235. [Google Scholar]
- Brantlinger, E. Who wins and who loses?: Social class and student identities. In Adolescents at School: Perspectives on Youth, Identity, and Education; Sadowski, M., Ed.; Harvard Education Press: Cambridge, MA, USA, 2003; pp. 19–30. [Google Scholar]
- Hackmann, D.G. Block Scheduling for the Middle Level: A Cautionary Tale About the Best Features of Secondary School Models. Middle Sch. J. 2002, 33, 22–28. [Google Scholar] [CrossRef]
- Keefe, J.W.; Jenkins, J.M. A Special Section on Personalized Instruction. Phi Delta Kappan 2002, 83, 440–448. [Google Scholar] [CrossRef]
- Borman, G.D.; Dowling, N.M. Teacher Attrition and Retention: A Meta-Analytic and Narrative Review of the Research. Rev. Educ. Res. 2008, 78, 367–409. [Google Scholar] [CrossRef]
- Kolbe, T.; Strunk, K.O. Economic Incentives as a Strategy for Responding to Teacher Staffing Problems A Typology of Policies and Practices. Educ. Adm. Q. 2012, 48, 779–813. [Google Scholar] [CrossRef]
- Hanushek, E.A.; Rivkin, S.G. Generalizations about using value-added measures of teacher quality. Am. Econ. Rev. 2010, 100, 267–271. [Google Scholar] [CrossRef]
- Chetty, R.; Friedman, J.N.; Rockoff, J.E. Measuring the Impacts of Teachers II: Teacher Value-Added and Student Outcomes in Adulthood. Am. Econ. Rev. 2014, 104, 2633–2679. [Google Scholar] [CrossRef]
- Chingos, M.M.; Whitehurst, G.J.; Gallaher, M.R. School Districts and Student Achievement. Educ. Financ. Policy 2015, 10, 378–398. [Google Scholar] [CrossRef]
- Knight, D.S.; Olofson, M.W. Funding School Districts Based on Student Attendance: How Use of Average Daily Attendance Harms School Finance Equity in Texas; Center for Education Research and Policy Studies: El Paso, TX, USA, 2018. [Google Scholar]
- Wright, B.; Lee, S.; Murphy, D.; Kallus, R.; Whalen, C. Enrollment in Texas Public Schools 2016–17; Texas Education Agency: Austin, TX, USA, 2017. [Google Scholar]
- Goldhaber, D.; Quince, V.; Theobald, R. Has It Always Been This Way? Tracing the Evolution of Teacher Quality Gaps in US Public Schools; American Institutes for Research: Washington, DC, USA, 2016. [Google Scholar]
- Reardon, S.F. The widening academic achievement gap between the rich and the poor: New evidence and possible explanations. In Whither Opportunity? Rising Inequality, Schools, and Children’s Life Chances; Duncan, G.J., Murnane, R.J., Eds.; Russell Sage Foundation: New York, NY, USA, 2011; pp. 91–116. [Google Scholar]
- Vermont Middle Grades Task Force. Middle School Is not a Building: Educating Vermont’s Young Adolescents in the 21st Century; Vermont Association for Middle Level Education: Marlboro, VT, USA, 2009. [Google Scholar]
Figure 1.
Values of coefficients with confidence intervals.

Table 1.
Sample Characteristics.
| School Characteristics | Average |
|---|---|
| Student Population | 673 |
| Teacher Population | 51 |
| Number of Classes | 7.3 |
| Student Characteristics | |
| Free/Reduced Price Lunch | 50.10% |
| White/Caucasian | 32.66% |
| Black/African American | 11.79% |
| Latinx, not White | 48.13% |
| Teacher Characteristics | |
| Novice Teachers | 27.07% |
| Veteran Teachers | 39.87% |
| Lowest Decile Certification Score | 8.45% |
| Highest Decile Certification Score | 6.28% |
| Middle School Certification | 36.69% |
Notes: N = 1735. Values taken from 2014–2015 academic year.
Table 2.
Standard Deviations of Value Added Effects.
| Pooled | 2014–15 | |
|---|---|---|
| Total VAE | 0.108 | 0.113 |
| Math VAE | 0.148 | 0.159 |
| ELA VAE | 0.094 | 0.095 |
| Attendance VAE | 0.139 | 0.125 |
Table 3.
Correlations of Value Added Effects.
| Panel A | |||
| Pooled Sample | |||
| Math VAE | ELA VAE | Attendance VAE | |
| Math VAE | 1 | ||
| ELA VAE | 0.56 | 1 | |
| Attendance VAE | 0.25 | 0.31 | 1 |
| 2014–2015 | |||
| Math VAE | ELA VAE | Attendance VAE | |
| Math FE VAE | 1 | ||
| ELA VAE | 0.53 | 1 | |
| Attendance VAE | 0.22 | 0.35 | 1 |
| Panel B | |||
| Lagged Year Correlations | |||
| Math VAE | ELA VAE | Attendance VAE | |
| Math VAE | 0.60 | 0.34 | 0.23 |
| ELA VAE | 0.36 | 0.58 | 0.29 |
| Attendance VAE | 0.23 | 0.31 | 0.61 |
Table 4.
Bivariate Regression Results, Pooled sample.
| Predictor Variable | Math VAE | ELA VAE | Attendance VAE |
|---|---|---|---|
| Income Segregation | 0.032 *** | 0.019 *** | −0.005 * |
| Black-White Segregation | 0.012 ** | 0.009 *** | −0.011 *** |
| Hispanic-White Segregation | 0.025 *** | 0.010 *** | −0.001 |
| State & Local revenues per pupil | −0.021 ** | −0.020 *** | 0.013 ** |
| Total revenues per pupil | 0.003 | 0.001 | 0.025 *** |
| Expenditures per pupil | −0.048 *** | −0.044 *** | 0.009 * |
| % Novice Teachers | −0.032 *** | −0.028 *** | −0.008 *** |
| % Veteran Teachers | 0.020 *** | 0.020 *** | 0.012 *** |
| % Low-cert. Teachers | −0.032 *** | −0.031 *** | −0.018 *** |
| % High-cert. teachers | 0.041 *** | 0.032 *** | 0.013 *** |
| % MS teachers | 0.001 | 0.003 | −0.003 |
| Number of classes in the day | −0.017 *** | −0.011 *** | −0.006 * |
| Teacher student load | 0.002 | 0.004 | 0.001 |
| Campus Enrollment | 0.022 *** | 0.018 *** | −0.011 *** |
Note. * p < 0.05, ** p < 0.01, *** p < 0.001. Regressions were weighted by campus enrollment.
© 2018 by the authors. Licensee MDPI, Basel, Switzerland. This article is an open access article distributed under the terms and conditions of the Creative Commons Attribution (CC BY) license (http://creativecommons.org/licenses/by/4.0/).
Share and Cite
MDPI and ACS Style
Olofson, M.; Knight, D. Does the Middle School Model Make a Difference? Relating Measures of School Effectiveness to Recommended Best Practices. Educ. Sci. 2018, 8, 160. https://doi.org/10.3390/educsci8040160
AMA Style
Olofson M, Knight D. Does the Middle School Model Make a Difference? Relating Measures of School Effectiveness to Recommended Best Practices. Education Sciences. 2018; 8(4):160. https://doi.org/10.3390/educsci8040160
Chicago/Turabian StyleOlofson, Mark, and David Knight. 2018. "Does the Middle School Model Make a Difference? Relating Measures of School Effectiveness to Recommended Best Practices" Education Sciences 8, no. 4: 160. https://doi.org/10.3390/educsci8040160
Note that from the first issue of 2016, this journal uses article numbers instead of page numbers. See further details here.