1. Introduction—Why Analyze Educational Computing Research from 1977–2005?
Since the 1970s, researchers began to notice the flexibility and repeatability of computer programs for instruction and this started the era of computer assisted instruction. From those origins more than 30 years ago, educational computing research emerged. We understand that, over time, various terms have been used, such as learning technologies, information and communication technologies for education (ICTE), and digital technologies. Furthermore, the interface between these technologies and learning has been reflected in the use of terms, such as eLearning (electronic learning) and mLearning (mobile learning). For the purposes of this paper, we have defined educational computing research as research that focuses on using information and communication technologies (ICT) to foster innovative pedagogy in terms of improving the effectiveness of learning and teaching.
Arguably, we have witnessed incremental and transformational developments of ICT as technological changes have been dynamic, and disruptive. In particular, the Internet has enabled eLearning, and Pahl [
1] noted that technological changes, such as the Internet, have radically changed the way education has been delivered. Few could have imagined, even a decade ago, what technologies we now have available. Despite these developments, a search of the literature revealed that earlier studies had noted that there has been very little study of trends [
2,
3,
4]. The purpose of this study is to analyze educational computing research from the period 1977–2005 to inform understandings of eLearning trends. The paper concludes with explanations of how the educational computing research from 1997–2005 can assist in our understandings of the emergence of the current focus on Technological Pedagogical Content Knowledge (TPACK) [
5] needed for effective eLearning.
An obvious question is—Why analyze educational computing trends from 1977–2005? The rationale for this is that a valuable role of research is to identify historical trends and these are replete in educational research literature other than educational computing. Our argument for the selection of the period from 1977 until 2005 is based primarily on the fact that no one has done this. In addition, by presenting this analysis, it can form the basis for a similar analysis for the period 2006–2015. Consequently, this paper, in analyzing 2,694 journal articles from four quality, international journals during that period, provides a platform for understanding where we have come from through an evidence informed approach. The paper then briefly examines the emergence of the Technological Pedagogical Content Knowledge (TPACK) literature, in order to make predictions about the future in relation to educational computing research, policy and practice.
1.1. Selection of the International Educational Computing Journals
In terms of educational computing research, research articles published in academically rigorous, scholarly educational computing journals were identified as being appropriate sources for exploring this issue. The educational computing journals selected were
Computers & Education [
6],
Journal of Computer Assisted Learning [
7],
British Journal of Educational Technology [
8], and
Educational Technology & Society [
9]. The journals were selected as they are considered to be leading educational computing journals, are included in the Web of Science (2013) Social Sciences Citation Index (see http://ip-science.thomsonreuters.com/mjl/publist_ssci.pdf), and they have been published for a considerable period of time. They continue to be ranked in the Top 50 in the Education Subject Category of the Social Sciences in the
SCImago Journal & Country Rank (SJR) that includes the journals and country scientific indicators developed from the information contained in the Scopus
® database. Their rankings are
Computers & Education (6/50),
Journal of Computer Assisted Learning (11/50),
British Journal of Educational Technology (25/50), and
Educational Technology & Society (47/50). Furthermore, their Impact Factors, provided on their respective journal websites are provided; namely,
Computers & Education (Impact Factor: 2.775) [
6],
Journal of Computer Assisted Learning (Impact Factor: 1.632) [
7],
British Journal of Educational Technology (Impact Factor: 1.313) [
8] and
Educational Technology & Society (Impact Factor: 1.171) [
9]. Consequently, a total of 2,694 journal papers published between the years 1977 to 2005 in these four major educational computing journals were analyzed.
The methodology employed an approach, which focused upon each paper’s title, abstract, and keywords. Two educational computing researchers independently coded each paper with an analysis framework to categorize the paper by its research theme compiled from the paper’s title, abstract, and keywords. Clustering analysis and multi-dimension scale analysis were performed on the categorized results to explore the research emphasis, research distribution, and the evolutionary trends of the educational computing research. In addition, as educational computing research is multi-disciplinary and may involve ICT, pedagogy, behavior science, cognition science, and other related fields, research diversity was analyzed through Simpson’s diversity index [
10] to provide more information on the research emphasis and direction for educational computing researchers, policy makers, and practitioners.
This paper is structured so that the following section describes more fully the analysis framework that was used in this paper categorization process. Subsequently, the research methodology, the main results and discussions drawn from the analyses are presented. The final section provides the concluding remarks and implications of our research, to establish an understanding of the trends identified from 1977–2005 to establish a platform on which future analysis of the literature from 2006–2013 could build our understandings about how those historical trends have informed the current, expanding research, for example, about TPACK [
5] and eLearning.
2. The Analysis Framework
Although several researchers [
1,
11,
12] have discussed the definition and content of educational computing research, there was still no clear analysis framework able to be identified that was suitable and scientifically sound for our research purposes. Therefore, we needed to develop an analysis framework before we could proceed to categorize papers. Following a top-down approach, we determined that the analysis framework should have a three-layer hierarchical tree structure. The first-layer attributes, according to the related research, would define the dimensions of this field. The second layer would show the sub-dimensions of the upper layer, while the attributes in the third layer would be the research themes of each sub-dimension. The research themes we provide in the third layer of the analysis framework were compiled from the paper categorizations of the four major educational computing journals that were analyzed. Using this three-layer analysis framework, we are able to effectively categorize a paper into this framework according to its research theme.
The definition of educational computing that was compiled from the studies of Pahl [
1], Cloete [
11], and Nulden [
12]. As outlined earlier, it can be defined as research that focuses on using ICT to foster innovative pedagogy to improve the effectiveness of learning and teaching. Accordingly, educational computing research involves four dimensions, namely, person, ICT, information systems, and pedagogy [
1,
11,
12,
13]. These four dimensions form the first layer of the analysis framework.
The ‘person’ is considered to be an important dimension in educational computing research. This analysis unit can be categorized into three levels, namely,
Therefore, the person dimension can be divided into four sub-dimensions; namely, student, teacher, community, and school. In the ICT dimension, different specific information technologies have been discussed as to their possibilities and applications in education [
14,
15,
16]. These include multimedia, interface design, Internet, mobile communication, web technology, hypertext, and artificial intelligence. Consequently, we directly included these into the third layer with no further sub-dimensions being applied to Layer 2. The information systems dimension was similarly regarded. Layer 3 includes specific educational information systems and no more sub-dimensions were derived from Layer 2. Finally, according to Nulden’s study [
12], we identified learning models and content design as the sub-dimensions of pedagogy.
Table 1 displays the sub-dimensions of the first and second layers of the analysis framework.
Table 1.
Sub-dimensions of Layer 1 and Layer 2 of the analysis framework.
Table 1.
Sub-dimensions of Layer 1 and Layer 2 of the analysis framework.
| Layer 1 | Layer 2 |
|---|
| Person | Student |
| Teacher |
| Community |
| School |
| ICT | ICT |
| Information system | Information system |
| Pedagogy | Learning model |
| Content Design |
Attributes in the third layer of the analysis framework have to fully reflect the research theme of each paper. Although there has been little previous research on this, the paper categorizations of the educational computing journals have been documented with good references. Based on the paper categorizations of
Computers & Education [
6],
Journal of Computer Assisted Learning [
7],
British Journal of Educational Technology [
8], and
Educational Technology & Society [
9], we defined the attributes of the third layer of framework. In total, there were 53 attributes in the third layer.
Table 2 displays the 53 third layer attributes.
Table 2.
Attributes of the Third Layer of the analysis framework.
Table 2.
Attributes of the Third Layer of the analysis framework.
| Layer1 | Layer2 | Layer3 (Attribute) |
|---|
| 1.Person | 1.Learner | Cognitive Style Learning Style Self-Efficacy Computer Literacy Computer Usage Internet Usage Personalization Gender Individual Difference
|
| 2.Teacher | Computer Literacy Attitude Intention
|
| 3.Community | Learning Interaction Development
|
| 4.School | Resource and Support Organization Culture Organization Structure Performance Evaluation
|
| Information System | Information System | Intelligent Tutoring System Web-based Learning System Computer Assisted Instruction/Learning System Campus System Computer-Mediated Communication Knowledge-based Learning System Assessment System Learning Management System Learning Content Management System Game-based Learning Authoring Tool
|
| ICT | ICT | |
| Pedagogy | Learning Model | Mastery Learning Collaborative Learning Adult Education Special Education Teaching/Learning with ICT Problem-Based Learning (PBL) Discovery Teaching Method Constructivism Activity Theory Motivation Theory Discovery Learning
|
| Content Design | |
4. Data Analysis and Discussion
4.1. Clusters of Educational Computing Research
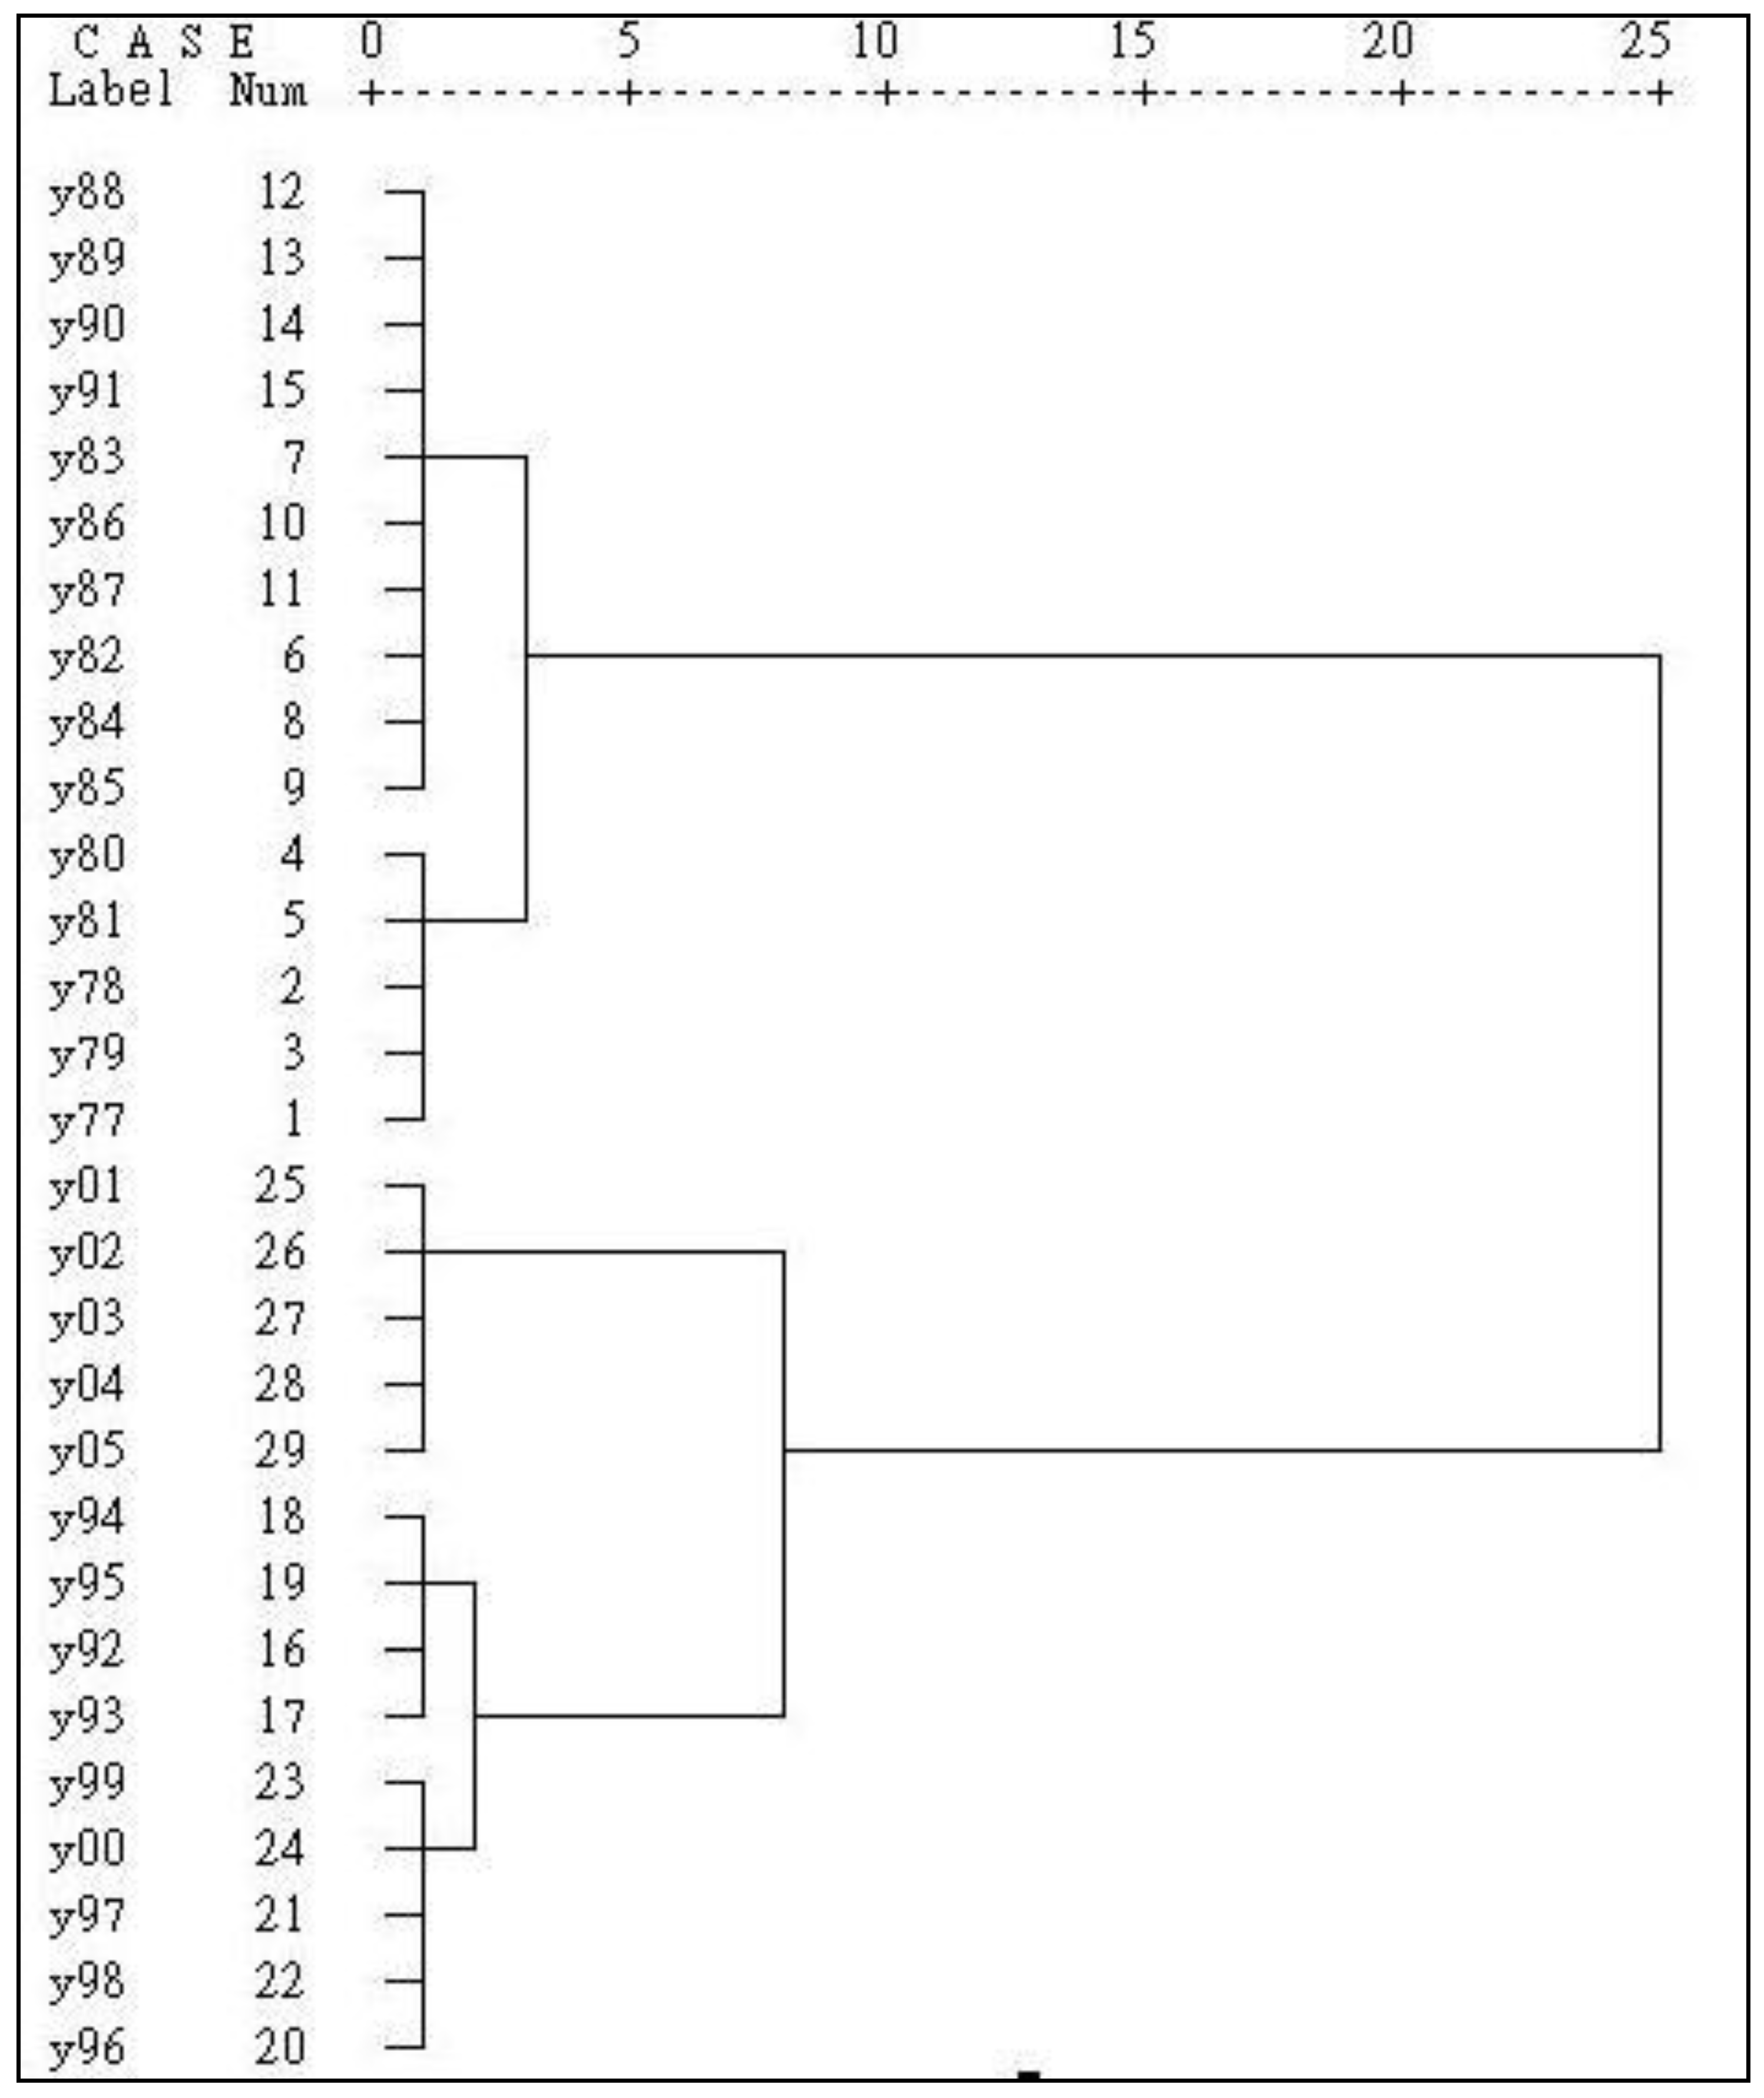
Based on the yearly aggregative results between the years 1977 to 2005, by summing up the categorized results of the same year,
Figure 1 presents the clusters created by clustering analysis. Five major clusters were found; namely, (y77, y78, y79, y81), (y82, y83, y84, y85, y86, y87, y88, y89, y90, y91), (y92, y93, y94, y95), (y96, y97, y98, y99, y00), and (y01, y02, y03, y04, y05). The results reveal that educational computing research has been evolving different research emphases during the past thirty years, which can be categorized into five periods, namely, 1977~1981, 1982~1991, 1992~1995, 1996~2000, and 2001~2005.
In the first period, from 1977 to 1981, the analysis shows that researchers began discussing the possibility of computer appropriation and application for instruction. Much attention had been focused on the topic of Computer Assisted Instruction (CAI), especially based on personal computers. This period marked the initial stage of educational computing. During the following period, from 1982 to 1991 which spanned approximately ten years, the data analysis indicates that CAI still played a major part, but, more specifically, the research focused on design issues and trying to apply existing package programs to education. The number of papers published in this period increased significantly. The evidence indicates that educational computing research, which focused on CAI research, grew to maturity in this period.
Figure 1.
Clusters created by clustering analysis (Explanation: e.g., y77 represents 1977, and y00 represents 2000).
Figure 1.
Clusters created by clustering analysis (Explanation: e.g., y77 represents 1977, and y00 represents 2000).
During the years 1992 to 1995, although the main research emphasis still focused on CAI, the quantity of papers diminished when compared with the previous period. The research agenda began to shift more substantially toward Web-based learning and intelligent tutoring systems. This marked the transition from CAI research to the emergence of the initial stage of web-based learning research.
The trend towards web-based learning research increased substantially between 1996 and 2000. Related topics identified in the data analysis included learning community, cooperative learning, and problem-based learning, Educational computing research on web-based learning entered a growth phase in this period. Clearly, the increasing access to the Internet accompanied this new research interest, and web-based learning gave rise to eLearning research and possibilities.
The analysis indicates that web-based learning related research was dominant from 2001 until 2005. Research increased much more than in the previous period. Personalization of learning and adaptive learning are reflected in the research emphasis and they related to web-based learning. In addition, with the progress and maturation of wireless network technologies and mobile telecommunication technologies, research work focusing on these technologies occurred in this period. This period reflected a further shift from web-based learning research to the initial stages of increasing interest in mobile-based and ubiquitous learning.
In addition to observing the research emphasis from the viewpoint of the third layer of the analysis framework, the categorized results in each cluster were aggregated to the first layer of categorized results in order to reveal the research distribution from a macro view.
Table 4 shows the number of papers and ratios of each dimension of research to the entire range of research for each period.
Table 4.
The number of papers and ratios of each research dimension for each period.
Table 4.
The number of papers and ratios of each research dimension for each period.
| Dimension Period | Person | Applications | ICT | Pedagogy |
|---|
| 1977~1981 | 19 (13.7%) | 100 (64.2%) | 16 (10.1%) | 19 (12.1%) |
| 1982~1991 | 159 (18.2%) | 411 (47.4%) | 150 (17.2%) | 148 (16.8%) |
| 1992~1995 | 134 (26.8%) | 201 (40.3%) | 114 (20.2%) | 95 (12.4%) |
| 1996~2000 | 169 (20.2%) | 417 (49.4%) | 142 (17.1%) | 112 (13.4%) |
| 2001~2005 | 276 (19.1%) | 733 (50.6%) | 215 (14.8%) | 225 (15.4%) |
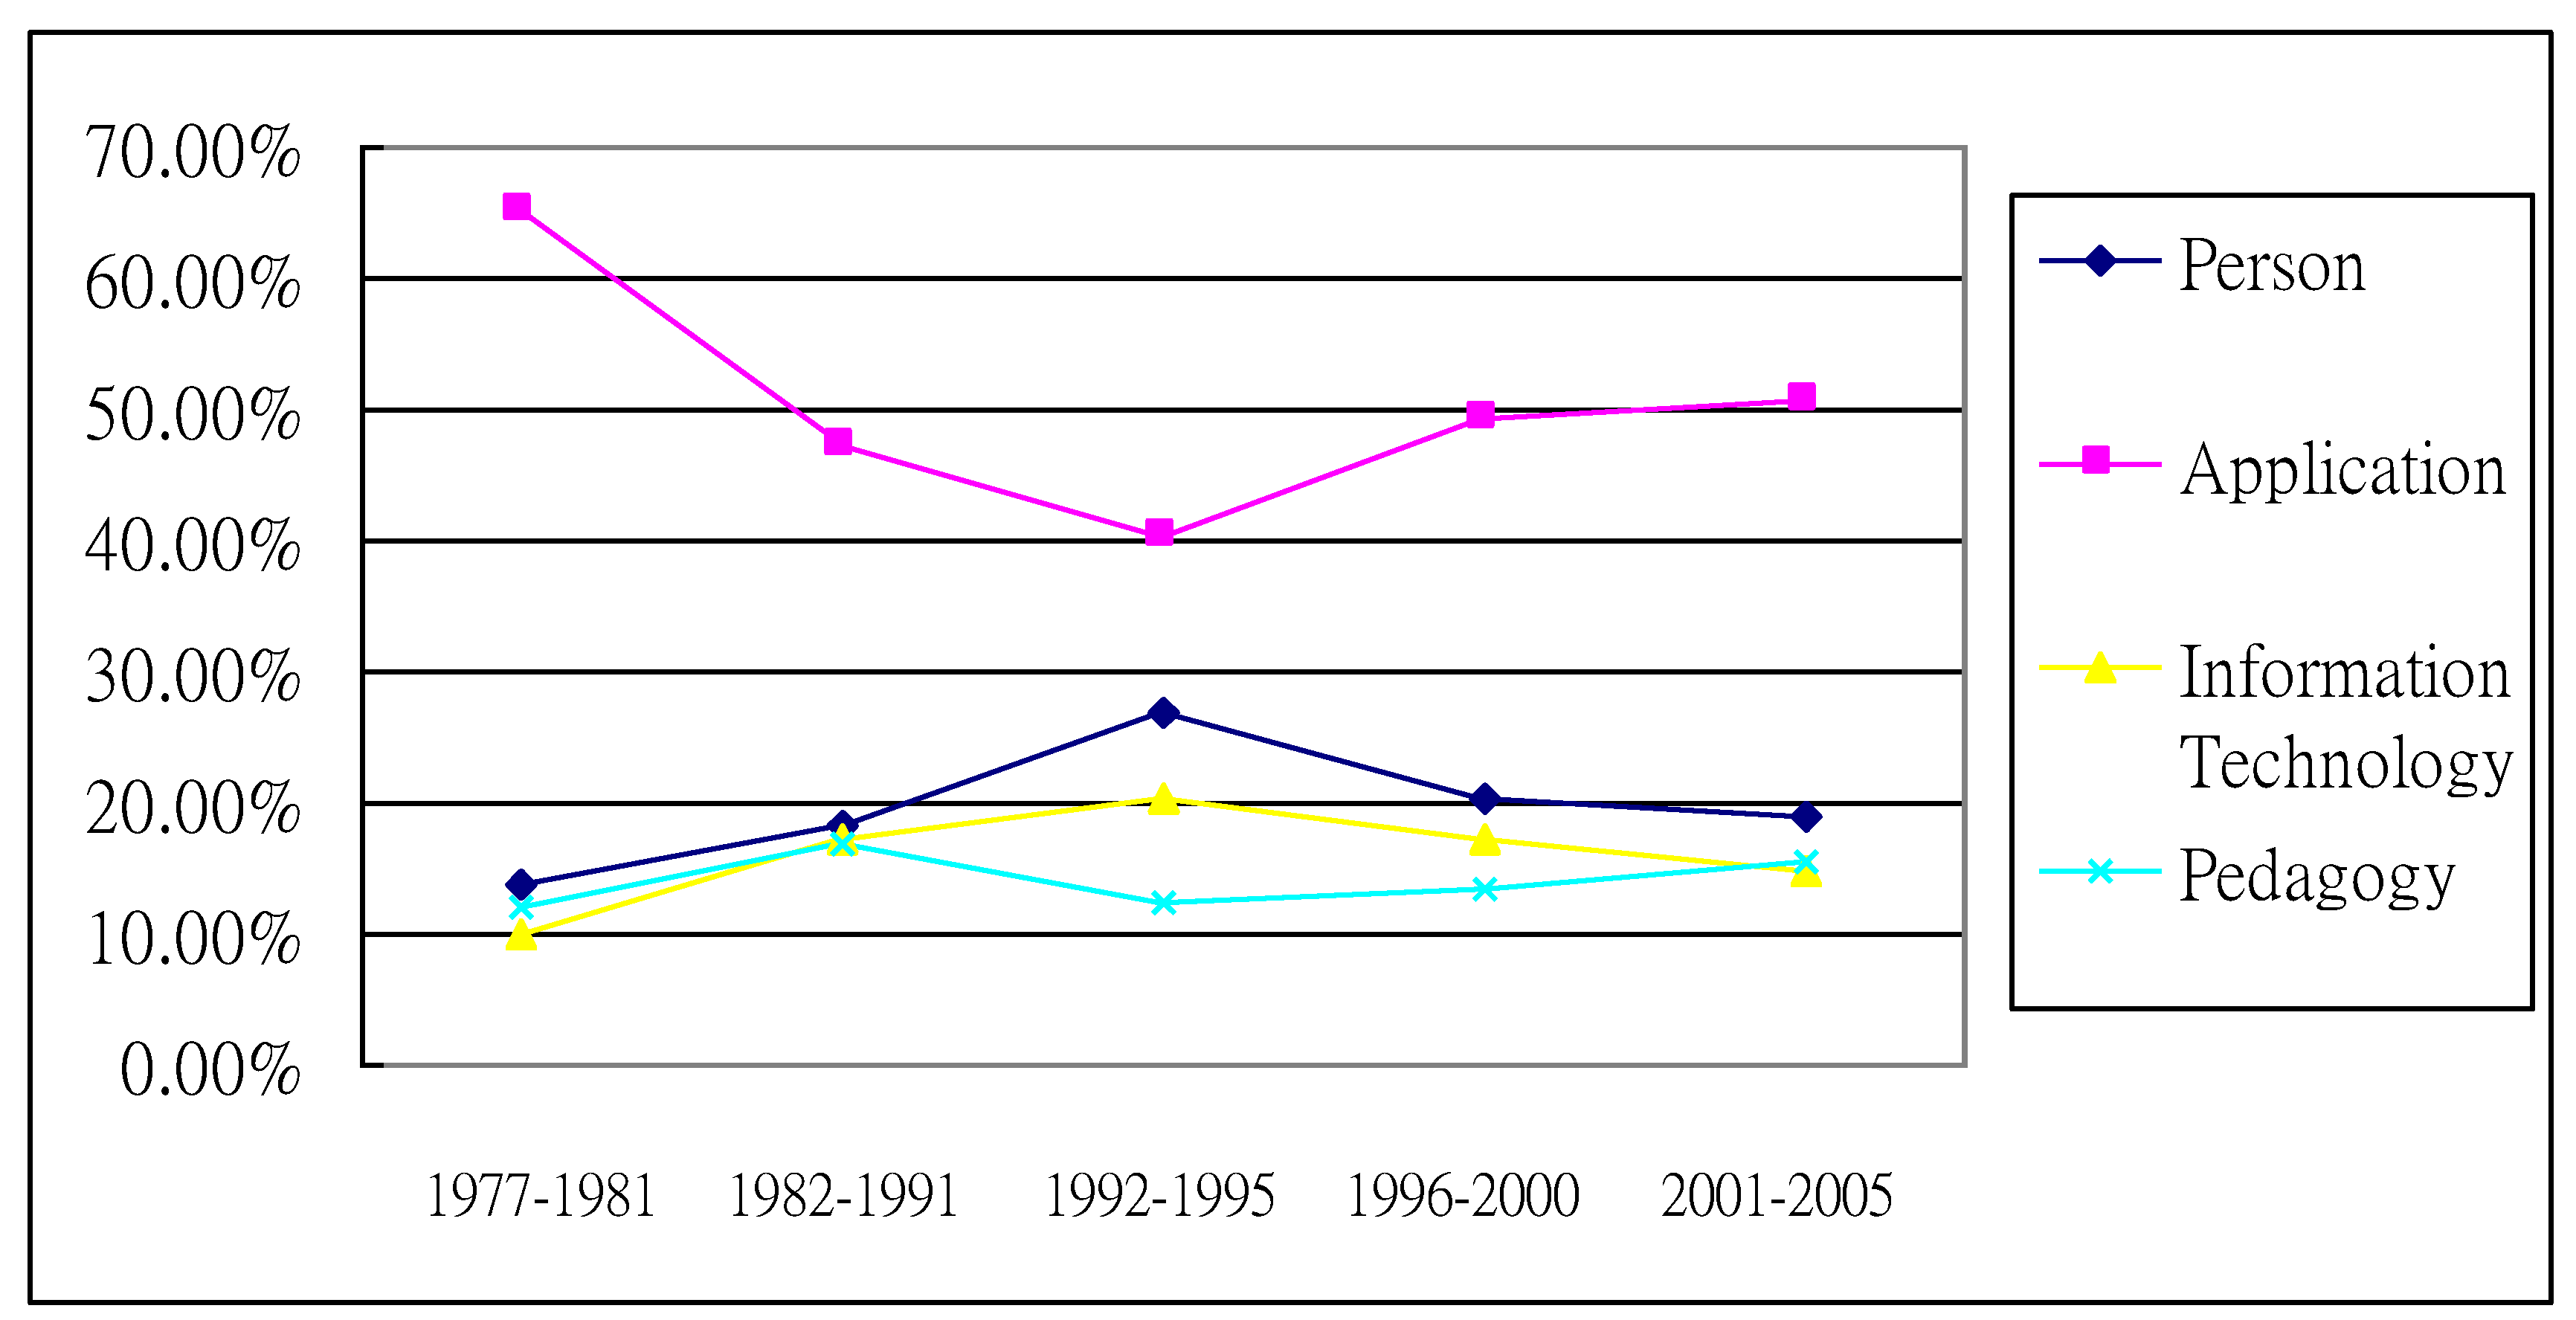
As shown in
Figure 2, which displays the research distribution ratio curve and complements
Table 4, the application dimension obtained research emphasis as seen in all five periods, and has maintained a considerably higher ratio than the other dimensions of research. The research percentages of the person and IT dimensions changed slightly, and the research percentages of the pedagogy dimension were steady. This reflects the trend that the content of educational computing research as a discipline became focused on investigating the use of ICT to foster innovative pedagogy as a means of improving the effectiveness of learning and teaching.
Figure 2.
The research distribution ratio curve.
Figure 2.
The research distribution ratio curve.
4.2. The Trends in Educational Computing Research
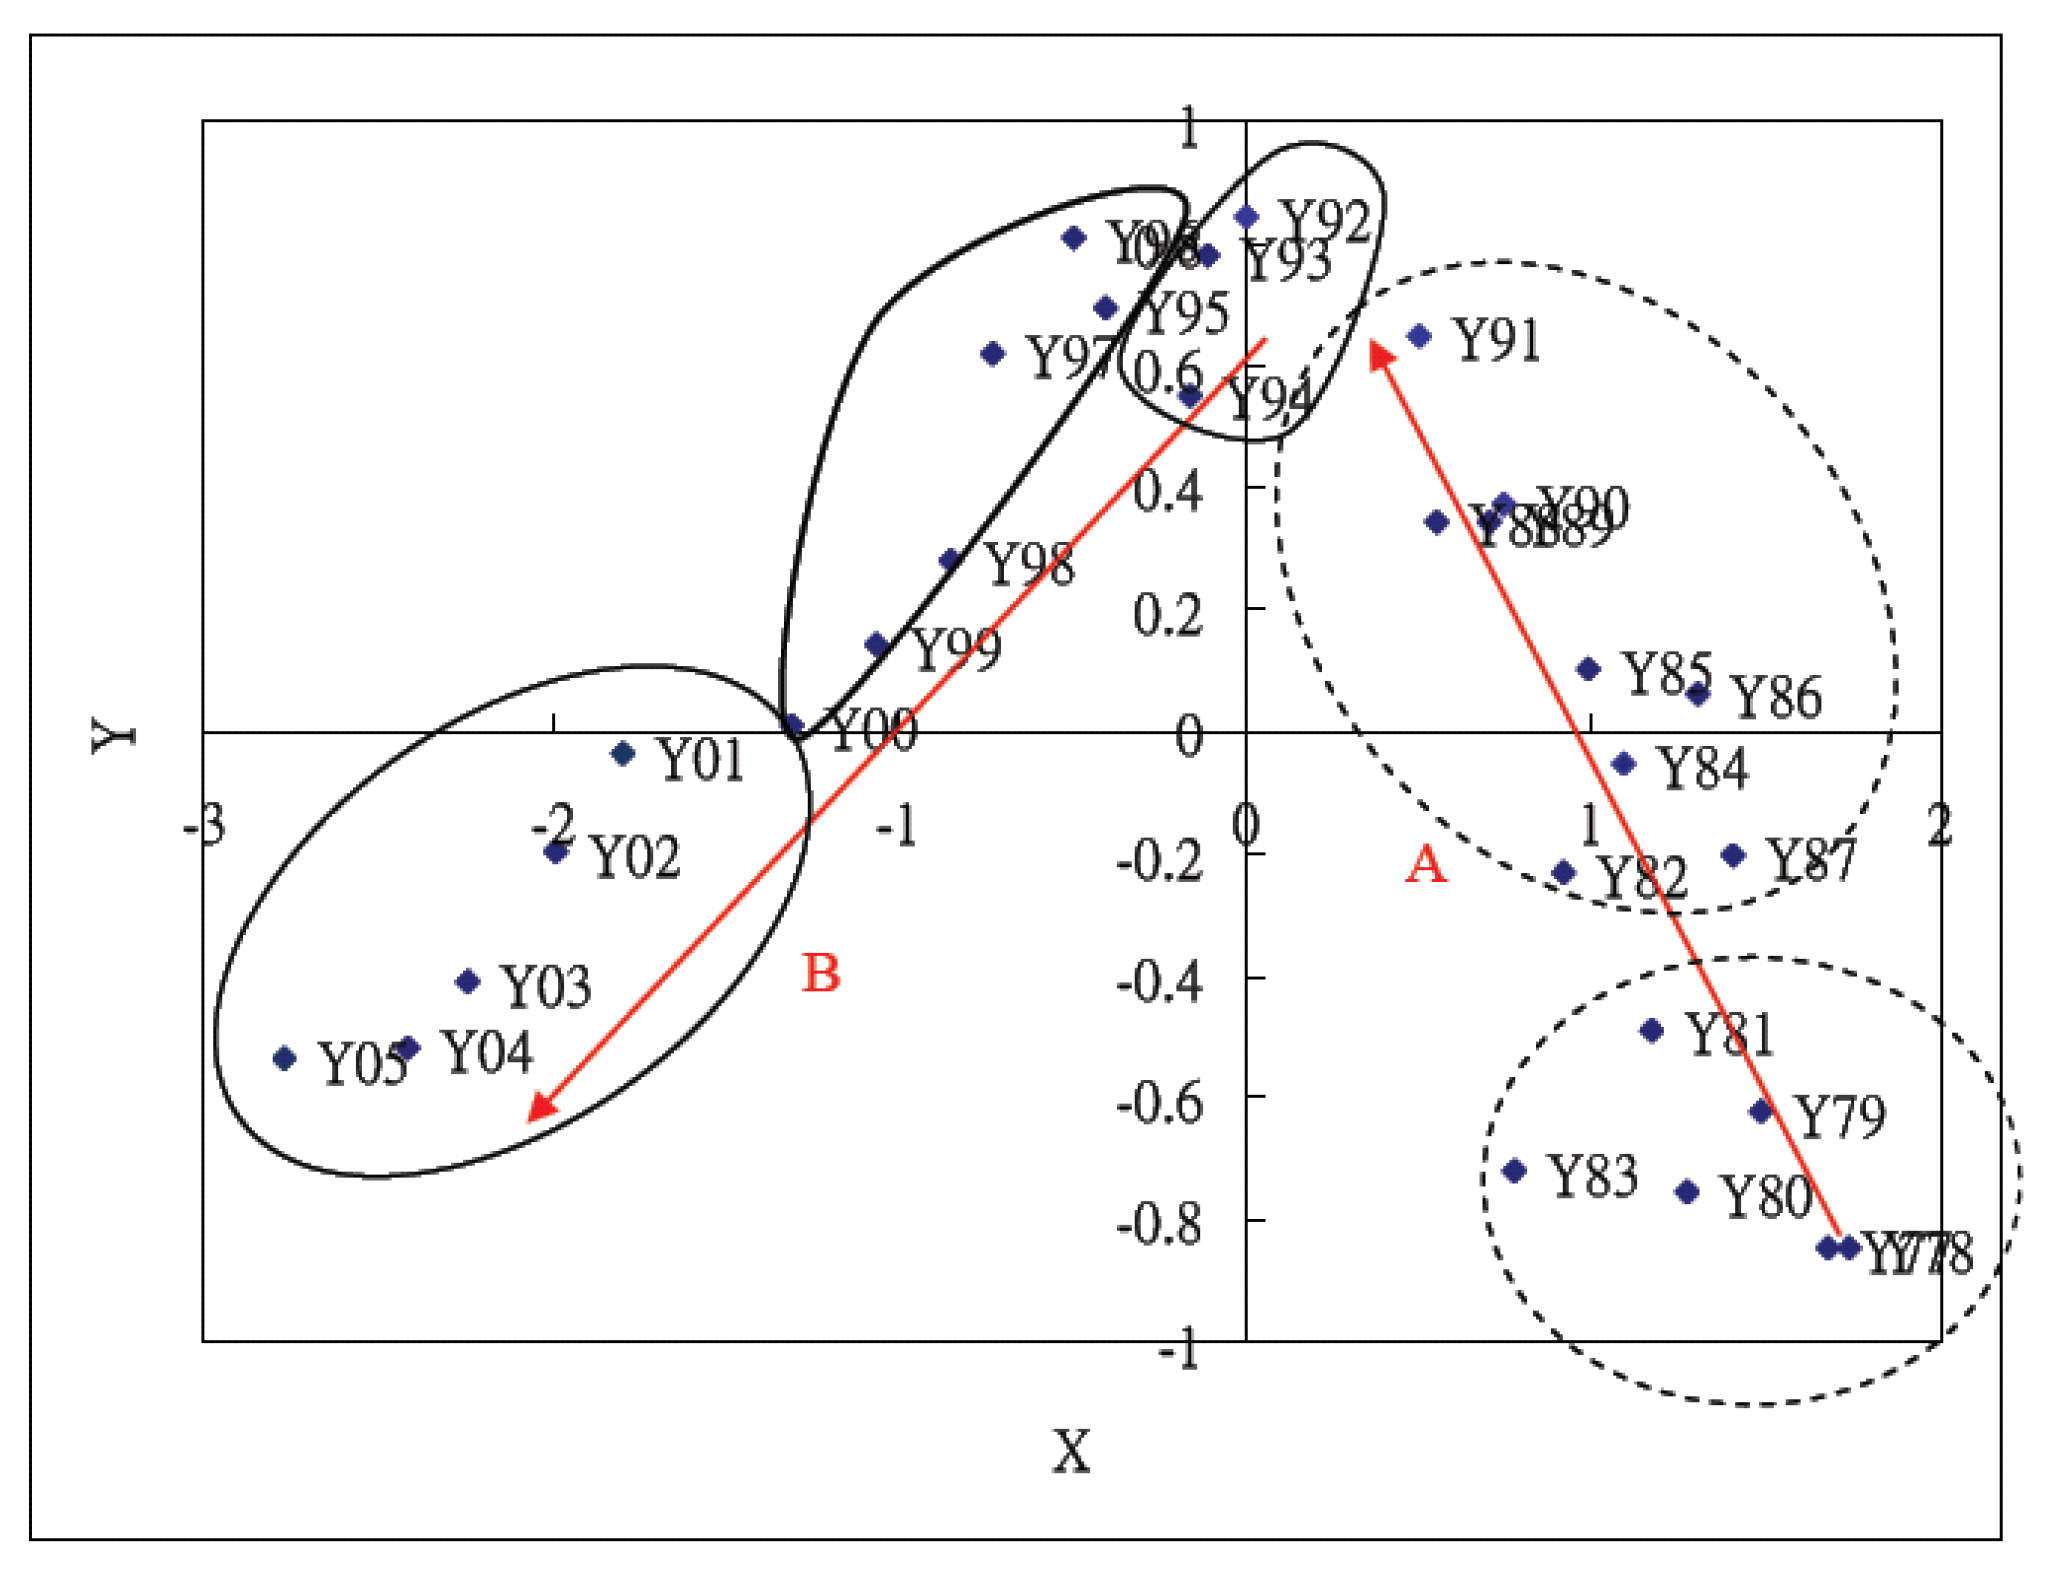
As described earlier, the multi-dimension scale analysis (MDS) was used to transfer the categorized results to a two-dimensional space in order to observe the trends in research in the educational computing disciplines.
Figure 3 below presents the analysis results, its Kruskal press coefficient being 0.1013, which shows that, although the value is slightly larger than 0.1, it should still be regarded as in the acceptable level, thus, the results are reliable [
17].
Figure 3.
The Trends in research of educational computing.
Figure 3.
The Trends in research of educational computing.
As shown in
Figure 3, two trends, labeled A and B, were identified. Trend A was found in the years 1977 to 1991 and includes two clusters; namely, the beginning cluster (y77, y78, y79, y80, y81) and the ending cluster (y82, y82, y83, y84, y85, y86, y87, y88, y89, y90, y91). Trend B was found between 1992 and 2005 and includes three clusters; namely, (y92, y93, y94, y95), (y96, y97, y98, y99, y00), and (y01, y02, y03, y04, y05). The beginning cluster is (y92, y93, y94, y95) and the ending cluster is (y01, y02, y03, y04, y05). In order to discover the driving forces within the trends, we compared the differences between the number of papers on each topic published in the beginning cluster over and against the ending cluster for each trend.
Table 5 and
Table 6, respectively, provide the top 10 research differences within Trend A and Trend B, respectively.
Table 5.
Research changes in Trend A.
Table 5.
Research changes in Trend A.
| Trend A |
|---|
| Rating * | Topic | Dimension | Difference |
|---|
| 1 | Computer Assisted Instruction | Application | +261 (+32%) |
| 2 | Multimedia | ICT | +63 (+9.1%) |
| 3 | Information literacy education | Pedagogy | +52 (+6%) |
| 4 | Learning behavior in CAI | Pedagogy | +43 (+5.2%) |
| 5 | Content representation | Pedagogy | +40 (+4.6%) |
| 6 | Course support system | Application | +33 (+3.9) |
| 7 | Teacher’s information literacy | Person | +27 (+2.5%) |
| 8 | Student’s information literacy | Person | +23 (+2.0%) |
| 9 | Artificial Intelligence | ICT | +20 (1.5%) |
| 10 | Cognition type | Person | +16 (+0.8%) |
Table 6.
Research changes in Trend B.
Table 6.
Research changes in Trend B.
| Trend B |
|---|
| Rating * | Topic | Dimension | Difference |
|---|
| 1 | Web-based Learning | Application | +450 (+26%) |
| 2 | Collaborative learning | Pedagogy | +80 (+4.8%) |
| 3 | Multimedia | ICT | +58 (+4.1%)) |
| 4 | CAI | Application | −35 (−3.1%) |
| 5 | Mobile communication | ICT | +34 (+3%) |
| 6 | Cognition type | Person | +34 (+3%) |
| 7 | Adaptive course website design | Pedagogy | +32(+2.9%) |
| 8 | Learning community | Person | +29 (+2.8%) |
| 9 | Computer-mediated communication system | Application | +28 (+2.5%) |
| 10 | Problem-based learning | Pedagogy | +25 (+2.3%) |
In Trend A, as evident in
Table 5, CAI at the elevated rate of 32% was the research topic that increased the most within Trend A, with the next being multimedia. These two results respectively reflect the advances in ICT as the personal computer appeared in the early 1980s and multimedia specifications were defined and launched for applications in the late 1980s. The appearance of the personal computer boosted the research on CAI, while the specification and application of multimedia technology promoted research on multimedia. Research in course support systems in the application dimension and artificial intelligence in the ICT dimension also increased. In addition, as computing applications for use in education were launched, the relative research in the pedagogy dimension and person dimension, which included information literacy education, learning behavior, and content representation, increased.
In Trend B, as evident in
Table 6, the dramatic increase in the amount of research on web-based learning and the decrease in CAI were the significant changes in types of research. These changes can be attributed to the appearance of the Internet and the World Wide Web around 1992. Educational computing pedagogies embraced the enthusiasm of the possibilities of the Internet to enhance learning performance. The focus of research in educational computing rapidly moved from CAI to web-based learning from then, and formed the major turning point from Trend A to Trend B. In addition, through the Internet, computer mediated communication systems, which provide the opportunities for learning at anytime and anywhere, became an increasing research issue in application dimensions throughout the research disseminated in the selected journals. Multimedia research kept increasing, but the research context moved toward the web and hypermedia. In addition to multimedia research, it is to be noted that research in mobile communications also emerged as being increasingly the focus of research interest. The web also fosters possibilities for pedagogical approaches, adaptive course website design, collaborative learning, and problem-based learning, and these areas increased in terms of research publications. At the same time, the trend in relation to research about the person dimension, cognition type and learning community saw increased research activity.
In addition to the above analyses from the results shown in
Table 5 and
Table 6, further comparisons of the differences between Trend A and Trend B in the four different dimensions, namely, application, ICT, pedagogy and person, three important trends can be noted. Firstly, personalization and collaborative learning of constructivism pedagogy through web technologies emerged into the mainstream, replacing CAI in mastery learning pedagogy. Secondly, new emerging research in the application dimension reflected the growing understanding about the interface and relationships between ICT developments and pedagogical implications for teaching and learning. These two areas—new and emerging ICT and pedagogy needs—became the two major driving forces in educational computing research. We argue that this also became closely related to ICT implementation challenges in translating the research to policy and, importantly, to practice. Thirdly, in observing the ICT and pedagogies involved in applications and contrasting the development of pedagogical paradigms to the ICT developments, as shown in
Table 7, we suggest that, although both ICT and pedagogy paradigms are the two major driving forces in educational computing, pedagogy paradigms lead the application approach to ICT in the educational computing field. In other words, the relationship between these two driving forces is that ICT carries out pedagogical functions, and serves as a catalyst and enabler for the effective application of the education models.
Table 7.
Application trends and their related information and communication technologies (ICT) and pedagogies.
Table 7.
Application trends and their related information and communication technologies (ICT) and pedagogies.
| Application Trend | ICT Paradigm | Pedagogy Paradigm |
|---|
| Computer Assisted Instruction | Personal Computer (1980s) | Behaviorism (1910s):
Operant conditioning
Mastery learning
Programmed instruction |
Cognitivism (1960s):
Meaningful learning
Discovery learning |
| Web-based Learning | Internet and Web (1990s) | Constructivism (1970s):
Adaptive learning
Collaborative learning
Problem based learning |
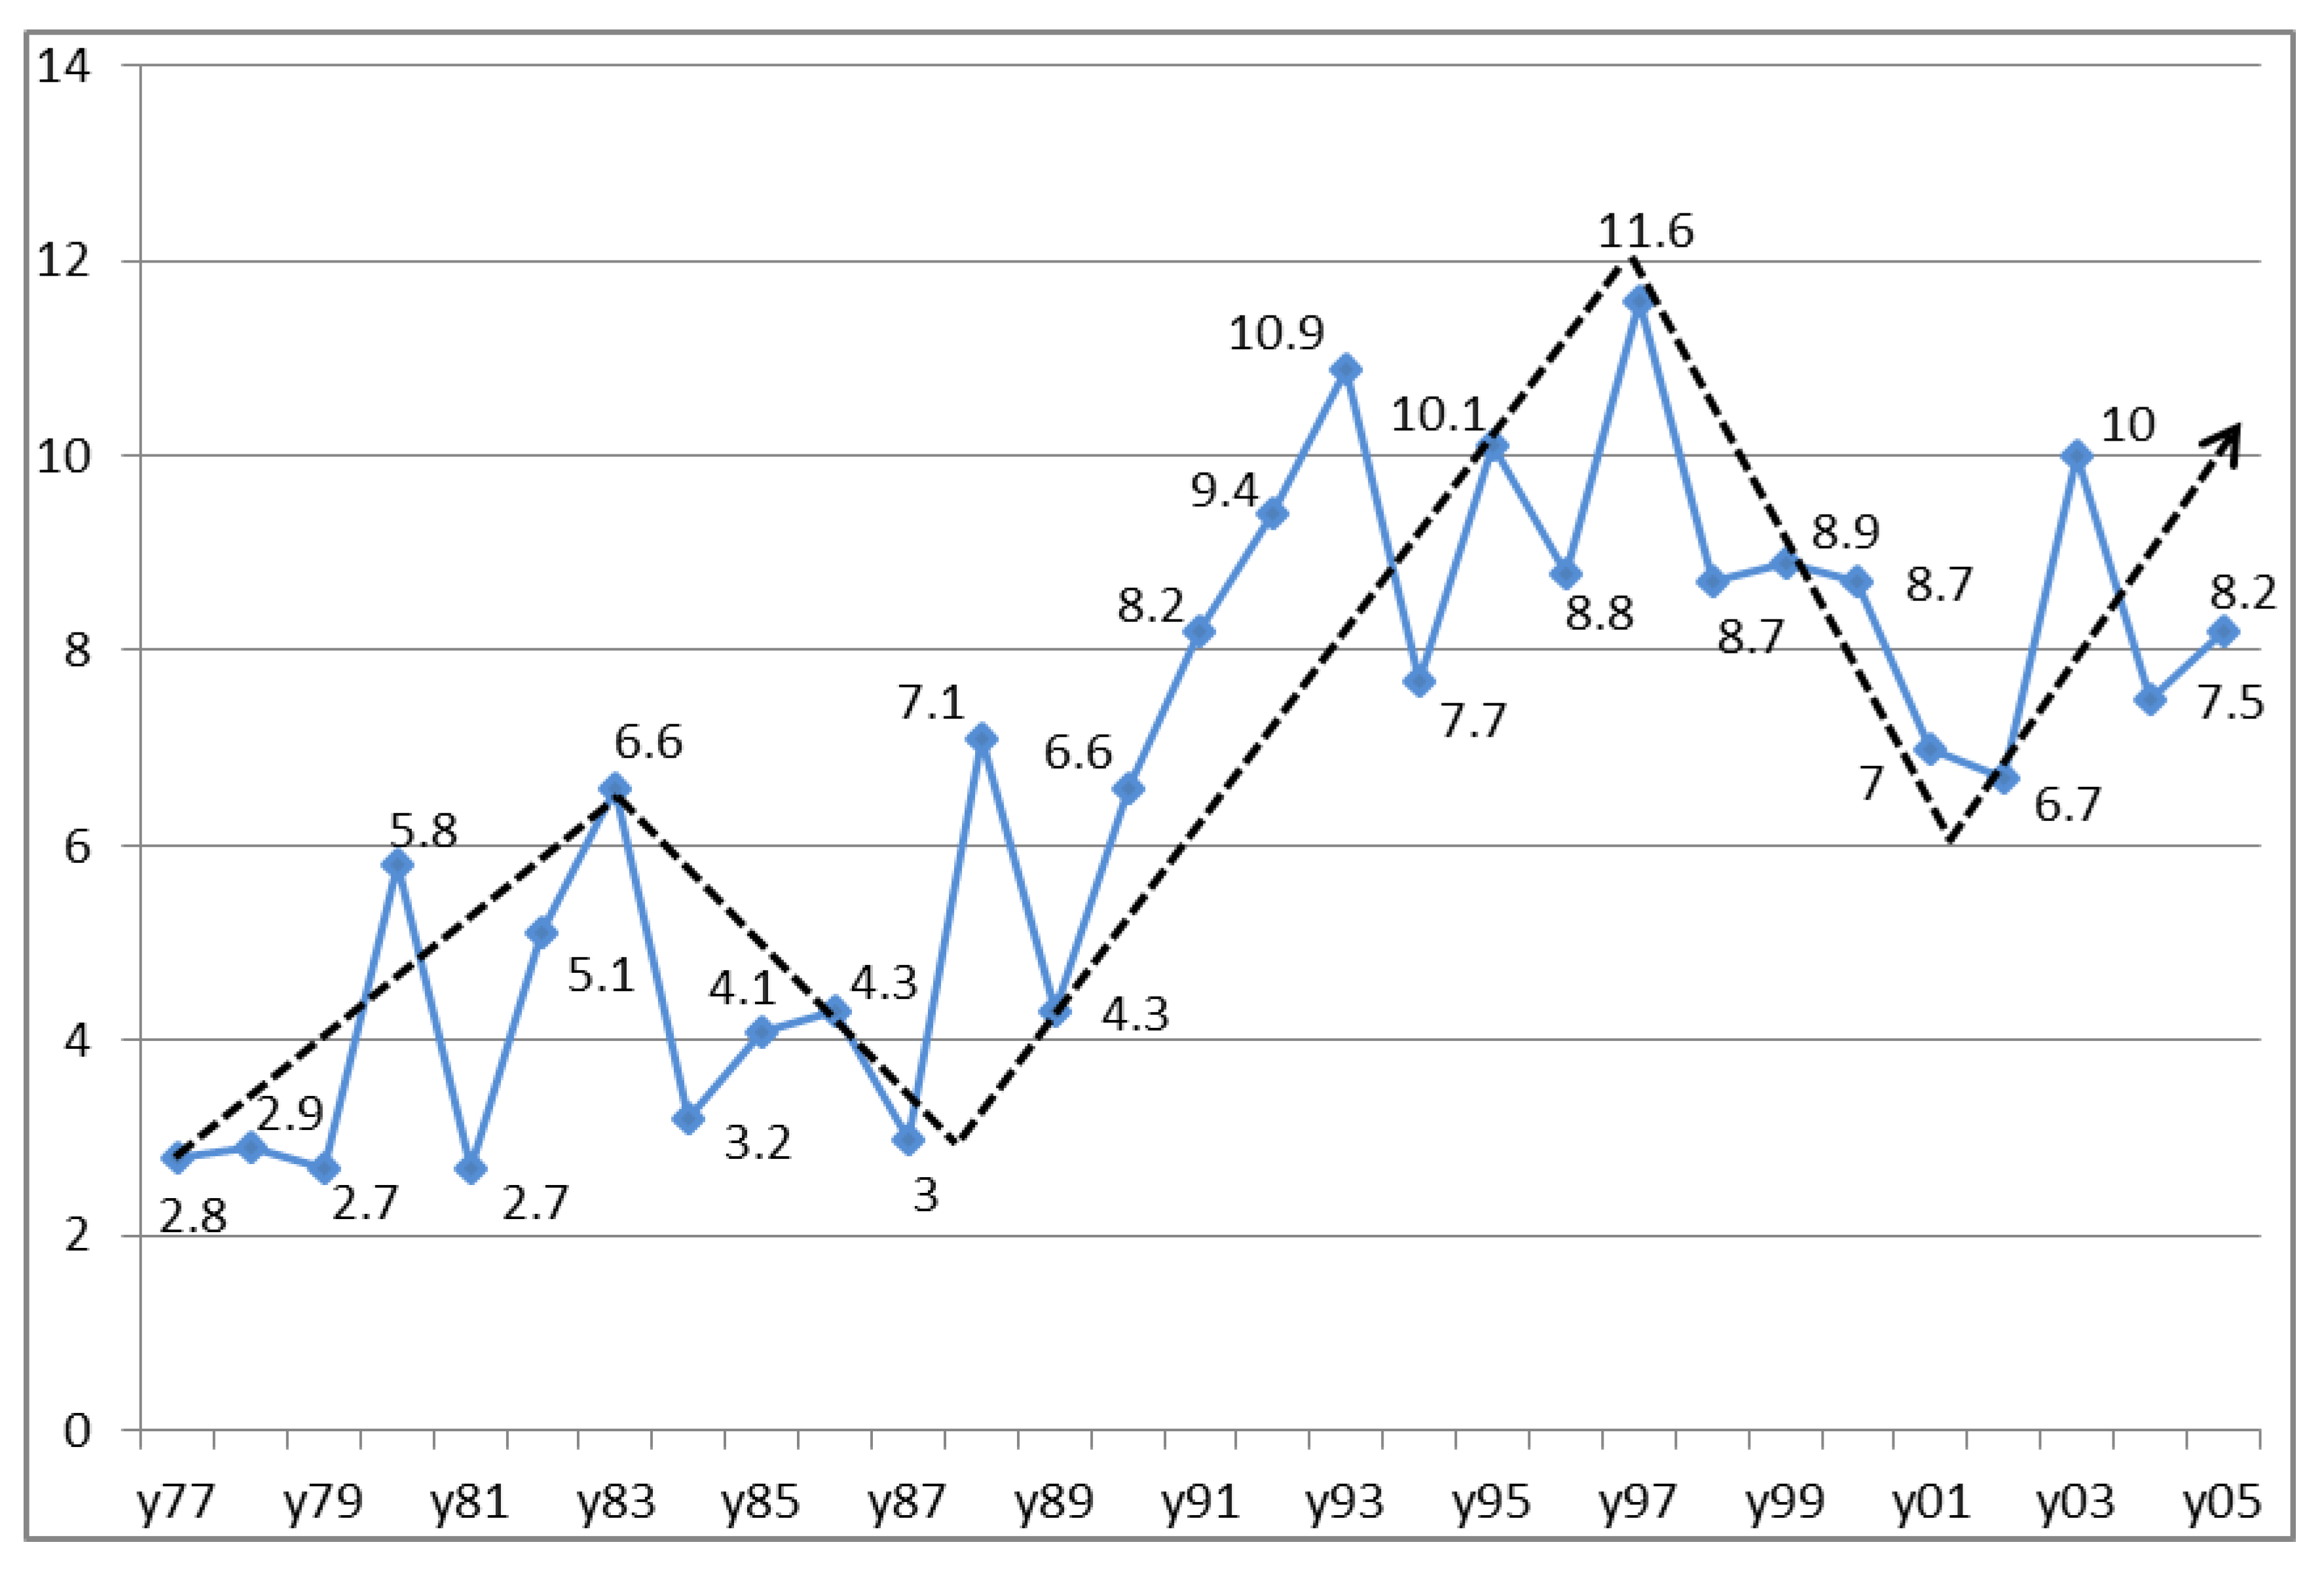
4.3. The Diversity of Educational Computing Research
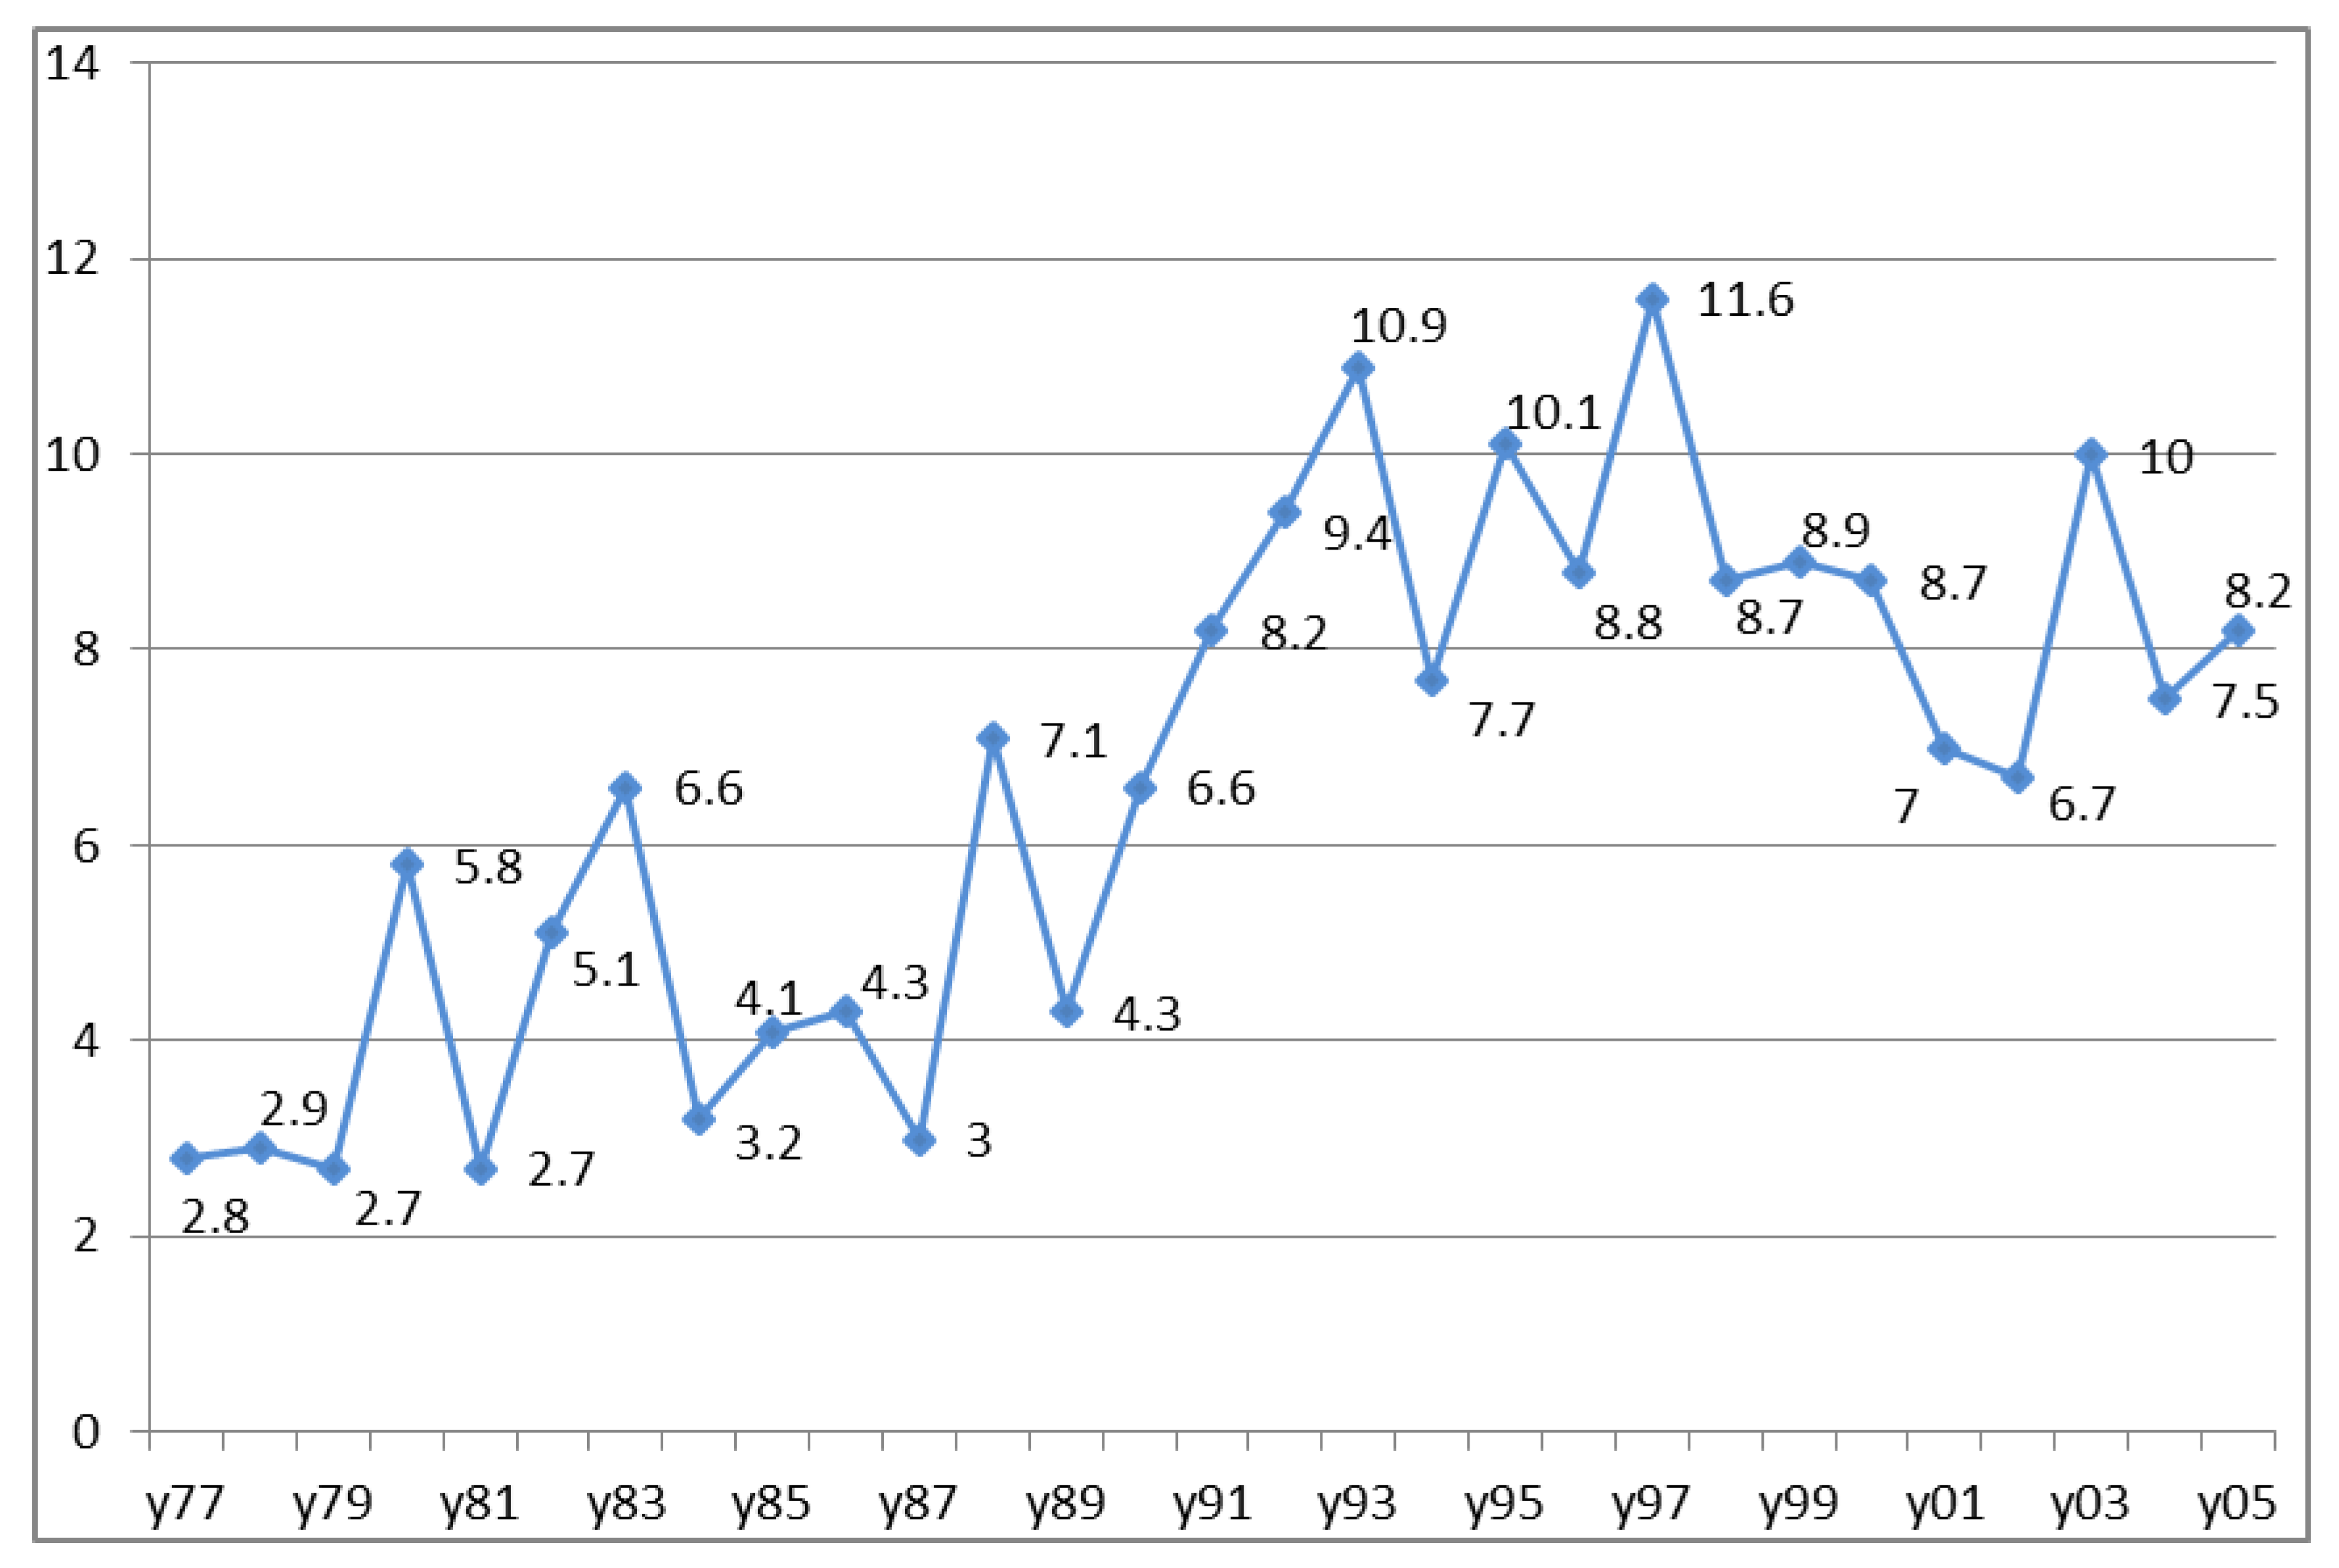
The Simpson’s diversity indices of educational computing research between the years 1977 to 2005 were calculated and are shown in
Figure 4. It can be seen that, along with the identification of key trends, there is also increasing educational computing research diversity evident. To investigate the fitness of the diversity trend, a linear regression test was conducted. The results shown in
Figure 5 reveals that there is a positive and significant relationship between research diversity and year, and suggests that 55.3% of the diversity’s variance can be explained by the year in which the research was conducted. This means that educational computing has become an increasingly important field of research, attracting involvement from researchers from different disciplines.
Figure 4.
The Simpson’s diversity indices of educational computing research between the years 1977 to 2005.
Figure 4.
The Simpson’s diversity indices of educational computing research between the years 1977 to 2005.
Figure 5.
The regression equation for the fitness of the diversity trend.
Figure 5.
The regression equation for the fitness of the diversity trend.
By drawing upon these analyses,
Figure 6 has been produced with the dotted line showing that there are two research-diversity waves with another one forming throughout 2005. These waves reveal that each main breakthrough in ICT development boosts the diversity of educational computing research. Importantly, these results correspond to the findings from the analyses of the trends in educational computing research in the previous section. In summary, this research has identified the following three waves from 1977–2005:
The first wave of diversity was initiated by the development of the personal computer.
The second wave of diversity was driven by Internet and web-based technologies, and
The third wave, which was in the formative stage in 2005, was being driven by mobile and ubiquitous computing technologies and the pedagogical implications for enabling a more flexible, mobile and personalized learning.
Figure 6 maps the major trendlines and the diversity of research between 1977 and 2005, and we suggest that further research could built upon this platform to analyze the research for the period 2006–2013, and be used beyond 2013 as new research is published in subsequent years. The important contribution that this analysis makes is to enable understandings of the relationships between the educational computing research, policies, and professional practice.
Figure 6.
The Simpson’s diversity indices of educational computing research between the years 1977 to 2005.
Figure 6.
The Simpson’s diversity indices of educational computing research between the years 1977 to 2005.
For example, we note that, in relation to our educational systems in Australia and Taiwan, it appears that in the early, formative stages of each of the waves, education system policies have tended to follow each of those waves. To illustrate, in Queensland, Australia, the first
Policy Statement Computers in the Curriculum [
20] was developed in 1983, which coincided closely with the peak of the research driven by the personal computer developments. The next iteration of that policy occurred in 1997 with the launch of the
Schooling 2001 [
21] policy, which was the first policy to acknowledge that classrooms by 2001 should have Internet access. Again, the timing of that policy closely coincided with the peak of the second wave trend driven by the Internet developments. Subsequently, the
Smart Classrooms Professional Development Framework [
22], launched in 2005 referred to ‘digital pedagogies’, which was consistent with the ICT and pedagogy trend identified in the third wave. Further research could illuminate understandings about the relationships between published educational computing research, education systems policy, and professional practice. Questions to be explored might be—to what extent does research inform policy and practice? To what extent does policy inform research agendas? Does practice tend to precede or follow policy and research?
4. ICT and Pedagogy, 1977–2005, 2006–2014 and Beyond 2014—Technological Pedagogical Content Knowledge (TPACK)
As established through this research, the data analysis provided an evidence-based identification of three major waves of educational computing research from 1977–2005. We believe that this has been a most exciting and dynamic time in our planet’s history in relation to new technologies and teaching and learning.
By examining the educational computing research throughout that period, we have argued that this builds a platform upon which to conduct further analyses of relevant research for the period 2006–2013 and beyond. Important, this analysis enables audiences in a diverse range of contexts to reflect and analyze the relationship between research, and the nature and timing of the policy responses, and changes in learning and teaching practices. In addition, the analysis suggests that research momentum increased substantially throughout the period studied, in terms of both research quantum and diversity though research by disciplines other than ICT and education.
Subsequent to this analysis of the four educational computing journals selected, the authors noted an example undertaken by Hsu, Hung, and Ching [
23] who examined the abstracts of 2,997 international journal articles between 2000 and 2010 from six journals. Those journals included the four journals selected for this research, and they also included
Educational Technology Research and Development [
24] and
Innovations in Education and Teaching International [
25].
The methodology employed by Hsu, Hung, and Ching [
20] enabled a comparison of trends across three major domains—Technology Integration, Acceptance/Attitude of Emerging Technologies, and Learning Environments. Their research adds further insights into the continuation and expansion of the third wave outlined in our research. In particular, they noted that “it is the pedagogical use of technology and the effectiveness of instructional/learning strategies in achieving intended learning outcomes that constantly concern researchers and educators” [
23]. This is consistent with the Technological Pedagogical Content Knowledge (TPACK) conceptualization proposed by Mishra and Koehler [
5], who suggested that technological knowledge (TK) needed to be considered in association with pedagogical content knowledge (PCK). The intersection of technological knowledge, content knowledge, and pedagogical knowledge within various educational contexts aligns with the third wave characterised by ICT and pedagogy, as shown in
Figure 6, and Hsu, Hung, and Ching’s [
23] identification of the pedagogical use of technologies as a continuing research priority.
To support our argument, there is now strong evidence of an expanding TPACK literature and research. For example, Voogt
et al. [
26] examined 55 peer-reviewed TPACK publications between 2005 and 2011, and concluded that there were different understandings of TPACK, and that teacher knowledge (TPACK) and their beliefs about pedagogy and technology determined whether or not a teacher might teach with technology. In addition, a search of the Association for the Advancement of Computing in Education (AACE) EdITLib publications, using ‘TPACK” as the search term, resulted in 526 papers identified, with 232 papers published in 2012–2013.
In addition, subsequent research examining the educational computing literature would enable insights into major trends in technological changes impacting upon learning and teaching, such as social media, and mobile phones and other smart devices. This would provide scope for future technologies, including those new and emerging technologies and those yet to be imagined.
5. Conclusions
The technological changes, which can be mapped back in the educational computing literature as far as 1977, have been unprecedented in history. The accompanying implications for education have been considerable. This paper identified three major waves evident in the educational computing research in four prominent international journals throughout the period from 1977 until 2005. Consequently, this paper has provided the platform upon which subsequent research has focused, namely, ICT and pedagogy, with the earlier formative research catalysts being the personal computer (first wave), and the Internet (second wave). The contribution that this paper makes is an evidence-informed identification of the major historical trends in the educational computing research, which have led to the current research interests, for example, in TPACK, online learning, eLearning, and social media. The analysis also acknowledged the identification of the diversity of educational computing research, and suggested that further research, for example, between 2006-present which could build upon this important analysis, can illuminate the relationships between educational computing research, policy, and practice.
To conclude, the analysis has shown that technological innovation provides a catalyst for research, which provides new knowledge about the potential for those innovations to enhance teaching and learning. Appropriate research evidence informed policy responses and strategies are needed to enable enhanced learning and teaching practices. Currently, the driving forces seem to be a continuation of the third wave focusing on technologies and pedagogies, which this study identified as appearing as early as 2001. Moreover, the current focus on personalized learning and use of social media appear to have their origins during that period. The expanding TPACK literature base and research interest seems to be a continuation and strengthening of the third wave. A key message is that this analysis of the historical trends helps us to understand the major historical trends upon which further analysis of subsequent research can be undertaken and the relations between research, policy, and practice can be interpreted.


