Correlation of Infrared Thermal Imaging Results with Visual Inspection and Current-Voltage Data of PV Modules Installed in Kumasi, a Hot, Humid Region of Sub-Saharan Africa

Abstract
:1. Introduction
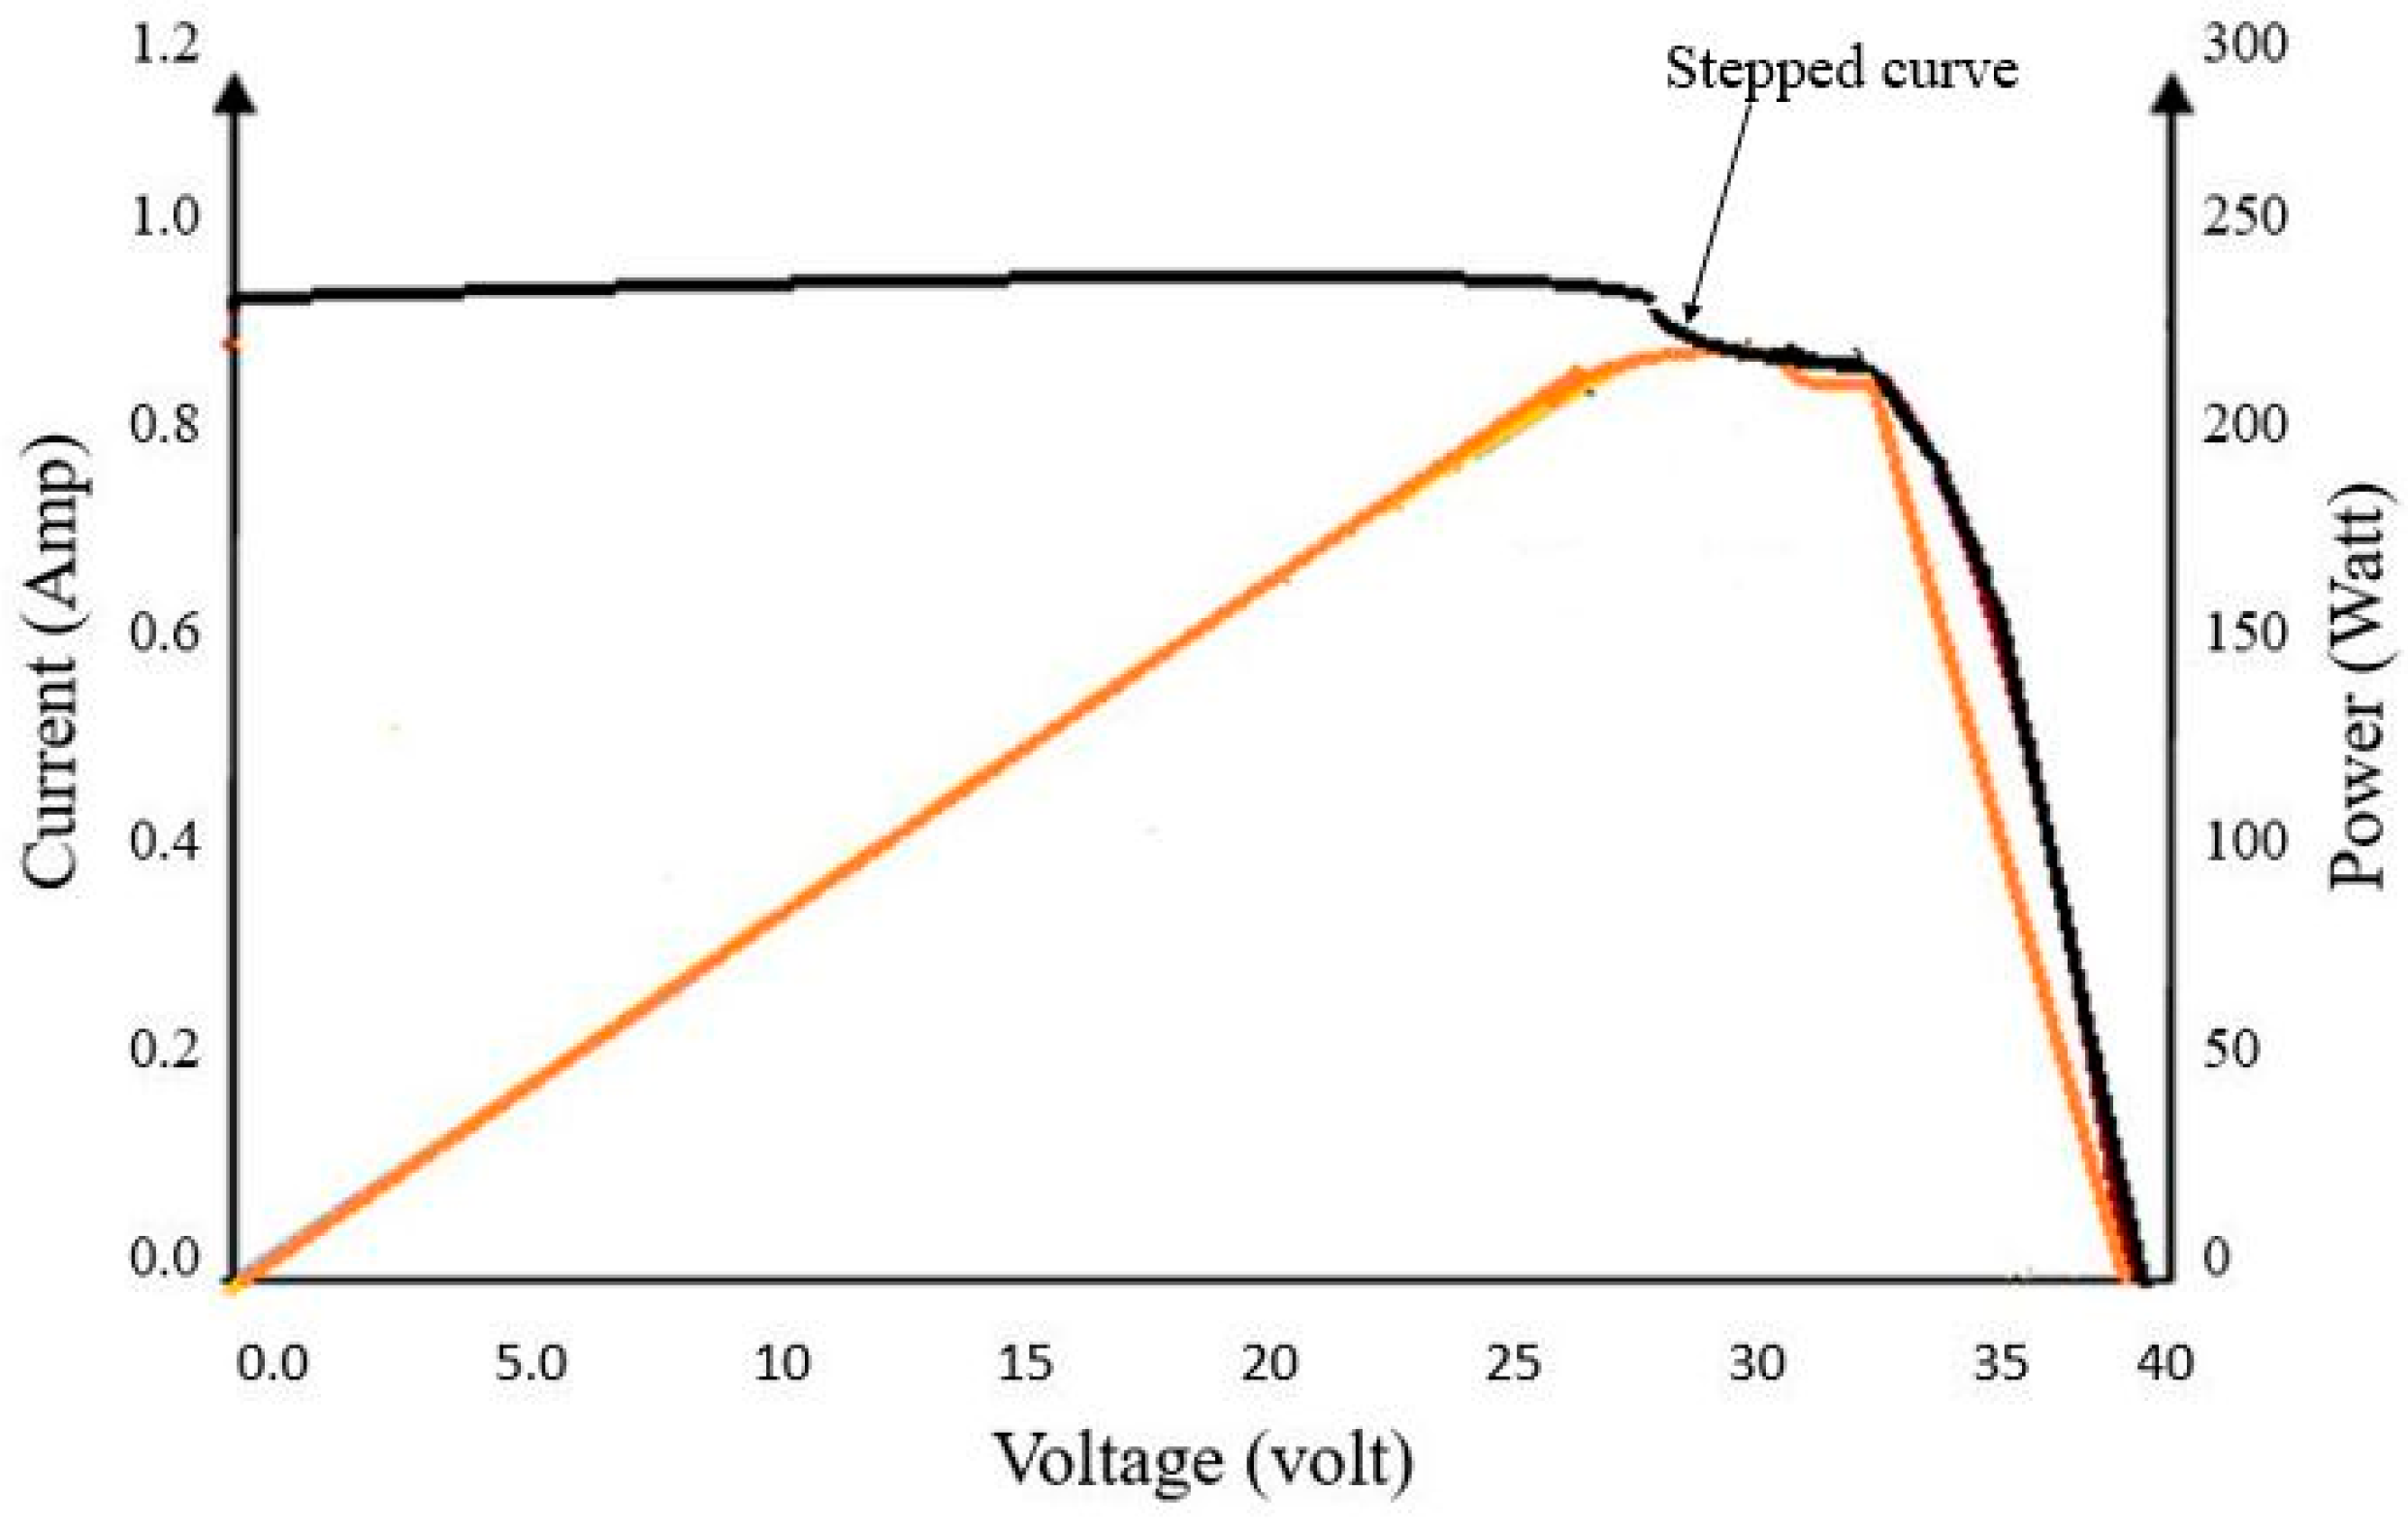
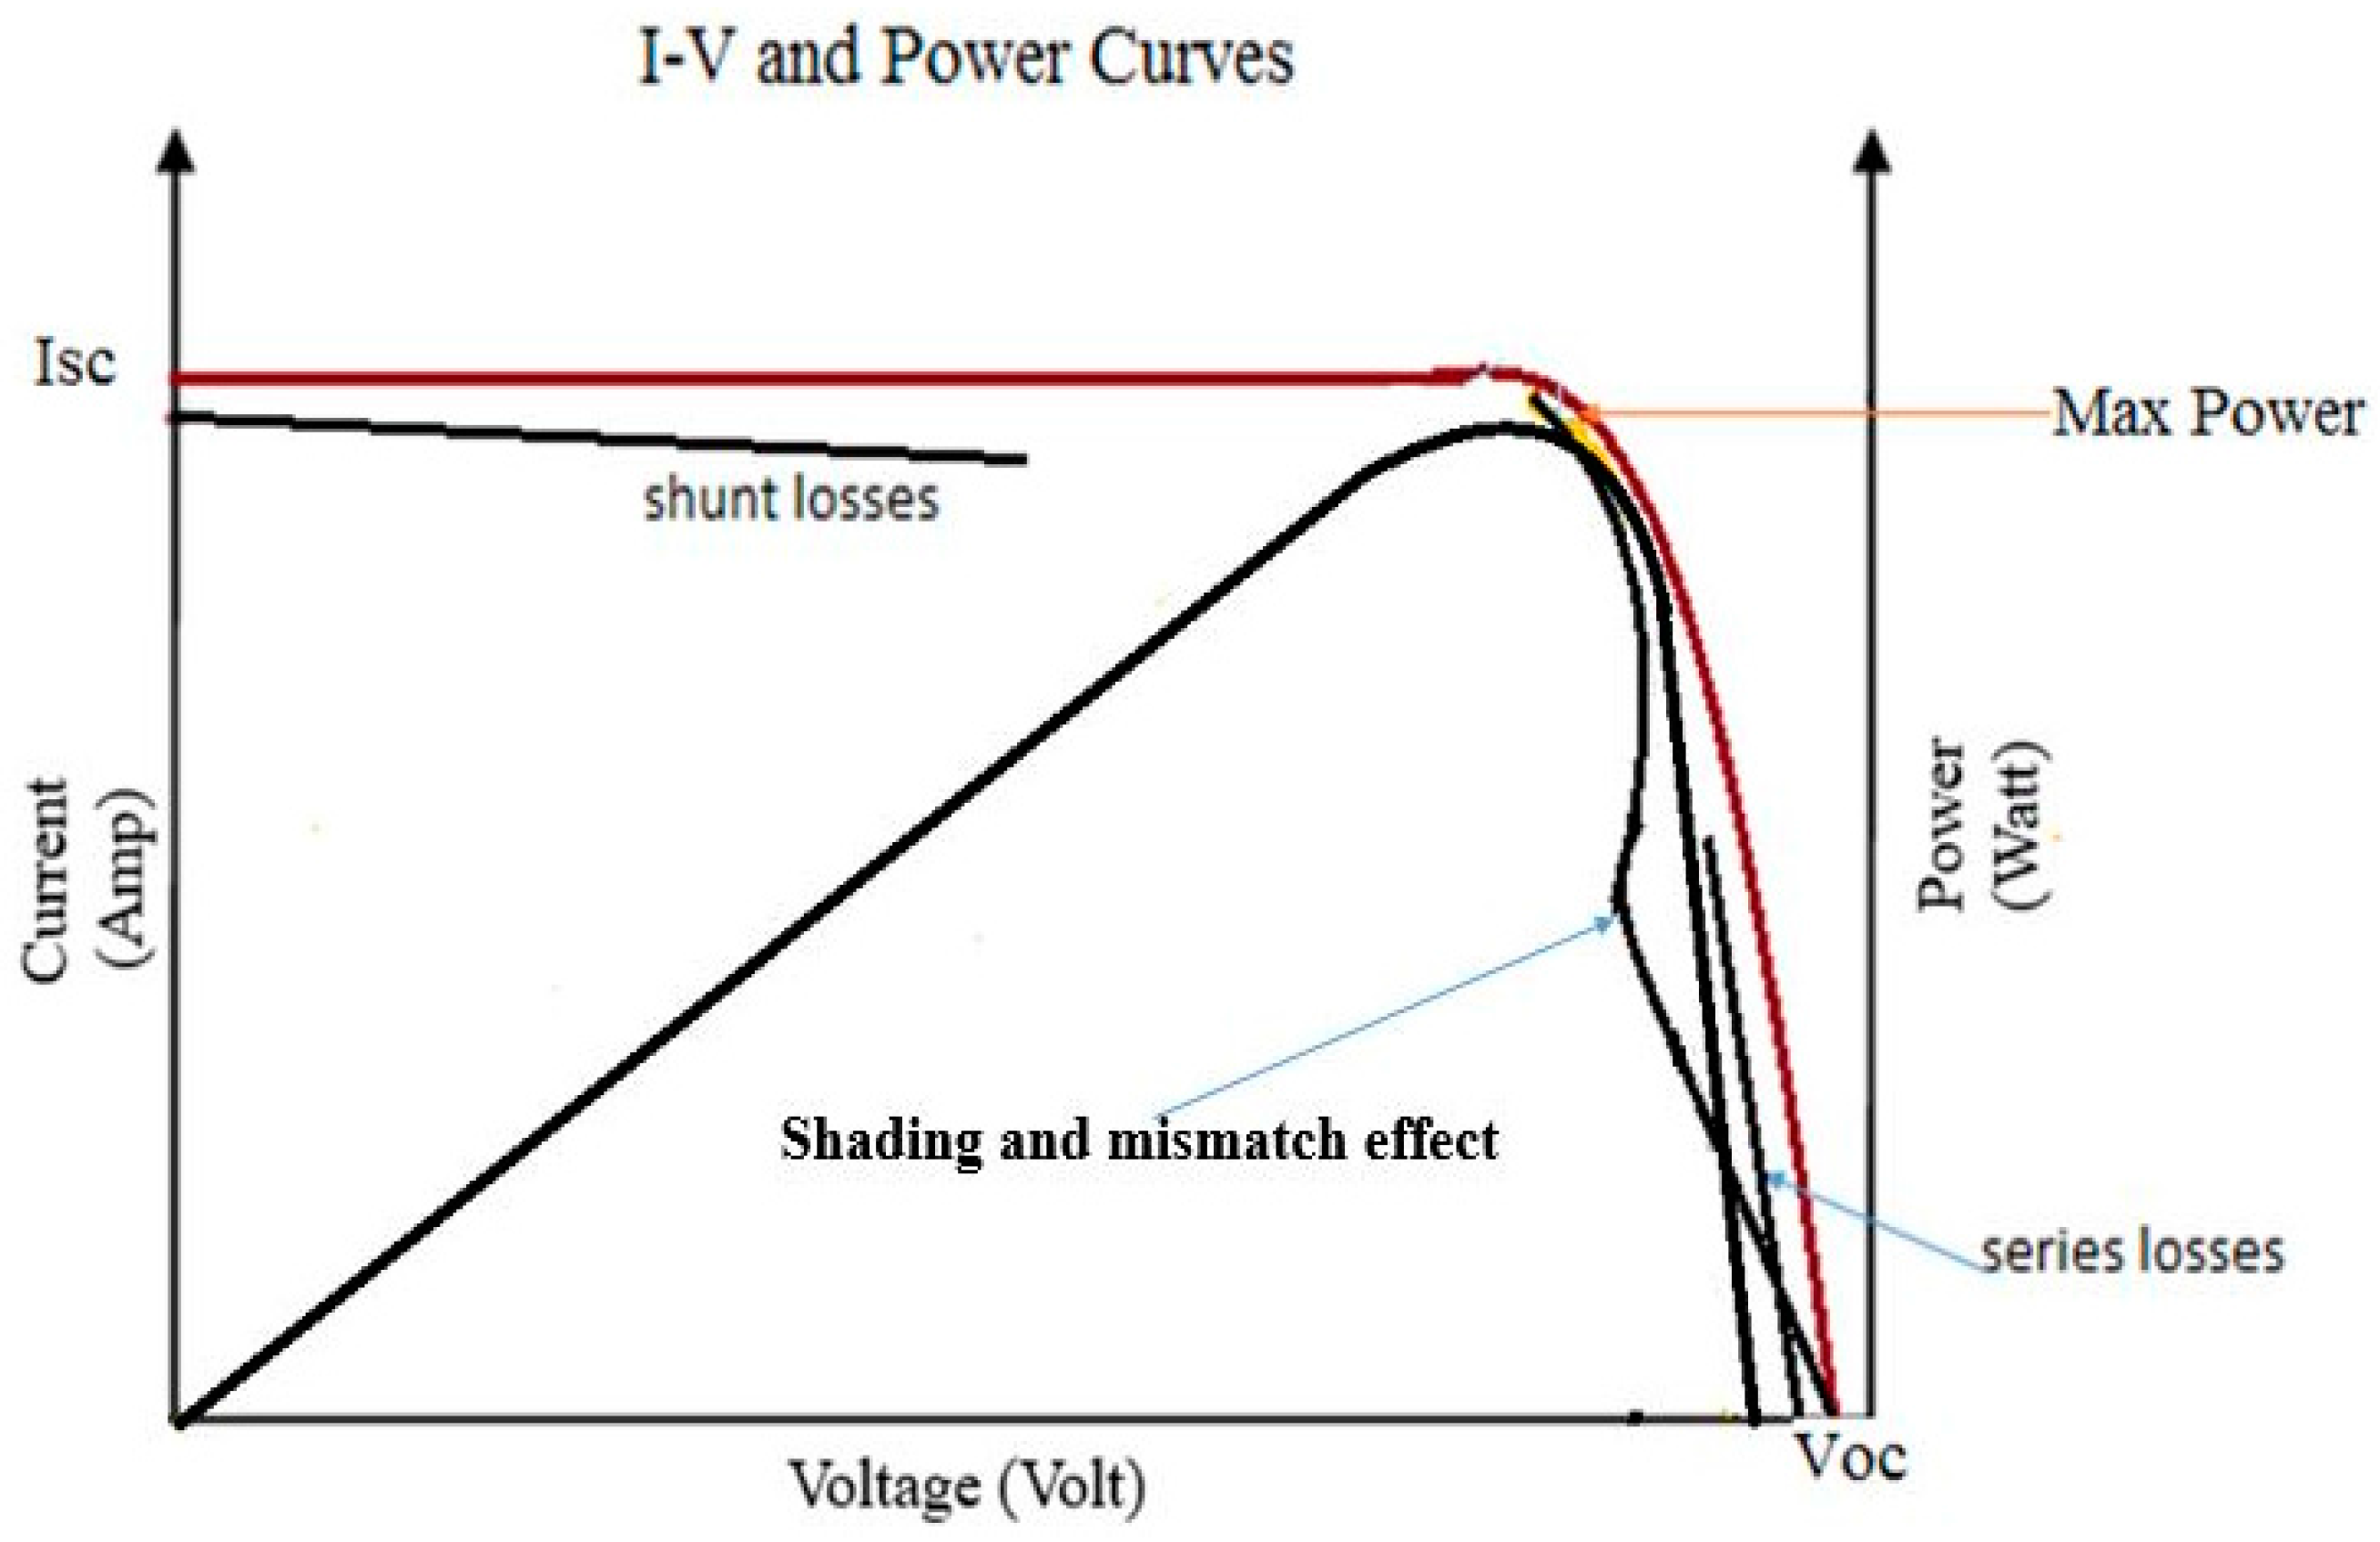
1.1. I-V Curve Tracing
1.2. Low and High Short Circuit Current and Open Circuit Voltage
- higher PV module temperature;
- shaded cell or module;
- shorted or conducting bypass diodes.
- the PV array is soiled (especially uniformly);
- PV modules are degraded.
2. Methodology
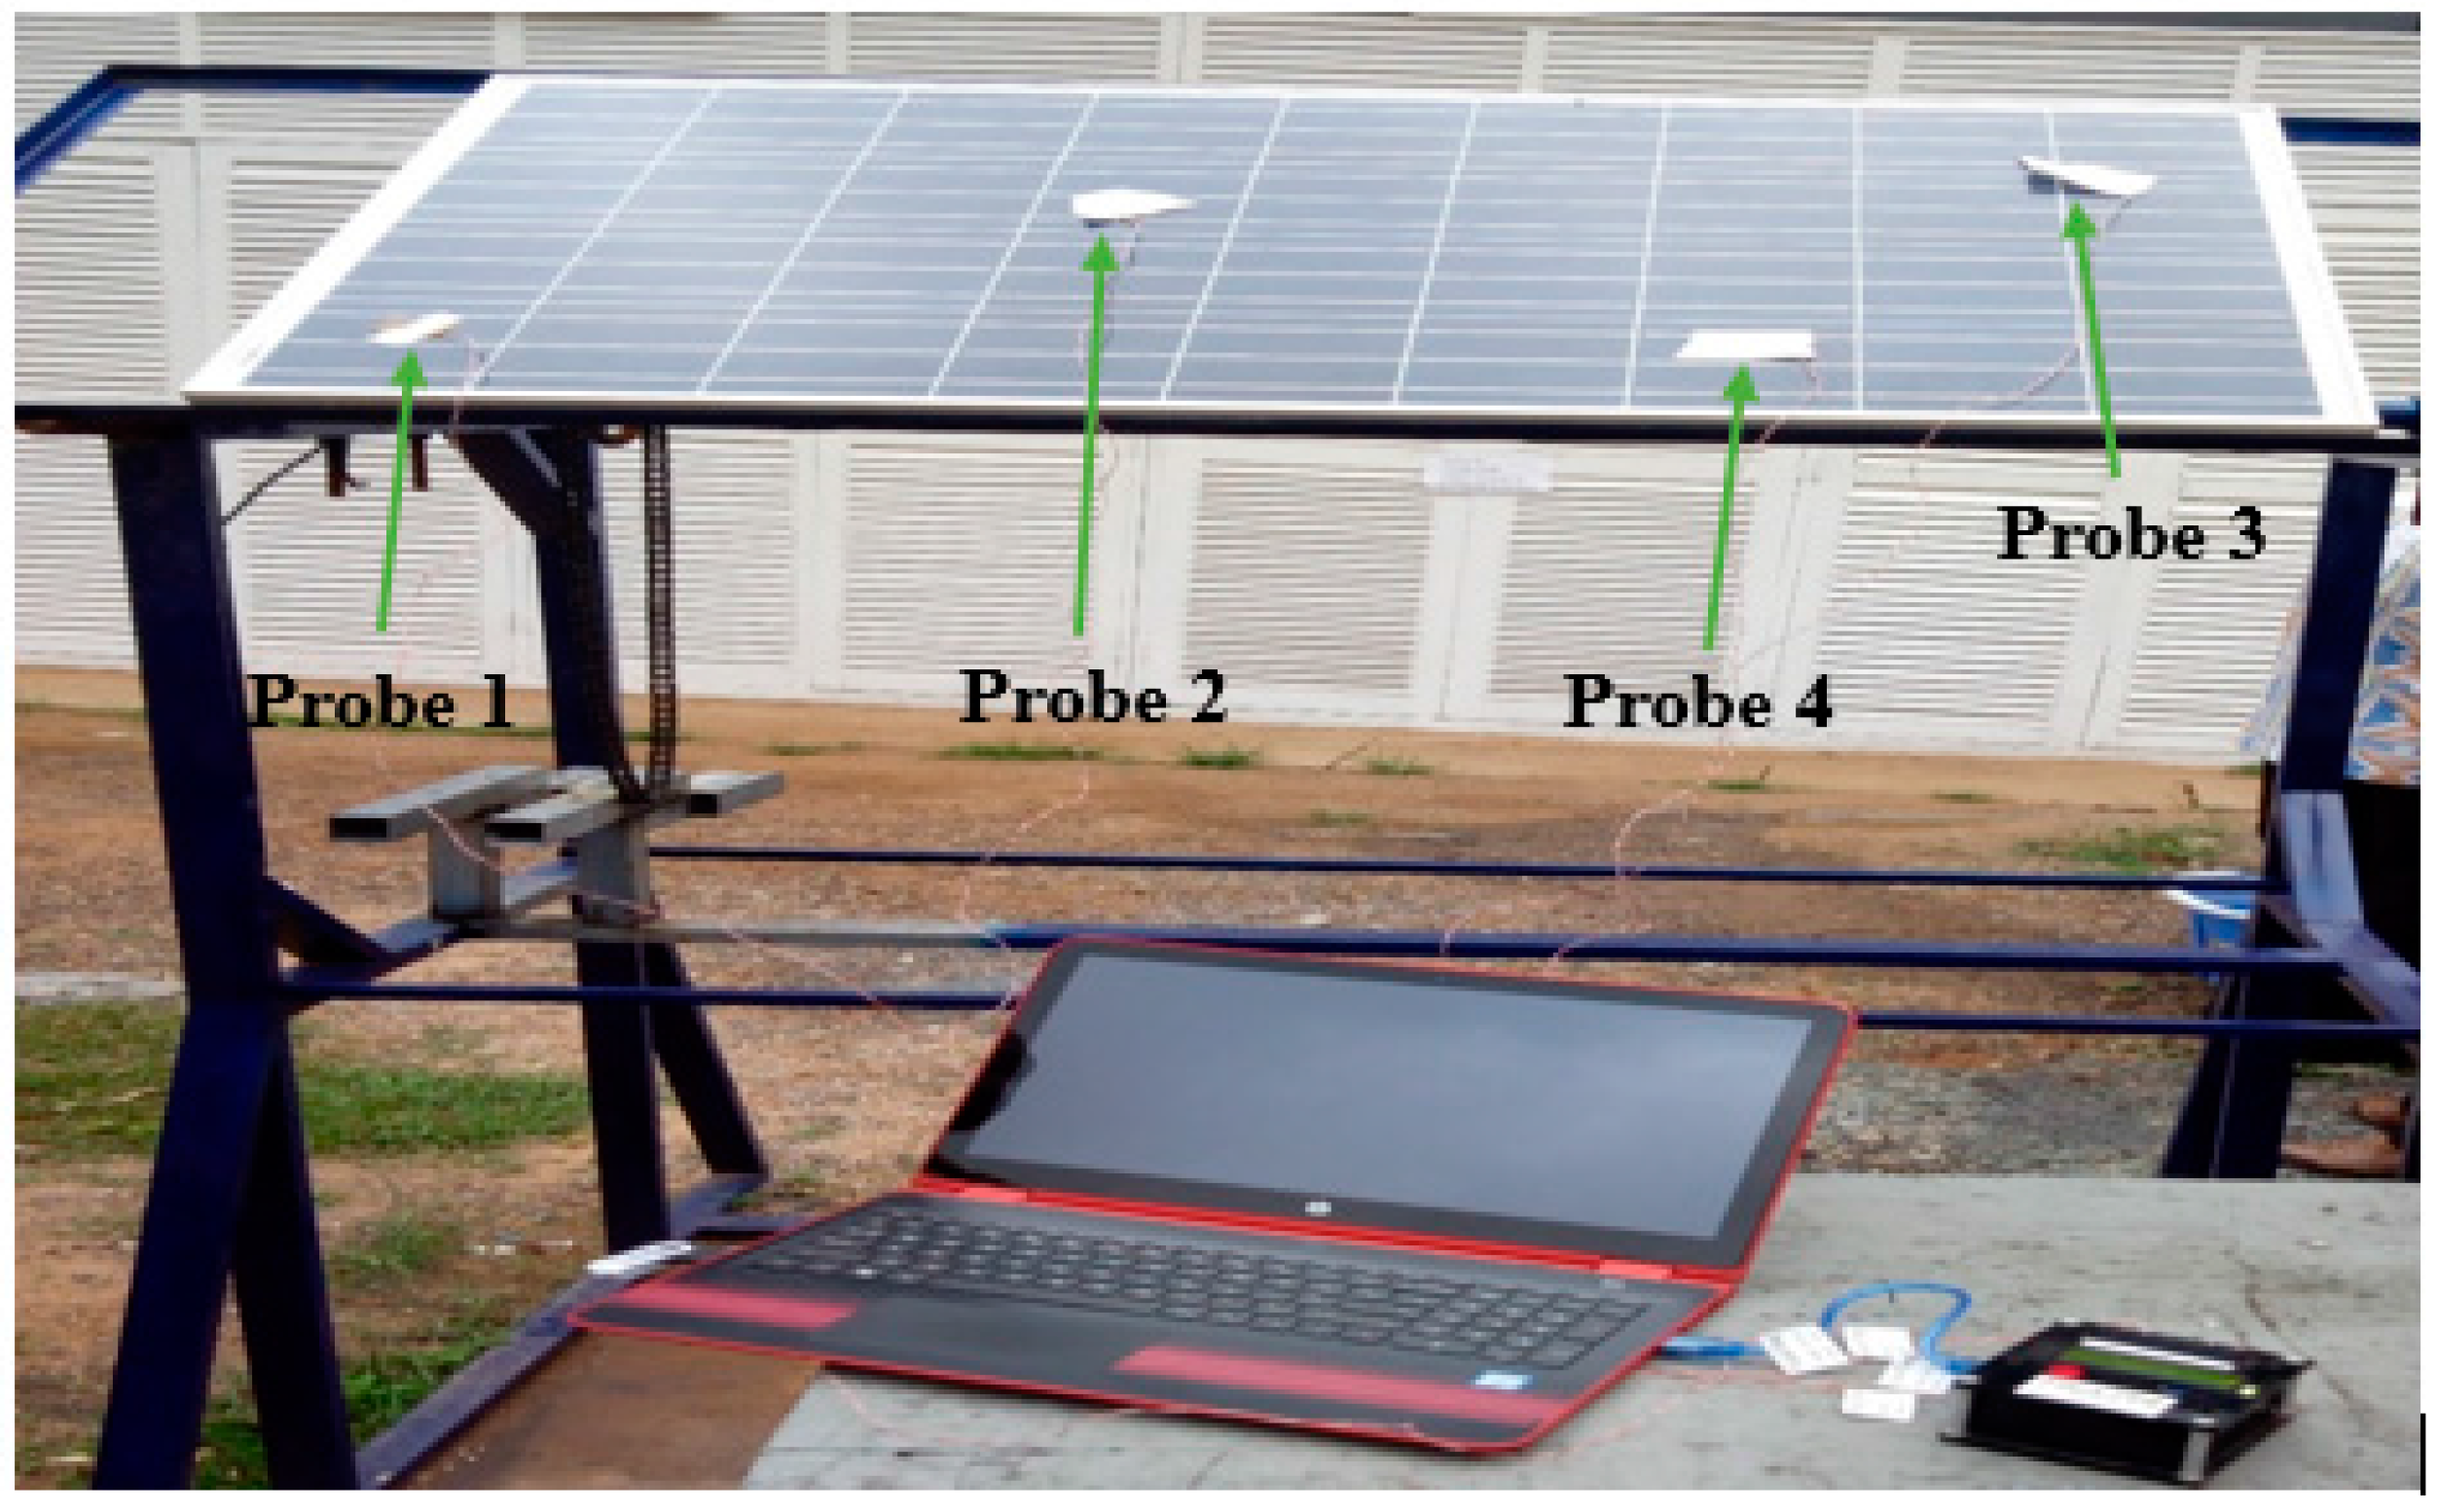
2.1. Experimental
- Open-circuit voltage ()
- Short-circuit current ()
- I/V characteristic curve
- STC characteristic curve
- STC values
- Fill factor
- Ideal characteristic curve of module manufacturer
- (1)
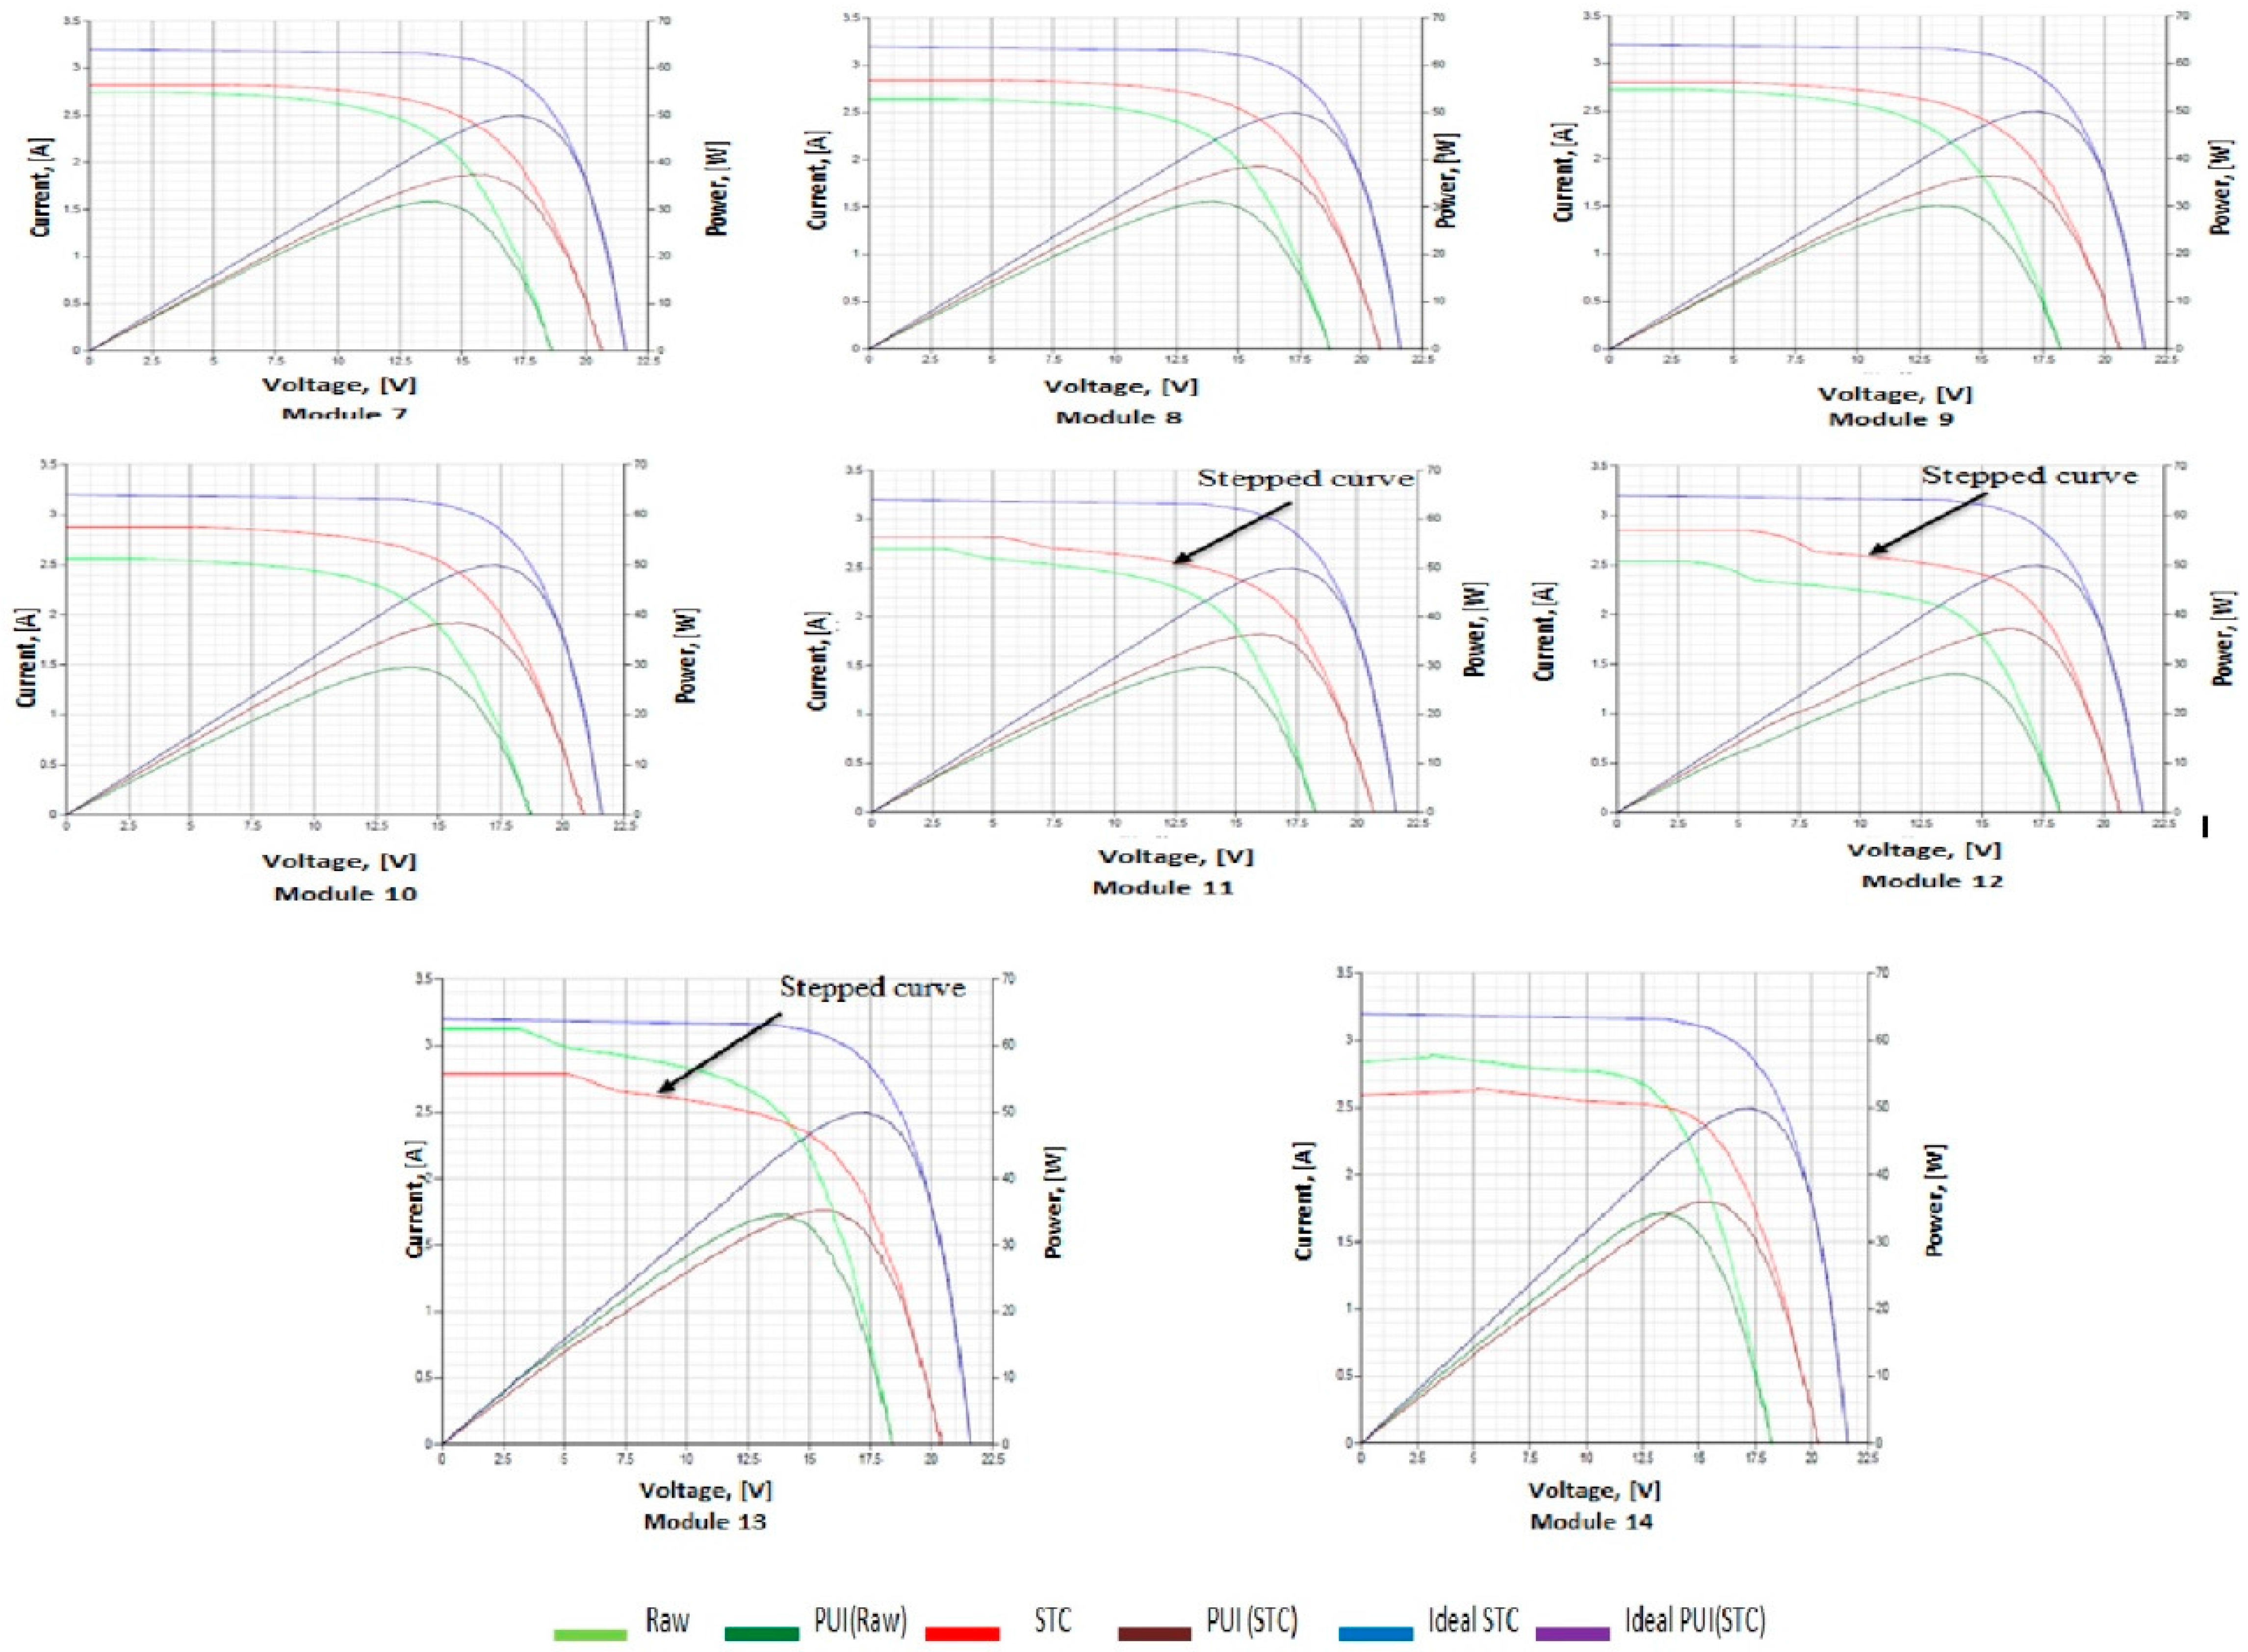
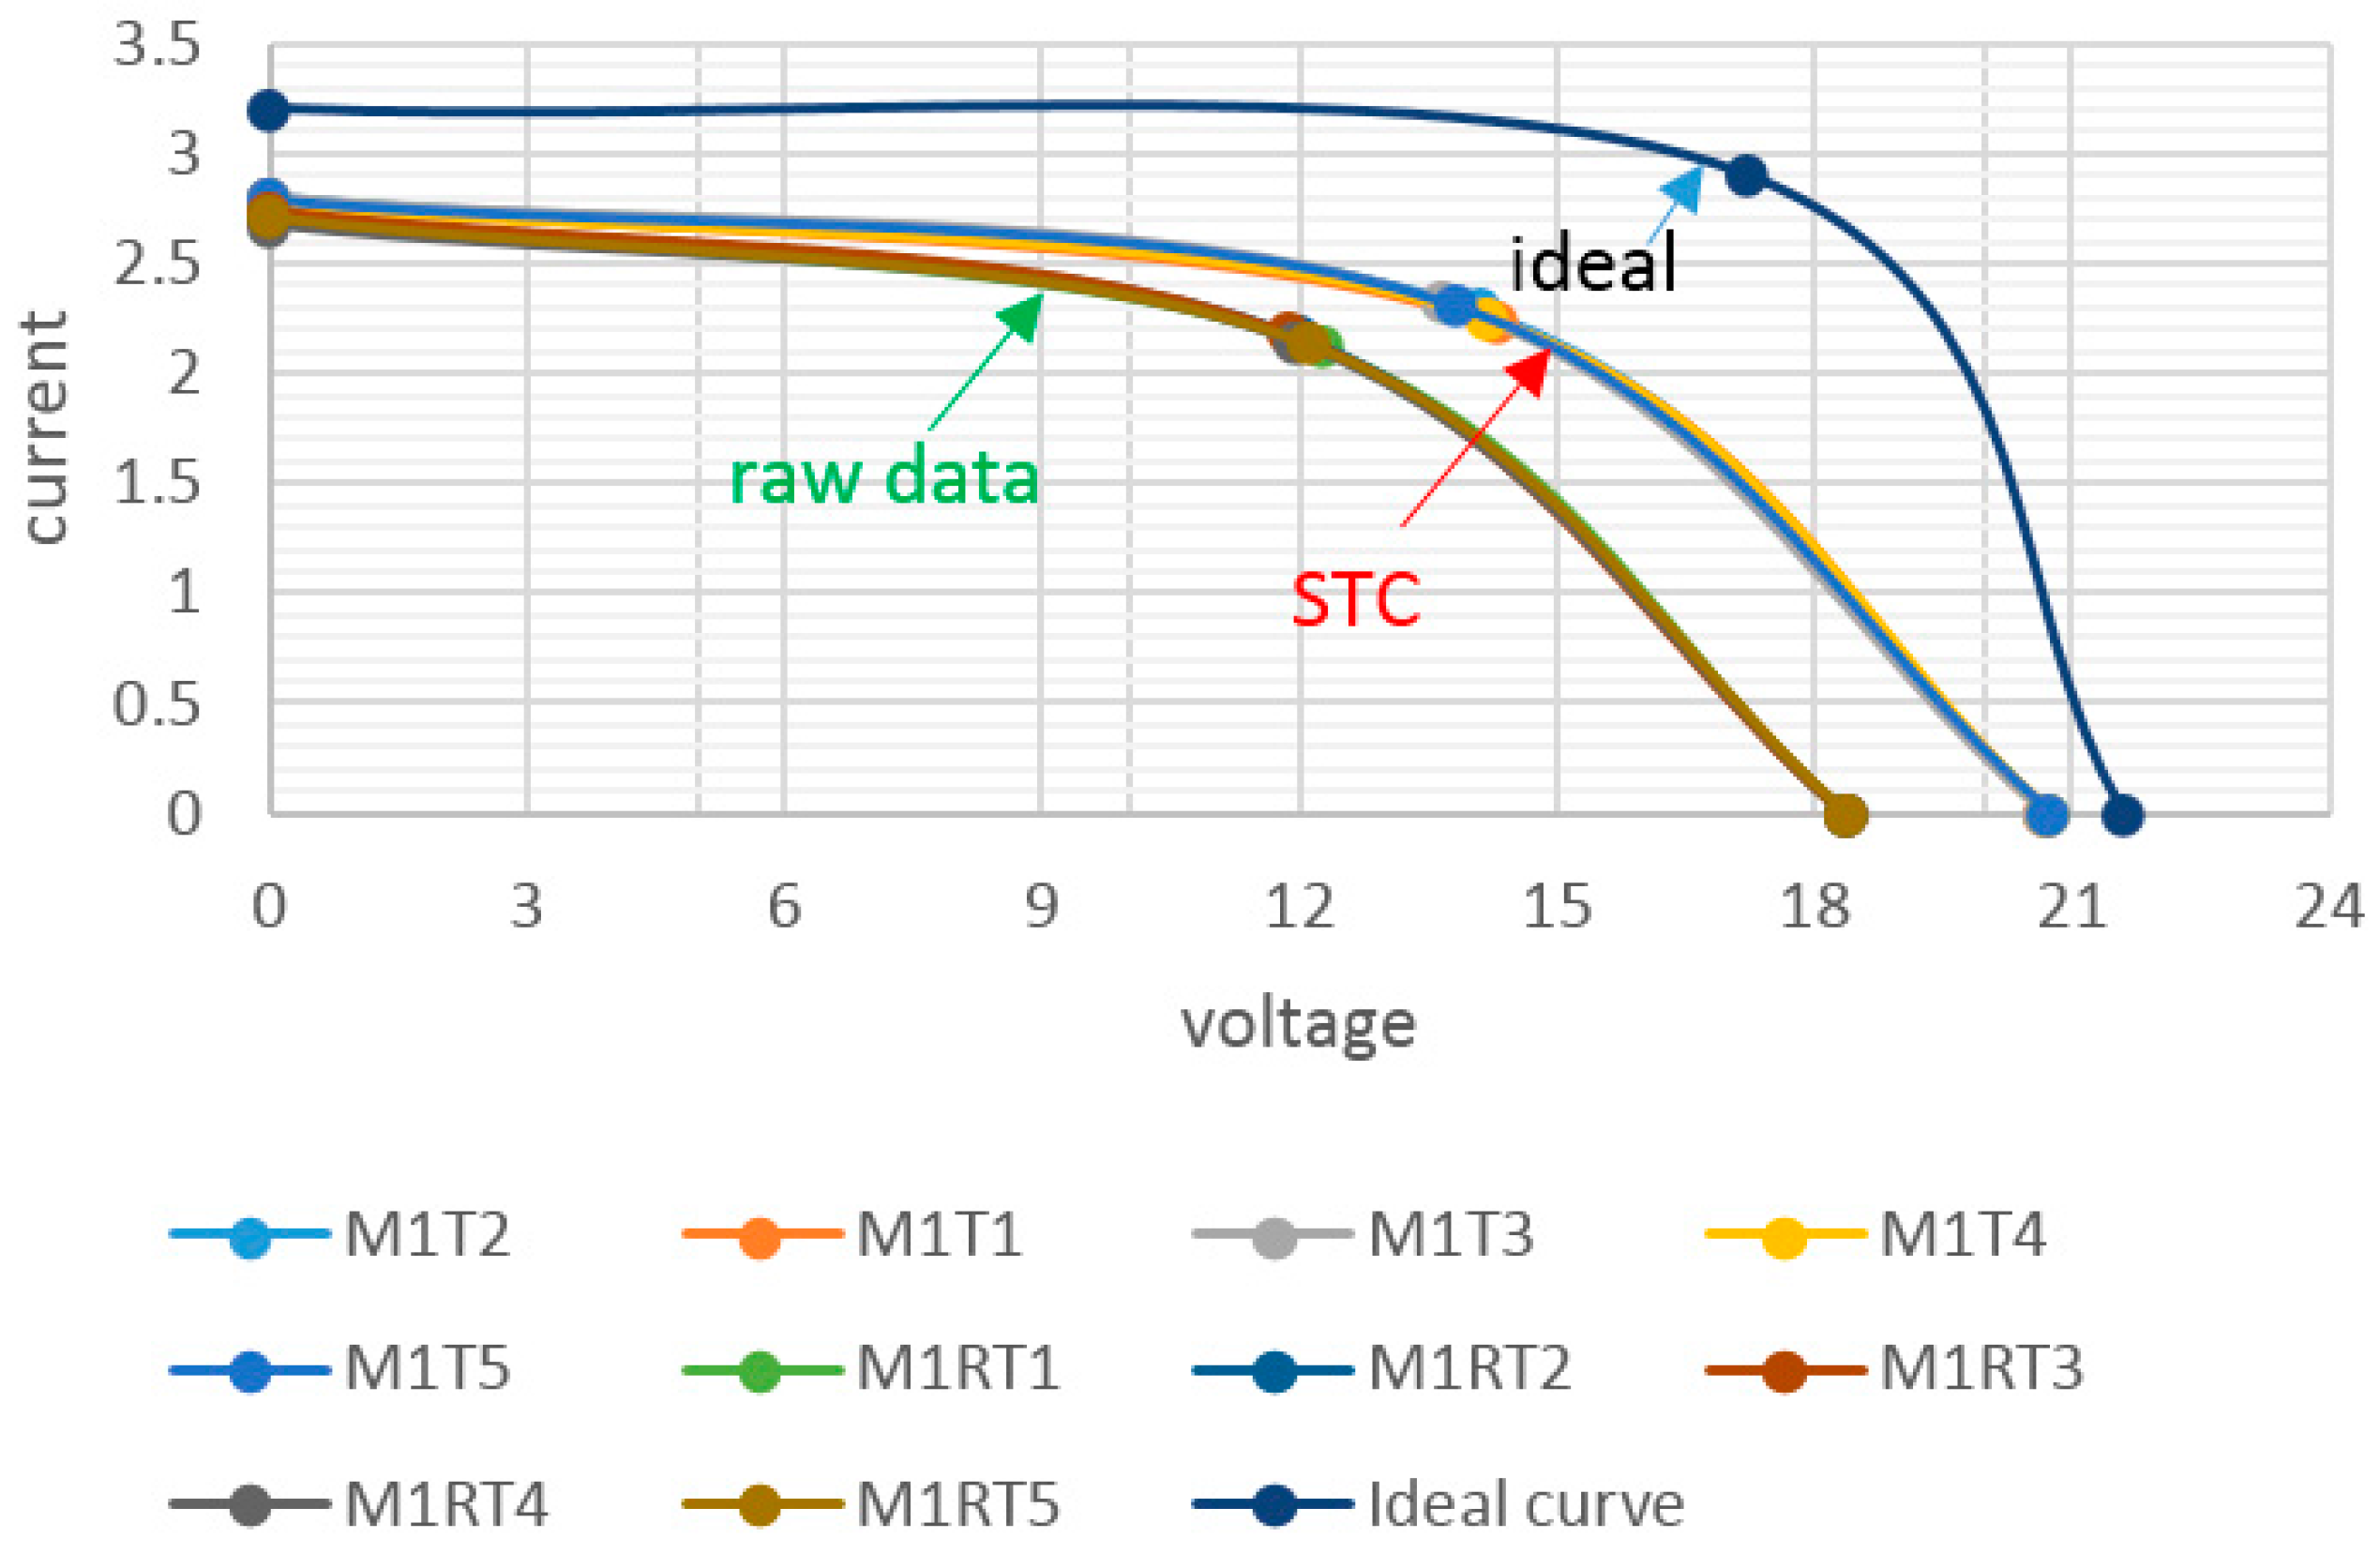
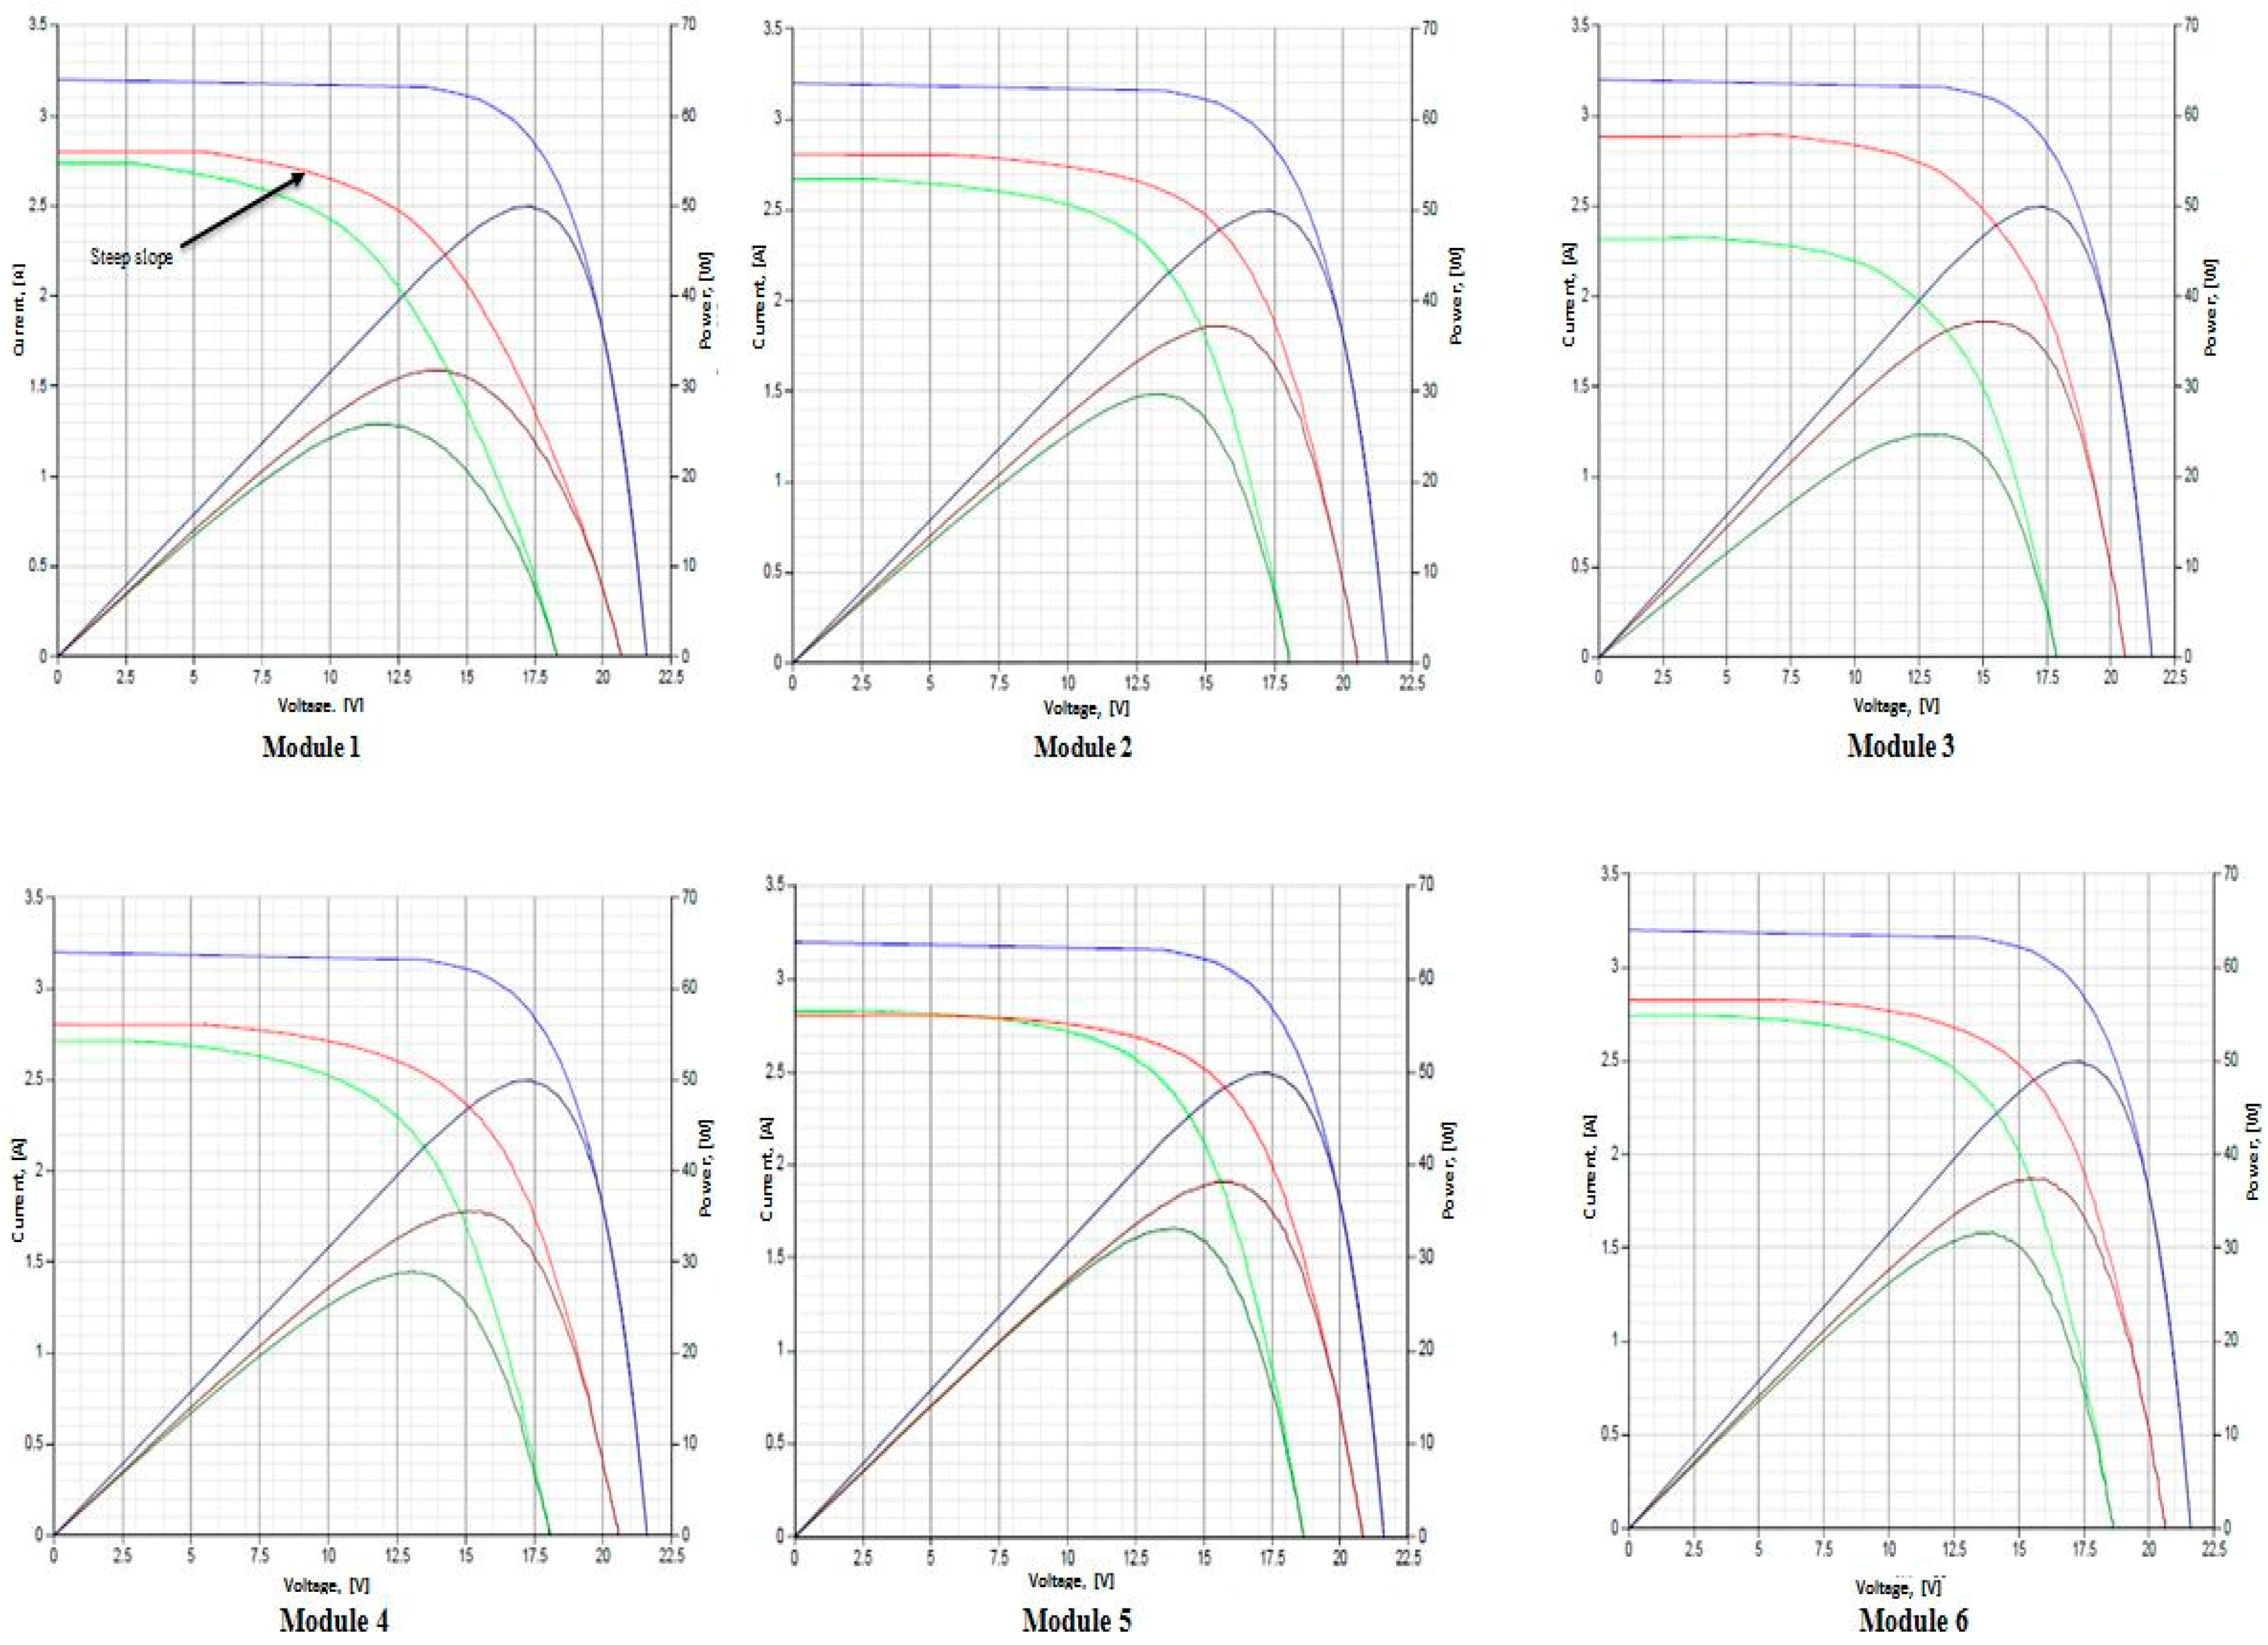
- Curves from raw data derived from ground measurement (shown in green graph);
- (2)
- Curves extrapolated to STC (shown in red graph);
- (3)
- Ideal manufacturer’s curve (shown in blue graph).
- Front Glass Damage (Superstrate)
- Backsheet
- Wires/Connectors
- Junction Box
- Metallization Browning
- Encapsulant Browning
- Cell damage
- Cell delamination
- Cell discoloration
2.2. Theory
3. Results and Discussion
3.1. Analysis of Experimental I-V Curves
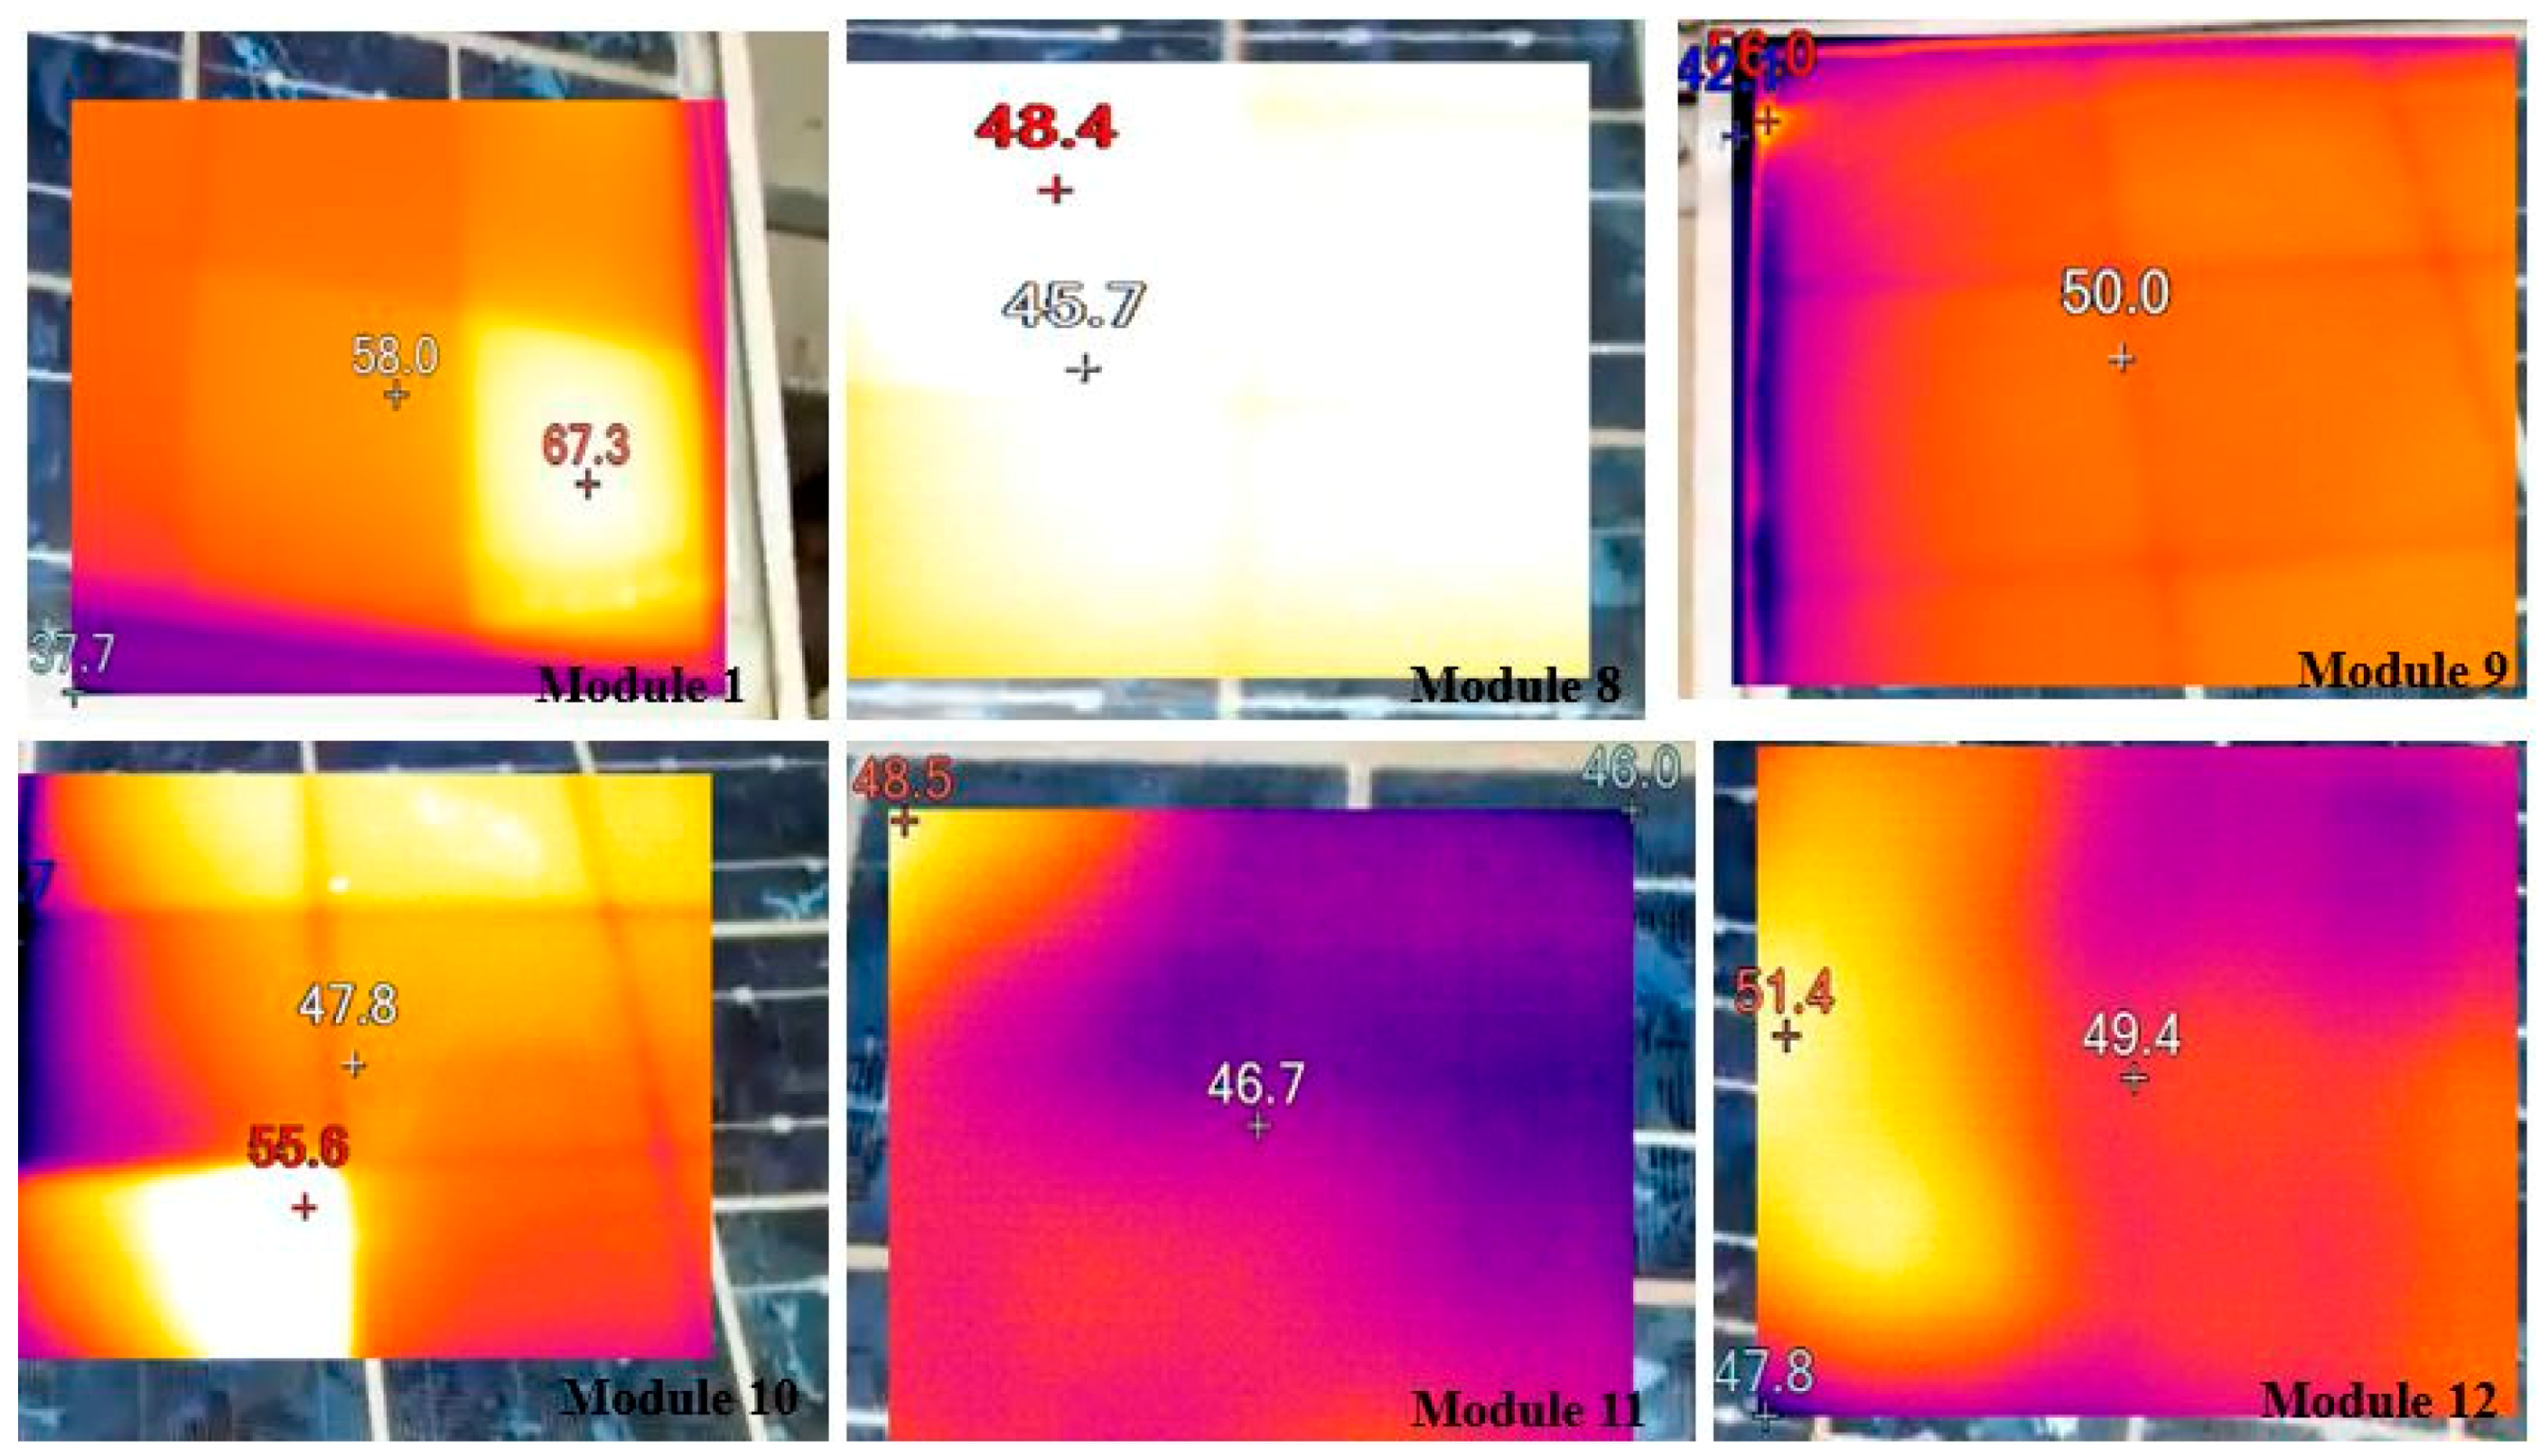
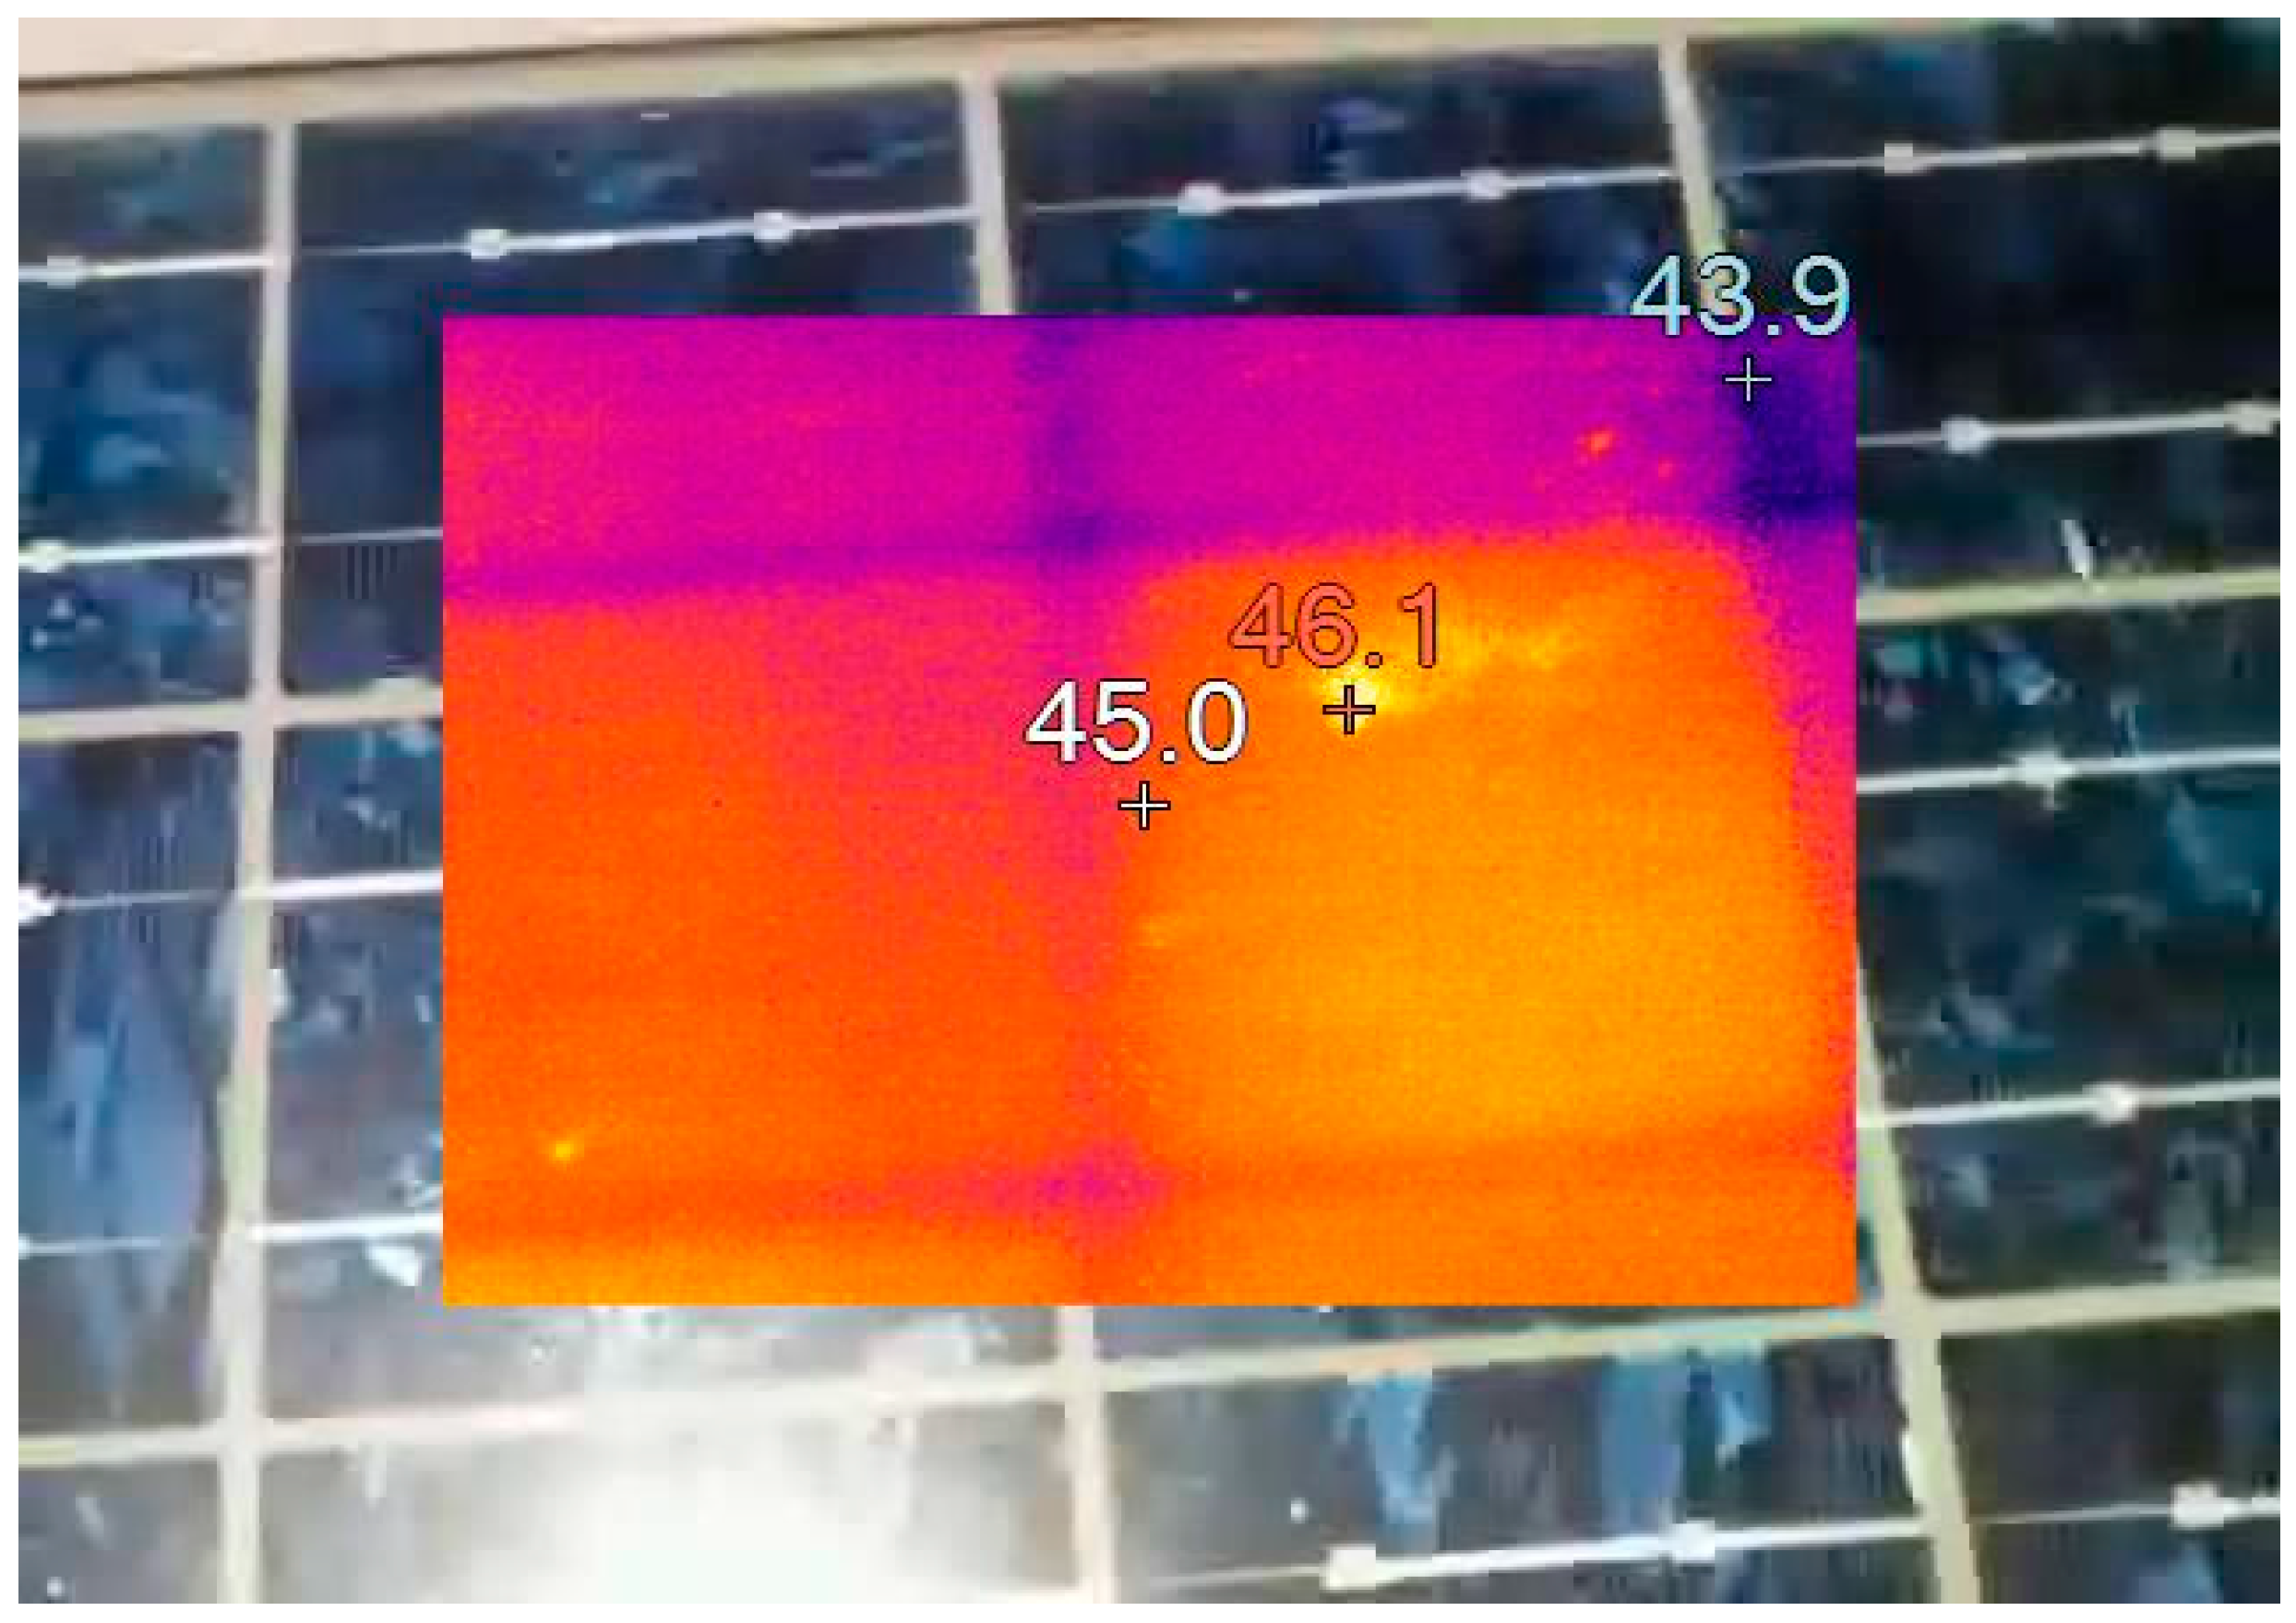
3.2. Infrared Imaging
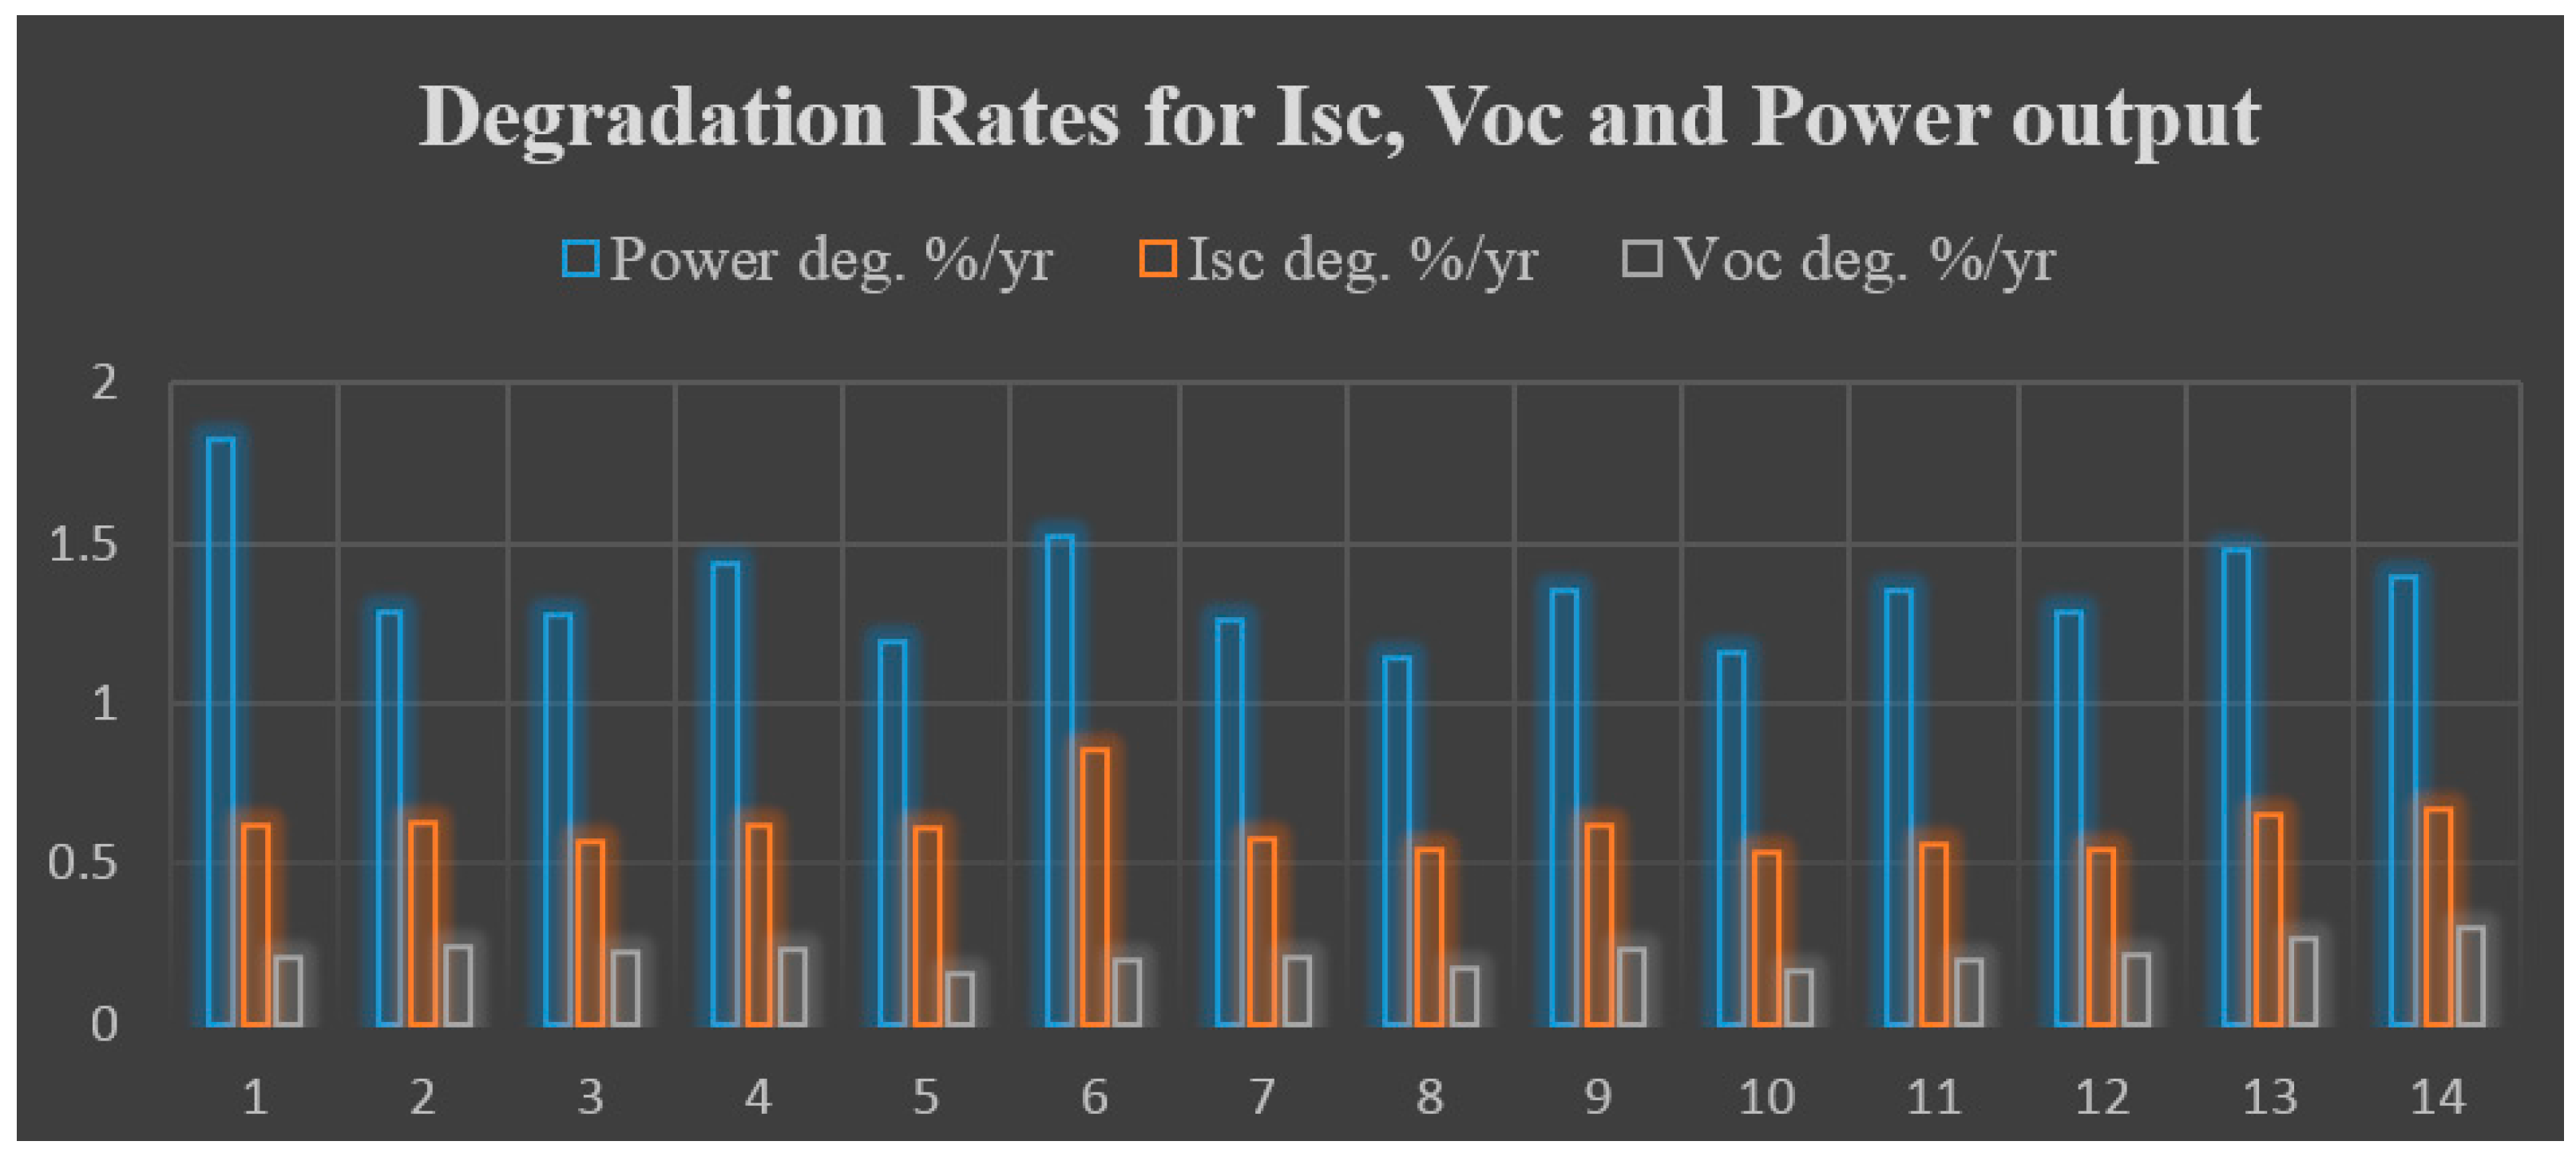
3.3. Module Degradation Rate and Power Drop
4. Conclusions
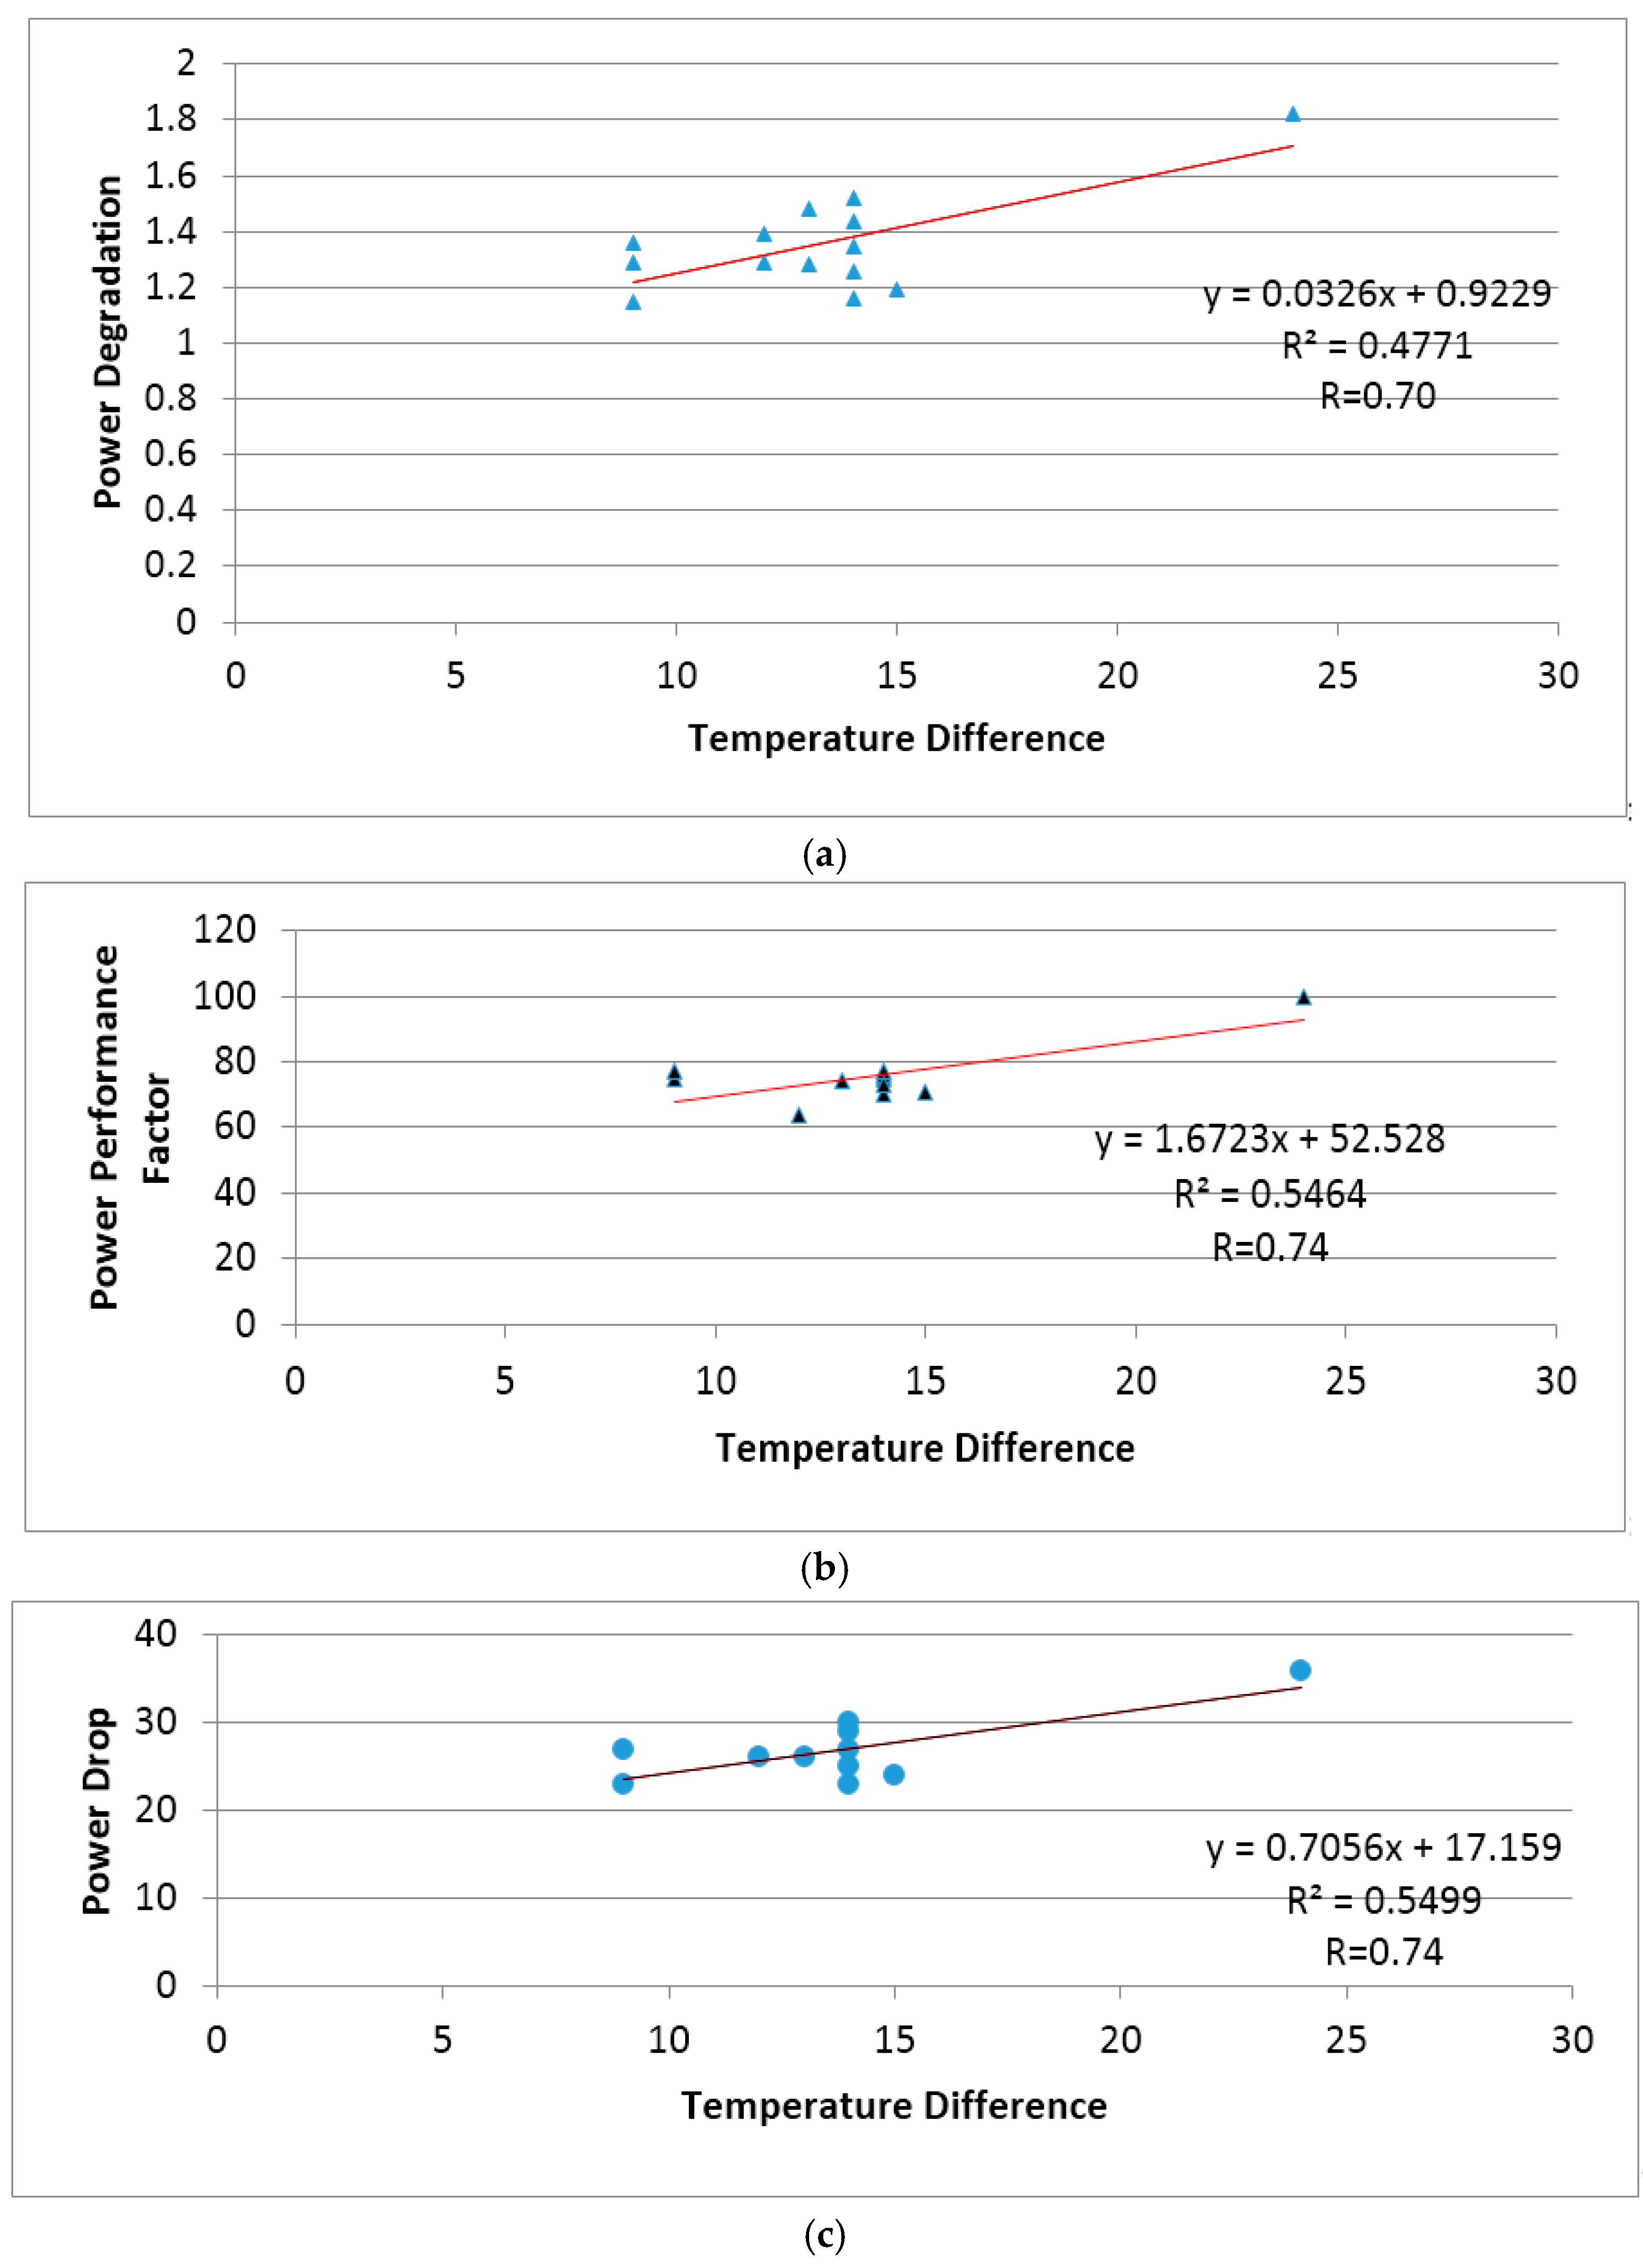
- The higher the temperature difference in the hot spot test, the higher the rate of power degradation. The modules that showed areas with high hot spots (a temperature difference of more than 10 °C) generally showed a higher power drop and higher degradation rates. One module (Module 1) had a temperature difference above 20 °C and 10 modules were between 10–20 °C. According to the criteria indicated in the literature, these 11 modules will fail the hot spot tests. The results provide evidence of a positive correlation between temperature difference and the performance parameters (Pdeg, PPF and Pdrop).
- No external damage was observed on the module surfaces during the visual inspection, thus problems must be attributed to internal causes, with corrosion being one possible candidate. Electroluminescence imaging analysis can be conducted in the future to obtain detailed information on these defects.
- All 14 modules tested had an average power degradation rate of 1.36%, higher than the industrially accepted range (0.7–1%/year) when the manufacturer’s rated power of 50 Watts was used in the computation instead of the actual data (measured at zero age). Module 1, with the highest temperature difference of 24 °C in the hot spot test, also recorded the highest degradation rate of 1.82%. This shows a strong correlation between the I-V test results and the hot spot test results. Within the 20 years of operation, the average power performance factor (PPF) (output power) was 72.9%, lower than the 80.2% recommended by the manufacturer under the 25year operation warranty claim statements. This indicates highly degraded modules. Several factors may account for this rate of degradation, which may not be attributed to manufacturing errors.
- When +10% of the manufacturer’s rated power of 50 watts was used, all 14 modules fell outside the acceptable range of 0.7–1.0%. However, when −10% was used, only three modules fell outside the range. These results also show a positive correlation between the I-V data and the hot spot tests results when the manufacturer’s rated power was used as well as +10% of the manufacturer’s rated power.
Acknowledgments
Conflicts of Interest
Nomenclature
| Open Circuit Voltage (volts) | |
| ISC | Short Circuit Current (amps) |
| Pmax | Maximum Power (watts) |
| FF | Fill Factor |
| PPF | Power Performance Factor |
| °C | Temperature measured in degrees Celsius |
| NREL | National Renewable Energy Laboratory |
References
- National Renewable Energy Laboratory (NREL). Analysis of Photovoltaic System Energy Performance Evaluation Method; NREL: Lakewood, CO, USA, 2013. [Google Scholar]
- Jordan, D.C.; Kurtz, S.R. Photovoltaic Degradation Rates—An Analytical Review, Progress in Photovoltaics: Research and Application; NREL: Lakewood, CO, USA, 2011. [Google Scholar]
- National Renewable Energy Laboratory (NREL). Outdoor PV Module Degradation of Current-Voltage Parameters; NREL: Lakewood, CO, USA, 2012. [Google Scholar]
- Phono Solar Technology Co., Ltd. Limited Warranty for PV-Modules; Phono Solar Technology Co., Ltd.: Nanjing, China, 2016. [Google Scholar]
- Tsanakas, J.A.; Chrysostomou, D.; Botsaris, P.N.; Gasteratos, A. Fault dignostis of photovoltaic modules through image processing and Canny edge detection on field thermographic measurements. Int. J. Sustain. Energy 2015, 34, 351–372. [Google Scholar] [CrossRef]
- Canadian Solar. Limited Warranty Statement: Photovoltaic Module Products; Canadian Solar: Munich, Germany, 2017. [Google Scholar]
- LG Solar. 25 Year Limited Warranty; LG Solar: Eschborn, Germany, 2014. [Google Scholar]
- Jinko Solar. Limited Warranty for PV Modules; Jinko Solar: Unterschleissheim, Germany, 2016. [Google Scholar]
- Kyocera. Limited Warranty for Kyocera Photovoltaic Module(s); Kyocera: Zurich, Switzerland, 2013. [Google Scholar]
- Photowatt. Modules General Terms of Warranty—EDF ENR PWT; Photowatt: Bourgoin-Jallieu, France, 2016. [Google Scholar]
- Roumpakias, E.; Bouroutzikas, F.; Stamatelos, A. On-site inspection of PV Panels, Aided by Infrared Thermography. Adv. Appl. Sci. 2016, 1, 53–62. [Google Scholar]
- Parretta, A.; Bombace, M.; Graditi, G.; Schioppo, R. Optical degradatin of long-term, field-aged c-Si photovoltaic modules. Sol. Energy Mater. Sol. Cells 2005, 86, 349–364. [Google Scholar] [CrossRef]
- Solmetric. Guide to Interpreting I-V Curves Measurements of PV Arrays; Solmetric: Sebastopol, CA, USA, 2011. [Google Scholar]
- Kurtz, S.R.; Myers, D.; Townsend, T.; Whitaker, C.; Maish, A.; Hulstrom, R.; Emery, K. Outdoor rating conditions for photovoltaic modules and systems. Sol. Energy Mater. Sol. Cells 2000, 62, 379–391. [Google Scholar] [CrossRef]
- Osterwald, C.R. Standards, Calibration, and Testing of PV Modules and Solar Cells. In Practical Handbook of Photovoltaics; National Renewable Energy Laboratory: Golden, CO, USA, 2012. [Google Scholar]
- Carr, A.J.; Prior, T.A. A comparison of the performance of different PV module types in temperate climates. Sol. Energy 2004, 76, 285–294. [Google Scholar] [CrossRef]
- Kang, G. Investigation of Aging Phenomenon and Power Drop Rate with Field Exposed PV Modules; EUPVSCE: Valencia, Spain, 2010. [Google Scholar]
- Sharma, V.; Chandel, S.S. Performance and degradation analysis for long term reliability of solar photovoltaics systems: A review. Renew. Sustain. Energy Rev. 2013, 27, 753–767. [Google Scholar] [CrossRef]
- Quansah, D.A.; Adaramola, S.A.; Takyi, G.; Edwin, I.A. Reliability and degradation of solar PV modules-Case study of 19-year-old polycrystalline modules in Ghana. Technologies 2017, 5, 22. [Google Scholar] [CrossRef]
- Gallon, J.; Horner, G.S.; Hudson, J.E.; Vasilyev, L.A.; Lu, K. PV Module Hotspot Detection; National Renewable Energy Lab: Golden, CO, USA, 2015. [Google Scholar]
- Kumar, S.; Kumar, G. Hotspot analysis of photovoltaic module using EL and IR Techniques. Int. J. Adv. Eng. Res. 2012, 3, 62–65. [Google Scholar]
- Hoyer, U. Analysis of PV modules by electroluminescence and IR thermography. In Proceedings of the 24 European Photovoltaic Solar Energy Conference, Hamburg, Germany, 21–25 September 2009. [Google Scholar]
- Acciani, G.; Falcone, O.; Vergura, S. Typical defects of PV Cells. In Proceedings of the IEEE International Symposium on Industrial Electronics (ISIE), Bari, Italy, 4–7 July 2010. [Google Scholar]
- Moorthy, M.K. Automation of Risk Priority Number Calculation of Photovoltaic Modules and Evaluation of Module Level Power Electronics. Master’s Thesis, Arizona State University, Tempe, AZ, USA, 2015. [Google Scholar]
- Moretón, R.; Lorenzo, E.; Leloux, J.; Carrillo, J. Dealing in practice with hotspots. In Proceedings of the 29th European Photovoltaic Solar Energy Conference and Exhibition, Amsterdam, The Netherlands, 22–26 September 2014. [Google Scholar]
- Salazar, A.M.; Macabebe, E.Q.B. Hotspot Detection in Photovoltaic Modules Using Infrared Thermography. Electron. Power Syst. 2016, 70. [Google Scholar] [CrossRef]
- Solar Edge. Technical Notes—Bypass Diode Effects in Shaded Conditions; Solar Edge: Hertsliya, Israel, 2010. [Google Scholar]
- Sample, T. Failure modes and degradation rates from field-aged crystalline silicon modules. In Proceedings of the PV Module NREL Reliability Workshop, Denver, CO, USA, 16–17 February 2011. [Google Scholar]


| PV Module Location/Probe Number | IR Imager Reading (°C) | Temperature Probes (°C) |
|---|---|---|
| 1 | 32.0 | 32.08 |
| 2 | 32.1 | 32.47 |
| 3 | 31.1 | 30.79 |
| 4 | 32.2 | 31.1 |
| Component | Observation (s) |
|---|---|
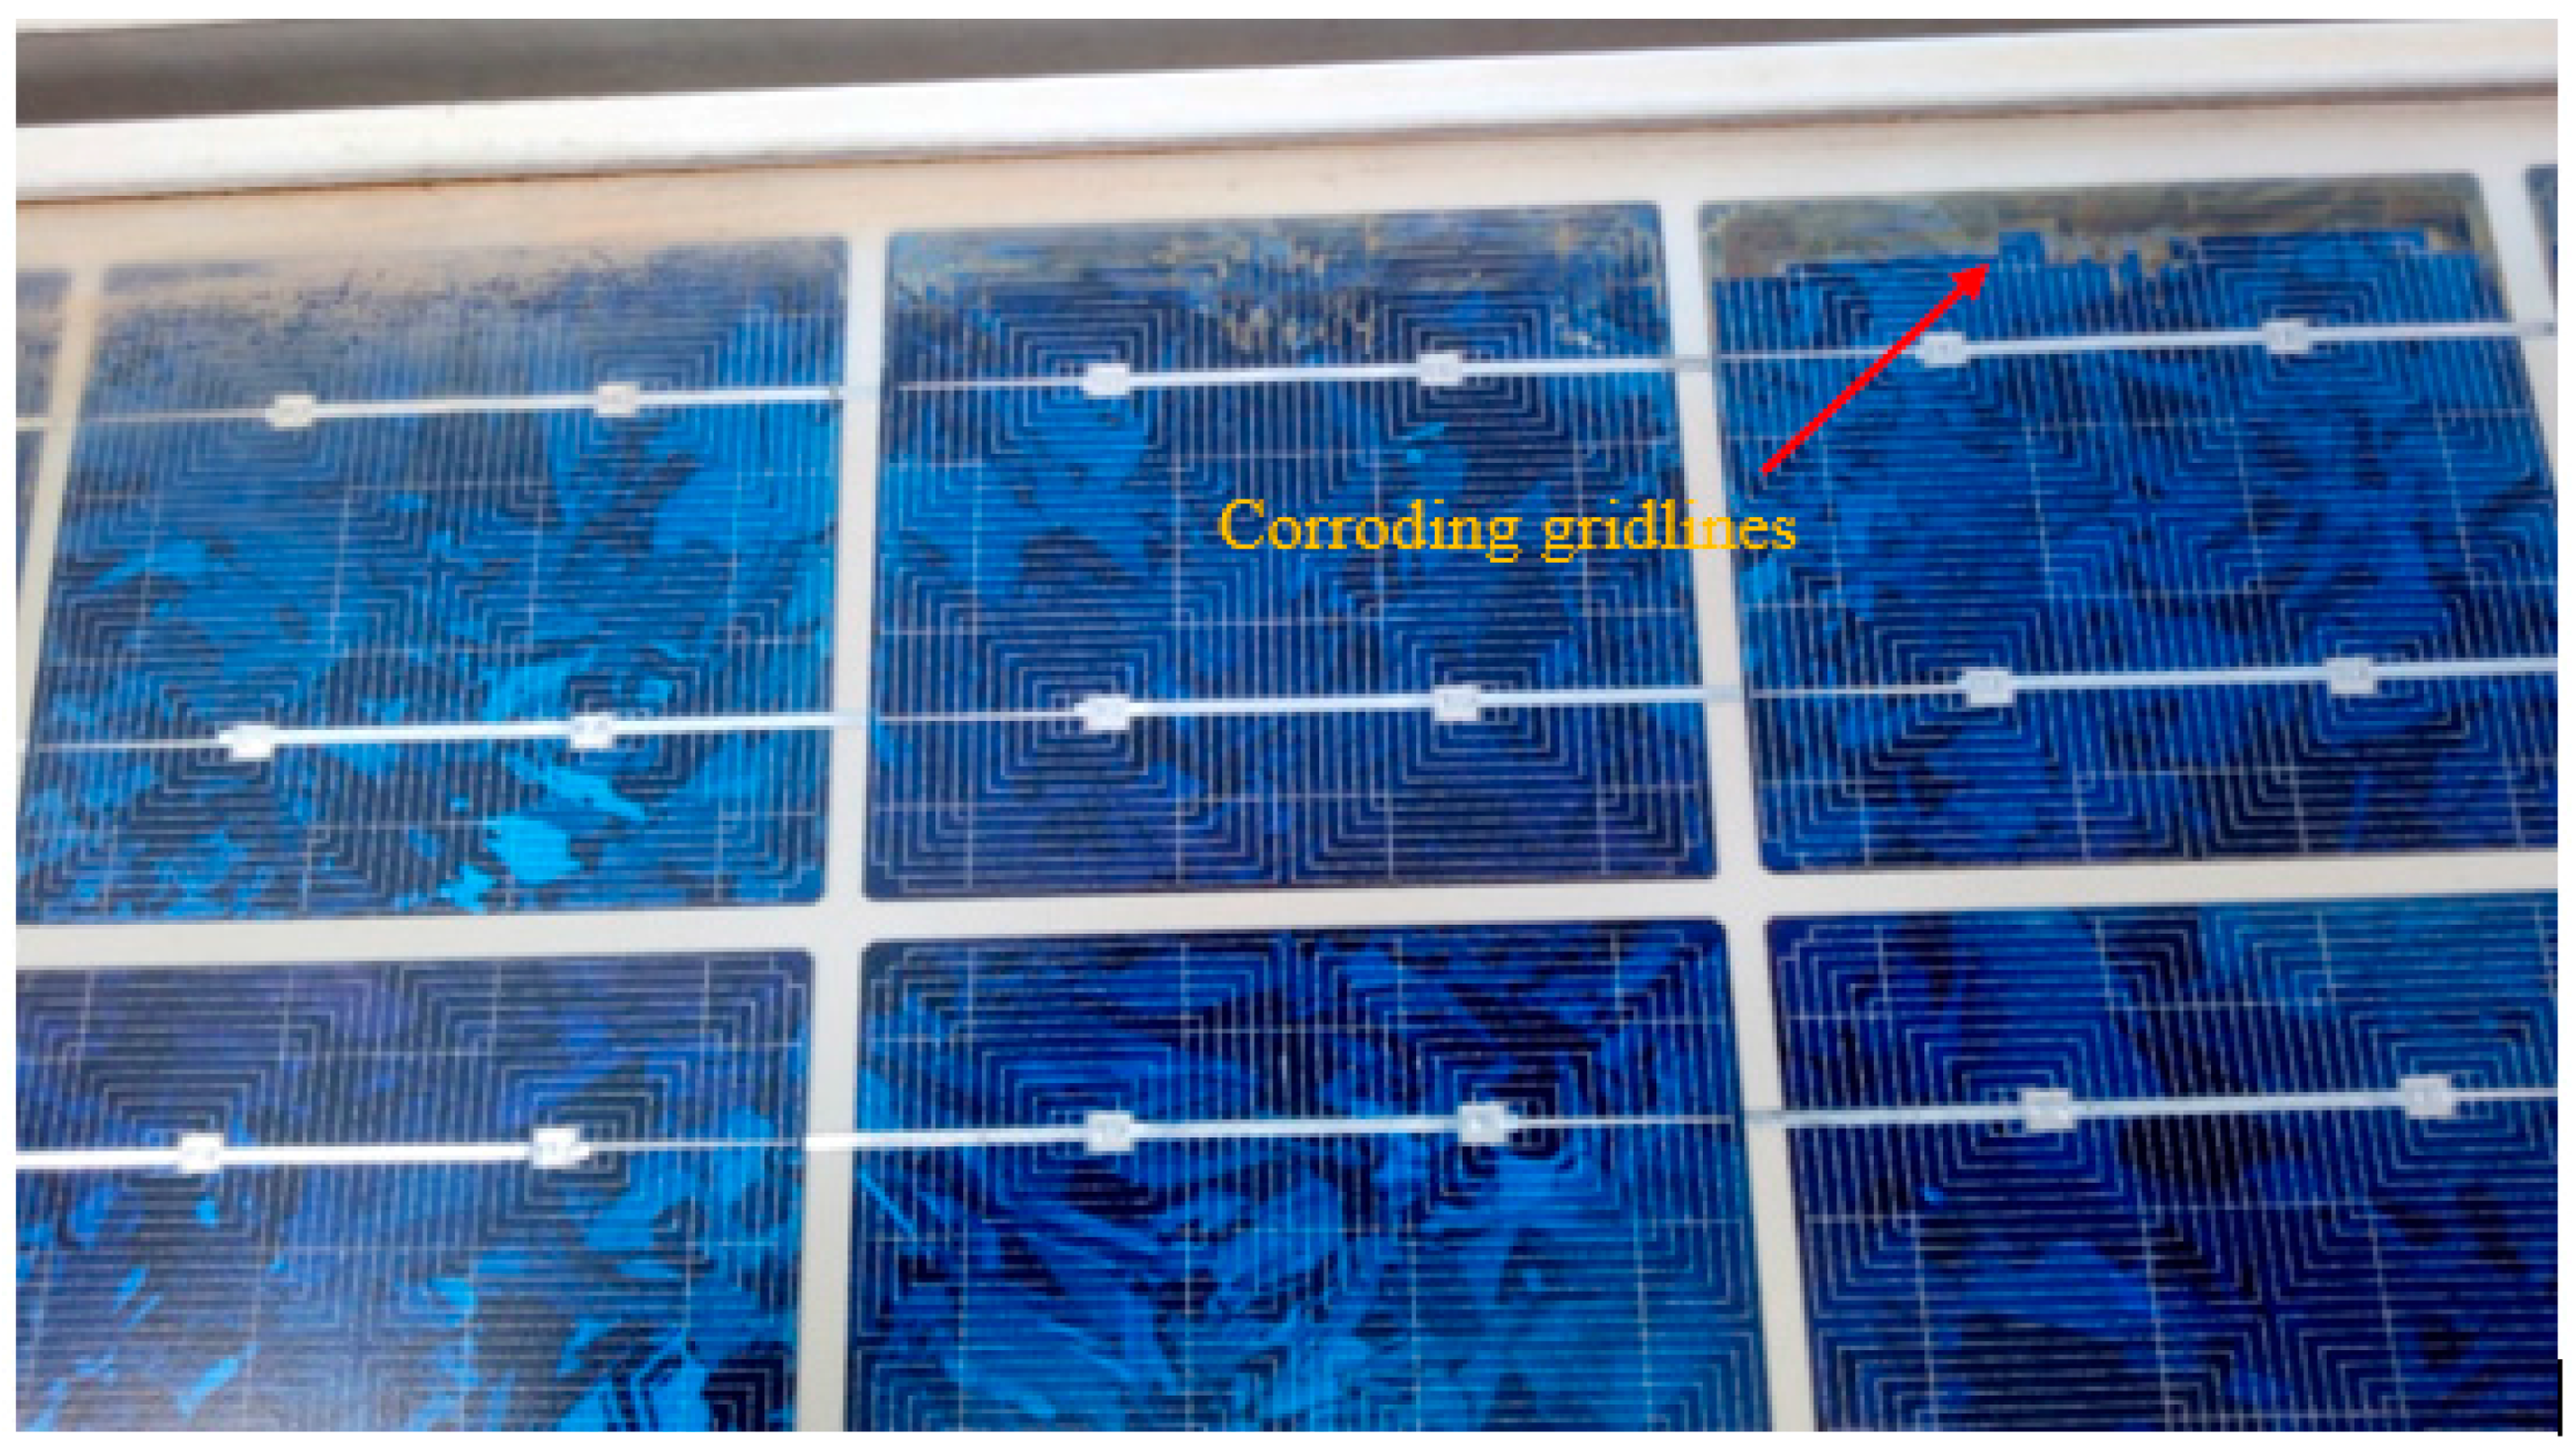
| Cell gridlines | Gridlines on modules indicate browning and corroding effect. These corrosion effects were observed clearly on some gridlines of Modules 1, 5, 6, 12, 13 and 14 as shown in Figure 5 for Module 12 |
| Backsheet | Minor discoloration on front glass—this might be due to moisture ingress. No wavy texture was observed, no chalking, burn marks or other damage was visible |
| Wires/connectors | no embrittlement or burns was observed |
| Delamination | Minor delamination was observed on Modules 1, 5, 6 and 7 |
| Cell Gaps | All modules cell gaps showed minor brown discoloration, affecting encapsulations slightly |
| Frames | Frames of all modules show minor discoloration, there was no evidence of corrosion of metal joints |
| Metallization | Bus-bars and cell interconnects showed no burns, discoloration or corrosion |
| Junction box | No damage was observed on the junction boxes. No adhesion losses |
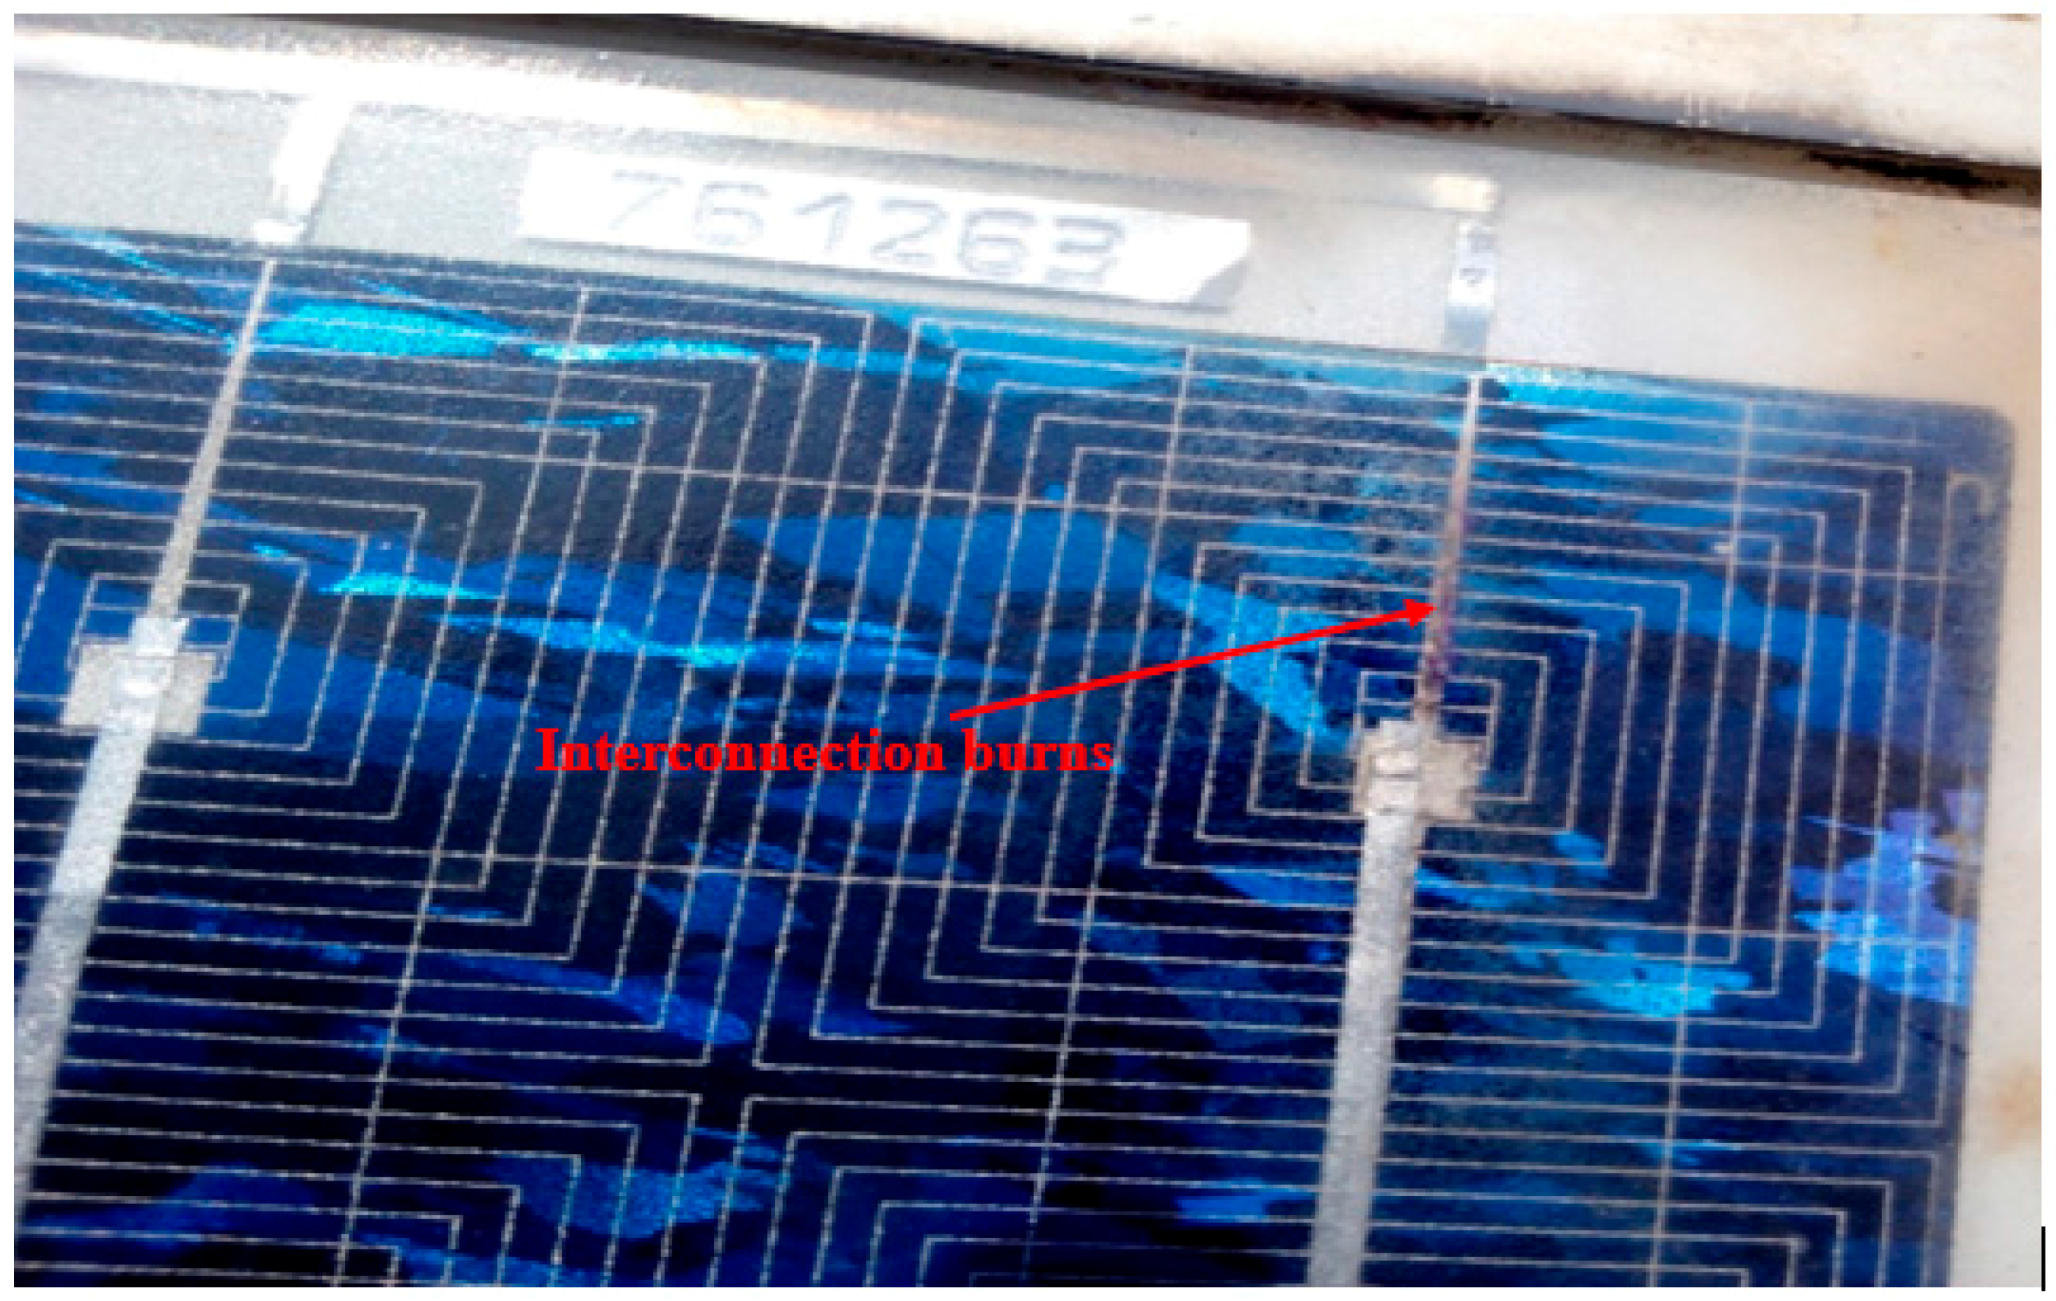
| Interconnect Ribbons | Module 10 shows a minor burn along a ribbon (Figure 6) |
| Front Glass | Animal droppings and dust particles observed before experiment was conducted |
| Module Number | Pmax (Watts) | Vmax (Volts) | Imax (Amps) | VOC (Volts) | ISC (Amps) | Fill Factor | PPF (%) |
|---|---|---|---|---|---|---|---|
| 50 | 17.2 | 2.9 | 21.6 | 3.2 | 0.72 | 100 | |
| M 1 | 31.8 | 13.7 | 2.33 | 20.7 | 2.8 | 0.55 | 64 |
| M 2 | 37.1 | 15.4 | 2.41 | 20.6 | 2.8 | 0.65 | 74 |
| M 3 | 37.2 | 15.0 | 2.49 | 20.6 | 2.8 | 0.64 | 75 |
| M 4 | 35.6 | 15.1 | 2.35 | 20.6 | 2.8 | 0.62 | 71 |
| M 5 | 38.1 | 15.6 | 2.44 | 20.9 | 2.8 | 0.65 | 76 |
| M 6 | 34.8 | 16.0 | 2.18 | 20.7 | 2.7 | 0.63 | 70 |
| M 7 | 37.4 | 15.4 | 2.44 | 20.7 | 2.8 | 0.64 | 75 |
| M 8 | 38.6 | 16.1 | 2.39 | 20.8 | 2.9 | 0.65 | 77 |
| M 9 | 36.5 | 15.4 | 2.37 | 20.6 | 2.8 | 0.63 | 73 |
| M 10 | 38.4 | 15.9 | 2.42 | 20.9 | 2.9 | 0.64 | 77 |
| M 11 | 36.5 | 16.1 | 2.26 | 20.7 | 2.8 | 0.62 | 73 |
| M 12 | 37.1 | 16.3 | 2.28 | 20.7 | 2.9 | 0.63 | 74 |
| M 13 | 35.2 | 15.4 | 2.28 | 20.4 | 2.8 | 0.62 | 70 |
| M 14 | 36.1 | 15.4 | 2.35 | 20.3 | 2.8 | 0.64 | 72 |
| Module Number | Hottest Spot (°C) | Coldest Spot (°C) | Difference (°C) | Pdrop (Watt) | Pdeg (%/year) | ISC deg (%/year) | VOC deg (%/year) |
|---|---|---|---|---|---|---|---|
| M 1 | 67 | 43 | 24 | 36 | 1.82 | 0.62 | 0.21 |
| M 2 | 56 | 44 | 12 | 26 | 1.29 | 0.63 | 0.24 |
| M 3 | 57 | 44 | 13 | 26 | 1.28 | 0.57 | 0.23 |
| M 4 | 58 | 44 | 14 | 29 | 1.44 | 0.62 | 0.23 |
| M 5 | 59 | 44 | 15 | 24 | 1.19 | 0.61 | 0.16 |
| M 6 | 58 | 44 | 14 | 30 | 1.52 | 0.86 | 0.2 |
| M 7 | 55 | 41 | 14 | 25 | 1.26 | 0.58 | 0.21 |
| M 8 | 48 | 40 | 9 | 23 | 1.15 | 0.54 | 0.18 |
| M 9 | 56 | 42 | 14 | 27 | 1.35 | 0.63 | 0.24 |
| M 10 | 56 | 41 | 14 | 23 | 1.16 | 0.54 | 0.17 |
| M 11 | 49 | 40 | 9 | 27 | 1.36 | 0.56 | 0.2 |
| M 12 | 51 | 42 | 9 | 26 | 1.29 | 0.55 | 0.22 |
| M 13 | 54 | 41 | 13 | 30 | 1.48 | 0.65 | 0.27 |
| M 14 | 54 | 42 | 12 | 28 | 1.39 | 0.67 | 0.3 |
| Module Number | −10% of Manufacturer’s Rated (50 Watts) %/year | +10% of Manufacturer’s Rated (50 Watts) %/year |
|---|---|---|
| M1 | 1.4 | 2.1 |
| M2 | 0.9 | 1.6 |
| M3 | 0.9 | 1.6 |
| M4 | 1.0 | 1.8 |
| M5 | 0.8 | 1.5 |
| M6 | 1.1 | 1.8 |
| M7 | 0.8 | 1.6 |
| M8 | 0.7 | 1.5 |
| M9 | 0.9 | 1.7 |
| M10 | 0.7 | 1.5 |
| M11 | 0.9 | 1.5 |
| M12 | 0.9 | 1.6 |
| M13 | 1.1 | 1.8 |
| M14 | 0.9 | 1.7 |
| Power (Watts) | Irradiance (W/m2) | Efficiency (%) |
|---|---|---|
| 31.65 | 922 | 7.4 |
| 26.29 | 833 | 6.8 |
| 30.76 | 981 | 6.7 |
| 50 (nameplate rating at STC conditions) | 1000 | 10.75 |
© 2017 by the author. Licensee MDPI, Basel, Switzerland. This article is an open access article distributed under the terms and conditions of the Creative Commons Attribution (CC BY) license (http://creativecommons.org/licenses/by/4.0/).
Share and Cite
Takyi, G. Correlation of Infrared Thermal Imaging Results with Visual Inspection and Current-Voltage Data of PV Modules Installed in Kumasi, a Hot, Humid Region of Sub-Saharan Africa. Technologies 2017, 5, 67. https://doi.org/10.3390/technologies5040067
Takyi G. Correlation of Infrared Thermal Imaging Results with Visual Inspection and Current-Voltage Data of PV Modules Installed in Kumasi, a Hot, Humid Region of Sub-Saharan Africa. Technologies. 2017; 5(4):67. https://doi.org/10.3390/technologies5040067
Chicago/Turabian StyleTakyi, Gabriel. 2017. "Correlation of Infrared Thermal Imaging Results with Visual Inspection and Current-Voltage Data of PV Modules Installed in Kumasi, a Hot, Humid Region of Sub-Saharan Africa" Technologies 5, no. 4: 67. https://doi.org/10.3390/technologies5040067