1. Introduction
It was commonly believed that the purpose of the financial sector was to mediate the economic and investment needs of economic entities and redistribute funds between economic activities. Nowadays, well-functioning financial markets and banking institutions are usually considered to be a condition favourable to economic growth (
Diallo 2018;
Belke et al. 2016;
Cevik et al. 2016;
Zhang et al. 2016;
Destefanis et al. 2014;
Roghanian et al. 2012;
Ferreira 2012;
Balkevicius 2012;
Waheed and Younus 2010). Banks, being among the most important participants in the financial system, play an important role in it. As agents, they actively contribute to the efficient reallocation of resources in the market, fund enterprise projects, thus promote economic growth, maintain long-term relationships with companies, solve the problem of information asymmetry and share risk, mitigating economic fluctuations.
Diallo (
2018) states that efficiency makes banks more resilient to shocks, thereby positively and significantly affecting growth.
Belke et al. (
2016) study show that relatively more profit-efficient banks foster growth in their region. The banks’ contribution to the economic development depends on their legal status. It might be the case of developing countries, where state-owned commercial banks or rural credit cooperatives has no causality or rather a negative impact on GDP (
Banerjee et al. 2017;
Andersson et al. 2016).
However, in the same way, banks can contribute to the economic collapse of the financial system. They may become the center of a financial crisis that spreads the negative effects of the emerging crisis through close interactions with other participants of the financial system and allows them to disseminate financial contagion across the financial system.
Diallo’s (
2018) study shows that bank efficiency relaxed credit constraints and increased the growth rate for financially-dependent industries during the crisis. This finding shows the great but overlooked the importance of bank efficiency in mitigating the negative effects of financial crises on growth for industries that are most dependent on external financing. Thus, even small shocks can trigger a significant negative impact on the entire financial system and/or the whole economy.
The importance of bank efficiency and bank market concentration has also been the object of the discussion (
Ferreira 2012).
Waheed and Younus (
2010) provide quantitative support to the view that the financial sector’s development is crucial to economic growth and the efficiency of the financial sector is potentially important to the long-term growth performance of the countries. The analysis of both, the development of the financial sector, and the dependence of the economic development makes it possible to state that there is a strong association between the development of the financial sector and the development of the economy, but the determination of quantitative assessment and the causal relationship remains an open question (
Balkevicius 2012). Given this positive relation, the importance of the financial sector’s development should not be underestimated and has to be one of the main strategies to achieve a sustainable economic growth in the long term.
In general, efficiency in economics is interpreted as the maximum potential ratio between the output and the input of the product development process, which shows the optimal distribution of available resources that would allow achieving the maximum potential (
Cvilikas and Jurkonyte-Dumbliauskiene 2016).
Drucker (
1963) has practically stated the variation between effectiveness and efficiency. Drucker refers to “doing things right” as an efficiency, while the effectiveness means “doing the right things”. In this definition, a measure of efficiency appraises the organization’s ability to achieve the output considering the minimum input level. Efficiency and scale economies are known as two critical elements governing productivity in the banking sector (
Cevik et al. 2016;
Roghanian et al. 2012;
Fung and Cheng 2010).
The literature on the banking sector efficiency in the emerging European countries is increasingly growing (
Diallo 2018;
Cevik et al. 2016;
Belke et al. 2016;
Ferreira 2012;
Roghanian et al. 2012;
Fung and Cheng 2010;
Kutsomanoli-Filippaki et al. 2009). The efficiency of the banking industry influences the cost of financial intermediation and the overall stability of the financial system, as banks constitute the backbone of financial markets in the Central and Eastern European (CEE) economies.
Belke et al. (
2016) study show that regions with a higher intermediation quality of banks grow faster. Hence, an improvement of banking performance indicates better allocation of financial resources resulting in an increase in investment that favors growth (
Cevik et al. 2016).
Diallo (
2018) stresses the importance of the quality of the financial sector, i.e., its efficiency.
Kutsomanoli-Filippaki et al. (
2009) emphasize that the efficiency of the banking sector is of vital importance from both the microeconomic and macroeconomic perspectives. The efficiency of the banking sector is crucial in terms of competition during the transition to a market economy because the number of foreign banks significantly increased in the CEE region. Their findings implied a lack of efficiency in all of the CEE countries. Furthermore, they confirmed the relationship between the ownership and bank performance, in which the foreign bank ownership provided the highest productivity gains.
The current paper deals with the subsector of credit institutions of the financial sector in Lithuania.
Balkevicius (
2012) provides an overview of the Lithuanian financial sector’s evolution, its structure, and influence on economic development. The banking sector is considered as the most important link in the chain of financial intermediation, with the greatest weight in the financial sector. Some authors closely connect the bank sector efficiency with the risk management performance (
Cvilikas and Jurkonyte-Dumbliauskiene 2016;
Zhang et al. 2016;
Chen et al. 2013).
Zhang et al. (
2016) indicate that financial system risk tolerance capacity has a positive effect on long-term growth. The results of the previous research carried out in this field show that the banking risk management efficiency increases with the increased size of the financial institution, but this growth is decelerating (
Cvilikas and Jurkonyte-Dumbliauskiene 2016). The empirical evidence to date seems to suggest that foreign-owned banks of developing and transition countries have succeeded in capitalizing on their advantages and exhibit a higher level of efficiency compared to their domestic bank peers (
Cevik et al. 2016;
Sufian et al. 2016). However, domestic banks may have distinct advantages over their foreign counterparts because of the intensive accumulation of tacit knowledge in economic, social, legal, and cultural conditions in their home country market. In contrast, foreign banks may face problems in developing a deep understanding of the host country’s cultural and social regulations and their impact (
Sufian et al. 2016).
European banks continue to struggle with declining profitability in a low (negative) interest rate environment. Therefore, taking into account the situation in the market, banks are obliged to change their business models (to adapt to low interest rates) and to review the value chain of banking services in a search for alternative sources of income and to change the existing cost structure. The Financial Supervisory Authorities also claim that the banks may have to consider the possibility of creating a business model where the interest income would play only a minor role.
The purpose of this study is to examine the efficiency of the banks in Lithuania by employing the DEA method and evaluate bank performance in a low interest rate environment.
This study provides an empirical contribution to the concept of the efficiency research of the bank’s performance. In addition, the research contributes to the scholarly literature on the field of determinants of the performance of bank businesses in concentrated markets which are dominated by foreign banks and, in particular, from one region.
The paper is structured as follows:
Section 2 provides data, research constructs, and their measurement, model specification, and identification.
Section 3 provides the measurement of the Lithuanian banks’ efficiency and its estimation, as well as the discussion of the results.
Section 4 comprises a general discussion, and conclusions are presented in
Section 5.
2. Research Data and Methodology
Efficiency can be measured using a frontier approach. Frontier techniques can be parametric and non-parametric. DEA is a non-parametric method which means that no prior functional form is assumed for the frontier, outside of a simple assumption of piecewise linear connections of units on the frontier. DEA measures the technical efficiency with the focus on levels of inputs relative to outputs of a sample of decision-making units (DMUs). The distance between the observed data point and the frontier measures the relative inefficiency or ineffectiveness of each DMU. There are three types of basic DEA models: radial, additive, and slack-based measure models (
Paradi et al. 2018). The initial DEA model, as originally presented in (
Charnes et al. 1978), was built on Farrell’s seminal paper “The measurement of productive efficiency” (
Farrell 1957). This is a radial model characterized by the fact that the DMU’s efficiency score is derived from the extent to which all of its inputs can be contracted and/or its outputs expanded (contraction/expansion occurs proportionately). The CCR model assumed that the production technology, and the so-called production possibility set, exhibited constant returns to scale (CRS). Charnes, Cooper, and Rhodes presented the model of two orientations: input- and output-orientations. The orientation corresponds to the viewpoint taken in improving the inefficient units, whether the goal is to reduce excess inputs consumed or expand shortfalls in outputs produced, respectively, to move the inefficient unit to the frontier. The CCR model was developed under the CRS assumption, but later model modification proposed by (
Banker et al. 1984) employed the VRS assumption, as well.
According to (
Cooper et al. 2011) since 1985, DEA has been widely applied in the banking sector around the world. Among these studies, 36% of the DEA models are applied with the assumption of variable returns to scale (VRS), 26% with the assumption of constant returns to scale (CRS), and 38% of studies are conducted under both the CRS and VRS assumptions.
Paradi and Zhu (
2013) argue, that the banking industry has been the object of the DEA analysis by a significant number of researchers and probably is the most heavily studied of all the business sectors. To measure the efficiency in the Lithuanian banking sector, we used the input-oriented DEA model with the variable returns to scale (VRS) and the constant returns to scale (CRS) assumptions. Using these assumptions or CCR model and BCC model, we can distinguish two different kind of efficiency—technical and scale efficiencies. The input-oriented model is the most frequently used in measuring banking efficiency. This choice is likely to be based on the fact that the bank managers have a higher control over inputs (labor, expenses, and etc.) rather than outputs (loans, income, and etc.) (
Fethi and Pasiouras 2010;
Titko et al. 2014) and they manage the bank’s cost centers when making strategic decisions.
The efficiency score is estimated as the ratio of weighted outputs to weighted inputs (
Charnes et al. 1978). Weights are selected for each variable of every analyzed unit in order to maximize its efficiency score. The efficiency rate for each unit of the reference set of
banks, is evaluated in relation to other set members (
Charnes et al. 1978). The maximal efficiency score is 1, and the lower values indicate the relative inefficiency of the analyzed objects.
The DEA model with m inputs variables, s outputs variables, and u DMU’s, the envelopment form of the input-oriented model is given by (
Charnes et al. 1978) and
Cooper et al. (
2007):
subject to:
We used transformation developed by (
Charnes and Cooper 1962) for linear fractional programming. This transformation selects a solution (i.e., the solution (
u,
v) for which
) and yields the equivalent linear programming problem in which the change of variables from (
u,
v) to (
µ,
v) is a result of the “Charnes-Cooper” transformation:
subject to:
For which the linear programming dual problem is:
subject to:
This model is referred to as the “Farell model”. This model is the output-oriented model that attempts to maximize outputs with the given input level.
The second is called the input-oriented model, which targets to minimize inputs while adequately satisfying the given output level (
Cooper et al. 2007;
Zhu 2009):
subject to:
If the constraint
is adjoined, they are known as the BCC model (
Banker et al. 1984). The BCC model is also referred to as the VRS assumption and distinguished from the CCR model which is referred to as the CRS model. The VRS assumption or BCC model takes into account the variation of efficiency with respect to the scale of operation and measures pure technical efficiency. The BCC model can be used to measure the scale efficiency:
The second important question to measure efficiency is the determination of adequate model variables (inputs and outputs).
Cooper et al. (
2011) and
Paradi et al. (
2018) indicate that the number of DMUs should be at least three times the total number of inputs plus outputs used in the models.
Cooper et al. (
2007),
Cooper et al. (
2011), and
Cook et al. (
2014) proposed a similar rule to set a minimum number of DMUs in relation to the number of variables to have a meaningful result with a clear set of efficient and inefficient units:
where
m,
s, and
n are the numbers of inputs, outputs and DMU’s respectively.
The performance of banks and bank branches are analyzed along three dimensions: production, profitability, and intermediation. These three dimensions reveal the main areas of the bank’s activities and assess the bank’s business model. Banks being the main financial intermediators must seek efficiency in resources allocation (deposits, loans, securities, etc.). Additionally, banks are profit seekers. They must effectively manage the risks in order to be profitable (net interest income, operating profit, net profit, etc.). Production approach assumes that banks used capital and other resources (tangible and intangible, human resources, etc.) to produce different banking products (for example loans and deposits).
According to these approaches, we have constructed five models (see
Table 1). These models represent all the three dimensions: production, profitability and intermediation dimensions. Models differ in the number of incorporated variables: four models with two variables, and one model with three variables. We used only one model with three variables because there are only seven DMUs in our sample. According to
Cooper et al. (
2011) and
Paradi et al. (
2018), DMUs should be at least three times larger than the total number of inputs plus outputs used in the models.
The research sample consists of six commercial banks operating at the moment in Lithuania. Branches of foreign financial institutions are included in the sample as one aggregated bank (financial data of foreign bank branches). This choice is due to the fact that the Bank of Lithuania publishes only the overall performance of all the branches operating in Lithuania and based on the fact that a branch office is not a separate legal entity of the parent bank. The annual banking data used for analysis was extracted from the main indicators of the banking sector activities provided by the
Bank of Lithuania (
2017a,
2017b, and
2017c) and the
Association of Lithuanian Banks (
2017) as for the period of 2012–2016.
DEA assumes all the variables to be non-negative numbers. During our analysis, all the negative numbers (values) were changed to zero.
3. Results
The Lithuanian financial system is dominated by banks offering basic retail banking services, leasing, and insurance services. By the end of 2016, the Lithuanian banking sector comprised six banks and eight branches of foreign banks (seven of them are already operating and one preparing to launch its operations), and 73 credit unions. All the banks operating in Lithuania are retail banks or have a retail business model. At the end of 2016, all the banks’ assets accounted for 79.2% of the total financial system.
The banking sector is dominated by foreign capital banks (see
Table 2). Three of the subsidiaries of foreign-owned banks are owned by the Nordic parent groups (SEB, Swedbank, DNB; 73.1% of the sector’s assets as of 2016) and AB “Citadele” bank is also a foreign subsidiary fully-owned by the parent bank. The bank subsidiaries and branches belonging to the Nordic parent groups account for 89.5% of the total banking sector assets and 91.4% of the total system lending, as of the end of 2016. Additionally, two local banks operated in the Lithuanian banking sector (AB Šiaulių bankas with the EBRD (18.2%), AB Invalda Invl (6.8%) and a private investor (5.8%), and UAB Medicinos Bankas (the largest shareholder (private investor) holding an 89.9% stake)).
The majority of Lithuanian banks’ income comes from loans (68%), while deposits account for the largest share of liabilities (80%, mostly current accounts). Bank profitability has been hit by the persistent low interest rate environment and the decline in fees and commissions following the introduction of the euro in early 2015, as banks lost income from currency exchanges and transfers as a result of the adoption of the common currency. However, banks in Lithuania earned the highest profits in five years and posting EUR 251.8 million in 2016 (a 17% increase year-on-year). Profitability is increasing due to significantly decreased interest expenses and increased efficiency. The banks’ efficiency ratio, which illustrates their cost-to-income ratio, was 47.8% in 2016. According to (
Bank of Lithuania 2017c), the profitability and efficiency of banks in Lithuania are markedly higher if compared to the other banks operating in the EU. In the third quarter of 2016, the average value of the efficiency ratio of the EU banks was 63%; of banks in Lithuania, 46%; ROA, 0.6%; and 1.2% respectively. Their ROE were 5.4% and 10.0%, respectively.
Table 3 summarises the statistical measures calculated for each individual bank in a sample. The Lithuanian bank’s efficiency analysis based on VRS assumption shows (see
Table 3 and
Table 4) that the best results demonstrate the local banks (in particular Bank 6). This result is quite interesting because during all the periods under analysis this bank did not demonstrate any exceptional growth outcomes. It is worth noting that during the given period, the banks owned by the Nordic parent group showed more technical inefficiency. The technical efficiency analysis based on the CRS assumption, where the technical efficiency can be divided into two parts: the pure technical efficiency and the scale efficiency shows other results: the banks owned by the Nordic parent group and the branches have higher pure efficiency than local banks, and have the success at working at the right scale. Based on that, it stated that during this period the larger Lithuanian banks (subsidiaries) applied a more appropriate business model than smaller (local) banks operating in Lithuania. At the same time, it should be noted that these differences between the CCR model (CRS) and the BCC model (VRS) could appear due to the fact that one of the local banks (Bank 5) acquired a significant part of the bankrupt bank’s deposit and loan portfolio. The second reason is that during the financial crisis the largest Lithuanian banks suffered heavy losses that were amortized over the analyzed period.
As one can note, the efficiency level was moderate: the average VRS efficiency was 86% and the average CRS efficiency was 60%. These findings imply that an average bank should contract its inputs about 14–40% in order to operate efficiently. The lowest values of efficiency were 19%. Additionally, the results suggest that during the research period, the banks’ efficiency was quite unstable.
Production dimension. This dimension is represented by model 2, where the input is labor expenses and the output, loans. Based on what banking products banks produce using a different kind of resources, we choose loans as a main banking performance output. The loan portfolio is the main and the largest part of banks’ assets and shows the banks’ effectiveness to attract clients and manage risks. It should be noted that in this case the quality of loans was not assessed, i.e., the amount of non-performing loans has not been evaluated.
Efficiency analysis of production approach with BCC model shows that all banks are technically efficient with an average of 80%. Model 2 indicates that foreign subsidiary banks (Bank 2, Bank 3, and Bank 4) work inefficiently and they can improve the efficiency through the proportional reduction of their inputs while their output proportions are held constant (they must better manage the labor cost or reconsider their business model). The average VRS efficiency of all these banks was only 58%. The CCR model or the CRS efficiency shows the success of management at conversion input to output while scale efficiency shows the success at working at right scale. The CRS efficiency shows different results: all banks are technically efficient with an average of only 44%. Two local banks and one foreign subsidiary (Bank 4, Bank 5, and Bank 6) are technically efficient with an average of 22%. During the period of 2012–2016, the highest share of the banks (more than 50%) operated under the sub-optimal scale (operating in the range of IRS (increasing returns to scale)). Therefore, the banks increased their scale size during 2012–2016, although there are still some possibilities to increase the share of banks operating under the most productive scale size.
Profitability dimension. This dimension represents three models (M1, M3, and M5). Model M1 has two variables: deposits and the operating profit. The average VRS efficiency of all the Nordic banks was 97%, a foreign bank subsidiary (Bank 4) reached the efficiency of 79%, local banks, 85%, and branches, only 60%. The lowest value of efficiency was 22%. The CRS efficiency shows that all banks are technically efficient with an average of 61%: all the Nordic banks was 56%, a foreign bank subsidiary (Bank 4), 62%, local banks, 77%, and branches, 43%. Furthermore, the local banks show better results than subsidiaries. Scale inefficiency in large banks may results from DRS (decreasing returns to scale) characteristics, because during that period banks owned by the Nordic parent group operating at the supra-optimal scale (DRS). This model shows that banks must improve their business model, as other operating incomes do not offset potential losses from the existing low interest rates on the market.
Model M5 also has two variables: deposits and net interest income. This ratio represents the revenue that is generated from a bank’s assets and the expenses associated with paying out its liabilities. The average VRS efficiency was 86% and all the banks operating in Lithuania seeks 90% efficiency (except for the branches: their VRS efficiency was only 66%). CRS efficiency shows substantially similar results. Based on the results from this model, it can be stated that the Lithuanian banks managed to control low interest rates in the market, but looking to the future, however, bank managers should be more actively using value chain opportunities of other banks and differentiate their income (as M1 shows).
Model M3 consists of three variables: as input—deposits, and debts to banks and other credit institutions, and as output—profit before tax. This profit combines all of the bank’s profits before tax, including operating, non-operating, continuing operations, and non-continuing operations.
It is interesting, that based on the results of this model, the banks owned by the Nordic parent group showed the worst results based on VRS efficiency: Bank 1 was only 73%, Bank 3, 47%, and the branches were efficient only by 68%. Noteworthy, analyzed the CRS efficiency or pure technical efficiency, the worst results demonstrated two other banks (Bank 4 and Bank 6), respectively, 29% and 9%. High scale efficiency demonstrated by the banks owned by the Nordic parent group indicate the success to improve efficiency. During the period of 2012–2016, all these banks operated under the sub-optimal scale (operating in the range of IRS). This indicates, that local banks must proportionally reduce their inputs while their output proportions should be held constant. These findings imply that an average bank should contract its inputs about 60% in order to operate efficiently. The results of this model are closely related to the results of the previous models. We see that while banks are able to work effectively on the low interest rate market, they do not properly use other areas of their activity or inefficiently manage their other operational resources. Obviously, that banks need to adapt their business model to today’s challenges since in the future they can not ensure sustainable activities.
Intermediation dimension. This dimension is represented by model 4, where the input is deposits and the output, loans. This model best reflects the essential function of banks in the financial system: to be the financial intermediary, which leads to reallocation of funds among the participants in the financial system. Additionally, this model can show the possibilities of banks doing their business in the current low interest rate environment. The average VRS efficiency of two banks owned by the parent bank was 77%, Bank 4, 89%, and Bank 5, only 52%. The CRS efficiency shows different results for Bank 1, Bank 4, and for Bank 6: all these banks are technically efficient with an average of only 56%. The biggest banks (Bank 1, Bank 2, Bank 3, and Bank 7) are technically efficient with an average of 78%, and the smallest (Bank 4, Bank 5, Bank 6), 46%. During the period of 2012–2016, the highest share of the banks (more than 50%) operated under the sub-optimal scale (operating in the range of IRS). This indicates that not all banks were able to adapt to the challenging business environment or discover new opportunities for more efficient use of the available resources and more active management of the differences in interest rates between different types of assets and liabilities.
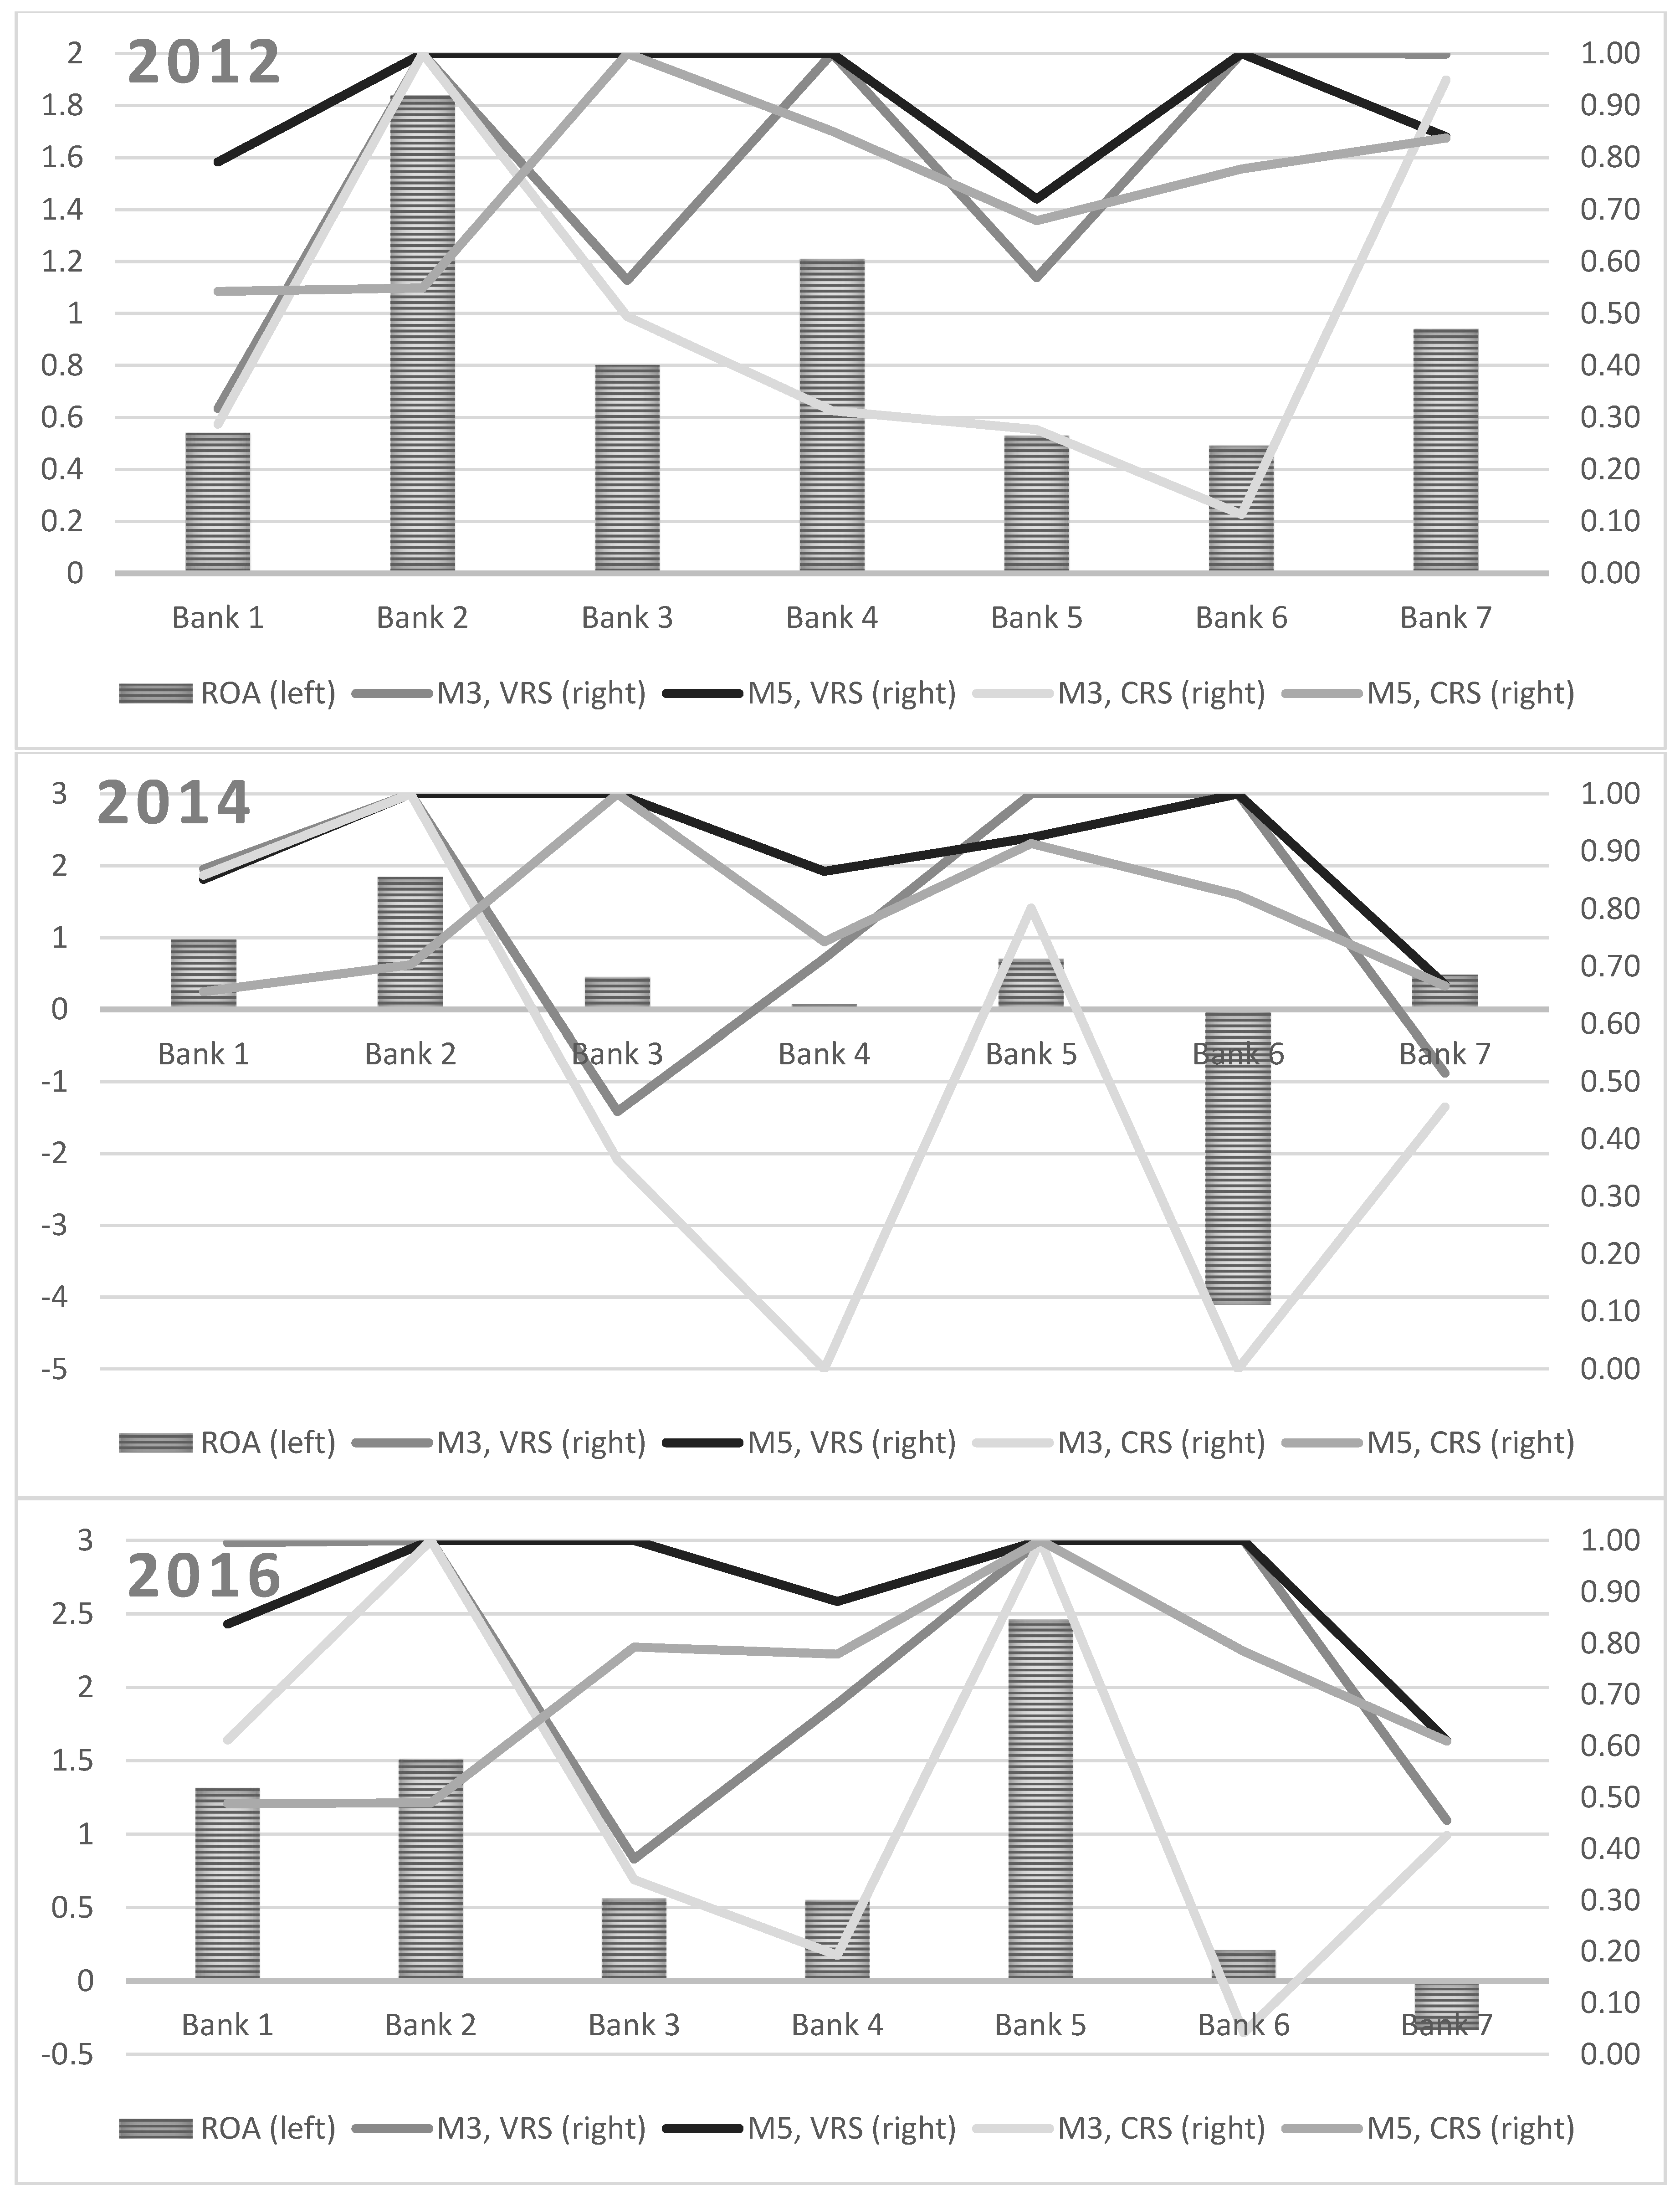
Cooper et al. (
2011) suggest validating the results obtained using the DEA method. They propose to compare the DEA results with the bank’s own performance measures. Based on that, we selected the main bank profitability measure—the return on assets ratio (ROA)—and compared it with the results obtained from two DEA models (M3 and M5) with the CRS and the VRS assumptions (see
Figure 1). These models also present the efficiency based on profitability dimension. M3 model (especially with CRS assumption) showed a very close movement compared to ROA. Additionally, this model has the largest adjusted R
2 (regression coefficient is statistically significant at 0.05 level). Model 5 presented better results than the ROA ratio. This model, as an output, has a net interest income and showed high efficiency managing the interest rate differences in today’s low interest rate environment.
5. Conclusions
Foreign capital banks, registered in Lithuania, have a significantly higher market share of assets, liabilities, loans, and deposits among the Lithuanian commercial banks. Assets and liabilities in the Lithuanian capital banks grew at a slower pace than in foreign capital banks. The share of liabilities in total assets in the Lithuanian capital banks has decreased, while it has increased in foreign capital banks.
To measure the Lithuanian banking sector’s efficiency used the input-oriented DEA model under the VRS and the CRS assumptions. The Lithuanian bank’s efficiency analysis based on VRS assumption shows that better results demonstrate the local banks. The technical efficiency analysis based on the CRS assumption, where the technical efficiency can be divided into two parts—the pure technical efficiency and the scale efficiency shows other results: the banks owned by the Nordic parent group and the branches have higher pure efficiency than local banks and have the success at working at right scale. Based on that, it stated that during this period the larger Lithuanian banks (subsidiaries) applied a more appropriate business model than smaller (local) banks operating in Lithuania.
The performance of banks and bank branches are analyzed along three dimensions: production, profitability, and intermediation. Efficiency analysis on production approach with the BCC model shows that all banks are technically efficient with an average of 80%. The CRS efficiency shows different results: all banks are technically efficient with an average of only 44%.
The profitability dimension represents three models (M1, M3, and M5) and, based on the results from this model, it can be stated, that the Lithuanian banks managed to control low interest rates in the market, but looking to the future, however, bank managers should be more actively using value chain opportunities of other banks and differentiate their income.
The intermediation dimension is represented by model 4 and shows that not all banks were able to adapt to the challenging business environment or discover new opportunities for more efficient use of the available resources and more active management of the differences in interest rates between different types of assets and liabilities.
Nevertheless, the continuing unfavorable low interest environment is likely to have a negative effect on the performance of banks due to low earnings, which depends on the difference between short-term and long-term interest rates. In addition, banks are closely linked to the economy of the country in which they operate; so as long as economic growth remains low in Europe, it is unlikely that the banks’ performance will improve, if significant operational changes are not made.
Consequently, the current challenges in the market force the transformation of the banking model, and the increase in lending volumes, the current low cost of financial resources, the digitisation of bank services, the potential benefits of a more efficient use of the existing structure, and the consolidation of individual activities would increase the profitability of banks. It is obvious that the current situation where banks operate without changing their business model in a low-inflation (and interest rate) environment reduces bank profits, which, in turn, negatively affects the value of banks, as investors are more concerned about bank profitability than solvency indicators (stress-based stress testing in the long run).


