Article

Operational Efficiency of Bank Loans and Deposits: A Case Study of Vietnamese Banking System

1
School of Economics and Finance, Massey University, Palmerston North 4474, New Zealand
2
School of Aviation, Massey University, Palmerston North 4474, New Zealand
*
Author to whom correspondence should be addressed.
Int. J. Financial Stud. 2018, 6(1), 14; https://doi.org/10.3390/ijfs6010014
Submission received: 29 November 2017 / Revised: 2 January 2018 / Accepted: 24 January 2018 / Published: 26 January 2018

Abstract

:
This paper examines whether there is a causal relationship between bank loans and deposits in the Vietnamese banking system and the efficiency of the use of loans and deposits by the Vietnamese banks. In a country such as Vietnam, where inter-bank money markets are relatively underdeveloped, one would expect a reasonably strong relationship between deposits and loans. A pooled cross-sectional sample of financial ratios is collected from annual reports of 44 Vietnamese banks covering the period 2008–2015. The explanatory power of instrumental variables in relation to the endogenous variables is tested. A deterministic frontier model based on corrected ordinary least squares, estimated by three-stage least squares on a simultaneous equations model, is employed to derive the frontiers for the sampled banks as well as to estimate the causality between bank loans and deposits. Our findings suggest that, in an underdeveloped banking system such as Vietnam, bank deposits have a positive and significant impact on bank loans, but the reverse relationship is not significant. It is further suggested that in deposit-taking and loan-creating activities, Vietnamese banks performed moderately well over the period examined; however, in the near future, they should start to focus more on deposit-taking activities.

1. Introduction

The activities of an intermediary credit institution such as a commercial bank primarily focus on receiving deposits and providing loans, which are two aspects of credit operations. Among other things, receiving deposits (or fund mobilisation) is considered as an ‘input’ activity of the bank1, while lending (or fund utilisation) is considered an ‘output’ activity. On one hand, since more deposits allow for more loans, banks want to mobilise more funds but also minimize their interest payments. On the other hand, since more loans contribute to economic development, increase revenues, and create more (potential) deposits, banks also want to utilise more funds while maintaining low leverage and low risks. Concurrently, the efficiency of fund mobilisation and utilisation at banks should have causal impacts on each other.
The interdependent relationship between bank loans and deposits has long been acknowledged in the banking literature. Revisiting the argument of Klein (1971) and Monti (1972) that the decisions about loans and deposits are independent, Dermine (1986) found that the two decisions are interdependent if the bank faces very plausible situations such as a positive probability of default. Using data from Italian banks, Corradi et al. (1990) showed that there was cointegration among bank free reserves, loans, and deposits and thus provided evidence in favour of the hypothesis that there is a causal nexus running from bank deposits to loans. Kashyap et al. (2002) also found synergies between the two activities of deposit-taking and lending and further argued that they are the two manifestations of one primitive function of the bank, that is the provision of liquidity on demand or the intermediary role of the banks. These relationships have also been highlighted by Berger and Bouwman (2009) in their exploration of bank liquidity creation.
Bank efficiency studies mainly treat banks as intermediaries2 between savers and borrowers. In this sense, according to Sealey and Lindley (1977), loans and other assets serve as outputs, while deposits and other liabilities are considered inputs of the banks. Consequently, bank efficiency studies focus on minimizing the deposits used (input-oriented), on maximizing the loans provided (output oriented), or on both (non-oriented). For example, Berger et al. (1993) examined the input technical efficiency of US banks over the 1984–1989 period using the funds (both deposits and non-deposit funds) and number of employees as input variables; while Assaf et al. (2011) used total deposits (alongside labour and physical capital) to evaluate the input efficiency of Shinkin banks (i.e., credit associations in Japan) during the period 2000–2006. In contrast, Fujii et al. (2014) studied the output-oriented efficiency of Indian banks in producing customer loans (alongside other earning assets as well as bad loans); while Nguyen and Simioni (2015) used total loans (alongside securities and total operating income) to analyse the output-oriented total factor productivity change over time of Vietnamese banks from 2008 to 2012.
We thus find that traditional banking studies acknowledge the causal relationship between bank loans and deposits but do not examine it from the efficiency perspective. The bank efficiency literature examines the efficiency of either fund mobilisation or fund utilisation activities and thus does not explore the causality issue. In this paper, we investigate the efficiency of deposit-taking and loan-making in a simultaneous framework in order to determine the causality between the operational efficiency of bank loans and deposits. Specifically, we apply corrected ordinary least squared (COLS) to estimate the deterministic frontier of Vietnamese banks for the period of 2008–2015 in mobilizing and utilizing funds. The efficiency of deposit-taking and loan-making activities will then be simultaneously examined under a simultaneous equations model (SEM) using three-stage least squares (3SLS). In this sense, we combine the two above approaches of traditional banking studies and banking efficiency studies into a novel approach. We expected this approach to provide an overall view on the operational efficiency of the two basic activities of commercial banks without the problem of simultaneity bias (Wooldridge 2016).
Empirically, we found that, for Vietnamese banks, deposits have a positive and significant impact on loans, whereas loans have a positive but insignificant impact on deposits. Moreover, the (median) operational efficiency of deposit-taking activities is higher than that of loan-making activities, suggesting that Vietnamese banks will need to focus more on their output side. One can see that, in the past few years, Vietnamese banks were not only having problems creating more loans but also had problems with the quality of the loans, as nonperforming loans increased over time (Ngo and Tripe 2017).
The remainder of this paper is as follows. Section 2 provides some background information regarding the Vietnamese banking system and its efficiency. Section 3 clarifies the methodology aspect of the research as well as the sample data. Section 4 reveals the results and discussions, and Section 5 concludes.

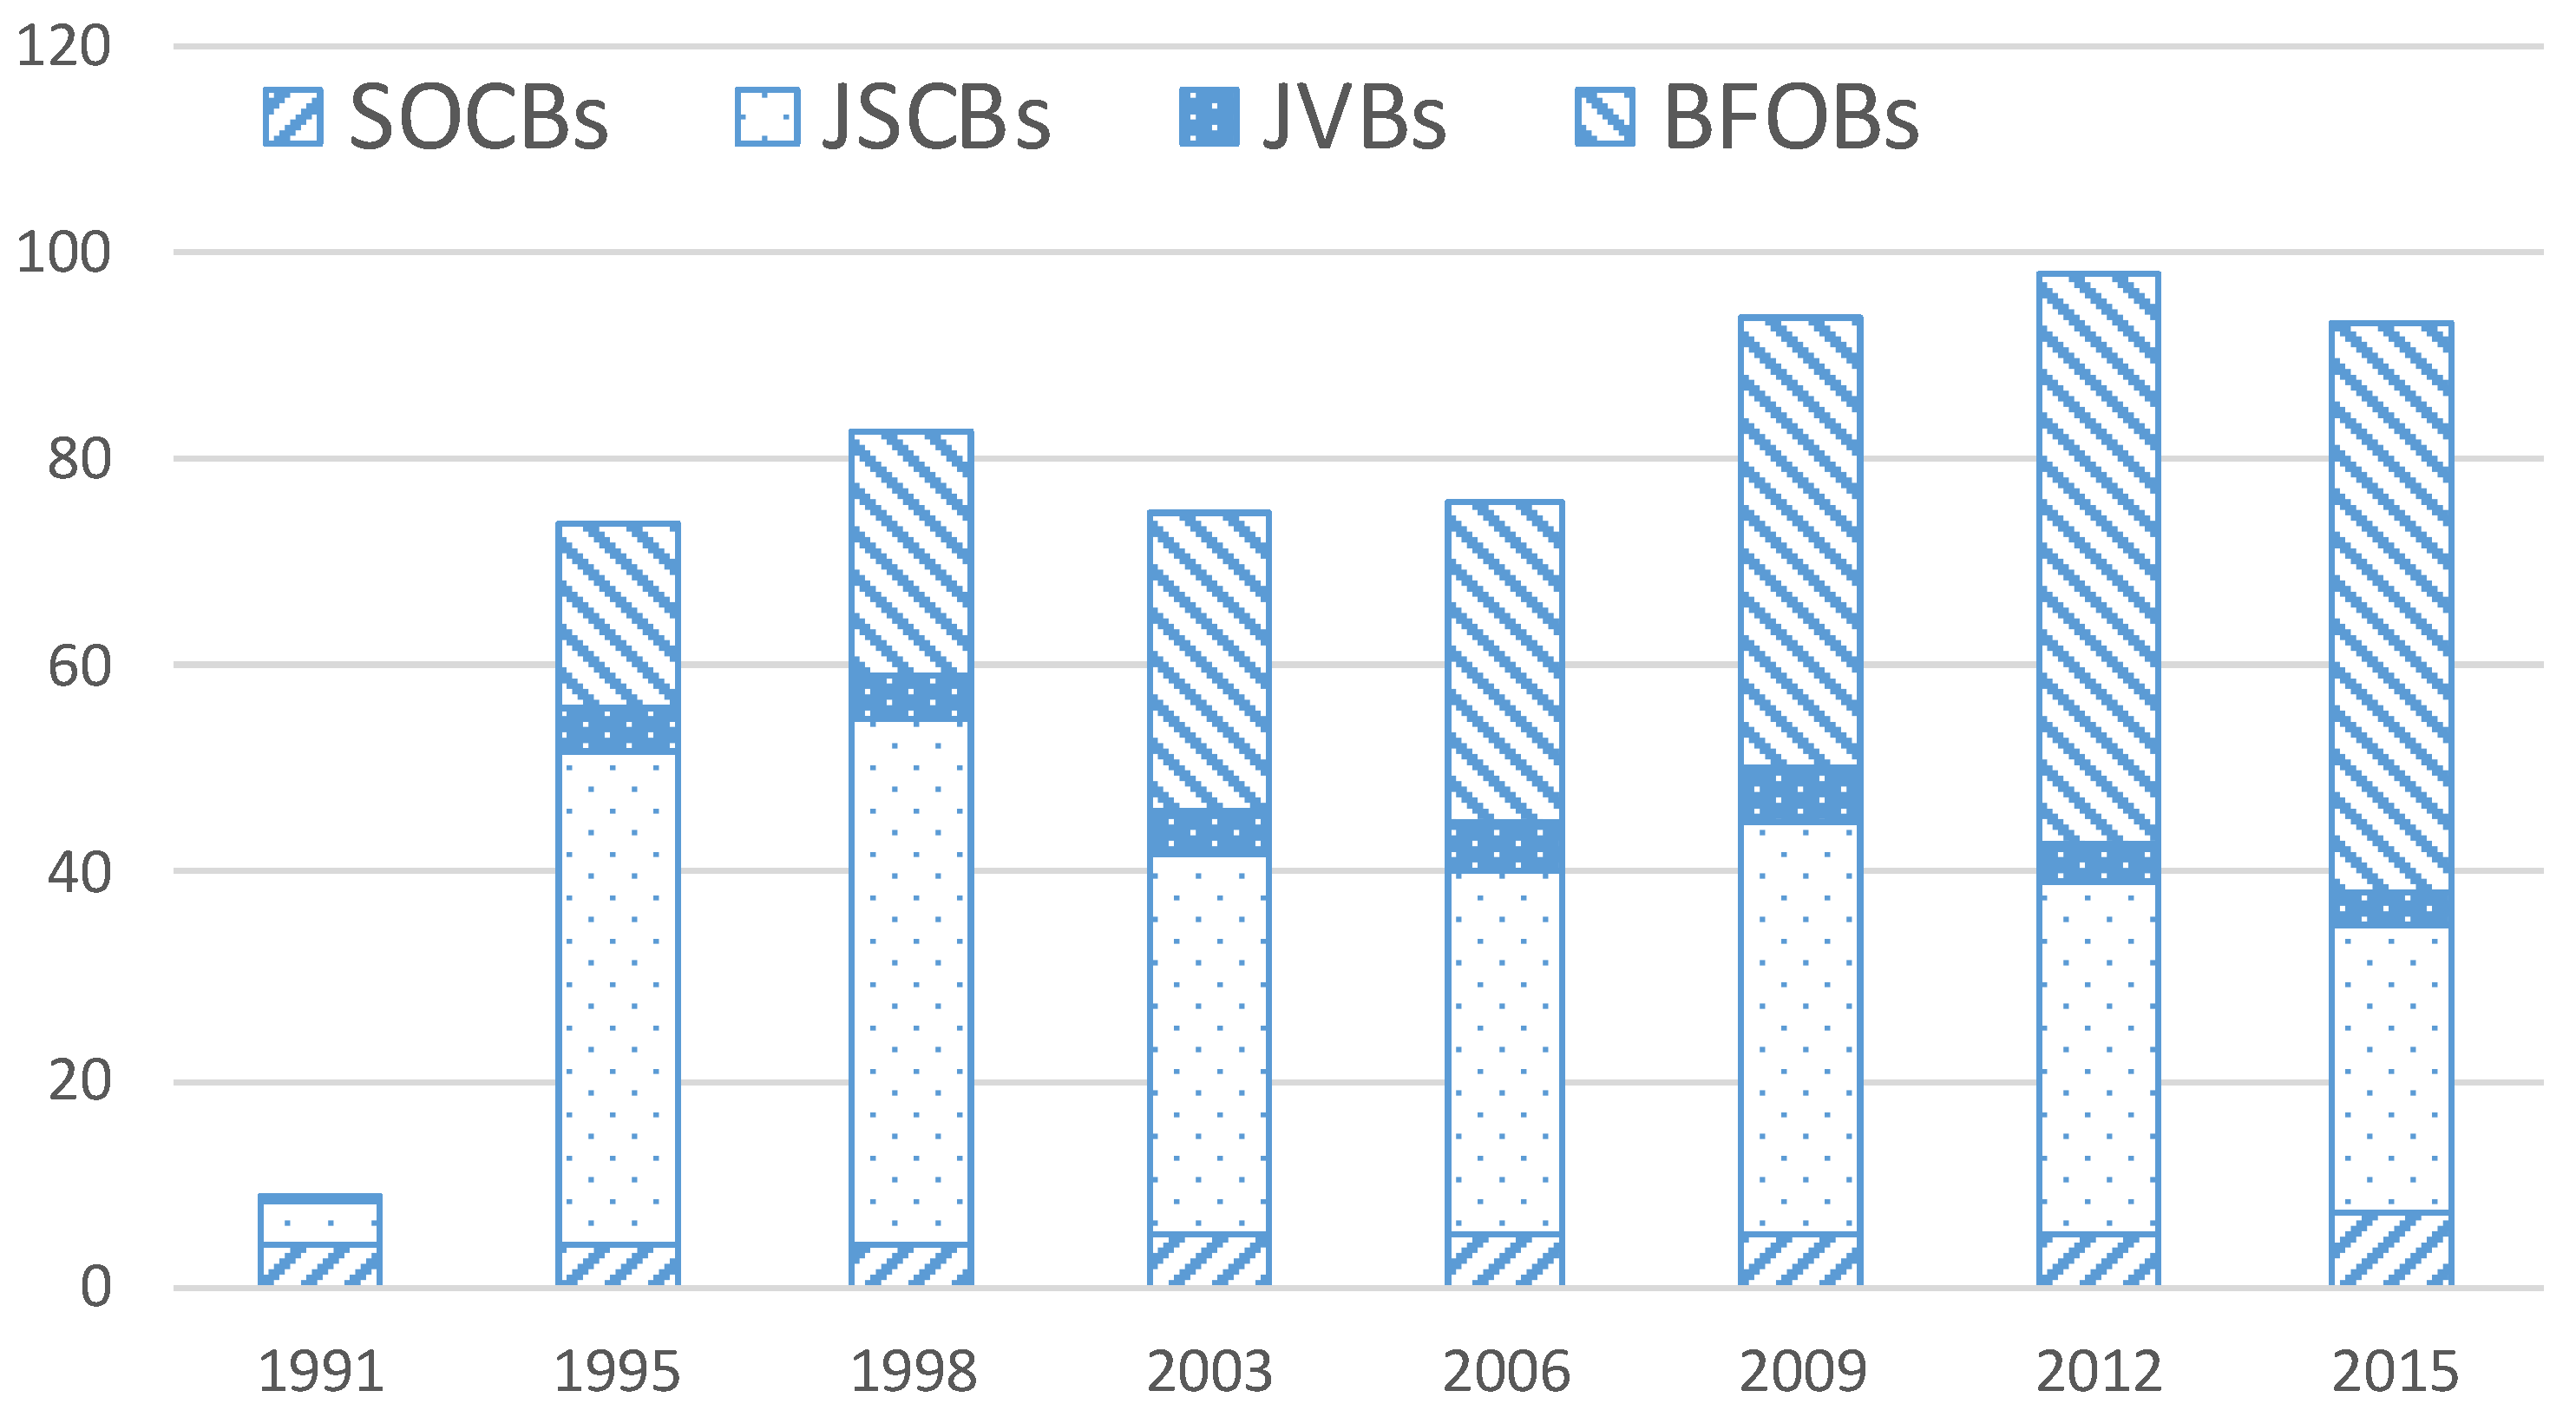
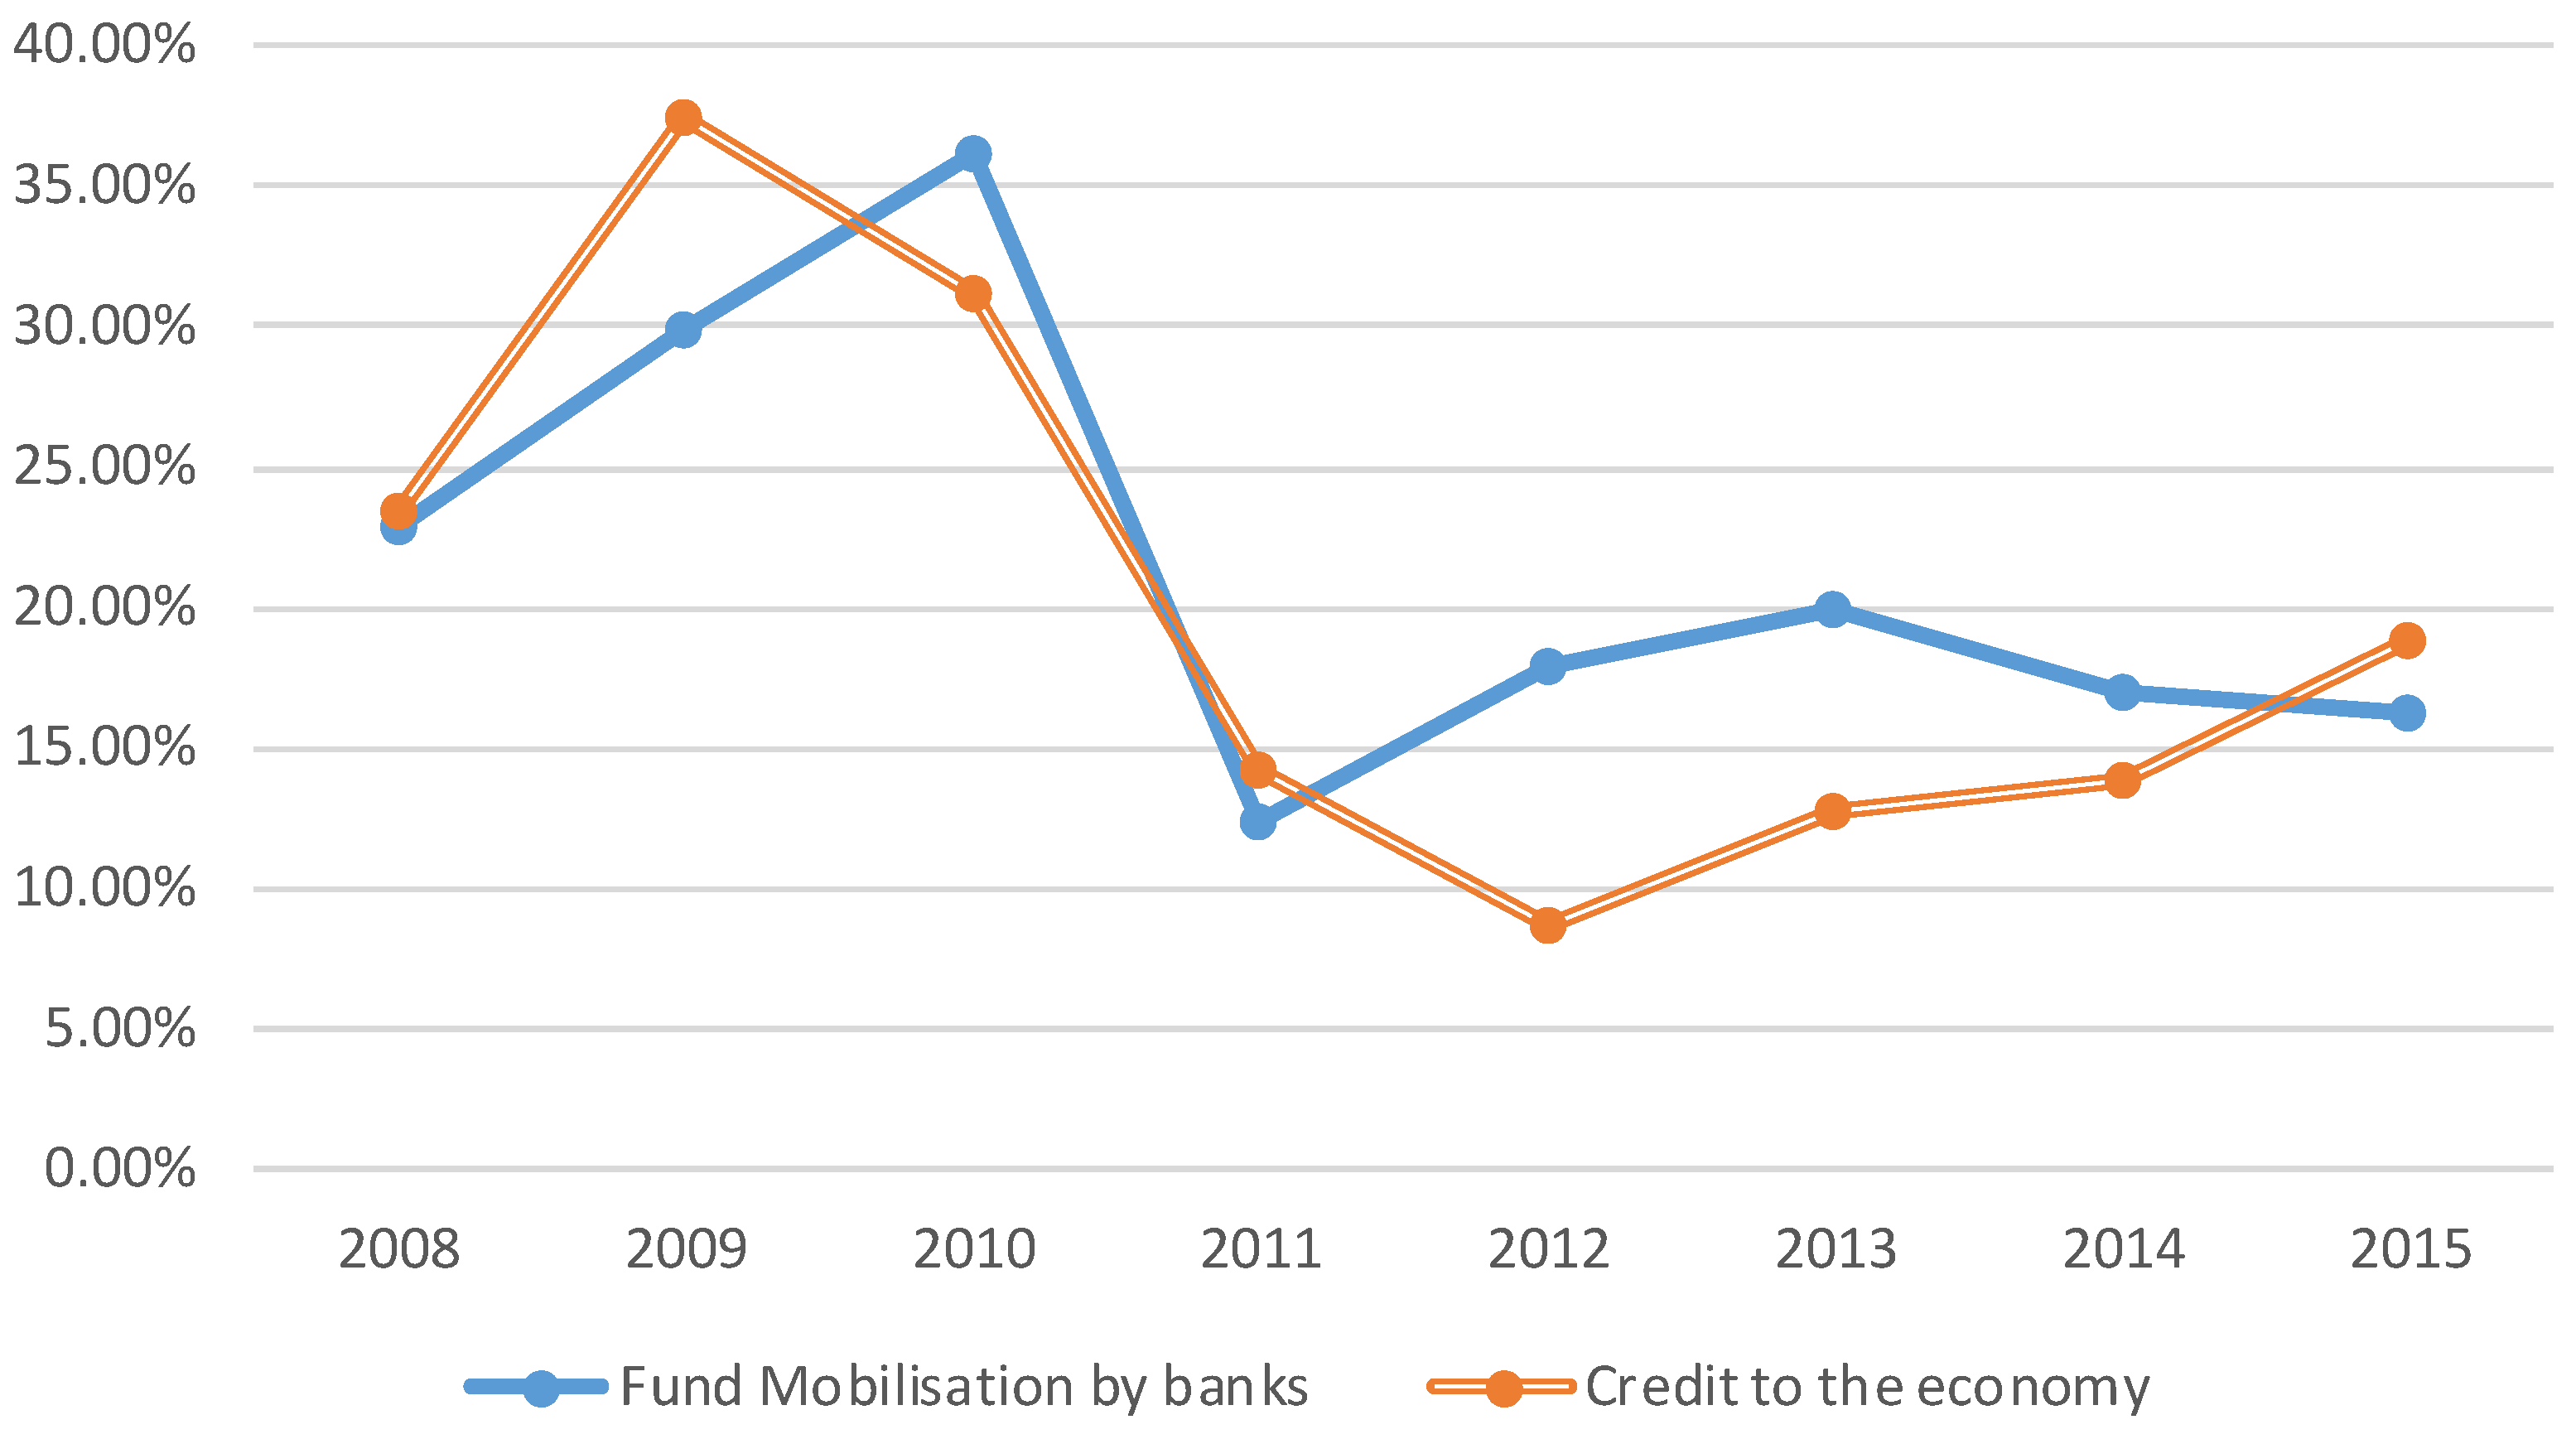
2. The Vietnamese Banking System and Its Efficiency

Since the transformation from a one-tier into two-tier system in 1990, the Vietnamese banking system has developed rapidly in terms of the number of banks, the size of the banking sector, the amount of banking activities, and transactions (Ngo 2012). However, impacts of the Asian Financial Crisis (AFC) of 1997 and the Global Financial Crisis (GFC) of 2008 put pressure on the Vietnamese banking system and thus required further renewals of banking operations.
Since 2011, the State Bank of Vietnam (SBV) has introduced many policies that have brought about fundamental changes and achieved positive results. In particular, the Credit Institution System Restructuring Plan was approved in March 2012 (Vietnamese Government 2012) to deal with bad debt and weak performance of the banking system. One important impact of this decision was the merger and acquisition of some joint stock commercial banks in the recent years, which caused concern about the efficiency of the operation of the banking system in Vietnam.
Figure 1 shows the changes in the number of commercial banks in Vietnam over the past 25 years. One can see that many banks were established in the first decade3, the restructure of the banking system after the AFC and the GFC.4
Figure 2 shows both fund mobilisation and utilisation (as a percentage of GDP), two basic activities of Vietnamese banks during the period 2008–2015. Both activities show downward trends overall, especially around 2011–2012, where Moody’s downgraded eight large banks in Vietnam (Global Credit Research 2012), although there was a gradual recovery at the end of the period with respect to credit activity. The fund mobilisation rates in Vietnamese banks rose from 22.84% in 2008 to 36.24% in 2010. This then plunged to a low of 12.4% in 2011, followed by moderate growth to 19.9% in 2013. Later, the rate of fund mobilisation declined progressively to 16.2% during the last two years of the 2008–2015 period. Meanwhile, the rate of bank credit for industry was almost equal to that of fund mobilisation in 2008 (23.38%). The figure hit a peak of 37.53% in 2009, followed by a sequential decrease, reaching its lowest point, at 8.75%, in 2012, when banks were reluctant to lend as a result of high NPLs (Tran et al. 2015) as well as the restrictive credit policies of the SBV (OECD 2013). The following three years saw a moderate recovery, reaching 18.8% in 2015.
The development of the Vietnamese banking industry and its performance has been examined by many studies, including market reports from international financial institutions (e.g., WB or IMF) as well as individual researchers (Ngo 2012; Ngo and Tripe 2017; Nguyen and Simioni 2015; Nguyen et al. 2016; Stewart et al. 2016). In particular, Stewart et al. (2016) revealed that, in Vietnam, small and medium-sized banks were less efficient than large and very large banks, and the small banks had the lowest efficiency ratings. This was supported by Ngo and Tripe (2017) and Nguyen et al. (2016) where they both found that SOCBs (which are large in size) were more (cost)-efficient than JSCBs (which are generally smaller). In terms of profit efficiency, findings from Vu and Nahm (2013) argued that Vietnamese banks operated well below the frontier in the 2000–2006 period mainly due to allocative inefficiency (of using labour, fixed assets, and deposits and other borrowed funds) rather than technical inefficiency. However, none of these studies has focused on the banks’ efficiency under the causal relationship between loans and deposits. Our study is therefore expected to be the very first empirical study on the particular relationship between the operational efficiency of bank loans and deposits, especially in the Vietnamese context.

3. Technical Aspects of the Study
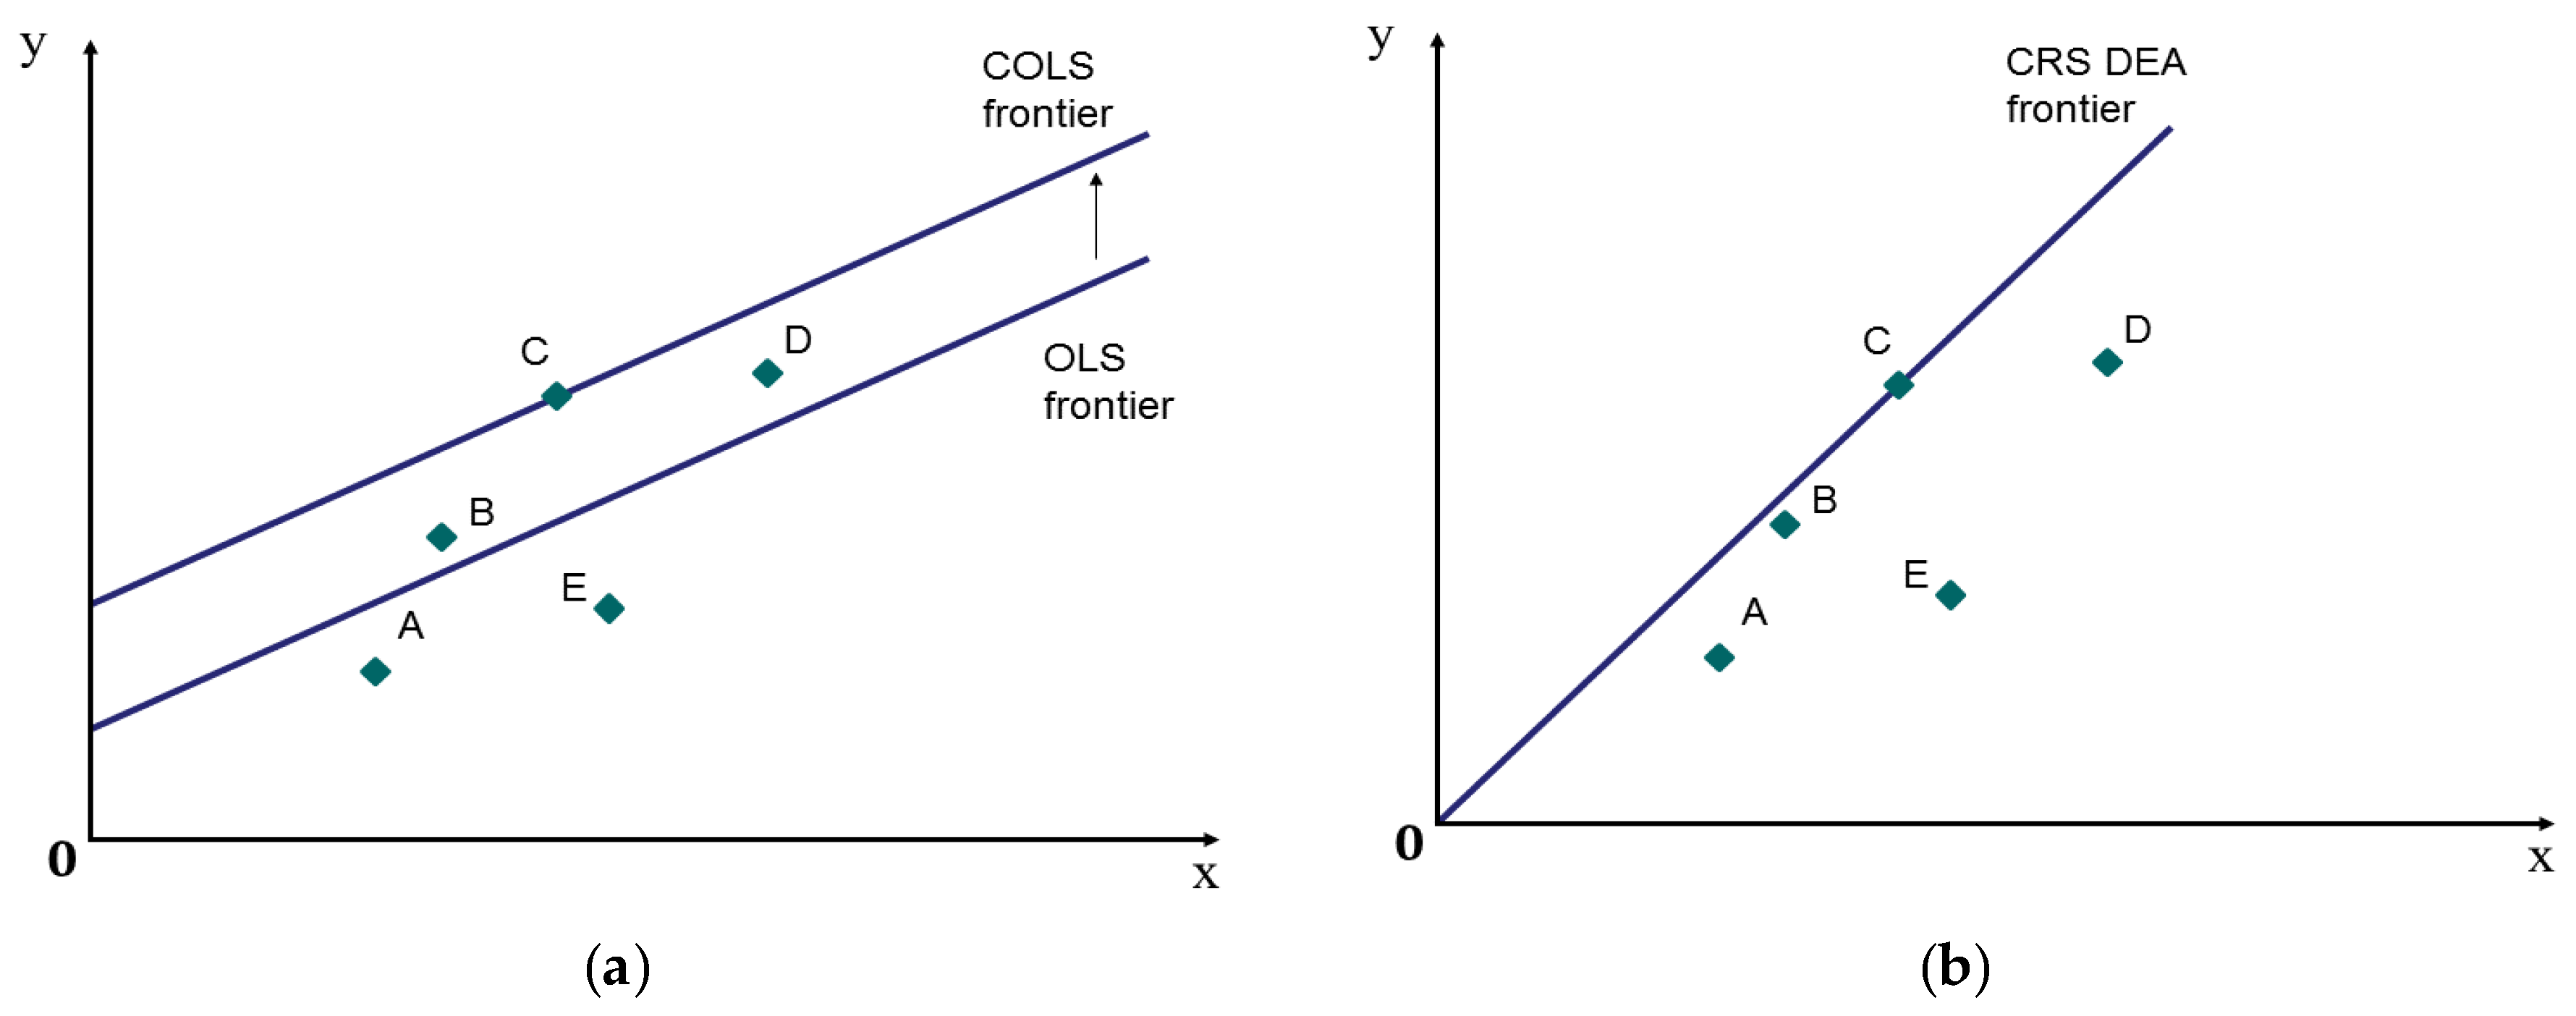
3.1. Methodology

According to Berger and Mester (1997) and Liu et al. (2013), data envelopment analysis (DEA), a nonparametric approach, and stochastic frontier analysis (SFA), a parametric approach, are the two most popular approaches for efficiency evaluation in the banking sector. Those two actually belong to the frontier analysis, where the firms that operate on the frontier are treated as efficient and the others are treated as inefficient, inspired by the idea of the production possibility frontier. The basic difference between DEA and SFA is that the former does not distinguish noise or errors from efficiency. In this sense, DEA is similar to the deterministic frontier model (DFM) of the parametric approach (Forsund and Hjalmarsson 1987), where one can use corrected ordinary least squares (COLS) to estimate the frontier and all deviations from the frontier will be classed as inefficient.
According to Greene (2008) and Kumbhakar et al. (2015), among others, output-oriented efficiency estimation of COLS starts by first obtaining the OLS frontier, and then shifts this frontier upward (or inward if input-oriented) to the extent that the function after the adjustment bounds all the observations below (or above, if input-oriented).5 Figure 3 below, adapted from Greene (2008), shows the difference between OLS and COLS frontiers for the output-oriented situation, whereas the COLS frontier envelops the sample at the best-practice observation (i.e., Point C), similar to DEA (under the constant-returns-to-scale (CRS) assumption). The only differences between CRS DEA and COLS are the intercepts (and thus the slope of the frontiers), which usually reveal nothing more than the units of measurement (Greene 2008).
Amsler et al. (2016) suggest that one needs to consider endogeneity when estimating the (OLS) frontier. This is in line with our discussion so far, as we expect to see a causal relationship between banks activities of fund mobilisation and utilisation. Consequently, we use a simultaneous equations model (SEM) to examine this issue for Vietnamese banks, because an SEM is able to provide a set of interrelated questions in a single, systematic, and comprehensive analysis (Gefen et al. 2000). We can thus model the relationship between the operational efficiency of bank loans and deposits simultaneously. To date, SEM has been applied in a great number of economic fields, particularly marketing and management, but not in efficiency analysis. Therefore, with the application of SEM to banking data, the authors offer a new approach to banking research.
Specifically, our SEM is constituted by the two following equations, each has a ceteris paribus interpretation.6 Three-stage least squares (3SLS) will be used to solve that SEM, as it can be more efficient than the two-stage least squares (2SLS) in terms of explaining interrelations among the error terms (Belsley 1988).
L O A N = α 0 + α 1 D E P O S I T + β 1 Z 1 + ε 1
D E P O S I T = α 2 + α 3 L O A N + β 2 Z 2 + ε 2
where:
  • L O A N : the logarithmic value of the loans utilised by the bank;
  • D E P O S I T : the logarithmic value of the deposits mobilised by the bank;
  • Z 1 : a set of exogenous instrumental variables in Equation (1);
  • Z 2 : a set of exogenous instrumental variables in Equation (2);
  • ε 1 and ε 2   : the residuals, which then will be used to estimate the inefficiency of the two activities in the next step.
At this stage, we can obtain the estimated zero-mean OLS residuals as
ε ^ 1 = L O A N [ α 0 + α 1 D E P O S I T + β 1 Z 1 ]
ε ^ 2 = D E P O S I T [ α 2 + α 3 L O A N + β 2 Z 2 ] .
Here, the value of ε ^ 1 and ε ^ 2 can be less than, equal to, or greater than zero.
After the efficient frontiers for the two activities are estimated, COLS will adjust them upward (as we follow an output-oriented approach).7 Accordingly, the residuals are also adjusted to be
u 1 = ε ^ 1 m a x { ε ^ 1 } 0
u 2 = ε ^ 2 m a x { ε ^ 2 } 0
and
E F 1 = exp ( u 1 )
E F 2 = exp ( u 2 )
where E F 1 is the technical efficiency of fund utilisation activities, and E F 2 is the technical efficiency of fund mobilisation activities.

3.2. Data

Our research employs the pooled cross-sectional sample data of 43 banks domiciled and operated in Vietnam (please see Appendix for a listing of those banks) during the 2008–2015 period (totaling 289 observations), extracted from the Vietnamese banking database (Ngo and Le 2017). All data is calculated in VND and deflated using the Consumer Price Index (CPI) extracted from the World Bank Database, where 2010 is chosen as the base year. There might be differences between the accounting principles and standards of the banks, namely the Vietnamese Accounting Standards (VASs) and the International Financial Reporting Standards (IFRSs), but those differences are not important to our analysis, especially as VASs had begun to adopt IFRSs since 2001 (Ngo and Tripe 2017). A summary on the number and types of banks covered in this research is presented in Table 1 below, where the number of banks varied from 23 to 43 each year, supporting the use of a pooled cross-sectional analysis. Overall, our sample covers a set of up to seven SOCBs and up to another 33 JSCBs.8
As discussed in the previous section, besides the two variables LOAN and DEPOSIT, we also examine the effect of some instrumental variables (IVs) on the efficiency of the two basic activities as Z 1 and Z 2 in our SEM. Accordingly, we control for total assets (TA), the ratio of loans to customers to total assets (LOA), the ratio of deposits from customers to total liabilities (DOL), the number of branches a bank has (BRANCH), the ratio of deposits and borrowings from other credit institutions to total liabilities (ILL), the lending rate (LR), the unemployment rate (UNEMP), and the type of the bank (TYPE, a dummy variable that is 1 if the bank is an SOCB; otherwise, it is zero). The descriptive statistics are presented in Table 2 below. The correlation between the variables are low, except for LOAN, DEPOSIT, and TA. This is common in the banking literature and further emphasises the endogeneity issue that needs to be avoided by using SEM.

4. Results and Discussions

4.1. SEM Analysis

The estimation of the SEM in Equations (1) and (2) above requires some endogenous variables. We argue that, because DOL appears only in Equation (2) and LOA enters only in Equation (1), the only two equations of our SEM are identified. In this sense, DOL and LOA are instrumental variables (IVs) for DEPOSIT and LOAN, respectively; the rest of the variables in Z 1 and Z 2 can be used as control variables. We first report OLS results for the reduced forms of the above equations to detect strong IVs for the two endogenous variables LOAN and DEPOSIT. In particular, we used the Cragg–Donald test to check if DOL is truly an IV for DEPOSIT, and if LOA is truly an IV for LOAN. The tests generated F-statistics of 563.301 and 635.596, respectively, and since these are greater than 10, we can argue that they are appropriately identified as endogenous variables in our SEM.
In addition, we also employed the Durbin–Wu–Hausman test for the exogenous characteristics of the other explanatory variables (e.g., TA, BRANCH, or UNEMP). All tests ended up with J-statistics smaller than zero: thus, we cannot reject the null hypothesis that those variables are exogenous to the dependent ones, i.e., LOAN and DEPOSIT. Consequently, we argue that our SEM is justified, and its results are consistent and unbiased.
Our SEM in Equations (1) and (2) were consequently estimated by 3SLS, and the results are presented in Table 3. As discussed, we argue that our SEM results have accounted for the causal relationship between bank loans and deposits and that the findings reveal the operational efficiency of Vietnamese banks’ fund mobilisation and utilisation activities simultaneously.
In particular, by examining this causality, we identify the positive and significant impact that DEPOSIT has on LOAN (see Panel A of Table 3), whereas the impact of LOAN on DEPOSIT is negative (and small) but insignificant (Panel B of Table 3). Theoretically, one can argue that, on a system-wide basis, loans come back to the banking system as deposits. What we do not know, however, is how this affects the loans and deposits of individual banks. In the Vietnamese context, we assume that the flow of loans back to the banks is asymmetric between individual banks (i.e., large banks may get more of the loans back in as deposits, compared to smaller banks)—as can be seen with the variable TA in Table 3. We also argue that in Vietnam savers put money in banks not only because the banks are efficient but due to other factors such as safety or their beliefs (e.g., that the SOCBs will not be merged or bankrupted), hence the negative impact of TYPE on LOAN is not significant. It thus suggests that further studies with larger or different datasets (e.g., for other advanced economies) are needed to examine this situation.
In terms of the impacts of IVs on fund utilisation activities of the banks, i.e., Panel A of Table 3, we can see that except for TYPE and UNEMP, other independent variables of this equation are positive and statistically significant. This suggests that increasing those factors can help Vietnamese banks provide more loans to the market. For example, adding one more point of deposit or one more point of assets can increase the amount of loans by 0.208 and 0.765 percentage points, respectively. In contrast, the second part of Table 3 suggests that all independent variables have a significant impact on bank deposits, except for bank loans. Interestingly, in this part, TYPE and UNEMP negatively affect deposit at a 1% level of significance, indicating a different story about the fund mobilisation activities of Vietnamese banks. In particular, SOCBs tend to attract less deposits compared to other types of banks, which confirms the argument that private banks are more flexible and more competitive than state-owned banks (Ariff and Luc 2008; Bonin et al. 2005a, 2005b). They can therefore be more attractive to savers. In addition, the unemployment rate has an explanatory power for deposits, but not for loans, because an individual who has lost his job would reduce his/her deposits into a bank.

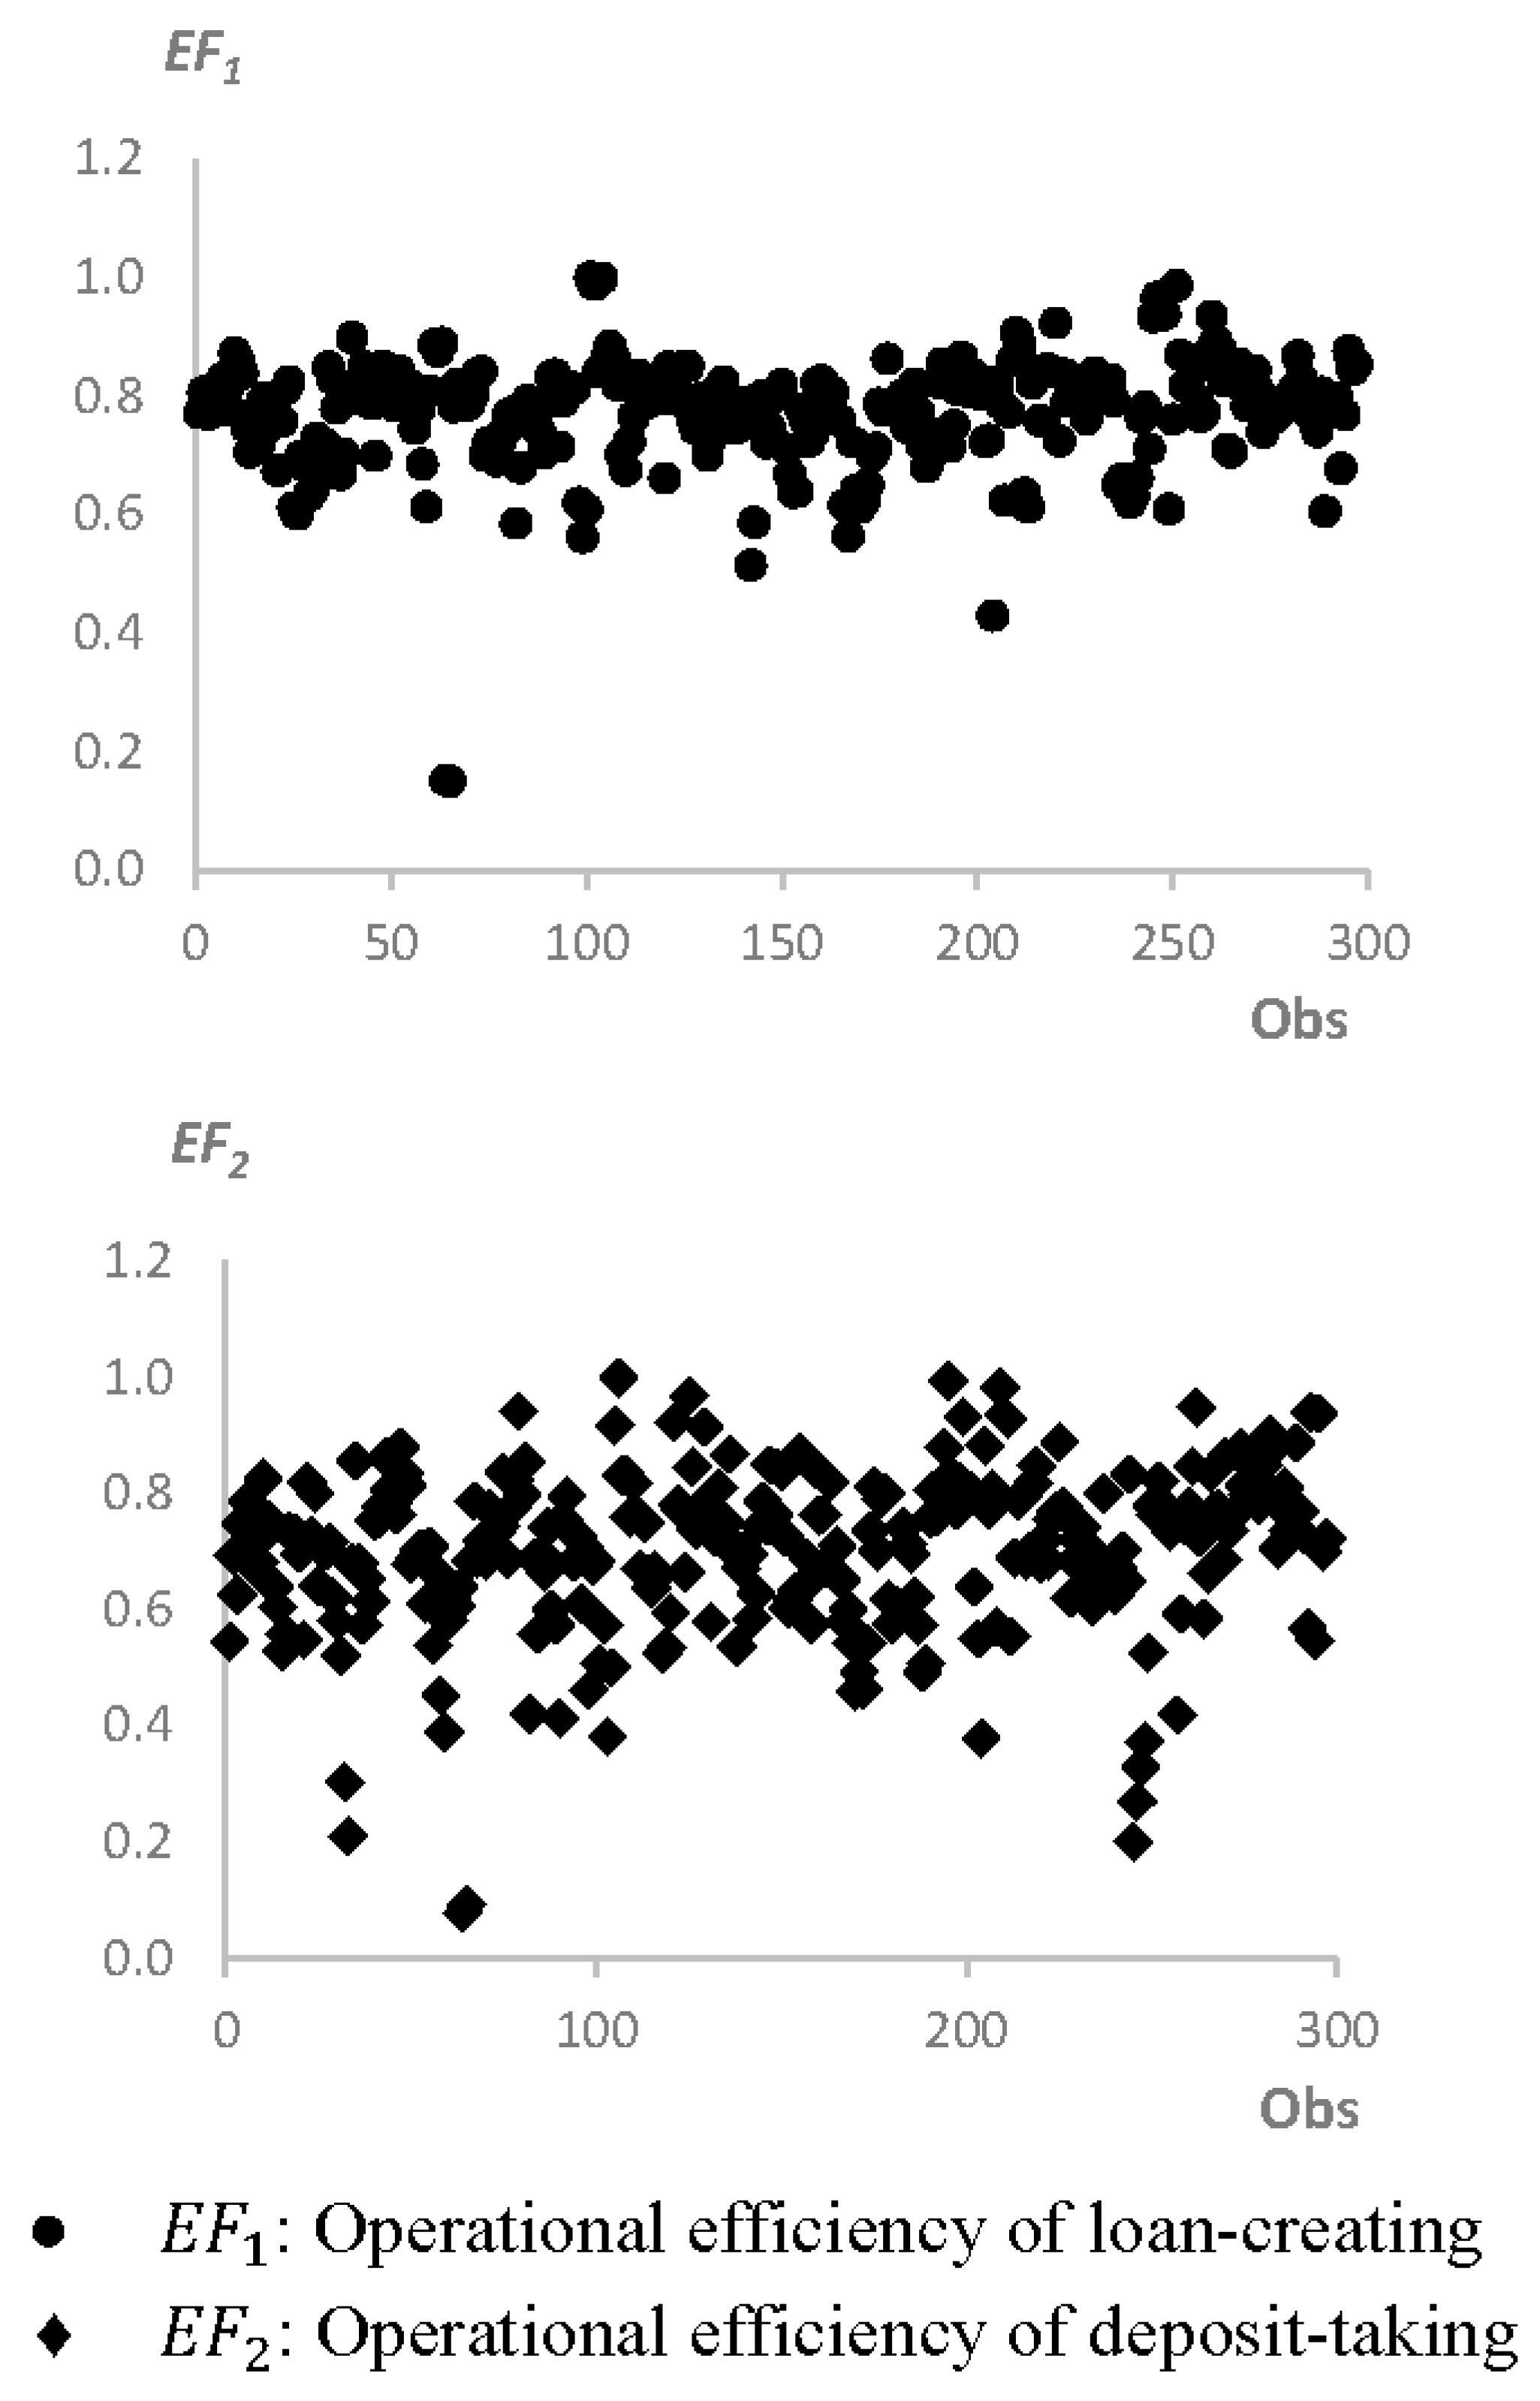
4.2. Efficiency Analysis Using COLS

In this section, we first report the overall view on operational efficiency of 289 Vietnamese bank-observations in terms of mobilizing and utilizing funds in the 2008–2015 period. Figure 4 suggests that Vietnamese banks are more competitive in lending activities than in deposit-taking activities, as observations on E F 1 are more concentrated than those of E F 2 . Additionally, the median score for E F 1 is 0.789, higher than for E F 2 (0.720). Accordingly, we conclude that, over the 2008–2015 period, Vietnamese banks performed moderately well in terms of the two activities, with the lending activities focused more than deposit-taking activities. We argue that this might result from the Credit Institution System Restructuring Plan and the establishment of VAMC, since banks were required to manage their credit risks. Nevertheless, there is still room for those banks to improve their efficiency.
When examined over time, the picture on operational efficiency of Vietnamese banks is clearer. Particularly, we can see that the yearly-average efficiency of loan-creating activities of Vietnamese banks increased during the period examined (the dotted trend line in Figure 5); whereas the yearly-average efficiency of deposit-taking activities decreased (the dashed trend line in Figure 5). While the former shows a good signal, the latter reveals an issue for the Vietnamese banking system. Specifically, as discussed in the previous section, in the Vietnamese banking system, deposits have a positive impact on loans, while the impact of loans on deposits is not significant. In other words, the contribution of the higher efficiency of loan-creating activities to the banks is not clear, but the decrease in efficiency of deposit-taking activities will hinder the banks’ lending and thus negatively impact the whole banking system. Therefore, we suggest that, while trying to maintain the positive trend on loan-creating activities, Vietnamese banks should start to focus more on deposit-taking activities.

5. Conclusions

In this paper, we examine the causal relationship between bank loans and deposits in the Vietnamese banking system. Data collected from the annual reports of 44 Vietnamese banks over an eight-year period from 2008 to 2015 is utilised to examine the hypotheses developed in the study. The relationship between bank loans and deposits is significant in the one-way relationship, indicating that deposits have an impact on loans. This also highlights that, in terms of limited funding sources for loans as in Vietnam, banks deposits are crucial. The reverse effect of loans on deposits is not significant, which could be because customers make deposits with a bank in Vietnam not because of the bank’s efficiency but due to other factors such as safety or particular beliefs (e.g., that the SOCBs will not be merged or bankrupted). Thus, further studies with a larger dataset or with different datasets (e.g., of other advanced economies) are needed to confirm this finding. Subject to the availability of suitable data, it would also be interesting to apply the liquidity creation measures pioneered by Berger and Bouwman (2009) to the Vietnamese market.
We also investigated the efficiency in the use of loans and deposits by those Vietnamese banks. Employing the COLS approach, we found Vietnamese banks performed moderately well in terms of deposit-taking and loan-creating activities, although there is still room for those banks to improve. Combined with an assessment of efficiency changes over time, we suggest that, though Vietnamese banks are trying to keep a good trend in loans-creating activities, they should start to focus more on deposit-taking activities.
As a first study on the relationship between loans and deposits, as well as on the efficiency of using loans and deposits in the Vietnamese banking system, this study, however, still experienced certain difficulties that limit its research scope. These limitations include the challenges in collecting data from banks with foreign ownership, which led to the small data sample (only 297 observations). The short sample period, from 2008 to 2015 only, does not allow us to examine the impact of the global financial crisis on Vietnamese banks. Future research on this topic, specifically through increasing the sample data in respect to both size and time period covered is, therefore, recommended. In addition, more in-depth study on the efficiency of using loans and deposits based upon other factors such as customer behaviour is also suggested.

Acknowledgments

David Tripe acknowledges the support of the Czech Science Foundation (Project No. GA 17-02509S).

Author Contributions

This paper based on Tram Nguyen’s master thesis at the School of Economics & Finance, Massey University. Thanh Ngo updated the data, revised the empirical model as well as the accordance discussions. David Tripe provided important suggestions and tidy up the work.

Conflicts of Interest

The authors declare no conflict of interest.

Appendix A

Table A1. Vietnamese banks included in the study.
No.Bank’s NameNo.Bank’s Name
1An Binh Commercial Joint Stock Bank23Orient Commercial Joint Stock Bank
2Asia Commercial Joint Stock Bank24Petrolimex Group Commercial Joint Stock Bank
3Bao Viet Joint Stock Commercial Bank25Saigon—Hanoi Commercial Joint Stock Bank
4Construction Bank (former name: Trustbank)26Saigon Bank for Industry & Trade
5DongA Joint Stock Commercial Bank27Saigon Commercial Bank
6First Joint Stock Commercial Bank28Saigon Thuong Tin Commercial Joint Stock Bank
7Global Petro Commercial Joint Stock Bank29South East Asia Joint Stock Commercial Bank
8Great Asia Commercial Joint Stock Bank30Southern Commercial Joint Stock Bank
9Hanoi Building Commercial Joint Stock Bank31TienPhong Commercial Joint Stock Bank
10Ho Chi Minh City Development Joint Stock Commercial Bank32Viet A Joint Stock Commercial Bank
11HSBC Bank (Vietnam) Limited33Viet Capital Commercial Joint Stock Bank
12Indovina Bank Ltd.34Viet Nam Technological and Commercial Joint Stock Bank
13Joint Stock Commercial Bank for Foreign Trade of Vietnam35Vietnam Bank for Agriculture and Rural Development
14Joint Stock Commercial Bank for Investment and Development of Vietnam36Vietnam Bank for Social Policies
15Kienlong Commercial Joint Stock Bank37Vietnam Commercial Joint Stock Bank for Private Enterprise
16Lien Viet Post Joint Stock Commercial Bank38Vietnam Export Import Commercial Joint Stock Bank
17Mekong Development Joint Stock Commercial Bank39Vietnam International Commercial Joint Stock Bank
18Mekong Housing Bank40Vietnam Joint Stock Commercial Bank of Industry and Trade
19Military Commercial Joint Stock Bank41Vietnam Maritime Commercial Joint Stock Bank
20Nam A Commercial Joint Stock Bank42VietNam Tin Nghia Commercial Joint Stock Bank
21National Citizen Bank43Western Commercial Joint Stock Bank
22Ocean Commercial One Member Limited Liability Bank44Vietnam Public Joint Stock Commercial Bank

References

  1. Amsler, C., A. Prokhorov, and P. Schmidt. 2016. Endogeneity in schotastic frontier models. Journal of Econometrics 190: 280–88. [Google Scholar] [CrossRef]
  2. Ariff, Mohamed, and Can Luc. 2008. Cost and profit efficiency of Chinese banks: A non-parametric analysis. China Economic Review 19: 260–73. [Google Scholar] [CrossRef]
  3. Assaf, A. George, Carlos P. Barros, and Roman Matousek. 2011. Productivity and efficiency analysis of Shinkin banks: Evidence from bootstrap and Bayesian approaches. Journal of Banking & Finance 35: 331–42. [Google Scholar]
  4. Belsley, David A. 1988. Two-or three-stage least squares? Computer Science in Economics and Management 1: 21–30. [Google Scholar] [CrossRef]
  5. Berger, Allen N., and Christa H. S. Bouwman. 2009. Bank Liquidity Creation. The Review of Financial Studies 22: 3779–837. [Google Scholar] [CrossRef]
  6. Berger, Allen N., and David B. Humphrey. 1997. Efficiency of financial institutions: International survey and directions for future research. European Journal of Operational Research 98: 175–212. [Google Scholar] [CrossRef]
  7. Berger, Allen N., and Loretta J. Mester. 1997. Inside the black box: What explains differences in the efficiencies of financial institutions? Journal of Banking & Finance 21: 895–947. [Google Scholar]
  8. Berger, Allen N., Diana Hancock, and David B. Humphrey. 1993. Bank efficiency derived from the profit function. Journal of Banking and Finance 17: 317–47. [Google Scholar] [CrossRef]
  9. Bonin, John P., Iftekhar Hasan, and Paul Wachtel. 2005a. Bank performance, efficiency and ownership in transition countries. Journal of Banking & Finance 29: 31–53. [Google Scholar]
  10. Bonin, John P., Iftekhar Hasan, and Paul Wachtel. 2005b. Privatisation matters: Bank efficiency in transition countries. Journal of Banking & Finance 29: 2155–78. [Google Scholar]
  11. Corradi, Valentina, Marzio Galeotti, and Riccardo Rovelli. 1990. A cointegration analysis of the relationship between bank reserves, deposits and loans: The case of Italy, 1965–1987. Journal of Banking & Finance 14: 199–214. [Google Scholar]
  12. Dermine, Jean. 1986. Deposit rates, credit rates and bank capital. Journal of Banking & Finance 10: 99–114. [Google Scholar] [CrossRef]
  13. Fama, Eugene F. 1980. Banking in the theory of finance. Journal of Monetary Economics 6: 39–57. [Google Scholar] [CrossRef]
  14. Favero, Carlo A., and Luca Papi. 1995. Technical efficiency and scale efficiency in the Italian banking sector: A non-parametric approach. Applied Economics 27: 385–95. [Google Scholar] [CrossRef]
  15. Forsund, Finn R., and Lennart Hjalmarsson. 1987. Analyses of Industrial Structure: A Putty Clay Approach. Stockholm: Almqvist & Wiksell. [Google Scholar]
  16. Fujii, Hidemichi, Shunsuke Managi, and Roman Matousek. 2014. Indian bank efficiency and productivity changes with undesirable outputs: A disaggregated approach. Journal of Banking & Finance 38: 41–50. [Google Scholar]
  17. Gefen, David, Detmar Straub, and Marie-Claude Boudreau. 2000. Structural equation modeling and regression: Guidelines for research practice. Communications of the Association for Information Systems 4: 1–78. [Google Scholar]
  18. Global Credit Research. 2012. Rating Action: Moody’s Downgrades Eight Vietnamese Banks. Available online: https://www.moodys.com/research/Moodys-downgrades-eight-Vietnamese-banks--PR_255975 (accessed on 10 November 2017).
  19. Greene, William H. 2008. The econometric approach to efficiency measurement. In The Measurement of Productive Efficiency and Productivity Growth. Edited by Harold O. Fried, C. A. Knox Lovell and Shelton S. Schmidt. New York: Oxford University Press, pp. 92–250. [Google Scholar]
  20. IMF. 2009. The Implications of the Global Financial Crisis for Low-Income Countries. Washington: International Monetary Fund. [Google Scholar]
  21. Kashyap, Anil K., Raghuram Rajan, and Jeremy C. Stein. 2002. Banks as Liquidity Providers: An Explanation for the Coexistence of Lending and Deposit-taking. The Journal of Finance 57: 33–73. [Google Scholar] [CrossRef]
  22. Klein, Michael A. 1971. A Theory of the Banking Firm. Journal of Money, Credit and Banking 3: 205–18. [Google Scholar] [CrossRef]
  23. Kumbhakar, Subal C., Hongren Wang, and Alan P. Horncastle. 2015. A Practioner’s Guide to Stochastic Frontier Analysis Using Stata. New York: Cambridge University Press. [Google Scholar]
  24. Liu, John S., Louis Y. Y. Lu, Wen-Min Lu, and Bruce J. Y. Lin. 2013. A survey of DEA applications. OMEGA 41: 893–902. [Google Scholar] [CrossRef]
  25. Monti, Mario. 1972. Deposit, credit and interest rate determination under alternative bank objective functions. In Mathematical Methods in Investment and Finance. Edited by Karl Shell and G. P. Szegö. Amsterdam: North-Holland, pp. 431–54. [Google Scholar]
  26. Ngo, Thanh. 2012. Measuring performance of the banking system: Case of Vietnam (1990–2010). Journal of Applied Finance & Banking 2: 289–312. [Google Scholar]
  27. Ngo, Thanh. 2015. Efficiency of the Banking System in Vietnam under Financial Liberalisation. Ph.D. thesis, Massey University, Palmerston North, New Zealand. [Google Scholar]
  28. Ngo, Thanh, and Tu Le. 2017. Resource for Research: A Vietnamese Banking Database. SSRN eLibrary 14: 1–14. [Google Scholar]
  29. Ngo, Thanh, and David Tripe. 2017. Measuring efficiency of Vietnamese banks: Accounting for nonperforming loans in a single-step stochastic cost frontier analysis. Pacific Accounting Review 29: 171–82. [Google Scholar] [CrossRef]
  30. Nguyen, Phuong Anh, and Michel Simioni. 2015. Productivity and efficiency of Vietnamese banking system: New evidence using Färe-Primont index analysis. Applied Economics 47: 4395–407. [Google Scholar] [CrossRef]
  31. Nguyen, Thanh Pham Thien, Son Hong Nghiem, Eduardo Roca, and Parmendra Sharma. 2016. Bank reforms and efficiency in Vietnamese banks: Evidence based on SFA and DEA. Applied Economics 48: 2822–35. [Google Scholar] [CrossRef]
  32. OECD. 2013. Economic Outlook for Southeast Asia, China and India 2014. Paris: OECD Publishing. [Google Scholar]
  33. SBV. 2017. The State Bank of Vietnam—System of Credit Institutions. Available online: https://www.sbv.gov.vn/webcenter/portal/en/home/fm/socins?_afrLoop=403098344475000#%40%3F_afrLoop%3D403098344475000%26centerWidth%3D80%2525%26leftWidth%3D20%2525%26rightWidth%3D0%2525%26showFooter%3Dfalse%26showHeader%3Dfalse%26_adf.ctrl-state%3D19iilj0m1q_244 (accessed on 10 November 2017).
  34. Sealey, Calvin W., and James T. Lindley. 1977. Inputs, outputs, and a theory of production and cost at depository financial institutions. The Journal of Finance 32: 1251–66. [Google Scholar] [CrossRef]
  35. Stewart, Chris, Roman Matousek, and Thao Ngoc Nguyen. 2016. Efficiency in the Vietnamese banking system: A DEA double bootstrap approach. Research in International Business and Finance 36: 96–111. [Google Scholar] [CrossRef]
  36. Tran, Bao Tran, Bernice Ong, and Scott Weldon. 2015. Vietnam Banking Industry Report. Singapore: Duxton Asset Management. [Google Scholar]
  37. Vietnamese Government. 2012. Decision No. 254/QD-TTg on Approving the Scheme on “Restructuring the Credit Institutions System in the 2011–2015 Period”. Available online: http://www.lawfirm.vn/?a=doc&id=2530 (accessed on 10 November 2017).
  38. Vu, Ha, and Daehoon Nahm. 2013. The determinants of profit efficiency of banks in Vietnam. Journal of the Asia Pacific Economy 18: 615–31. [Google Scholar] [CrossRef]
  39. Wooldridge, Jeffrey M. 2016. Introductory Econometrics: A Modern Approach, 6th ed. Boston: Cengage Learning. [Google Scholar]
1
It is arguable that deposits can also be seen as an output of the bank (Berger and Humphrey 1997); however, the more common view is to see them as inputs, as opposed to loans, which are outputs.
2
There is also a ‘production approach’ where banks are seen as a production unit which primarily producing services for account holders (Berger and Humphrey 1997), but it is less common than the ‘intermediation approach’ used in this paper, since banks are commonly seen as the intermediaries in the process by which the economy chooses its activities and the way those activities are financed (Fama 1980). Readers interested in alternative approaches are encouraged to check the study of Favero and Papi (1995), among others.
3
After the Vietnam War, Vietnam re-joined IMF, WB and ADB in October 1993. In February 1994, the US removed its sanctions on Vietnam.
4
It is argued that effects of regional and global crisis on the Vietnamese banks were lagged due to the lack of cross-border linkages between the domestic banking system and the regional/global counterpart (Ngo 2015), which is also found in other developing countries (IMF 2009).
5
The idea of shifting the OLS frontier upward or inward is to match it with the production possibility frontier.
6
For simplicity, we omit the subscript “i” for bank and “t” for year.
7
In this sense, we argue that the aim of Vietnamese banks is to maximize the amount of funds mobilized from savers as well as the amount of funds utilized for borrowers.
8
The total assets of the seven state-owned commercial banks, as of September 2016, were VND 3,690,463 billion, and accounted for 45% of the total assets of the Vietnamese banking sector (SBV 2017). Although our panel is not perfectly balanced, the gaps in our observations are relatively few, hence we consider it valid to compare performance between years (even though the composition of the cross sections are not exactly identical).
Figure 1. Number of Vietnamese banks over time. Notes: SOCBs: State-Owned Commercial Banks; JSCBs: Joint Stock Commercial Banks; JVBs: Joint Venture Banks; BFOBs: Branches of Foreign-Owned Banks (also include Fully Owned Foreign Banks after 2007). Source: SBV.
Ijfs 06 00014 g001
Figure 2. Fund mobilisation and utilisation of Vietnamese banks, 2008–2015. Source: SBV.
Ijfs 06 00014 g002
Figure 3. Similarity between COLS and CRS DEA. (a) COLS frontier; (b) DEA frontier. Source: Adapt from Greene (2008, Figure 2.3, p. 106).
Ijfs 06 00014 g003
Figure 4. Results of SEM: overview.
Ijfs 06 00014 g004
Figure 5. Results of SEM: average operational efficiency over time.
Ijfs 06 00014 g005
Table 1. Number of banks tested every year during the period 2008–2015.
YearNumber of BanksSOCBsSPBsJSCBsJVBsBFOBs
200840613210
200943713311
201043713311
201138603011
201235502811
201333502710
201430402510
201527302310
Notes: SOCBs: State-Owned Commercial Banks; SPBs: State Policy Banks; JSCBs: Joint Stock Commercial Banks; JVBs: Joint Venture Banks; and BFOBs: Branches of Foreign-Owned Banks (also includes Fully Owned Foreign Banks after 2007). Source: Authors’ calculation.
Table 2. Descriptive statistics of the variables.
VariableObsMeanMedianMaximumMinimumStd. Dev.
LOAN28912.338812.180115.77778.07421.3631
DEPOSIT28912.388912.448915.51398.68001.4466
TA28913.066113.106116.21699.75491.2915
LR28912.184513.135316.95387.11753.1409
DOL2890.64100.67010.98290.01380.1835
UNEMP2892.27392.30002.60001.80000.2704
ILL2890.21930.21130.76080.00000.1409
BRANCH289163988199689016258
LOA2890.51720.51100.97730.01160.1605
TYPE2890.12460100.3308
Notes: LOAN, DEPOSIT, and TA are in logarithm; BRANCH is in number; LR is in percentage; the rest are ratios. Source: Authors’ calculation.
Table 3. Results of SEM analysis.
Panel A. Results of Equation (9)—Dependent Variable: LOAN
VariableCoefficientStandard Errort-Statistic
DEPOSIT0.2080.0229.294***
LOA2.4400.07333.480***
TA0.7650.02530.462**
LR0.0080.0051.797***
BRANCH0.0000.0002.543***
TYPE−0.0220.041−0.535
UNEMP0.0630.1990.315
Constant−1.4660.191−7.678***
Panel B. Results of Equation (10)—Dependent Variable: DEPOSIT
VariableCoefficientStandard Errort-Statistic
LOAN−0.0290.048−0.614
DOL2.6860.10824.893***
TA1.0720.04623.362***
LR0.0370.0075.042***
BRANCH0.0000.000−9.220***
TYPE−0.1360.064−2.121**
UNEMP−1.0710.319−3.357***
Constant−3.5320.286−12.328***
Notes: ** represents 5% level of significance and *** represents 1% level of significance.

