1. Introduction
The most recent U.S. domestic housing subprime crisis in 2007–2008 predominantly impacted the construction sector. Its negative consequences spread out to the rest of the U.S. economy and eventually expanded worldwide (International Labour Organization [
1]). According to The Organisation for Economic Co-operation and Development (OECD) data, almost all countries tracked by the OECD reported a fall in GDP of 2.1 percentage points in the first quarter of 2009 and a rise in unemployment of 2.4 percentage points in May, 2009 (OECD [
2]). This was the largest decline reported by the OECD since 1960, which predominantly affected the construction and automobile sectors. In the U.S., this impact was more devastating and led to an almost tripling of the unemployment rate, which reached 20.6% in 2010 (Current Population Survey (CPS) [
3]). In response, the U.S. launched the American Recovery and Reinvestment Act of 2009. This crisis also had a very deep and negative impact on EU countries and the Euro area, where the construction sector accounted for 6.0% of EU GDP in 2010. The deepest decline of −8.5% in the EU-27 and −7.9% in the Euro area hit in 2009 (see
Table 1).
Table 1.
Annual growth, index of production for construction, EU-27 and Euro area, 2000–2010 (1) (% growth; comparison with the previous year).
Table 1.
Annual growth, index of production for construction, EU-27 and Euro area, 2000–2010 (1) (% growth; comparison with the previous year).
| | 2000 | 2001 | 2002 | 2003 | 2004 | 2005 | 2006 | 2007 | 2008 | 2009 | 2010 |
|---|
| EU-27 | Total construction | 4.0 | 0.5 | 1.1 | 1.8 | 0.8 | 1.9 | 3.6 | 2.0 | −3.8 | −8.5 | −4.1 |
| Building | 5.2 | 0.4 | 0.7 | 2.7 | 1.8 | 2.2 | 4.3 | 1.9 | −4.3 | −10.9 | −3.4 |
| Civil engineering | 0.2 | 1.1 | 1.7 | −1.5 | −3.2 | 1.9 | −1.2 | 2.9 | −1.4 | 2.3 | −7.1 |
| EA-17 | Total construction | 4.1 | 0.6 | 0.4 | 0.9 | 0.0 | 2.2 | 3.7 | 1.3 | −5.5 | −7.9 | −7.7 |
| Building | 5.3 | 0.4 | −0.1 | 1.6 | 0.8 | 2.6 | 4.7 | 1.2 | −6.1 | −10.1 | −6.7 |
| Civil engineering | 1.4 | 0.8 | 0.5 | −0.8 | −2.1 | 2.7 | −1.8 | 2.1 | −4.2 | 0.6 | −12.0 |
Only one EU country reported positive growth in the construction sector during the crisis period: Poland with a growth of 10.2% in 2008 and 4.5% in the following year (see
Table 2).
Table 2.
Annual growth, index of production for total construction, 2000–2010 (1) (% growth; comparison with the previous year).
Table 2.
Annual growth, index of production for total construction, 2000–2010 (1) (% growth; comparison with the previous year).
| | Weight in 2005 (% of EU-27) | 2000 | 2001 | 2002 | 2003 | 2004 | 2005 | 2006 | 2007 | 2008 | 2009 | 2010 |
|---|
| EU-27 | 100.0 | 4.0 | 0.5 | 1.1 | 1.8 | 0.8 | 1.9 | 3.6 | 2.0 | −3.8 | −8.5 | −4.1 |
| EA-17 | 71.3 | 4.1 | 0.6 | 0.4 | 0.9 | 0.0 | 2.2 | 3.7 | 1.3 | −5.5 | −7.9 | −7.7 |
| Belgium | 2.0 | : | −2.4 | −2.6 | −0.2 | 2.9 | 0.6 | 3.3 | 1.5 | −0.4 | −3.3 | −2.1 |
| Bulgaria | 0.1 | : | 13.4 | 3.8 | 4.6 | 35.3 | 31.7 | 24.8 | 26.8 | 12.6 | −14.2 | −17.9 |
| Czech Republic | 0.8 | 0.8 | 10.3 | 2.9 | 9.5 | 8.6 | 5.2 | 6.4 | 6.8 | −0.3 | −0.6 | −7.3 |
| Denmark | 1.7 | 1.7 | −6.7 | −1.2 | 2.1 | −0.2 | 3.1 | 3.8 | −4.2 | −5.7 | −10.8 | −8.4 |
| Germany | 11.1 | −3.5 | −7.6 | −4.3 | −4.2 | −5.3 | −5.3 | 6.3 | 2.9 | −0.7 | 0.1 | 0.2 |
| Estonia | 0.1 | 18.6 | 4.2 | 22.6 | 6.1 | 12.5 | 22.4 | 26.9 | 13.5 | −13.3 | −29.8 | −12.4 |
| Ireland | 2.8 | : | 3.4 | 2.0 | 5.7 | 25.3 | 10.0 | 3.8 | −13.5 | −29.2 | −36.9 | −30.1 |
| Greece | 1.1 | : | 6.6 | 39.1 | −5.7 | −15.9 | −38.7 | 3.6 | 14.3 | 7.7 | −17.5 | −31.6 |
| Spain | 18.8 | 10.7 | 3.0 | 0.6 | 7.2 | 2.3 | 10.9 | 2.2 | −4.3 | −16.3 | −11.3 | −20.2 |
| France | 12.5 | 6.0 | 1.2 | −2.3 | −0.8 | −1.2 | 2.7 | 4.2 | 2.3 | −3.7 | −5.9 | −3.4 |
| Italy | 11.5 | 6.2 | 6.2 | 5.1 | 2.8 | 1.6 | 1.3 | 3.9 | 6.4 | −1.1 | −11.5 | −3.4 |
| Cyprus | 0.3 | : | 3.7 | 3.2 | 6.5 | 4.4 | 2.9 | 4.1 | 6.8 | 2.3 | −10.6 | −8.0 |
| Latvia | 0.1 | 7.2 | 6.2 | 12.1 | 13.1 | 13.1 | 15.5 | 13.3 | 13.6 | −3.1 | −34.9 | −23.4 |
| Lithuania | 0.2 | −18.1 | 7.4 | 21.7 | 27.8 | 6.8 | 9.9 | 21.7 | 22.2 | 4.0 | −48.5 | −7.7 |
| Luxembourg | 0.3 | : | 4.2 | 1.9 | 0.9 | −1.1 | −0.9 | 2.6 | 2.6 | −1.8 | 0.8 | 0.1 |
| Hungary | 0.5 | 7.7 | 9.3 | 18.0 | 2.7 | 4.3 | 15.7 | −0.7 | −14.0 | −5.2 | −4.4 | −10.4 |
| Malta | 0.0 | : | −4.0 | 23.4 | −5.7 | 8.0 | 18.5 | 4.4 | 7.2 | 6.6 | −7.9 | 0.2 |
| Netherlands | 4.9 | : | 1.9 | −3.1 | −4.9 | −2.6 | 3.2 | 2.3 | 5.6 | 3.2 | −3.0 | −11.0 |
| Austria | 2.2 | −0.6 | −0.6 | 0.5 | 12.3 | 5.0 | 4.9 | 5.9 | 3.9 | −0.9 | −1.6 | −4.3 |
| Poland | 1.7 | 1.2 | −10.9 | −10.1 | −7.2 | −1.9 | 9.2 | 15.6 | 16.3 | 10.2 | 4.5 | 3.7 |
| Portugal | 1.8 | : | 4.7 | −1.1 | −8.6 | −4.4 | −4.5 | −6.3 | −4.0 | −1.2 | −6.6 | −8.5 |
| Romania | 0.4 | : | 11.5 | 4.5 | 3.2 | 1.4 | 6.6 | 15.6 | 33.1 | 26.7 | −15.2 | −13.4 |
| Slovenia | 0.2 | 2.9 | −10.5 | 7.5 | 9.6 | 0.7 | 2.0 | 15.7 | 18.5 | 15.5 | −20.9 | −16.9 |
| Slovakia | 0.2 | 0.2 | 0.7 | 4.1 | 5.7 | 5.9 | 14.5 | 15.4 | 5.5 | 11.5 | −11.2 | −4.3 |
| Finland | 1.3 | 8.0 | −0.1 | 1.4 | 4.2 | 4.4 | 5.2 | 7.8 | 10.2 | 4.1 | −13.2 | 11.9 |
| Sweden | 2.1 | 4.4 | 5.4 | 0.3 | 0.0 | 0.1 | 3.0 | 8.0 | 6.2 | 4.2 | −3.5 | 5.9 |
| United Kingdom | 21.2 | 4.2 | 1.1 | 4.6 | 5.6 | 3.5 | −0.5 | 1.4 | 2.3 | −1.3 | −11.6 | 7.3 |
| Norway | - | −2.1 | 1.2 | −0.1 | 2.1 | 7.4 | 8.9 | 6.0 | 5.8 | 1.1 | −8.3 | −0.1 |
| Switzerland | - | 2.7 | −2.7 | 0.9 | 0.1 | 3.1 | 2.6 | 2.0 | 1.2 | 2.4 | 1.4 | 1.9 |
| Montenegro | - | : | 5.3 | 0.3 | −8.5 | −5.8 | 7.6 | 46.1 | −1.7 | 20.7 | −19.3 | −0.6 |
| Croatia | - | −8.9 | 3.7 | 13.0 | 22.3 | 1.6 | −0.2 | 9.3 | 2.6 | 11.8 | −6.9 | −15.9 |
| FYR of Macedonia | - | : | : | : | : | : | : | −12.3 | 7.5 | 25.5 | 13.7 | 15.2 |
| Turkey | - | : | : | : | : | : | : | 18.4 | 5.5 | −7.6 | −16.3 | 17.5 |
Due to its market vulnerability, the construction sector may be used as a litmus test for company performance and in a particular crises resistance.
It seems interesting to measure the behavior of family firms exposed to crises. Some researchers argue that during periods of economic meltdown, family businesses exposed to increased risk situations may perform differently than non-family business by prioritizing the security of family over firm interests (Lee [
4]; Van Gils
et al. [
5]; Rosenblatt [
6]). In opposition to this opinion, some researchers have found that family firms may withstand crisis exposure, because of having strong family and stakeholder relations (Sirmon
et al. [
7]; Corbetta and Salvato [
8]; Anderson and Reeb [
9]). These contradictory views call for further research of the behavior of family firms in crises.
The objective of this paper is to measure the performance of construction companies listed on the Warsaw Stock Exchange with respect to two portfolios: family- and non-family controlled. The performance of these portfolios was measures in three sub-periods: (1) pre-crisis period: 2006–2007; (2) crisis period: 2008–2009; (3) post-crisis period: 2010–2012. The capital asset pricing model was used to conclude whether family-controlled firms underperformed or outperformed their non-family peers in terms of expected returns and risk.
Since the seminal findings of Sharpe [
10], Lintner [
11] and Mossin [
12], CAPM has gained the immense interest of researchers. Some questioned, while others supported, the positive and linear relation between the risk and return of securities that CAPM predicted. In addition, over the past few decades, researchers have tried to relax CAPM assumptions and apply this model in a wide array of contexts. The cross-sectional behavior of asset returns has been researched voluminously in U.S., though with limited interest in Poland (Lyn and Zychowicz [
13]; Kompa and Matuszewska [
14]; Witkowska [
15]; Gębka [
16]; Kowalewski
et al. [
17]; or Waszczuk [
18]).
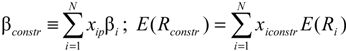
Risk and return are two basic and important financial indicators for investors. In general, investors expect more returns for taking more risk. This linear relationship is reflected in the CAPM model and is still perceived as being powerful. Its components as beta or as systematic risk allow the prediction of rates on returns of securities portfolios.
This paper is structured as follows: The next section provides the theoretical background of CAPM with an outline of its evolution and supportive and contradictory views. In the methodological part, we present portfolio construction, address the public family firms and test data retrieved from the Warsaw Stock Exchange. The final section discusses the results and limitations.
2. Theoretical Background
The capital asset pricing model was developed almost simultaneously by Sharpe [
10], Lintner [
11] and Mossin [
12] based on Harry Markovitz’s modern portfolio theory [
19]. This model assumes the mean variance as the investment allocation predictor to one-period utility maximizing investors. Five decades later, this model and its variants are still widely used in finance to explain and predict the performance of asset portfolios, the cost of capital and the relation between asset risk and expected return, among others things. In particular, this theory assumes that investors should be rewarded by higher asset returns for taking higher risks. In essence, CAPM assumes two types of risk: systematic (non-diversifiable), which is related to the market, and specific and diversifiable (or unsystematic), which are related to individual securities that may be diversified. Unsystematic risk may be minimalized by effectively diversifying and increasing the portfolio size. On the other hand, systematic risk relates to the overall movement of the market or economy and cannot be diversified. As a consequence, CAPM helps investors in measuring a security risk with respect to the market. Testing CAPM over the long term, researchers have replicated this model in many contexts and countries and are still divided regarding its viability. Some find supportive and some contradictory evidence against CAPM.
Jensen
et al. [
20] proved the validity of CAPM on the New York Stock Exchange by testing linearity in a cross-section of expected monthly excess returns and betas on ten portfolios between 1931 and 1965. Fama and McBeth [
21] found a positive linear relationship between average returns and the beta of assets on the NYSE between 1926 and 1968. Isakov [
22], in his examination of the Swiss stock market between 1983 and 1991, proved the viability of CAPM. Zhang and Wihlborg [
23] tested a monthly time series of equity prices by analyzing 753 firms quoted in six European emerging stock markets: Cyprus, Czech Republic, Greece, Hungary, Russia and Turkey between 1995 and 2002. They found a positive correlation between beta and returns for domestic CAPM. Litzenberger and Ramaswamy [
24] found a positive relationship between dividend yield and stock return for the 1936–1977 period. Durack
et al. [
25] found supportive evidence for the CAPM model by testing Australian companies. Köseoğlu and Mercangöz [
26] proved the validity of the zero beta capital asset pricing model by analyzing stocks within the ISE 100 on the Istanbul Stock Exchange.
However there is another stream of research against CAPM. Ibbotson and Sinquefield [
27] revised the CAPM formula by ruling out beta and arguing that returns are better explained by the size of company and its book to market ratio. Roll [
28] proved CAPM misspecification as the result of not finding an adequate measure of market portfolio. Banz [
29] challenged CAPM by analyzing NYSE stocks between 1936 and 1975 and found that small firms had higher risk adjusted returns than larger firms. He argued that the size effect had existed for at least forty decades, which stood against the CAPM model. However, he argued that this effect was not linear and not stable; thus, the conclusions may not be supportive. Fama and French [
30] analyzed a hundred portfolios on NYSE, AMEX and NASDAQ between July 1963, and December 1990. Their findings proved that size mattered, but not the relationship between beta and returns. Michailidis
et al. [
31] tested weekly stock returns of 100 firms listed in Greece between January 1998, and December 2002, and arrived at conclusions that higher risk is correlated with higher return, but the reverse correlation does not hold. Adedokun and Olakojo [
32] arrived at the same results by testing monthly stock returns from a hundred Nigerian firms between January 2008, and December,2009. Hasan
et al. [
33] tested CAPM for the Bangladesh stock market and found out that this model does not prove its validity.
Mixed results of testing CAPM encouraged researchers to adjust this model by other variables than just using beta to explain returns. Merton [
34] introduced intertemporal beta to differentiate investor and market beta. In the first case, investors bear greater risk (cash flow) than the market overall (discount beta equal to the variance of the market return), which should be reflected in higher returns. Breeden [
35] proposed adjusting Merton’s beta by the consumption aggregate in a single equation. Basu [
36] argued that the relationship between price-earnings ratios is stronger than CAPM predicts. Bhandari [
37] found a positive relationship between debt to equity and expected stock returns. This relation holds true, even with different controlling variables, such as firm size, beta and the January effect. In addition, the relationship holds, even without the January effect, though it is weaker. Some researchers found that leverage and the book-to-market ratio better explain higher asset returns than CAPM (Rosenberg
et al., [
38]; Chan
et al. [
39]). In addition, Chan
et al. [
39] measured the relation between stock returns and four variables: earnings yield, size, book to market ratio and cash flow yield in Japan. They found that all four of these variables correlate with market return, out of which, the book to market ratio and cash flow yield correlate the most with returns. In line with these vast contributions, Fama and French [
40] revised their model by analyzing the two variables of size and book-to-market ratio in addition to excess market return. Javid and Ahmad [
41] argued that conditional co-skewness explains non-normality in stock prices. Akbari and Mohammadi [
42] found no relation between beta and the leverage ratios of 115 firms quoted at the Tehran Stock Market between 2005 and 2012.
There is very limited interest in research testing CAPM on family firms. Zellweger [
43] pointed out the revision of CAPM to address the time horizon inherent in family firms. Zellweger argues that by extending the time horizon for investments, the marginal risk of an investment is reduced.
Some research studies have focused on testing CAPM on the Warsaw Stock Exchange. Lyn and Zychowicz [
13] found book to market and dividend yield ratios in some Eastern European markets to be predictors of returns over six to 12 months. Kompa and Matuszewska [
14] researched returns of five companies with the highest percentage shares listed under the Warsaw Stock Exchange Index 20 that characterize the largest and the most liquid companies. Witkowska [
15] analyzed five portfolios composed of securities between 2002 and 2005 and found proof for the viability of the CAPM on the WSE. Gębka [
16] found, for example, cross-autocorrelation between size and volume in portfolio returns during the 1996–2000 period. Waszczuk [
18] showed that momentum trading may not be taken into account to generate profits beyond a one-month holding period between 2002 and 2011. In addition, she found proof for applying size and value strategies; however, their relevance varies over time. Almost none of the analyses of quoted Polish securities focused on measuring the performance of family firms. The only study that addressed family firms was performed by Kowalewski
et al. [
17]. They analyzed public family firms and found a relationship between the share of ownership and firm performance by analyzing 217 Polish companies from 1997 to 2005.
This study aims at contributing to the field of CAPM testing by analyzing securities of family-controlled vs. non-family peers, in particular measuring their performance in the crisis period.
4. Conclusions
This research focused on testing the validity of CAPM on the Warsaw Stock Exchange across two portfolios of family- and non-family-controlled companies. These portfolios were constructed on the basis of the complete data retrieved from the Warsaw Stock Exchange. As a consequence, we made calculations on the whole population (not sample) data. In this respect, even the small amount of data does not exclude an inference. These two portfolios were then adjusted for the size, i.e., market capitalization, to avoid the dominance of large companies in the population.
The assumption of normal distribution may not be rejected according to the Jarque–Bera test for the period from 2008 to 2012; therefore, the relation between return and risk holds in the case of the WSE. However, for the period from 2006 to 2007, the Jarque–Bera yielded outlying numbers; therefore, we did not draw conclusions.
By assuming that market portfolios were efficient, returns of family construction companies significantly outperformed their nonfamily peers in the latest crisis. Investors who invested in family-controlled portfolios during that time might have expected exceptional returns of 23.56%. In addition, these securities were undervalued, which does not prove CAPM invalidity. As Jensen argued [
55], “deficiencies as measurement and model specification error due to proxies for variables do not reject CAPM”.
Although the capital asset pricing model was substantially developed since its inception (see Theoretical Background), we decided to prove its validity as developed by Sharpe [
10], Lintner [
11] and Mossin [
12], because of scant testing in the case of family firms. However it would be tempting to move beyond this version of CAPM to get more insight into the performance of family firms on stock exchanges.
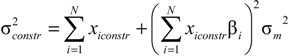
This research was limited to public companies. In addition to the extraordinary returns of family-controlled firms, the results suggest that a vast amount of risk is specific for all construction portfolios. It would be interesting to find out the sources of this risk. As mentioned in the Introduction, Poland was the only EU country in which the construction industry withstood the crisis and reported positive returns. However, as this research is limited to public companies, it would be interesting to analyze in-depth factors that allowed family-controlled firms operating in the construction sector to outperform their non-family peers. In addition, this paper used the capital asset pricing model to explain the performance of two portfolios that used a family-ownership as the distinction factor. The outperformance of the family-owned firms during the crisis may be either attributed to family-ownership or non-family-related factors and being the result of portfolio composition. This issue also needs to be further analyzed, i.e., by conducting a qualitative research.