3.1. Presentation of the Results of the Second Round in the European Pharmacy Community and Comparison with the Results of the First Round
The numbers of respondents in the two rounds are presented in
Table 2. Compared to the first round, the percentage of respondents going beyond Question 6 in the second round was lower in all groups excepting that of “pharmacists in other professions”, where the response rate was higher in the second round (81% versus 48%).
The number of respondents in all groups and in both rounds was higher than the minimum number required to be surveyed based on the estimated European population of each group [
2,
13].
The percentage of double replies was generally low. It was highest for industrial (16%) and hospital pharmacists (15%;
Table 2). Thus, in these two groups, just under one fifth of replies in the two rounds, in all probability, came from the same person. The percentage of double replies for students was very low (0.6%), showing that two different student populations answered the questionnaires in the two different rounds. This reveals a certain conflict in the student group between two of the principles of the Delphi methodology: iteration and anonymity. Iteration would require that the composition of the expert panel remains the same, i.e., that the same people are surveyed, in the different rounds. However, in order to maintain anonymity, the decision was taken not to collect email addresses in the first round and to resend the survey to the same email addresses in the second round (so ensuring that the same people were contacted). We hoped to overcome the difficulty arising from the conflict of “iteration versus anonymity” by using the same global email listings for the different groups in the two rounds and this with the objective of contacting the same people.
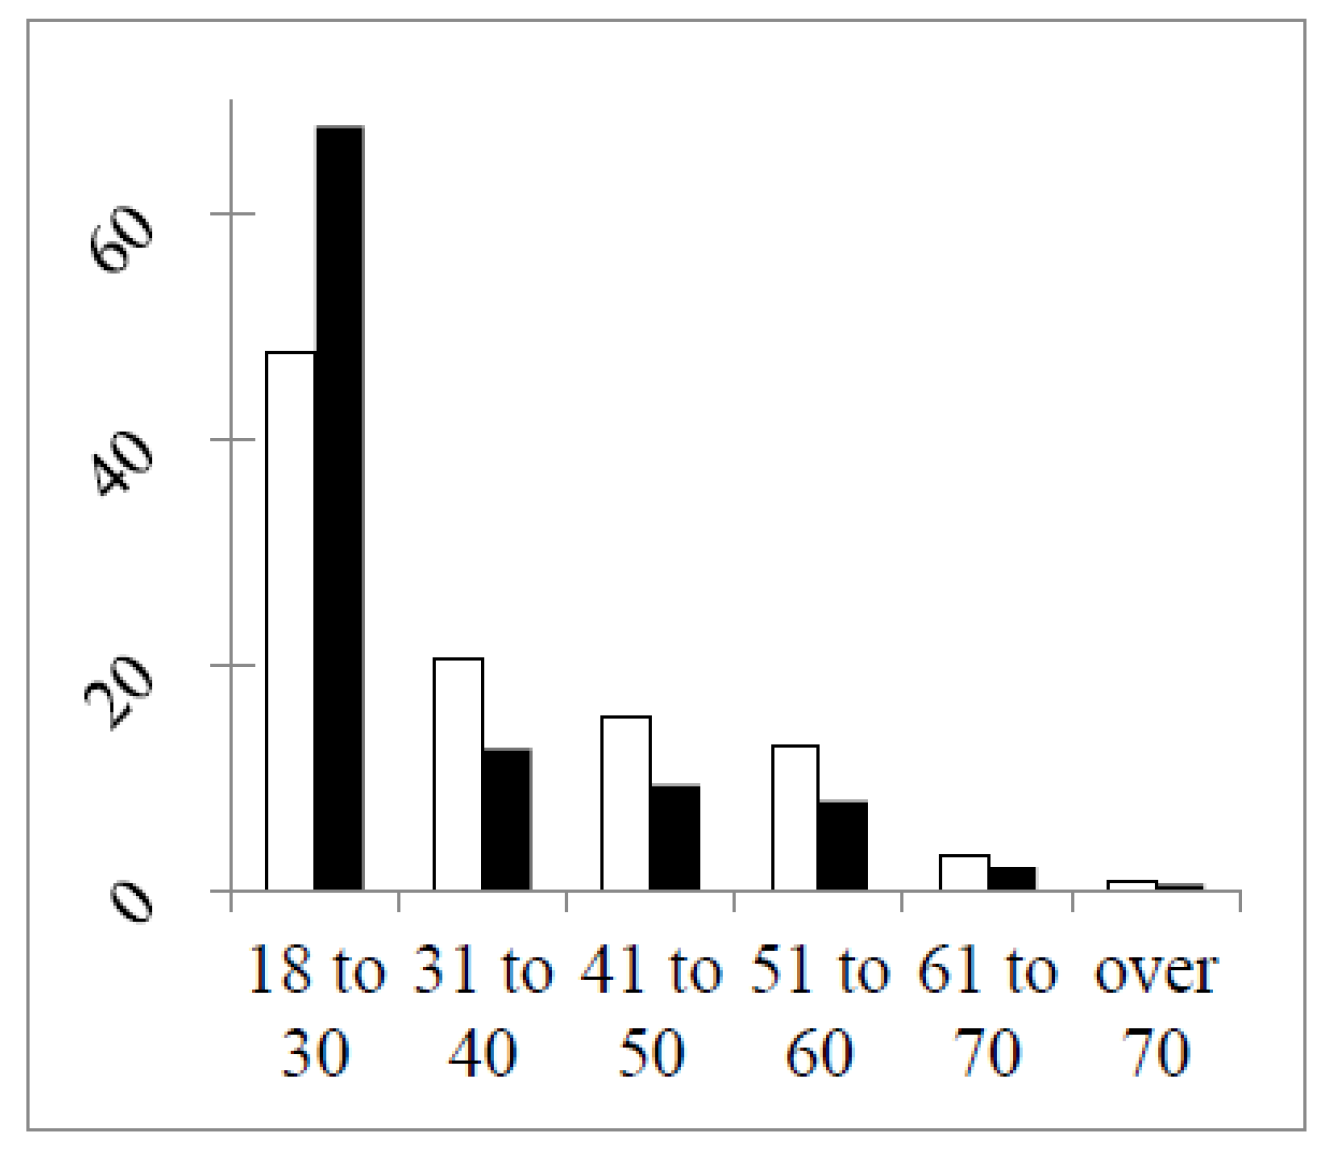
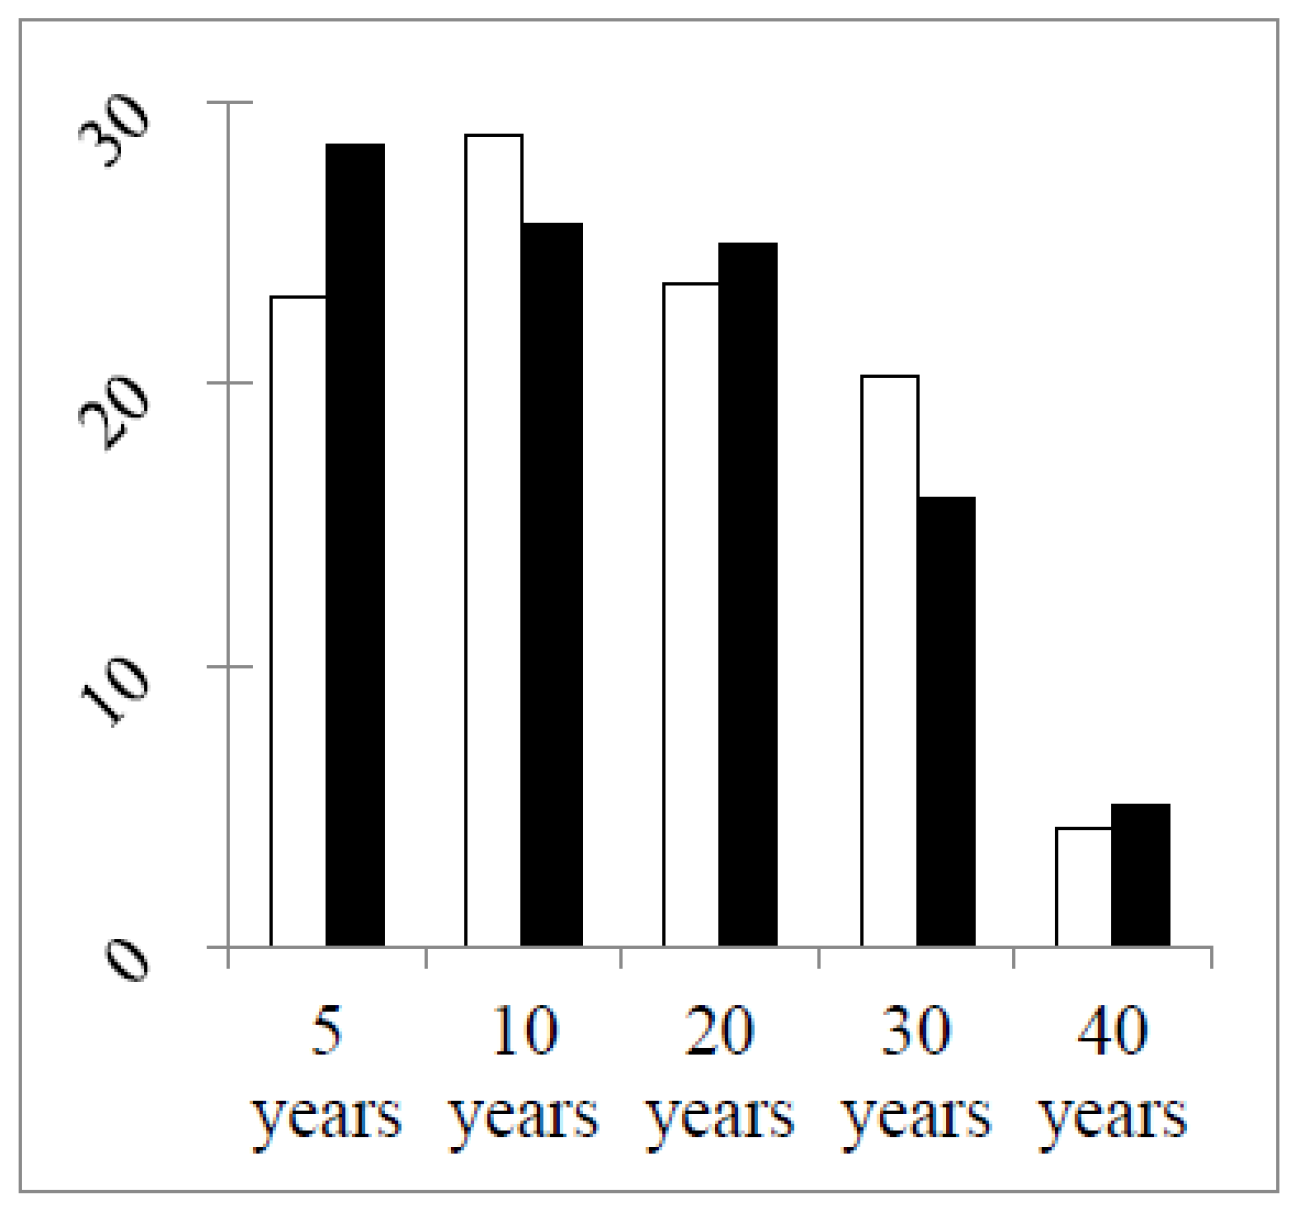
In
Figure 1 are shown the distributions of respondents by age in the two rounds.
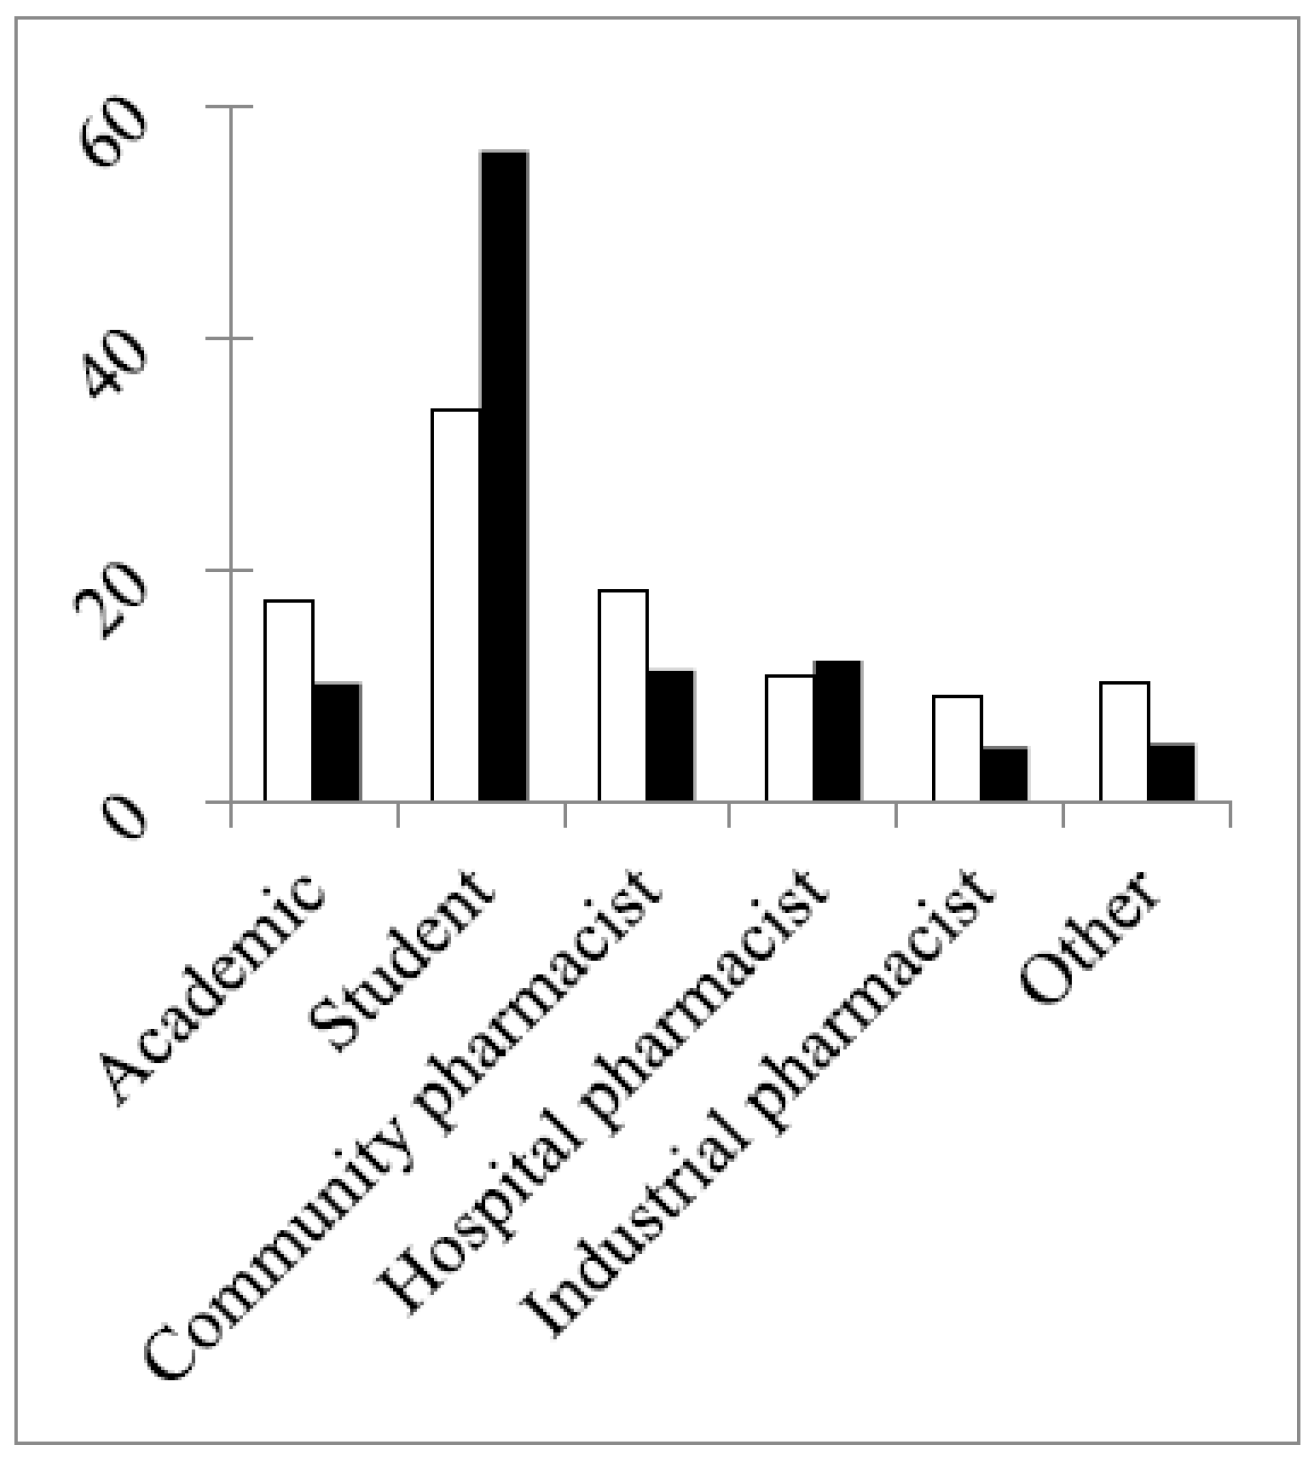
In both rounds, 50% or more of the respondents were in the age group 18–30 years old. This reached 68% in the second round due to a much larger percentage of students in this round (
Figure 2) and to the difference in the study year of the students between the two rounds (
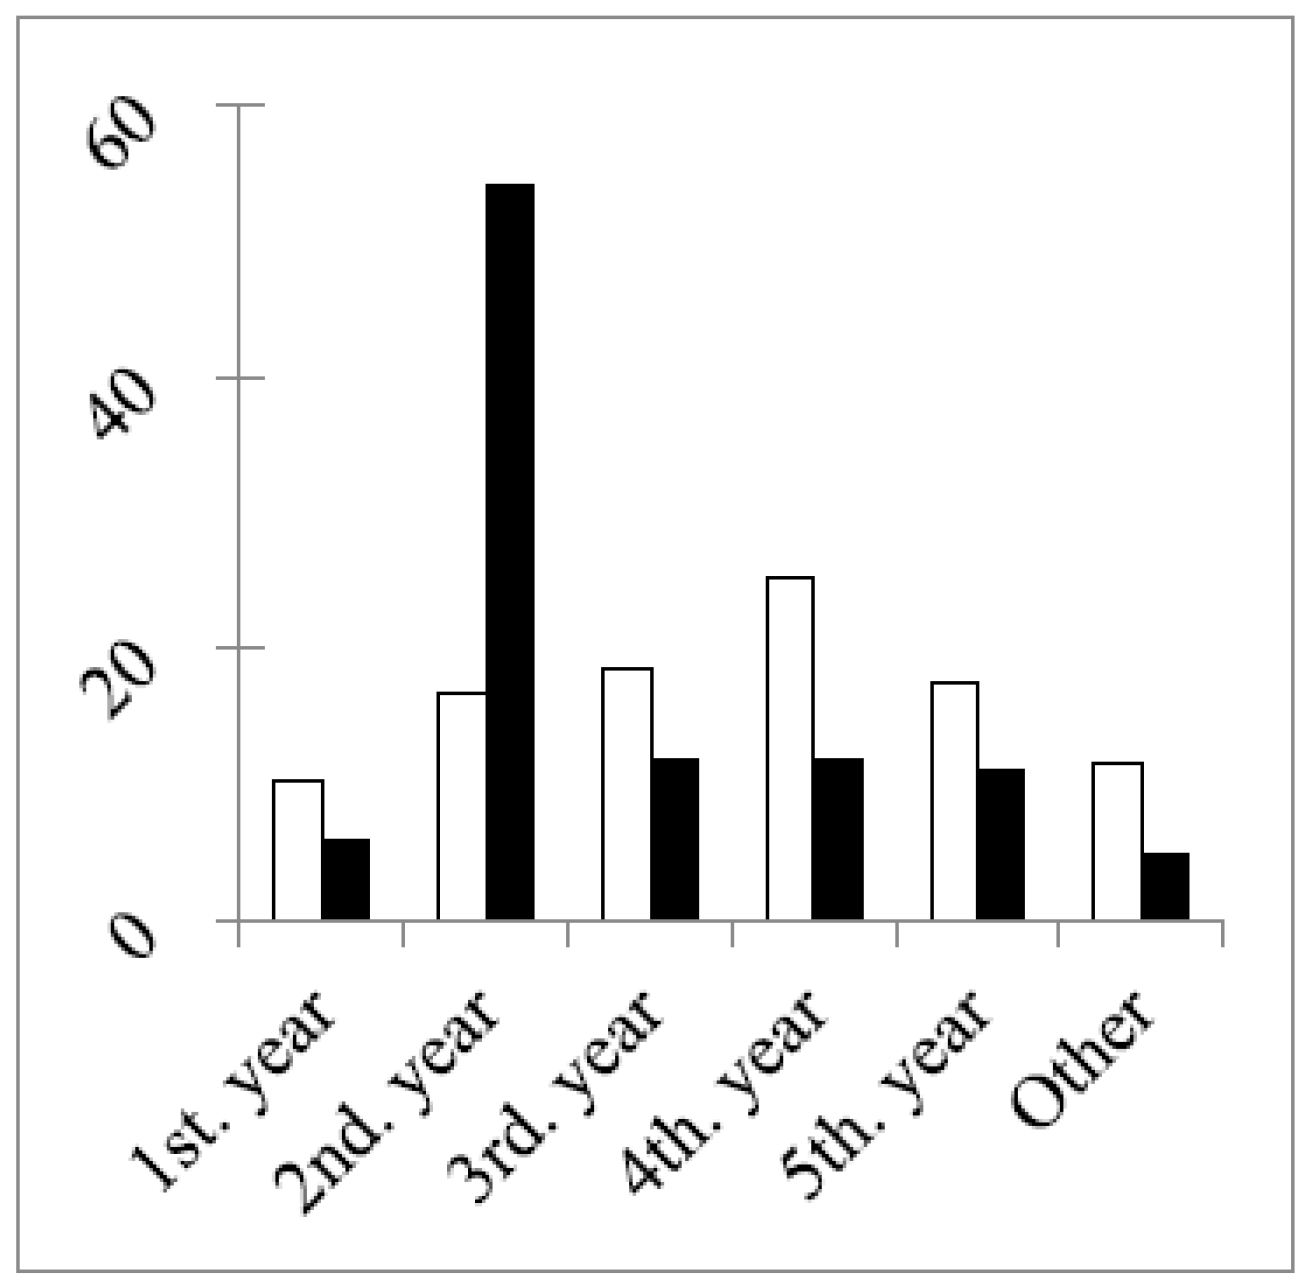
Figure 3).
Figure 3 shows that the main difference in numbers concerned second year students, with almost four-times more students in the second year group in the second round. In other groups the total numbers and the numbers of double replies in the two rounds were similar (
Table 2). The greater stability of the groups (excepting students) between the two grounds was illustrated by two other factors. Firstly, the percentage distributions of years of professional experience were similar in the two rounds (
Figure 4).
The second factor revealing that the populations of professional groups were similar in the two rounds was the existence of a significant correlation between the numbers of respondents per country in the two rounds in three out of five of the groups: community, hospital and industrial pharmacists (
Table 3). Thus, for these three groups, countries returned similar numbers of respondents in the two rounds.
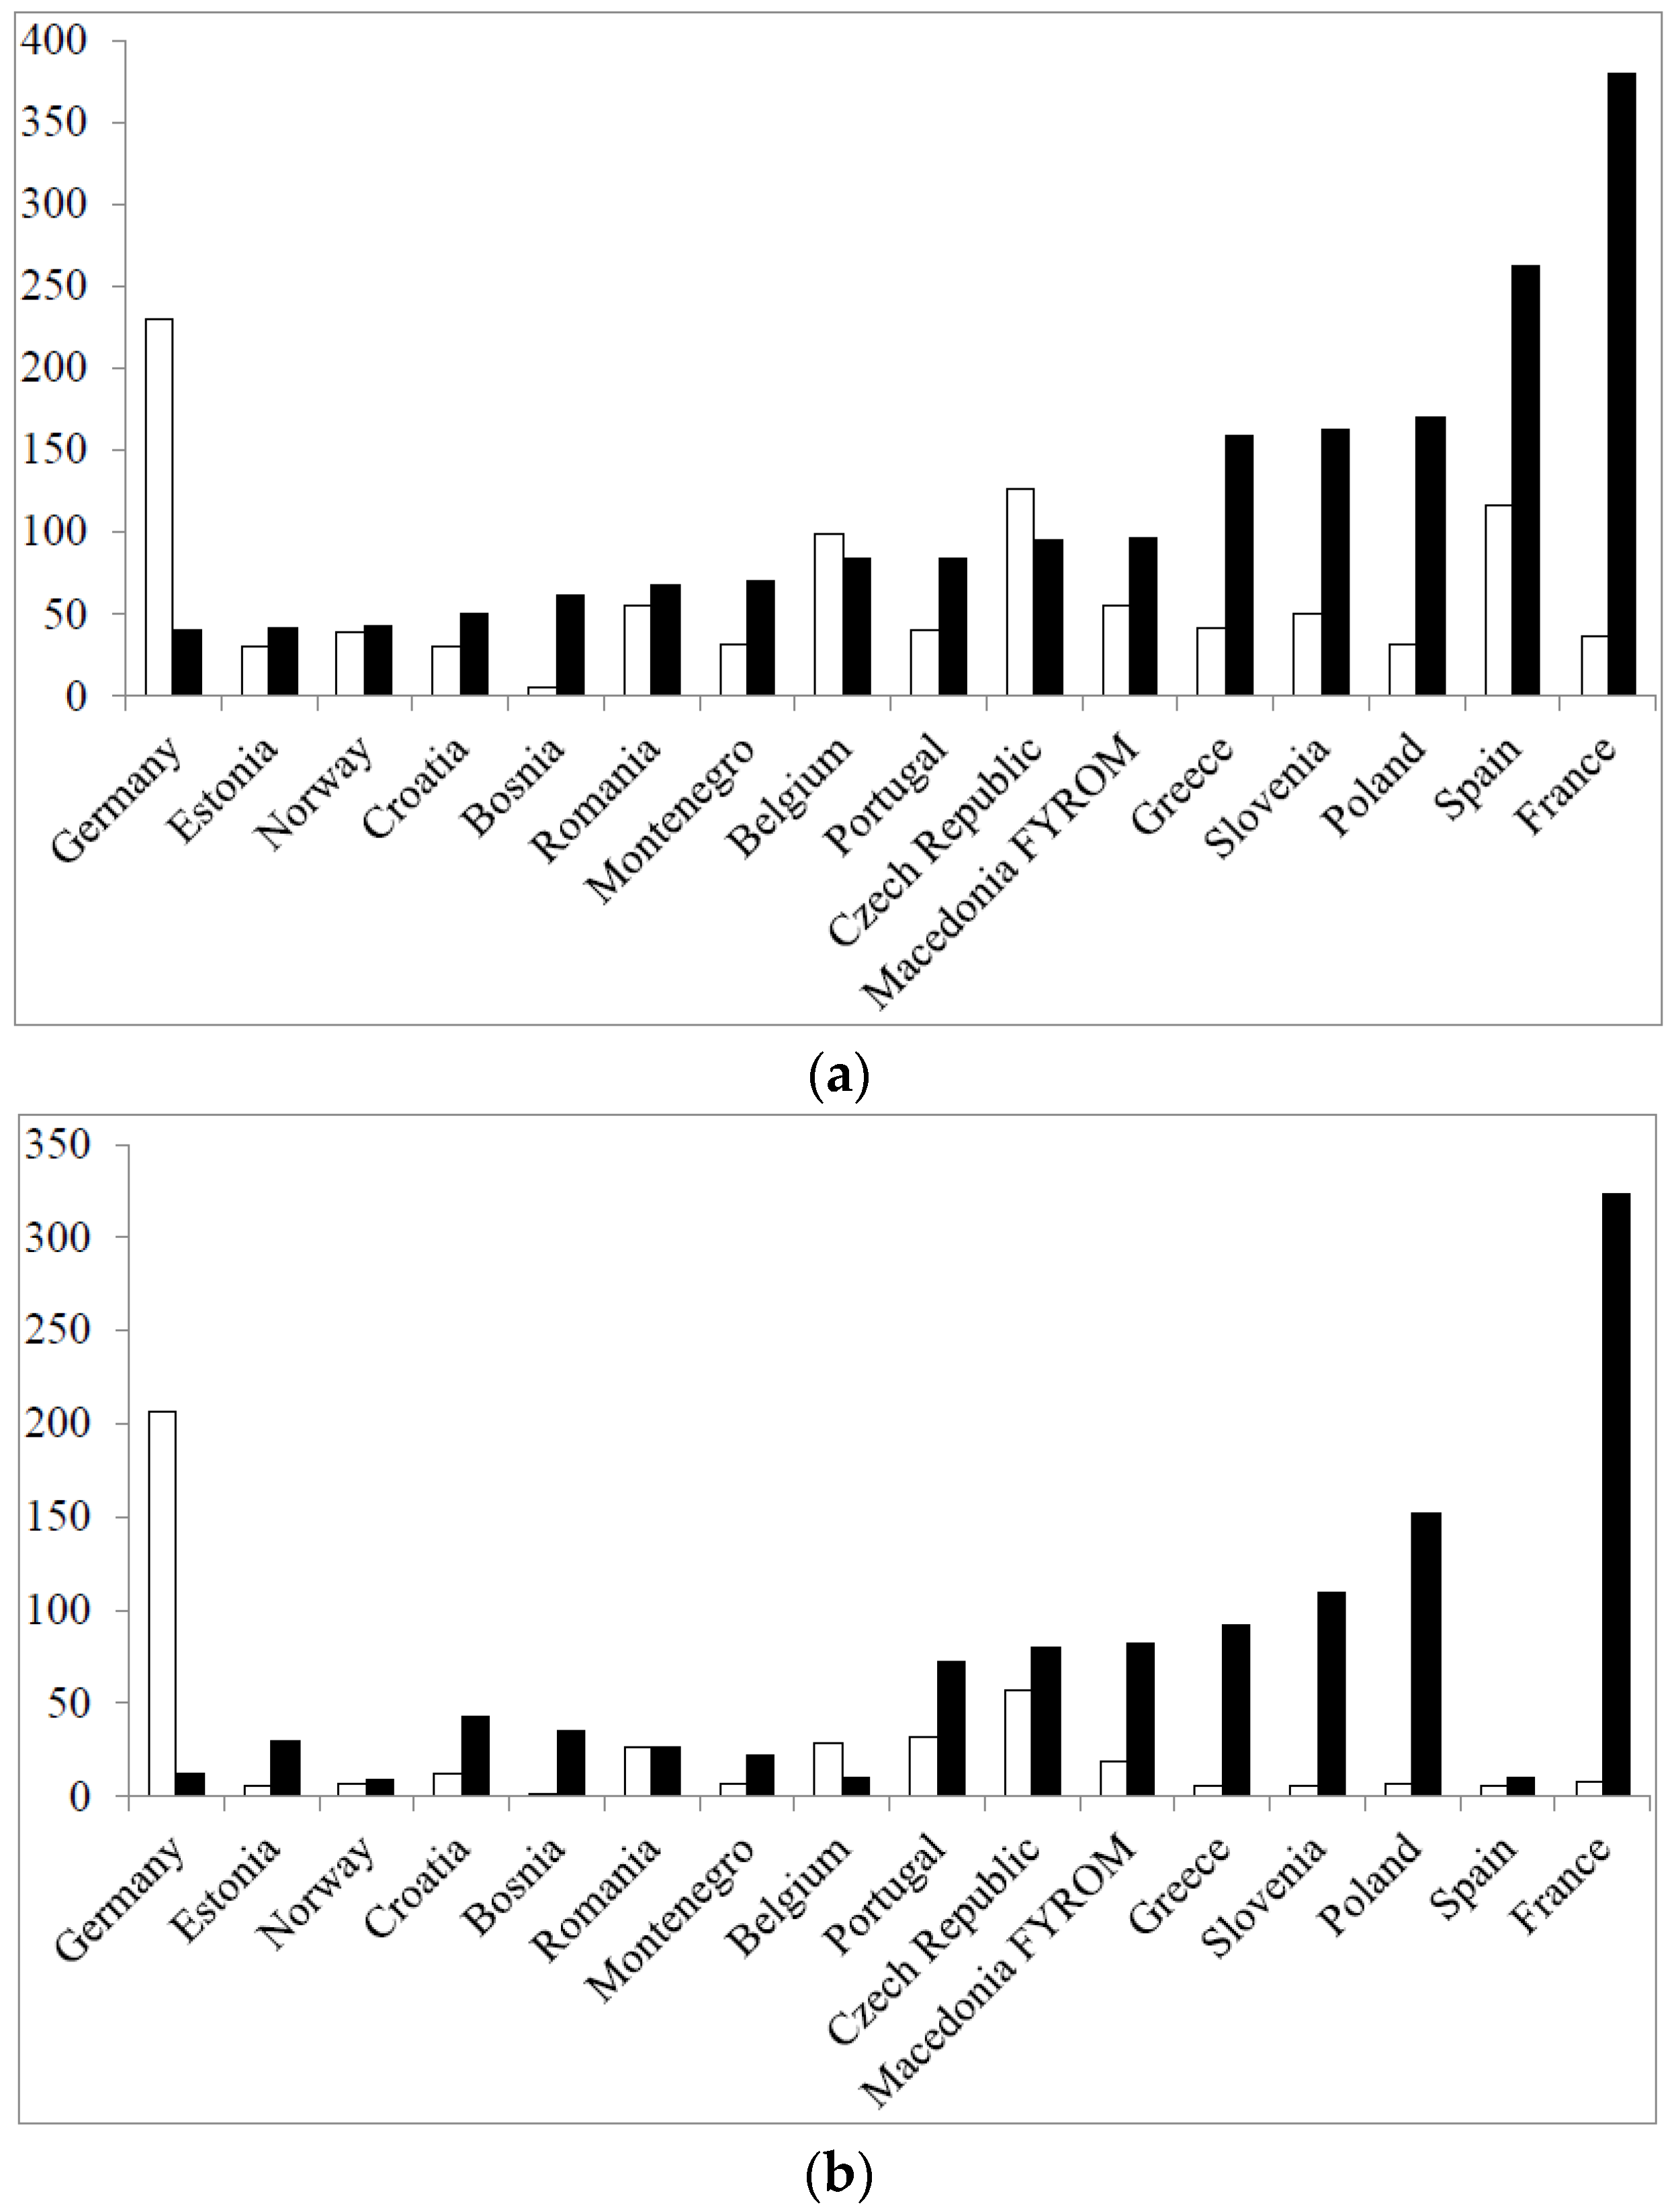
The number of students per country in the two rounds determined to a large extent the total number of respondents per country (
Figure 5) (data for the top 16 in terms of total respondents/country in Round 2 are given).
It can be seen that the large numbers of total respondents in the second round in countries such as France and Poland, for instance, were largely due to the recruitment of large numbers of students in these countries in Round 2. In other countries, e.g., Spain, this was not the case. Thus, although
Table 3 reveals that for professional pharmacist groups, the geographical distribution of the respondent population is more or less stable from Round 1 to Round 2,
Table 3 and
Figure 5 reveal that for other groups, such as students and academics, this is less evident. Two questions have to be answered here: why is there a shift in geographical distribution of respondents in some groups, and does this impact on the global results? The methodology used was the same in both rounds and for all groups. It was essentially based on contacts by email, mainly via professional groups, chambers and associations, backed up by oral contact with individuals and groups. The same email lists were used in the two rounds. Albeit that although the same persons were contacted, the response rate was different, in some groups, from Round 1 to Round 2. Personal contacts suggested that this may have been due to different awareness of the project through national and European publications and to a fall in interest following surveying “fatigue”. Although the geographical distribution of respondents changed, this did not appear to modify the correlation between scores for individual competences obtained in the first round and those obtained in the second round (see later). This could be due to the fact that ranking by a given group changes little from one country to another [
14].
3.2. Results for the Ranking of Competences and for Consensus in the Second Round
Overall ranking data are given in
Table 4.
As in the first round, the total for “cannot rank” plus “blanks” was low (14.5%), suggesting that the questionnaire was easy to understand and relevant to practice. The calculated score for the total population (n = 1528 respondents) was high at 81.8%, revealing that globally, 8/10s of respondents ranked the competences as “obligatory”. The global Leik consensus was also high at 0.61, revealing that opinions were relatively homogeneous. These values are not significantly different from those of Round 1.
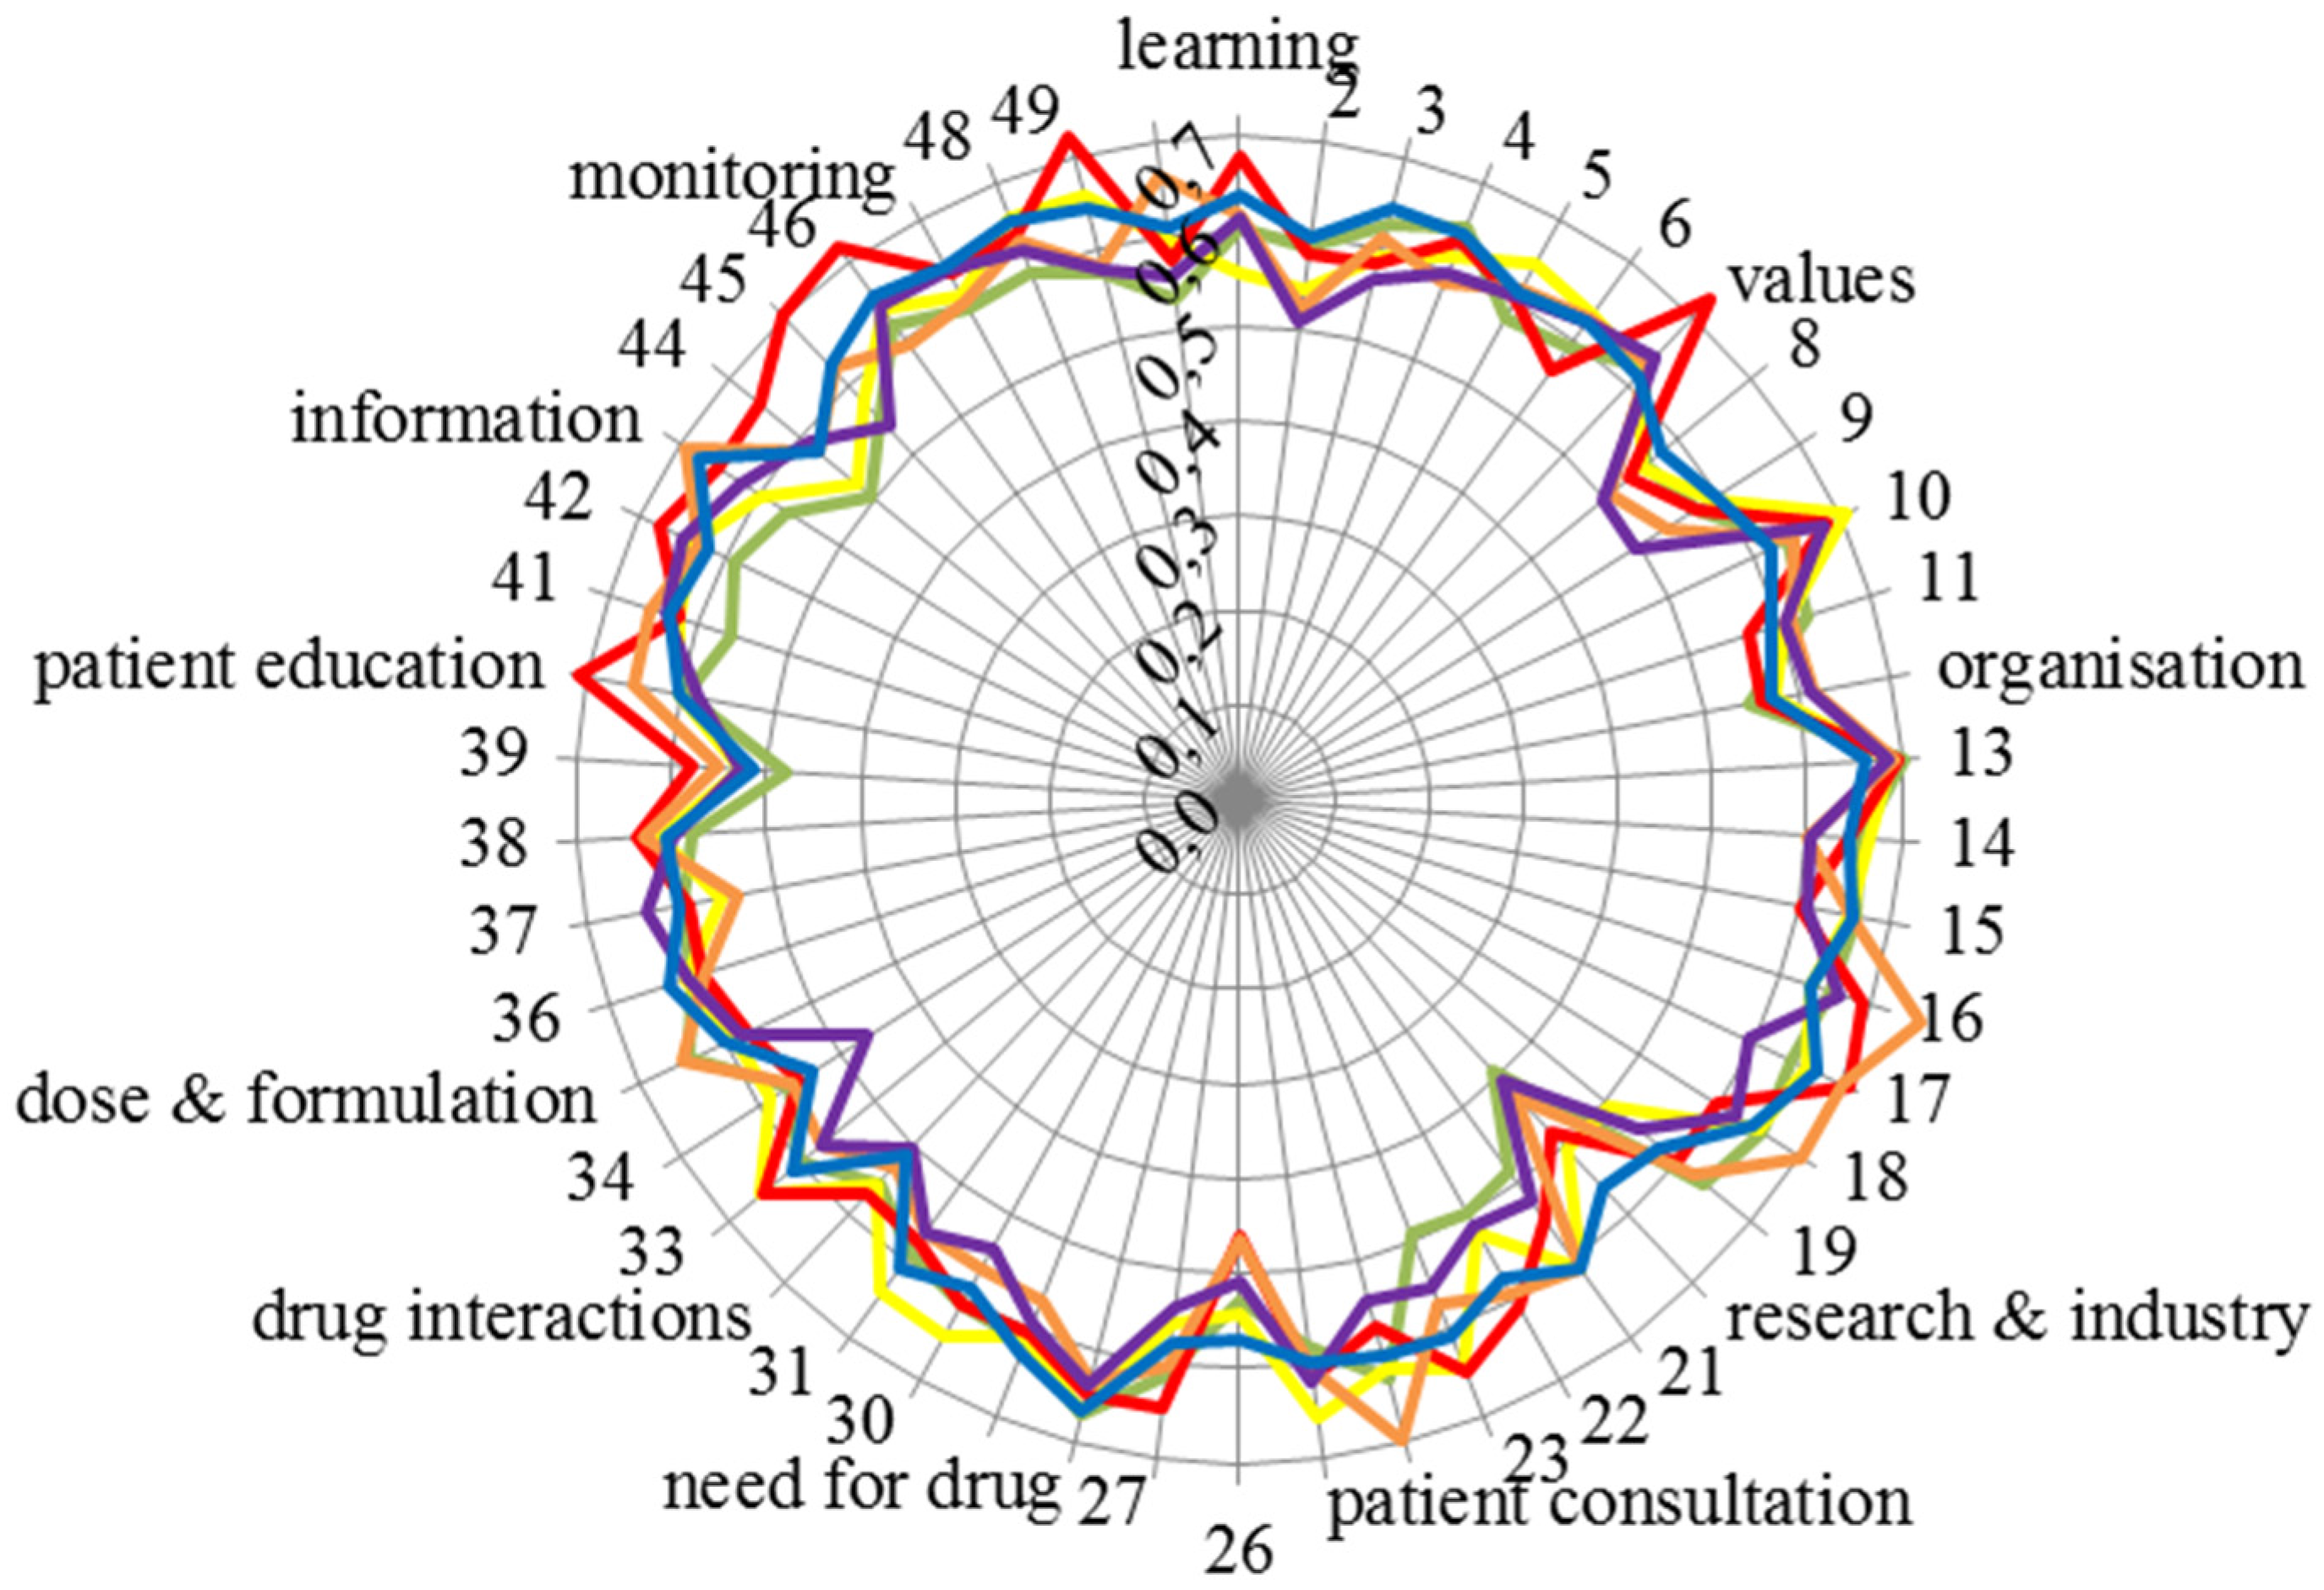
The Leik consensus values for the 50 competences for each of the six groups are given in
Figure 6.
Consensus within groups was high (around 0.6) and similar for all groups. Consensus was relatively lower (0.4–0.5) for Competences 20 “knowledge of design, synthesis, isolation, characterisation and biological evaluation of active substances” and 26 “ability to perform appropriate diagnostic tests, e.g., measurement of blood pressure or blood sugar”.
Consideration of the Leik consensus values brings us back to the question of bias (which has already been touched upon (see above)). In order to avoid bias in selection, the numbers of respondents were planned to be balanced between countries and professional groups. Since the calculated Leik ordinal consensus between fractions in all groups was high, we considered that this was achieved and that the replies were homogeneous. On a more general basis, in a study such as this, it is unavoidable that certain biases will be present, and this is a possible limitation of the study. The two main elements here are the Delphi approach and the selection of experts. We would argue that the Delphi approach used allowed us to establish an expert group opinion with an acceptable degree of dispersion or consensus. The second element is our definition of experts, i.e., the groups approached for answering the questionnaire. On this point, some may disagree with our choice. Only future studies and data can provide an answer to this question.
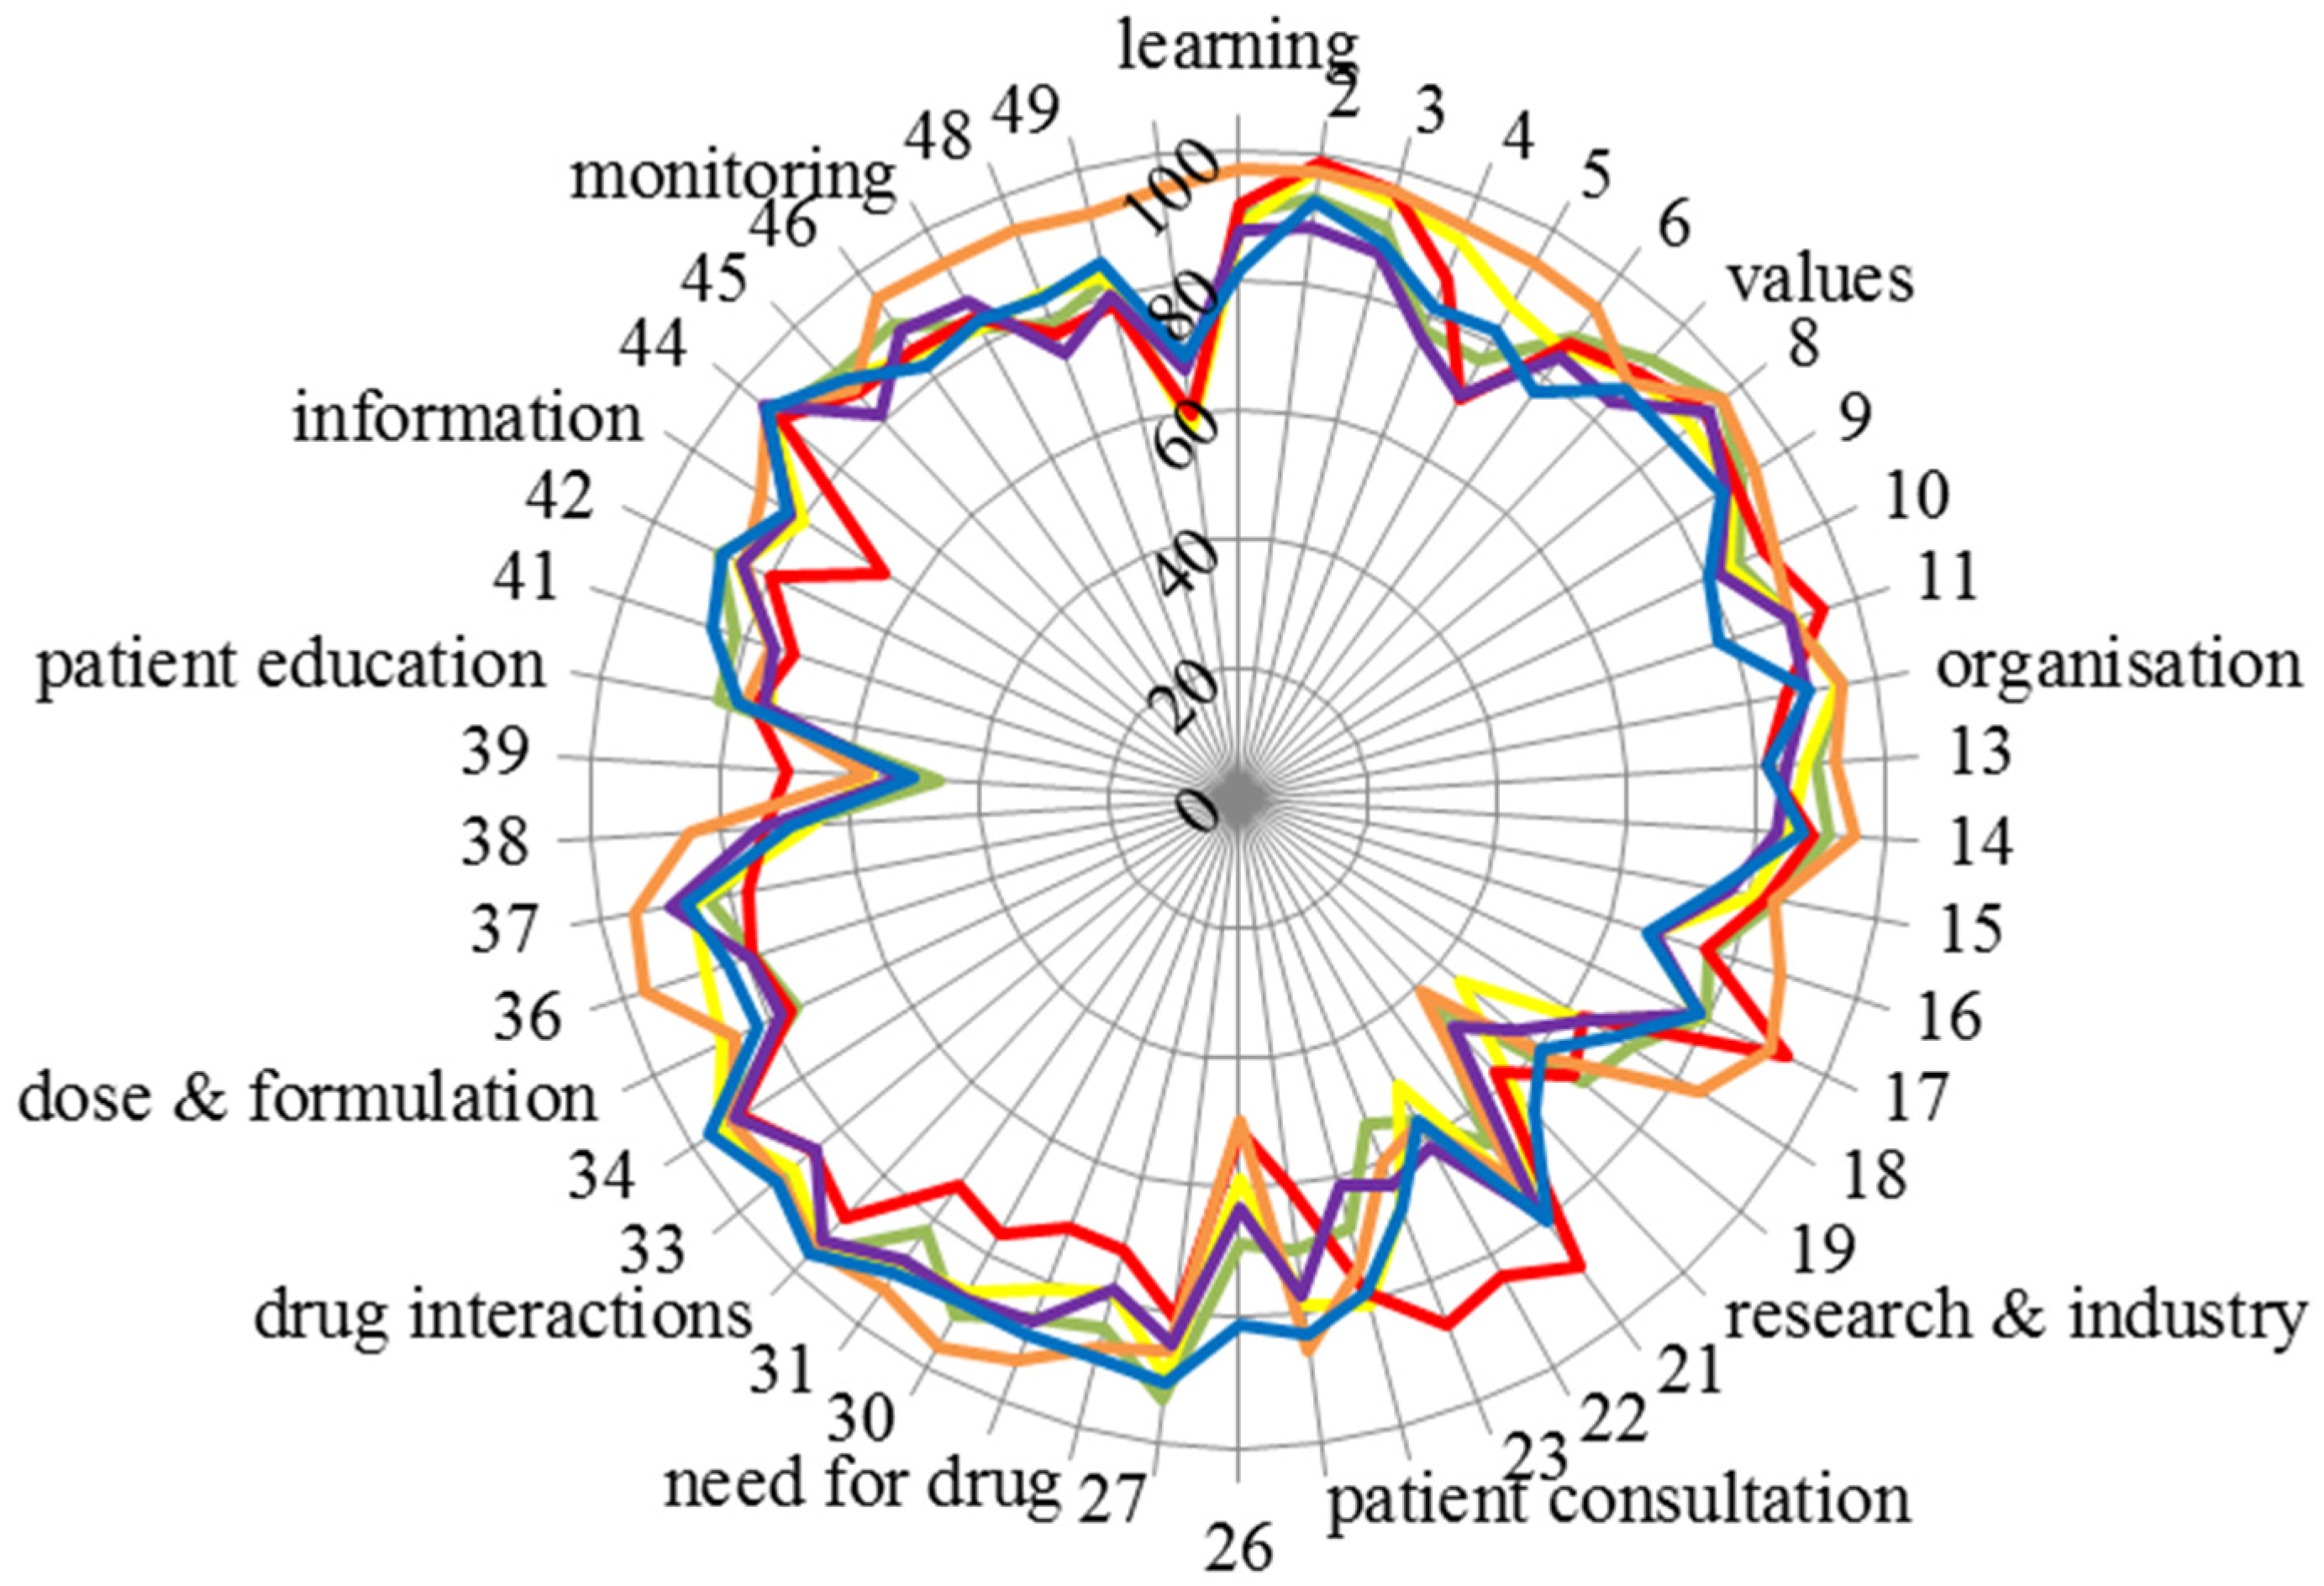
The scores for the 50 competences of the six groups are given in
Figure 7.
Figure 7 emphasises the consensus of scoring amongst groups. Scores were almost exclusively very high (80% or above) except for four competences: 20: “knowledge of design, synthesis, isolation, characterisation and biological evaluation of active substances”, 26: “ability to perform appropriate diagnostic tests, e.g., measurement of blood pressure or blood sugar”, 39: “ability to manufacture medicinal products that are not commercially available” and 50: “ability to contribute to the cost effectiveness of treatment by collection and analysis of data on medicines’ use” (see also the table in the
Appendix). It should be noted that there was some disagreement within groups in scoring, as, for instance, Leik consensus on Competences 20 and 26 was low (
Figure 6).
Another indicator of global consensus was the Spearman correlation coefficient. When compared with the community pharmacist, groups’ score values for the different groups were as follows: hospital pharmacists r = 0.62, industrial pharmacists r = 0.64, pharmacists in other professions r = 0.87, students r = 0.77 and academics r = 0.82 (all p < 0.001).
The above correlations are interesting in light of the change in the student contribution from the first to the second round. The proportion of students involved increased very substantially from under 30% (Round 1) to approximately 50% (Round 2). Furthermore, many of those students who responded were only in their second year of pharmacy education. These students may be unqualified to reliably answer such a survey, as they are some distance from actually working as a pharmacist. However the Spearman correlation coefficient for scores for students against scores for community pharmacists is high (0.77) and incidentally higher than that for hospital pharmacists (0.62). Visual inspection of
Figure 7 shows that there is a tight relationship between scores for community pharmacists (green line) and students (blue line). Two other points should be considered. In a previous paper on the results from Round 1 [
15], students, academics and community pharmacists ranked personal and patient care competences for pharmacy practice. The ranking profiles for all three groups were similar. This was true of the comparison between students and community pharmacists concerning patient care competences, suggesting that students do have a good idea of their future profession. Albeit, a comparison of first and fifth (final) year students did show slightly more awareness of patient care competences in the final year students. On balance, we would suggest that pharmacy students, even those in the early years of study, do have well-founded ideas on the competences required for their future profession. The same paper showed that there were no substantial differences amongst rankings of students from different countries, some with more “medicinal/clinical” courses and others with more “chemical sciences” courses. Secondly, in the PHARMINE study [
16], it was found that 9/25 countries provide a substantial part of their training (community and/or hospital pharmacy) in the first two years of study. For example, second year French pharmacy students, who were largely represented in the second round, have a six-week training period.
There were some differences amongst groups, with for instance, hospital pharmacists scoring competence 50 “ability to contribute to the cost effectiveness of treatment by collection and analysis of data on medicines’ use” much higher (95%) than the overall average (68%). Another example was industrial pharmacists who score competences in Cluster 10 “research and industrial pharmacy” higher, often substantially, than the global average (see the table in the
Appendix).
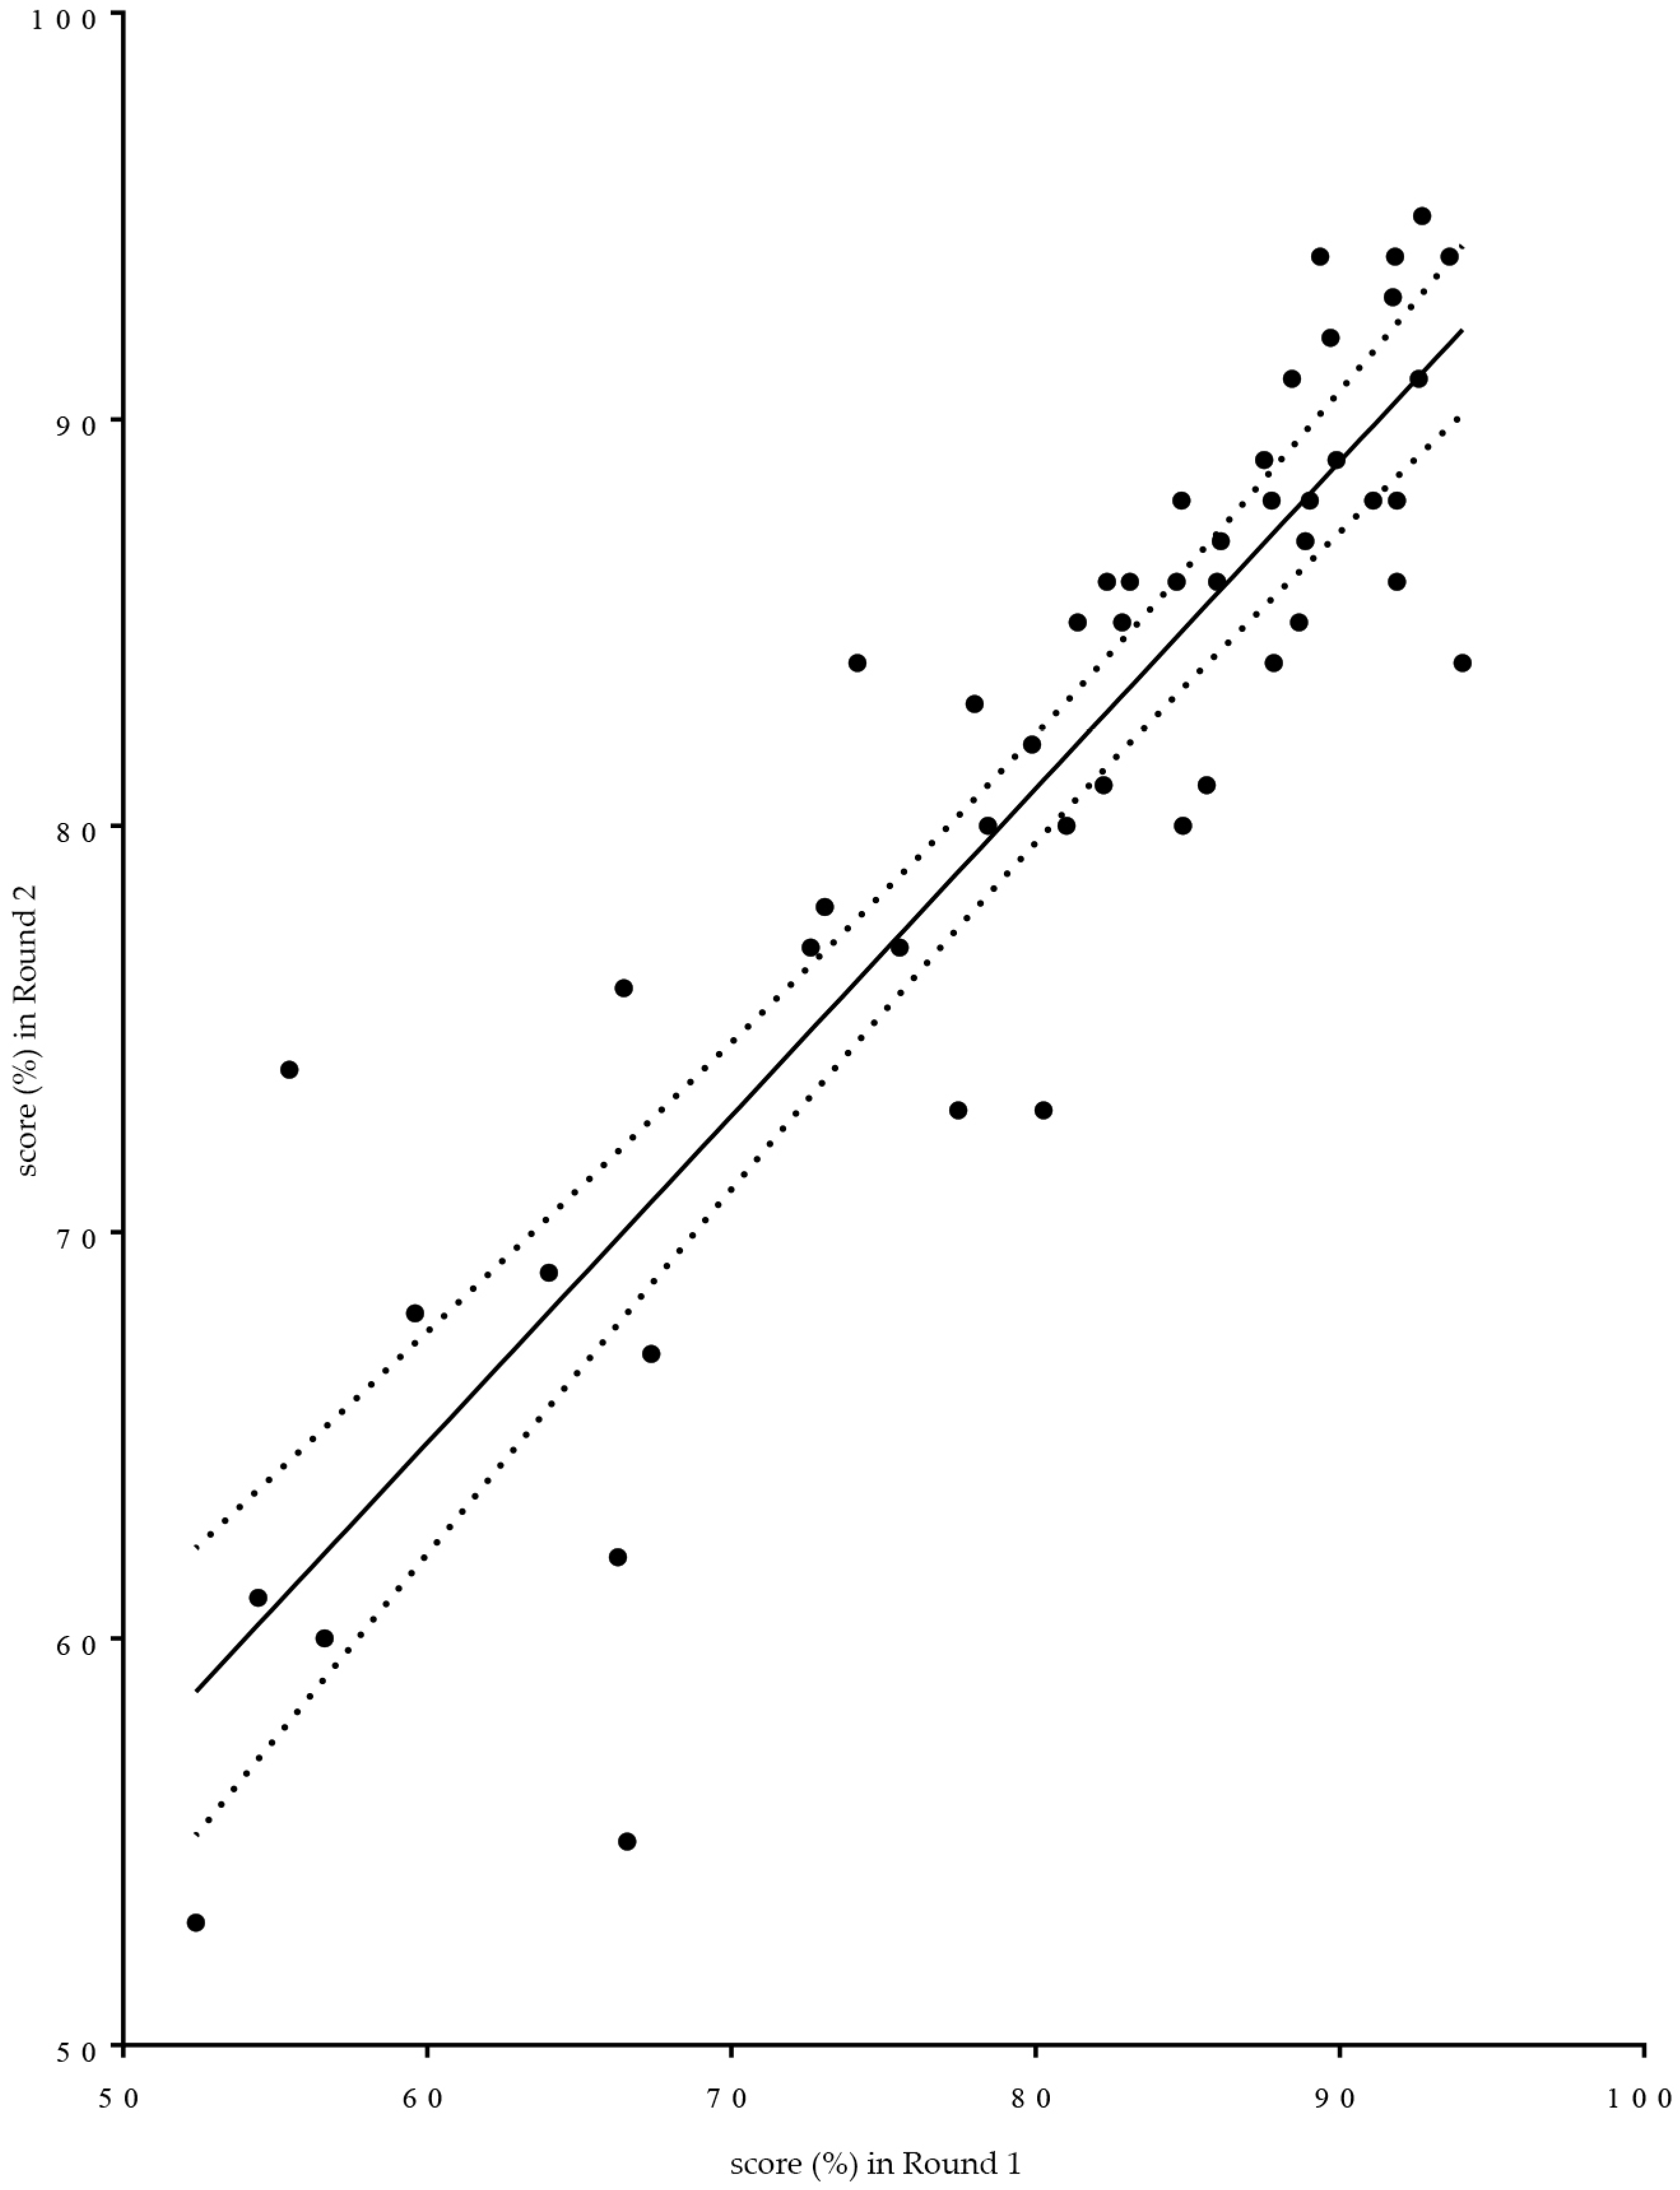
Given that the subject matter of proposed competences was not substantially altered between rounds, scores for the same competences were compared between Rounds 1 and 2. Linear regression analysis was used (see
Figure 8). Two provisos have to be made regarding such use. It is not known whether the variable “score” is normally distributed. Given that the score is a transformed variable calculated on the basis of ranks that are highly skewed to the right suggests that scores may have a non-normal distribution. Furthermore, the exact wording of the individual questions asked differed between the two rounds. In
Figure 8 is given as a graphic aid to understanding of the relationships between the two rounds. The non-parametric Spearman correlation coefficient “r” was 0.88,
p < 0.0001. Global means were 80% for Round 1 and 81% for Round 2.
In spite of the fact that, in the second round compared to the first, not exactly the same population was questioned and not exactly the same questions were asked, rankings were similar.
The numbers of comments are shown in the
Table 5.
The number of comments was low (3% in the global population), as in the first Delphi study [
17]; there were on average two comments per commentator. There were no suggestions as to topics that were not, but should have been, included.
As in Round 1, comments were mainly (31/113) on four topics:
- (1)
Working environment (six comments). Example: emphasis should be put on the community pharmacy and hospital pharmacy setting.
- (2)
Team work and the definition of the responsibility of the pharmacists within the health team (14 comments). Example: clearly know what the pharmacist is responsible for. One community pharmacist suggested that pharmacists were ideally suited to be the “coordinator” of the health team.
- (3)
Legal and other limits to the pharmacist’s responsibility (seven comments). Examples: diagnosis is the responsibility of doctors; pharmacists in Latvia mostly work in chain-pharmacies…where owners and managers have no pharmaceutical education.
- (4)
Use of information technology (four comments). Example: ability to find appropriate sources and use electronic platforms.
The other 82 comments were on very diverse topics. This prevented the evaluation of any definitive pattern in comments with the use of semi-quantitative data analysis software.


 ,
, 


