Article

Flame Characteristics and Response of a High-Pressure LOX/CNG Rocket Combustor with Large Optical Access

1
Institute of Space Propulsion, German Aerospace Center (DLR), 74239 Lampoldshausen, Germany
2
Institute of Jet Propulsion and Turbomachinery, RWTH Aachen University, 52062 Aachen, Germany
*
Author to whom correspondence should be addressed.
Aerospace 2022, 9(8), 410; https://doi.org/10.3390/aerospace9080410
Submission received: 17 June 2022 / Revised: 26 July 2022 / Accepted: 27 July 2022 / Published: 29 July 2022
(This article belongs to the Special Issue Liquid Rocket Engines)

Abstract

:
Hot-fire tests were performed with a single-injector research combustor featuring a large optical access (255 × 38 mm) for flame imaging. These tests were conducted with the propellant combination of liquid oxygen and compressed natural gas (LOX/CNG) at conditions relevant for main- and upper-stage engines. The large optical access enabled synchronized flame imaging using OH* and CH* radiation wavelengths covering an area of the combustion chamber from the injection plane to shortly before the contraction section of the nozzle for two sets of operating conditions. Combined with temperature, pressure and unsteady pressure measurements, these data provide a high-quality basis for validation of numerical modeling. Flame width and opening angle were extracted from the imaging in order to determine the flame topology. A two dimensional Rayleigh Index was calculated for an acoustically unexcited and excited interval. These Rayleigh Indices are in good agreement with the thermoacoustic state of the chamber.

1. Introduction

Liquid propellant rocket engines (LPREs) are a key technology of global launcher propulsion. Because it is predicted to be cheaper, easier to handle and more promising in terms of reusability [1,2] there is a growing interest in the propellant combination of liquid oxygen and methane (LOX/CH 4 ). Examples of LOX/CH 4 engine development programs are the Japanese LE-8 [3], the Chinese TQ-11 and TQ-12, the European Prometheus [4] and M-10, and the Raptor and BE-4 in the US [2].
Due to its direct influence on flame anchoring, combustion stability, system pressure and overall performance, the injector design [5,6] is a crucial element in the development of LPREs. The shear coaxial type of injector has proven itself in LOX/hydrogen (LOX/H 2 ) engines, and since the density difference of LOX and CH 4 at injection is also significant, they are expected to be well suited for LOX/CH 4 engines too. Since the design of a coaxial injector is based upon the velocity difference of the injected high- and low-density propellants, the velocity ratio (VR) of fuel injection velocity ( u f ) to oxidizer injection velocity ( u o )
V R = u f u o
and the complementary momentum flux ratio (J) including the density of fuel ( ρ f ) and oxidizer ( ρ o ) and, thus, a pressure dependency
J = ρ f u f 2 ρ o u o 2
are important design parameters. They are an indicator of the shear forces arising from the velocity difference of the injected propellants and thus the degree of driving of atomization and mixing [5,6,7]. For modern LOX/Hydrogen (LOX/H 2 ) engines the VR ranges between 10 and 20 [6,8,9,10], but no comparable data are available for operational LOX/CH 4 engines. Previous experimental work operated their injection element in VR ranges from 5–52 [11,12,13,14].
Often the injectors are placed in sub-scale experiments to validate the desired performance before implementing into full-scale engines. A more resource-saving approach is the use of CFD simulations in the process of developing new injectors and rocket engines. Numerical modeling of the highly turbulent reactive flow including large thermal gradients from cryogenic fluids up to temperatures of more than 3500 K, real gas effects and combustion of non-premixed diffusion flames is still a challenging topic. Depending of the injection pressure (sub- or supercritical) either the droplet atomization and vaporization or pseudo-boiling has to be modeled additionally [15].
These processes also contribute to oscillating heat release ( q ˙ ). If the heat release is in phase with the pressure oscillations ( p ) in the chamber the necessary condition for harming high-frequency (HF) combustion instabilities is met. The Rayleigh Criterion provides a mathematical description of this criterion
0 T V p ( x , t ) q ˙ ( x , t ) d V d t > 0 .
While p can be easily extracted from the experiment, this is very difficult for q ˙ .
In former studies regarding flame–acoustic interaction in LPRE combustion, OH* radiation measurements have been used as a marker for heat release rate [16,17,18]. Recent investigations [19,20] reveal that ultraviolet (UV/OH*) radiation suffers from high self-absorption at pressures relevant for most LPREs. The measured intensity is dominated by emissions from the side of the flame closest to the observer, and is not a line-of-sight integrated intensity. Further limitation is given for temperatures above 2700 K, where OH* emission is driven rather by thermal excitation than chemiluminescence. Thus, no direct relation between its measurement and q ˙ is given. Investigations regarding the blue spectral region (BR/CH*) suggests that blue radiation does not suffer from this shortcoming and therefore provides a greater depth of view [19,20]. Still, the lack of an established proportionality between line-of-sight integrated radiation measurements and q ˙ , neither for blue nor ultraviolet wavelengths, is an hindrance. However, correlation of the intensity measurements with the pressure can give a qualitative indication of the interaction.
A more straightforward approach is the direct extraction of q ˙ from simulations [21,22], considering that the aforementioned processes are captured correctly. Thorough validation of numerical models for injection and combustion requires not only experimentally determined global parameters such as combustion chamber pressure and mass flow rates, but also highly detailed information concerning flow parameters and boundary conditions. Hence, there is a need for suitable experimental data [23,24]. Here, subscale combustion chambers play a special role because these allow the use of an optical access in combination with high-resolution optical systems.
The DLR optical rocket combustor model ‘N’ (BKN) addresses the aforementioned lack of validation test cases. The experiment is extensively equipped with conventional diagnostics, such as thermocouples and pressure sensors and thus able to provide well-defined boundary conditions. The large optical access enables the examination of a great portion of the flame such as steady state time averaged flame properties and thermoacoustic interaction in response to different sets of operating conditions. This work presents experiments with BKN and the same experimental setup as in previous experiments with LOX/H 2 [25], but with the distinction of using the propellant combination of LOX and compressed natural gas (CNG). High-speed flame emission imaging of the OH* and CH* radiations was conducted.
First the experimental setup including the optical diagnostics and operating conditions will be presented. Then the methodology of the performed analysis will be described. Finally, the influence of two operating conditions on the flame topology will be discussed and the flame response during an interval of heightened acoustic excitation of the first longitudinal resonance frequency (1 L mode) of the chamber will be compared to a non-excited interval.

2. Experimental Method

2.1. Combustion Chamber

The hot-fire tests presented in this work were conducted at the European Research and Technology Test Facility P8 [26] for cryogenic rocket engines with BKN. The experimental hardware consists of a single-element injector head, an optical chamber segment with 50 mm diameter and a convergent divergent nozzle with a throat diameter ( d t ) of 14.5 mm. and an overall length ( l c c ) from injection plane to nozzle throat of 359 mm. This results in a characteristic length (L*) of 4.05 m, which is quite normal for a single-injector, optically accessible combustor. The schematic of the combustor configuration is illustrated Figure 1.
The geometry of the optical access’ inner surface matches the contour of the combustion chamber wall to minimize disturbance to the symmetry of the flow field in the combustion chamber [25].
In order to provide an extensive set of boundary conditions, at least one thermocouple, static pressure sensor and unsteady pressure sensor are mounted to the manifolds for LOX ( T o , P o , p o ), CNG ( T f , P f , p f ) and window cooling ( T c , P c , p c ). The chamber segment features the same kind of measurement devices. Thermocouples sampled at a rate of 100 Hz are mounted to the chamber segment in two different ways. A total of 13 thermocouples ( T c c , 1 13 ) protrude approximately 0.1 mm into the chamber and are distributed every 20 mm between 4.5 mm and 244.5 mm downstream of the injection plane. An additional 12 thermocouples ( T c c s , 1 12 ) are mounted within the walls in contact with the structure, 1 mm back from the combustion chamber wall and also placed every 20 mm between 34.5 mm and 254.5 mm downstream of the faceplate. Static pressure sensors ( P c c , 1 13 ) sampled at a rate of 100 Hz are connected to the chamber at 13 axial positions every 20 mm between 4.5 mm and 244.5 mm and, therefore, at the same axial positions as T c c , 1 13 . For acoustic measurements, six flush mounted unsteady pressure sensors are positioned at distances of 34.5 mm, 84.5 mm, 94.5 mm, 134.5 mm, 164.5 mm and 234.5 mm downstream of the faceplate. The signals are sampled at a rate of 100 kHz and have a measurement range of ± 30 bar.
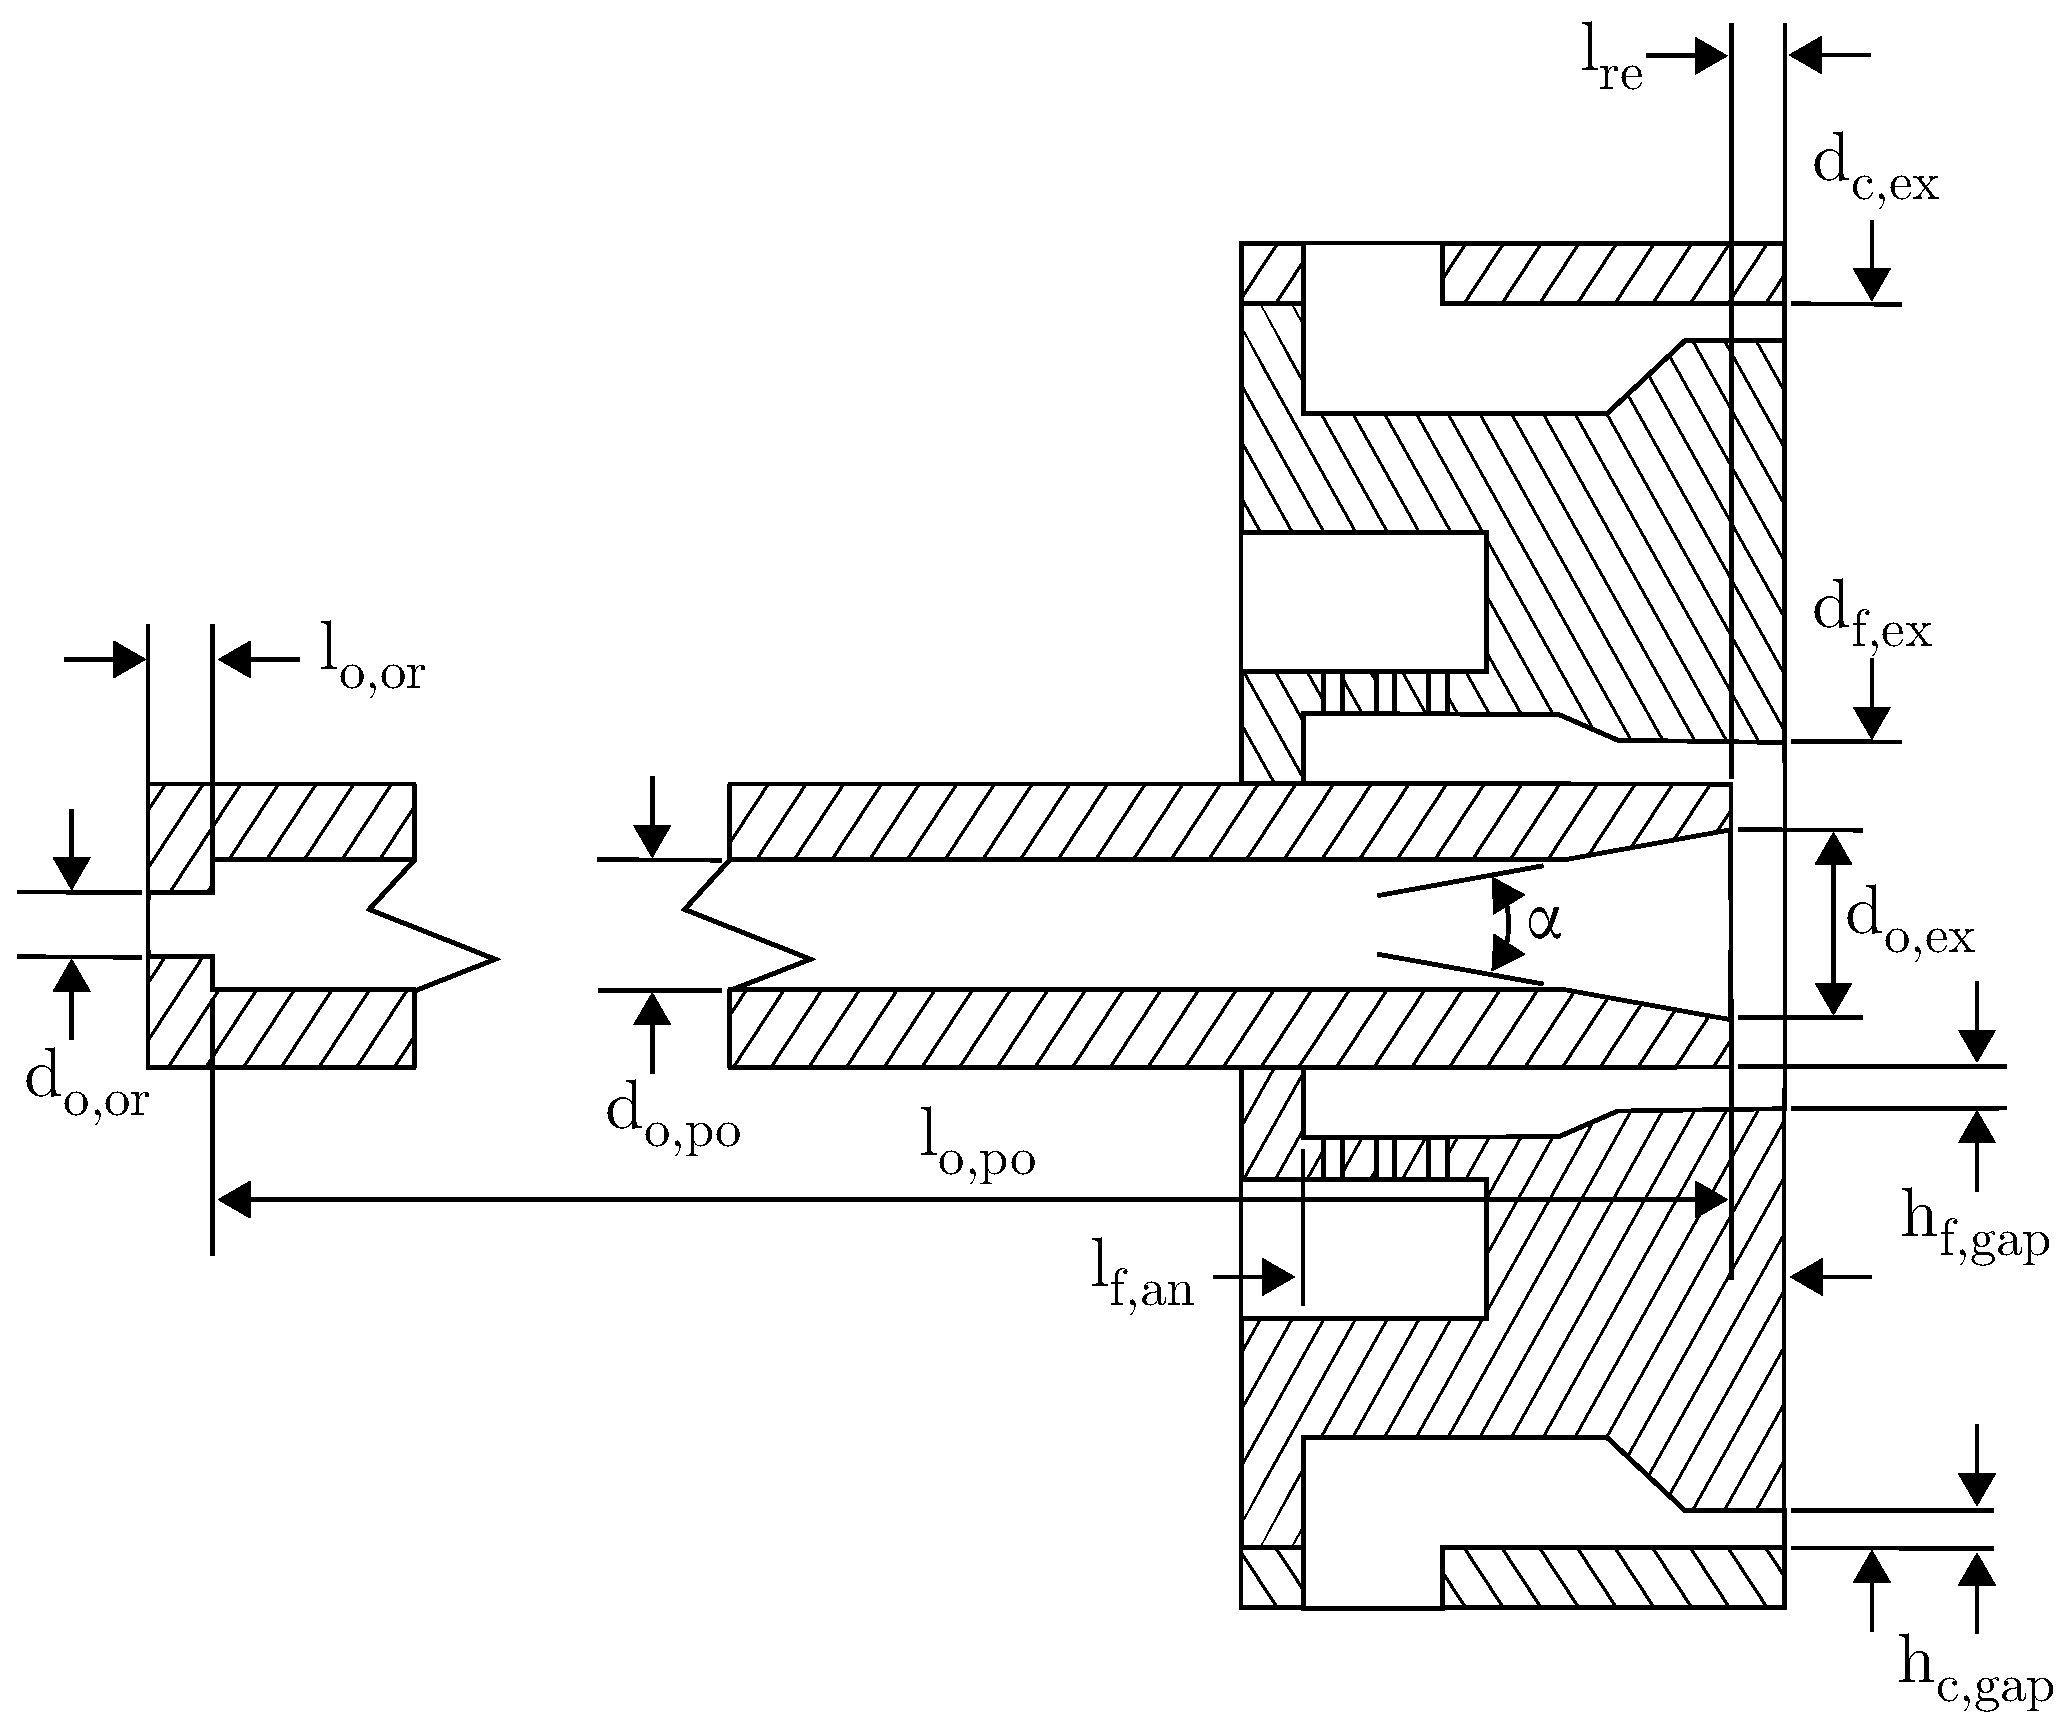
LOX and CNG are injected through a shear coaxial injection element with a tapered LOX post. A shear coaxial element was chosen to allow direct comparability with LOX/ H 2 combustion since the density of CNG is an order of magnitude lower than LOX, giving the necessary density ratio crucial for this kind of injector. Film cooling with CNG reducing the heat load on the optical access, without affecting the imaging quality, is also injected via an annular gap between chamber wall and faceplate. Both injection systems are illustrated in Figure 2. The dimensions of the injection system are given in Table 1.

2.2. Flame Radiation Imaging

The flame emission of UV and BR were investigated within this experiment. Hydrocarbon flames exhibit a more complex emission spectrum (Figure 3) than pure hydrogen flames [20]. Nevertheless, assumptions, based on pure hydrogen flames can be transferred to flames of methane combustion due to the dominating effect of the hydrogen atoms in the chemical reaction.
A previous study [27] on the combustion of liquid methane and liquid oxygen under high pressure in a rocket combustor revealed optical spectra as depicted in Figure 3. At the time the spectrum was recorded, a combustion chamber pressure of 11.5 bar was measured. The ultraviolet spectral regime is clearly dominated by the intense radiation of the OH* radical with a major emission band around 307 nm and a less pronounced band around 285 nm. Higher wavelengths of the visible range up to 700 nm show a continuous radiation background. However, only the CH* emission band at 436 nm appeared clearly with a sufficient signal to noice ratio. Emission bands of other constituents such as CO 2 and C 2 could not be detected using a spectrograph with a focal length of 163 mm and a reflecting grating with 150 grooves/mm.
In conclusion, three molecule species contribute to the UV-Vis regime of the spectrum: The excited hydroxyl radical (OH*) with its intense emission bands around 310 nm, the excited H 2 O 2 molecule which is theorized to strongly contribute to the broad spectral continuum around 450 nm [28] and the methylidyne radical (CH*) at 436 nm [27]. While Equation (4) describes the path for OH* production according to Kathrotia et al. [29] and Leo et al. [30], Equation (5) describes the same for CH* according to Kojima et al. [31] and Gaydon et al. [32]. The constituent M is an arbitrary species in the system that is necessary for conservation of momentum. Formation of the H 2 O 2 radical is depicted in Equation (6) as described by Padley [33]. Other possible radiation sources, such as the Schumann–Runge lines of the O 2 molecule, can be neglected [34]. The high-speed camera system using the bandpass filter for λ = 436 nm thus records the contribution of mainly H 2 O 2 and CH* radiation.
Both ultraviolet and blue spectral regimes respond to increasing pressure with a higher emissivity. However, while for ambient conditions the UV radiation is predominant, a pressure of more than 60 bar results in a visible (BR) radiation that is the most intense spectral feature [20].
H + O + M OH * + M
C + H + M CH * + M
OH + OH H 2 O 2 *

2.3. Optical Setup

Flame and combustion visualization of UV and BR was carried out using two synchronously and coaxially recording high-speed camera systems. A dichroic mirror (transparent for visible light and reflective for UV radiation) split the optical axis in order to obtain an identical field of view for both camera systems. Compressed air-cooled metal housing prevented the optical setup from overheating and mechanical damage.
The blue (CH*) flame emission was recorded by a Photron® Fastcam SA-Z type 2100K-M-64G camera model. Its proprietary design, advanced CMOS image sensor, has an active area of 20.48 × 20.48 mm and 1024 × 1024 pixels, respectively. The RAM capacity of 64 GB allows the storage of 43,682 frames at full resolution. Flame emission, without background illumination, was recorded with 2000–20,000 fps and exposure times of 2.5–250 µs. A Carl Zeiss® Makro-Planar ZF.2 lens with f = 100 mm and an aperture of 2.8 was used, equipped with a band pass filter (CWL: 436 nm; FWHM: 10 nm; T(436 nm): 50%) from Andover Corporation (Figure 4, right).
Ultraviolet radiation (OH* chemiluminescence) was recorded using an image-intensified Photron® Fastcam SA-X2 type 480K-M4 high-speed camera, also equipped with an identical proprietary design advanced CMOS image sensor. Frame rates of 2000–20,000 Hz were applied. The UV radiation was converted into visible light using a Hamamatsu® image intensifier, model C10880 GHD1101, which was attached to the camera’s lens mount. Gate width and gain were set for optimal image quality. A Nikon® UV-Nikkor f = 105 mm lens with an aperture of 4.5 was used, equipped with a UV band pass filter (CWL— 306.8 nm; FWHM— 10 nm; T(306.8 nm)— 64% (Figure 4, left).

2.4. Operating Conditions

In this test campaign with BKN and the propellant combination, LOX/CNG tests were conducted at chamber pressures of up to 66 bar and ROFs at the main injector of up to 3. Data of two load points (LPs) originating from two different test runs are presented in this work.
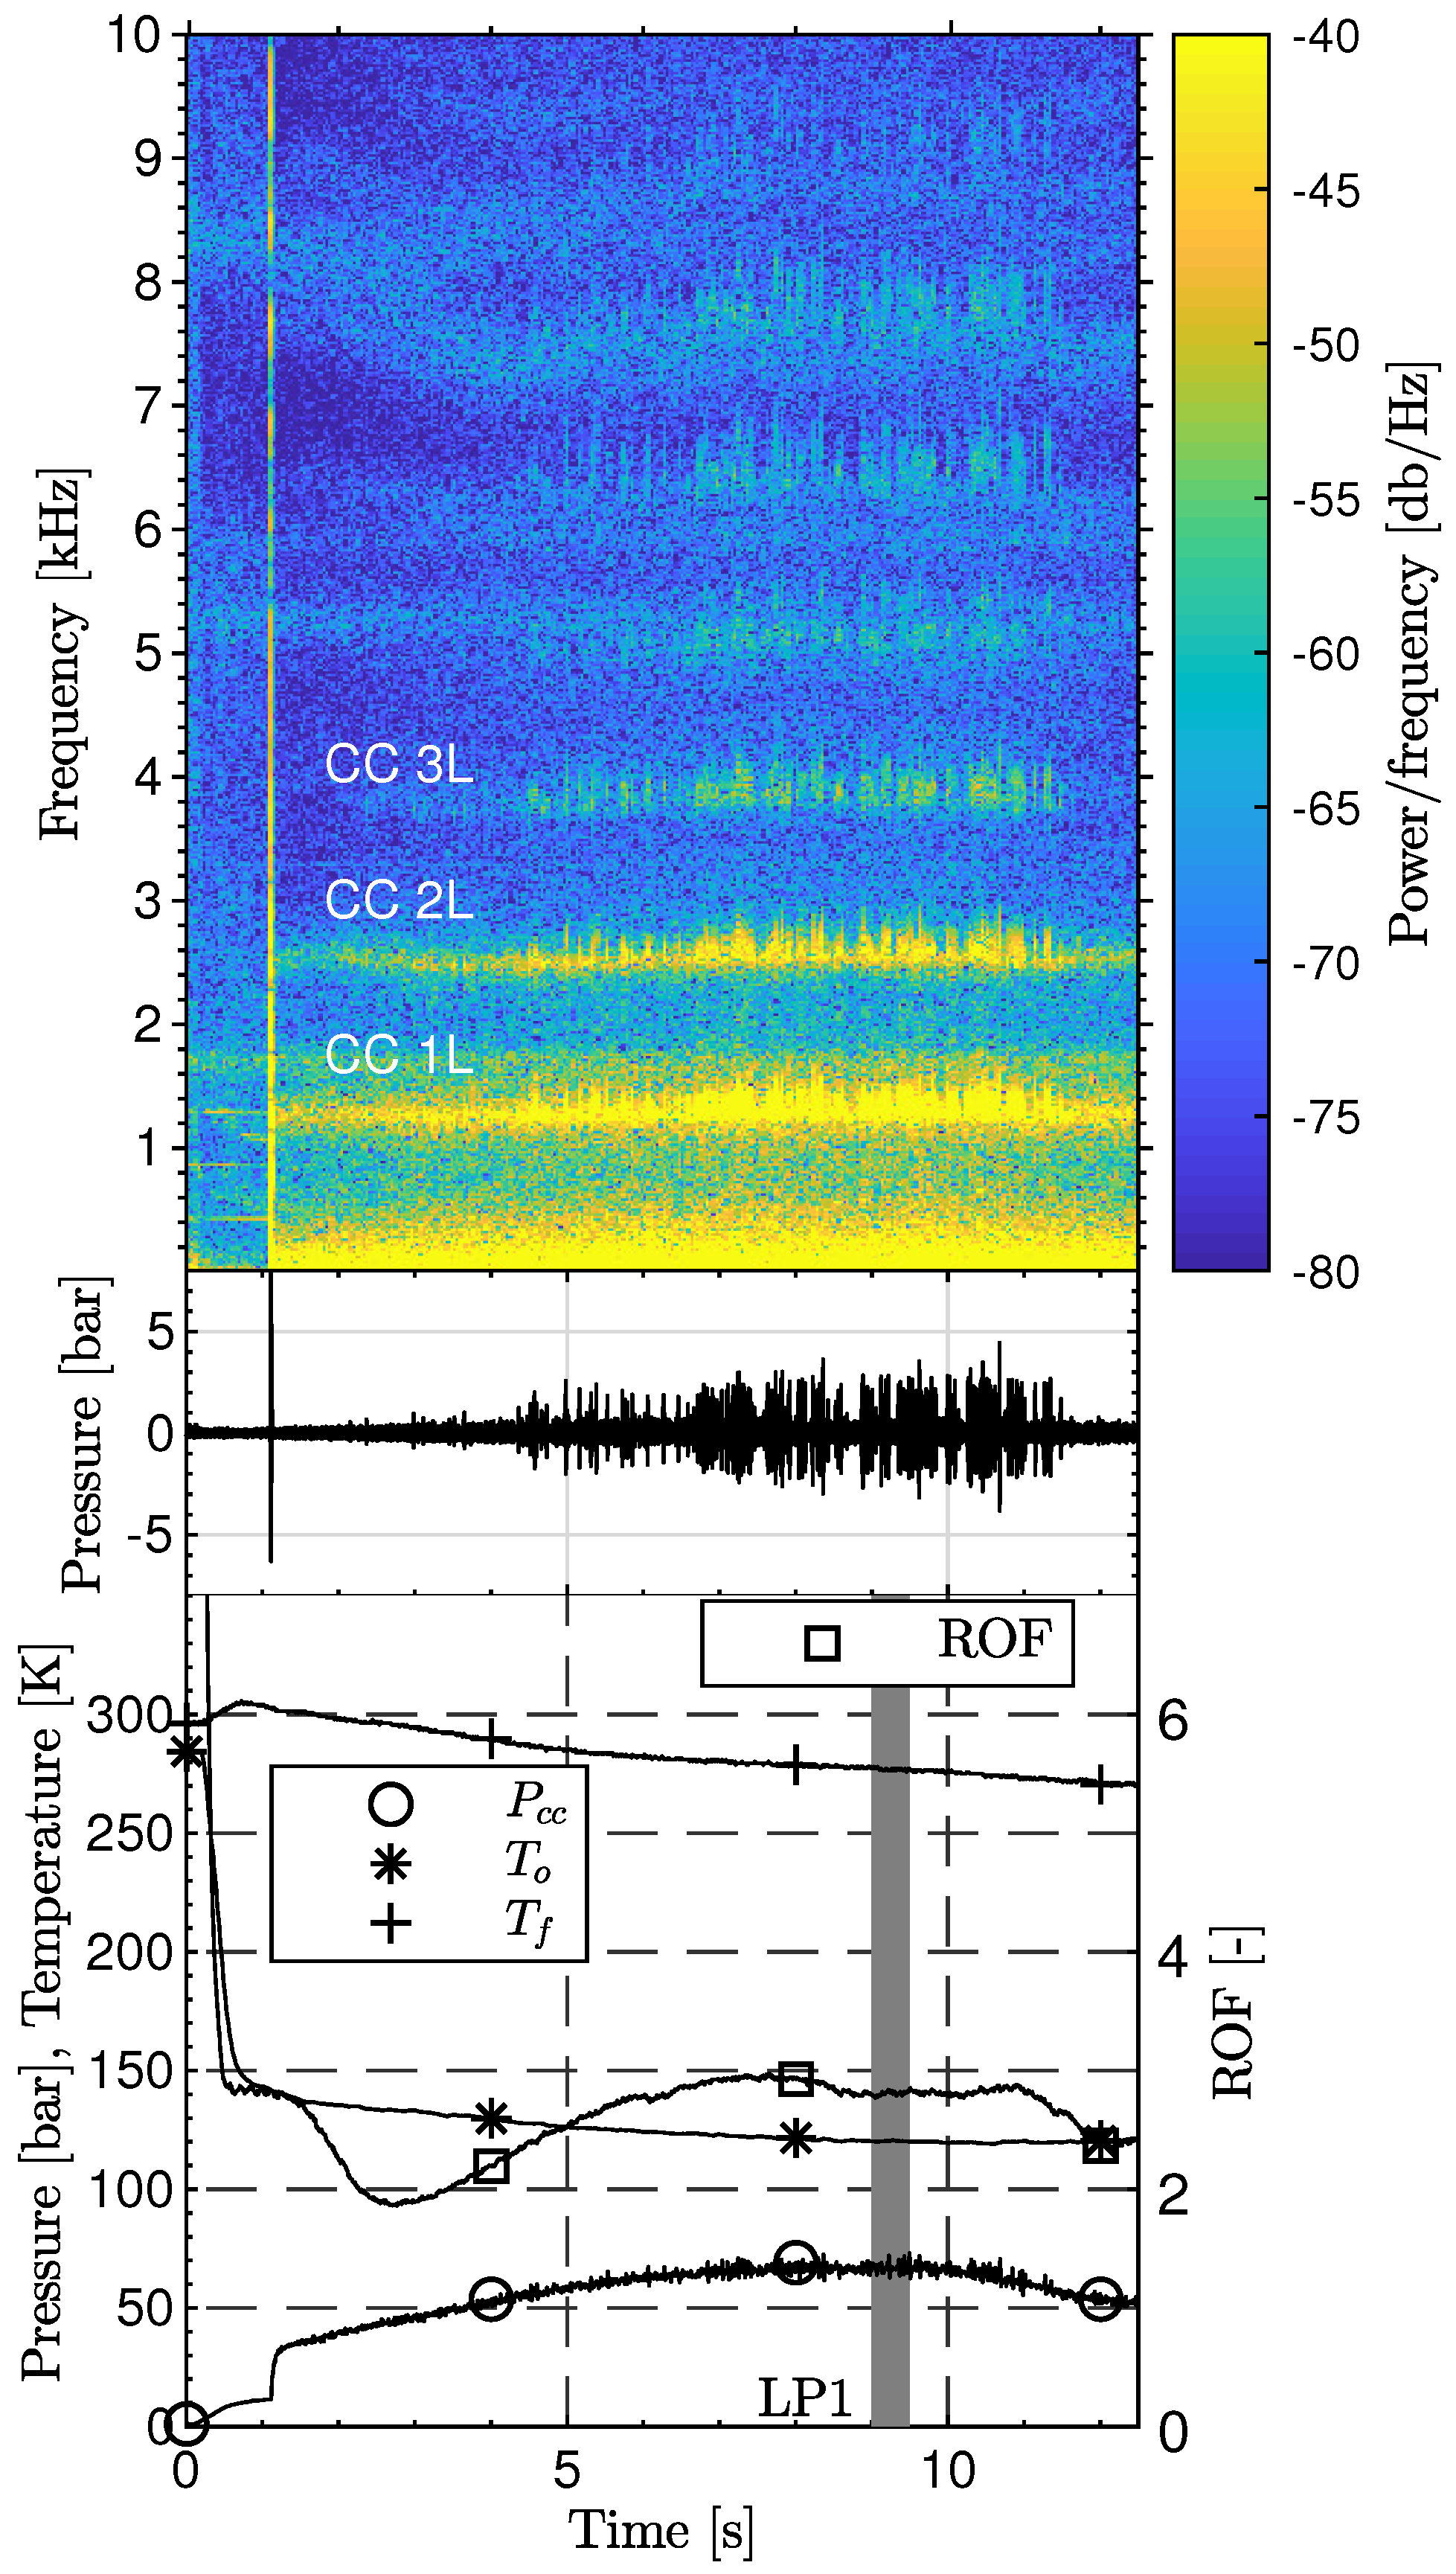
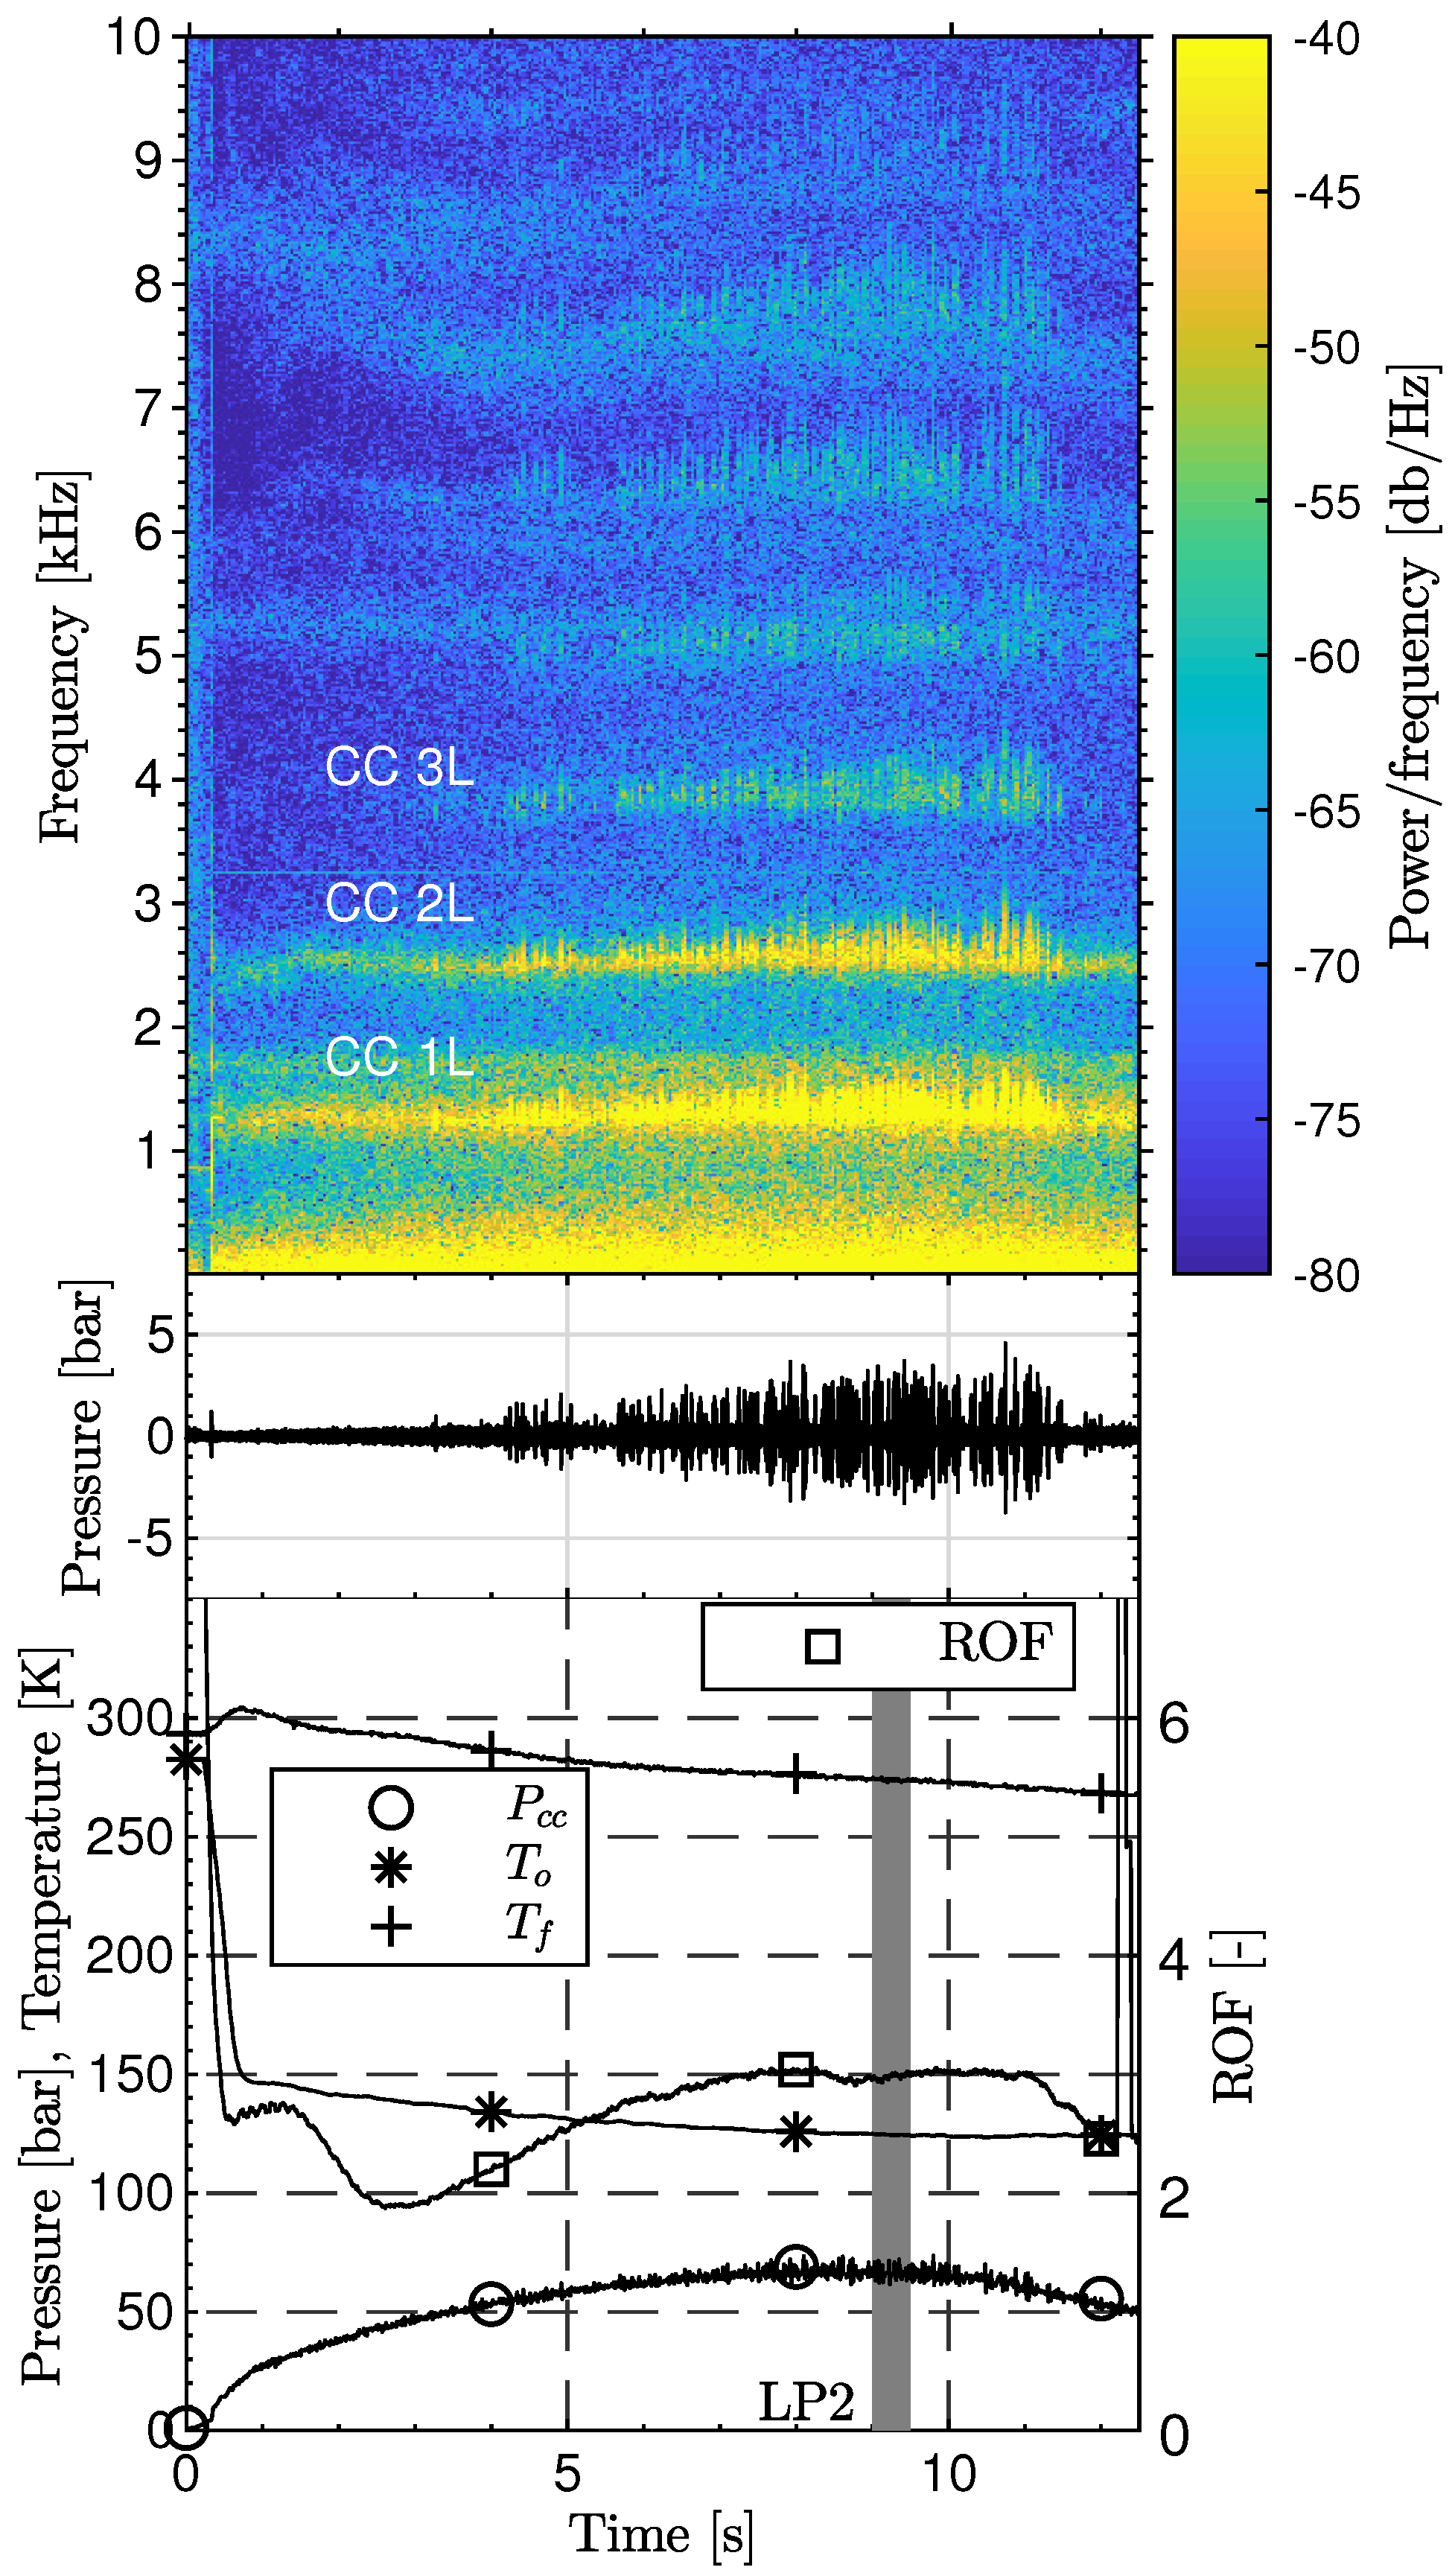
Both tests are presented in Figure 5 and Figure 6. The test sequences are described with traces of the static chamber pressure P c c , LOX injection temperature T o , CNG injection temperature T f , and ratio of oxidizer to fuel mass flow rate ROF (bottom). These traces of parameters describe the perfomed sequence of operating conditions, while the raw unsteady pressure signal (middle) and the spectrogram (top) describe the acoustic character. Here, the frequency of the first longitudinal (1 L) resonance frequency at approximately 1.3 kHz is rouhgly half the value as in previous testing with the same combustor and similar P c c but with LOX/H 2 propellants. The duration of each load point is at least about 0.4 s, which allows a steady-state thermal equilibrium condition to be reached. The intervals used for extracting the data of both LPs (9.1–9.5 s in each test) are highlighted in gray. High-speed imaging of OH* and CH* with 20 kfps for LP1 and 7.2 kfps for LP2 is available.
Both test runs are characterized by short-lived heightened excitation of the chamber 1 L mode. In the second test run these events seem to occur more often. Table 2 summarizes the steady state test condition and the injections condition for both load points. The data are mean values from a sample period of 0.4 s.

3. Methodology

3.1. Flame Topology Analysis

Two different aspects, the flame opening angle and flame width, were measured within the framework of the flame topology analysis. For the flame opening angle a threshold based flame boundary detection algorithm [25] was applied to a time averaged image of the corresponding LP. The first order polynomial for angle extraction was fitted to the flame boundary within the first 6% of the flames’ optically accessible length. This corresponds to 15.2 mm. For the flame width, mean values of each row were calculated. In this case, 75% of the peak intensity from the time-averaged OH* and blue radiation images were used to define the flame width at three-quarter maximum (FlW34M). Because no significant drop of the flame’s intensity was identifiable in the flow direction, a similar definition of the flame length was not applicable.

3.2. Flame Dynamics Analysis

Application of the dynamic mode decomposition (DMD) enables isolating the underlying dynamics in the data to its frequencies. The multi-variable implementation of DMD [18] allows a direct analysis of the high-speed imaging in relation to sensor data. Therefore, the latter data are resampled to the snapshots of high-speed imaging and added as pseudo-pixels to the input matrix of the DMD algorithm. After performing the decomposition, the matrix containing the spatial data of each mode is divided again in the imaging and sensor data. Thus, each type of measurement can be treated individually, but is filtered to modes containing the same frequency content.
The decomposed pressure oscillations gained from the DMD are used to reconstruct the pressure field in the chamber. A spline interpolation method is used to reconstruct a 1D-pressure distribution between faceplate and nozzle throat with the additional condition of zero pressure gradients at both ends and the chamber walls. Due to the analysis of a single injection element in this work, a uniform pressure field at any radial position within the chamber is assumed and the 1D-pressure distribution is extended to the whole chamber. Combining both (intensity and pressure) reconstructions, a 2D Rayleigh Index via Equation (7) for each (or multiple) frequencies referring to the decomposed mode(s) m can be calculated.
R I ( x , r ) = m ( | p ( x , r , f ( m ) ) | | I ( x , r , f ( m ) ) | cos ( Θ p I ( x , r , f ( m ) ) ) )
Here, I denotes the fluctuating part of the captured intensity, p the pressure oscillations and Θ p I the phase difference (according to Equation (8)) between those signals for each pixel in dependency of the reconstructed mode and thus the frequency.
Θ p I ( x , r , f ( m ) ) ) = Θ p ( x , r , f ( m ) ) Θ I ( x , r , f ( m ) )

4. Results and Discussion

4.1. Flame Characteristics

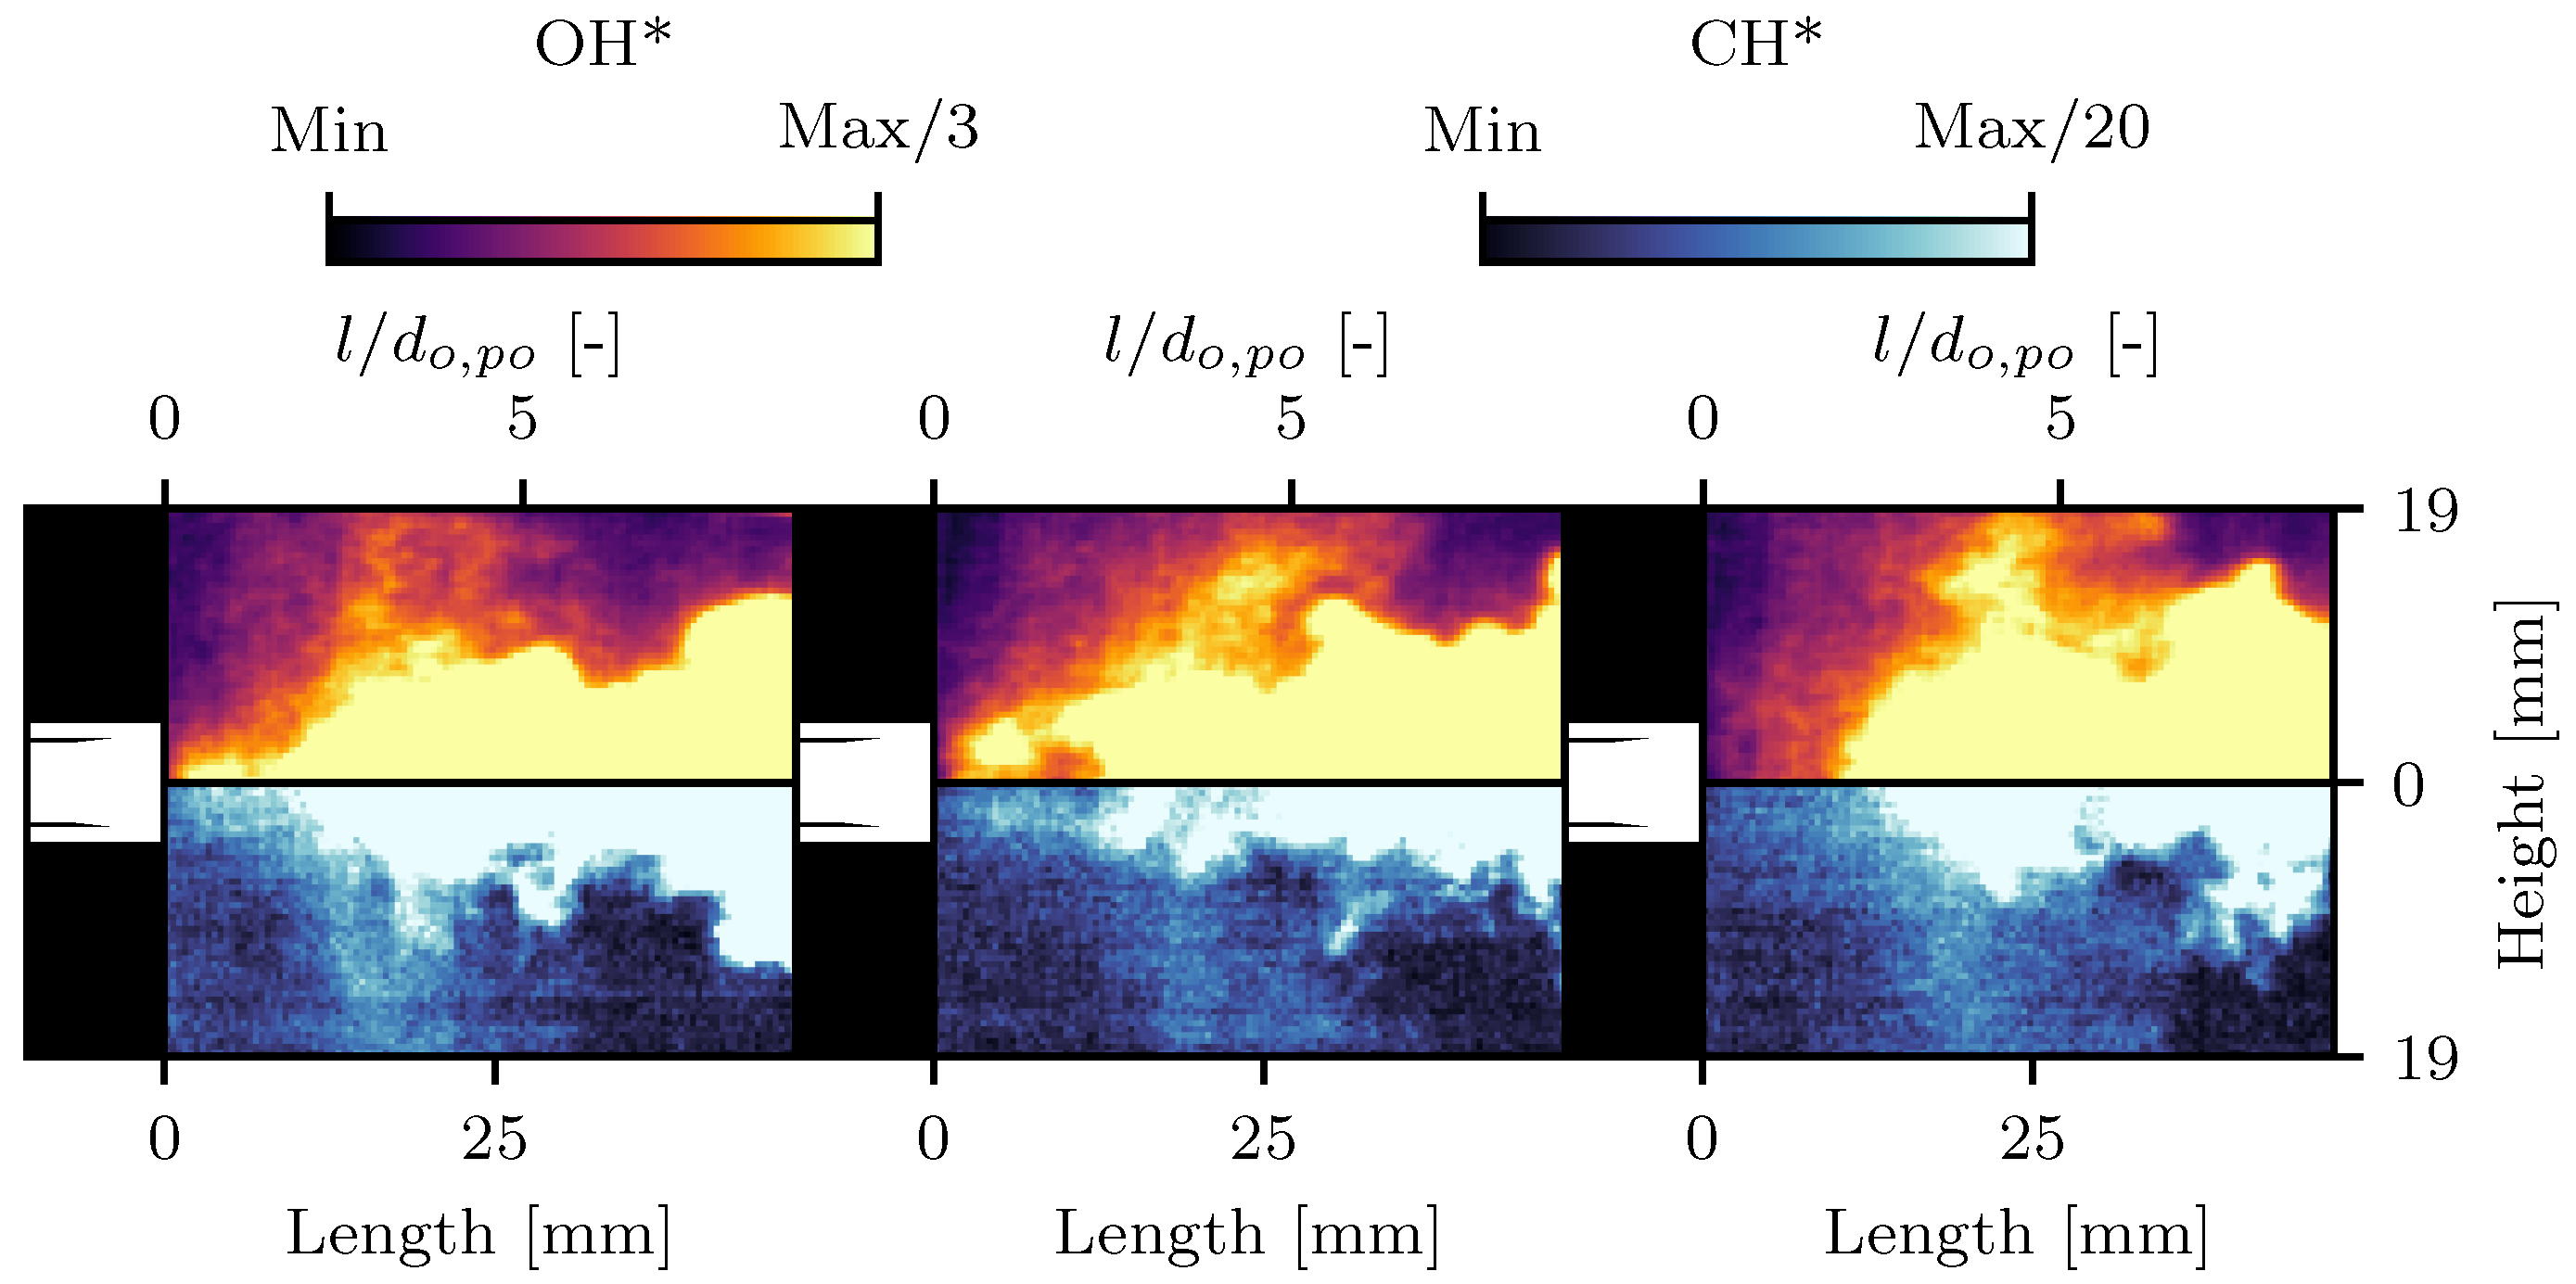
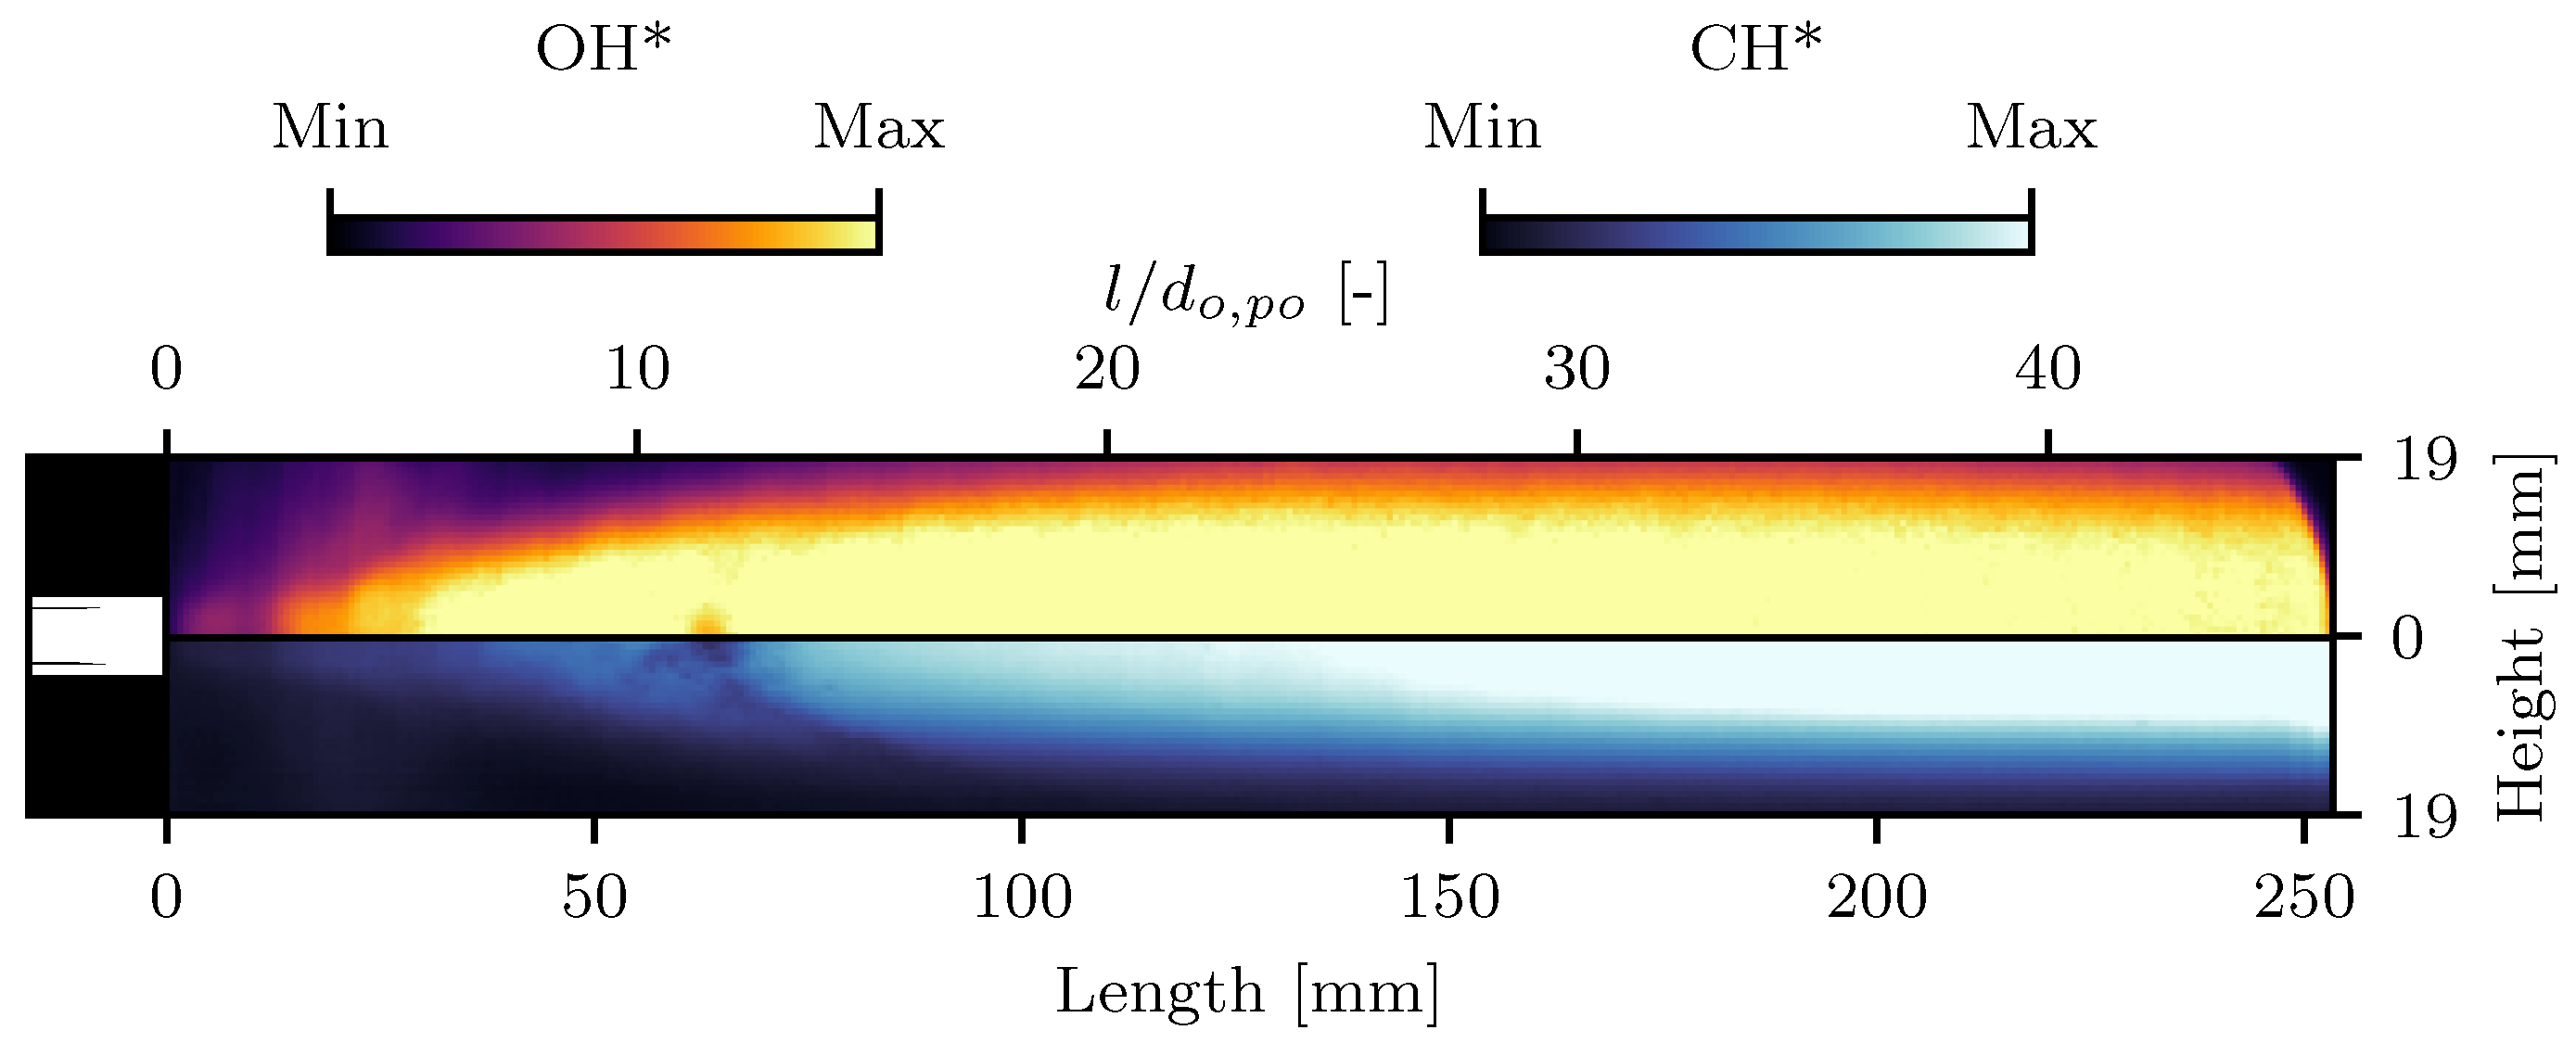
First, the flames’ topology will be examined for both LPs. It should be noted that all flame visualizations (Figure 7, Figure 8, Figure 9, Figure 10 and Figure 11) present the OH* on the top and the CH* imaging at the bottom. Both kinds of radiation also compare the same half of the flame in both UV and BR. The blue imaging in the lower half of the figures is a mirrored image of the upper half of the flame from the same instance as the OH* image. The amplification in the OH* image intensifier was set to a high value, enabling high contrasts in the near injector region. This leads to a nearly uniform intensity distribution further downstream.
Figure 7 visualizes three instantaneous snapshots extracted from the interval of LP1.
While the left snapshot shows a continuous intensity signal from the injection plane to the end of the enlarged view of the near injector region, this is not the case for the middle and the right ones. The middle snapshot illustrates circular structures, perhaps vortices, downstream of the LOX post-tip followed by a short absence of intensity. In the right snapshot, there is no intensity measurable at all in the first 12 mm. Therefore, these snapshots indicate a unstable flame anchoring, which is also present in LP2.
Figure 8 and Figure 9 show instantaneous snapshots from the flame radiation measurements and giving an insight into the highly turbulent character of the flame.
Figure 9, for LP2, further features an interruption with nearly diminished intensity. This implies detachment of big pockets of combustion products prior to the end of the optically accessible region.
Time-averaged images over the whole duration of each LP are illustrated in Figure 10 for LP1 and Figure 11 for LP2. From these, preliminary analysis of the injection parameters’ influence on the flame’s topology such as opening angle and flame width can be derived.
The injection parameters (VR and J) with the derived geometrical flame parameters (flame width and opening angle) are summarized in Table 3.
As already mentioned, the amplification of the OH* has been set to obtain a high contrast in the near injector region. Even low intensities of short appearance contribute to the mean image to a non-negligible extent. The shutter time of the CH* camera, on the other hand, has been adjusted to enable the visualization of intensity gradients and fluctuations through the whole flame. In short, the mean images in the UV emphasize short-term events, while the mean images in the BR have a more global character.
This explains the high uncertainty for the angles derived from OH* and the very different values from both kinds of measurements. The high opening angle for LP1 is a result of a combination of the unstable flame anchoring and the intermittent excitation of the chamber 1 L mode, which causes the flame to pulsate with exaggerated spreading. The increased value and uncertainty for LP2 could indicate a higher recurrence rate of these effects for the LP with lower ROF and thus a lower VR and J number as well. The angles and the flame width of the CH* measurements follow the expected trend of higher shear forces (higher value of VR and J) between both propellants leading to increased values for both geometrical parameters [25,35]. Due to the nearly uniform intensity distribution of the UV measurements over a great portion of the flame, a meaningful derivation of a flame width is not feasible. Since the extracted trends in terms of opening angle and flame width correspond to those observed in the previous tests with LOX/H 2 , it can be assumed that the flame opening angle grows asymptotically towards a certain limit with increasing momentum flux ratio and the flame length for LP1 should be shorter than for LP2.
The chamber’s boundary conditions are provided in terms of axially distributed hot gas temperatures, structural temperatures and pressure distribution in Figure 12, Figure 13 and Figure 14.
The axial development of both LPs is quite similar. Slightly increased temperatures are measured for LP2, which is to be expected since LP2 has a higher ROF and therefore the highest equilibrium gas temperature. For both LPs the temperature measurement feature a sudden increase of nearly 300 K between the probe location at 24.5 mm and 44.5 mm downstream of the faceplate. This probably results from the flame, which is not stable anchored at the LOX post-tip throughout the whole LPs, as illustrated in Figure 7.
The stagnation of the temperature increase, approximately 100 mm downstream of the injection plane, is hypothesized to be caused by an interaction of flame with the surrounding cooling film. After this stagnation, the temperature grows again asymptotically towards the maximum value at 204.5 mm between 950 K and 1000 K, followed by a slight decrease in the hot gas temperature. This indicates that the most intense combustion takes place upstream of this measurement location.
The stagnation of the temperature increase is also visible in the temperature measurements of the chamber wall, 1 mm distanced from the hot gas side (Figure 13). The sudden increase of the temperature is not captured in these measurements hence the first structural thermocouple is located 34.5 mm downstream of the injection plane. Slightly elevated values of the structural temperature for LP2 are consistent with the hot gas measurements.
The pressure distribution (Figure 14) within the chamber between 0 and 244.5 mm stays nearly constant along the chamber axis for both LPs. A slightly decreasing pressure is identifiable approaching the nozzle. This behavior was expected due to the high contraction ratio ( ϵ c ) of the nozzle. High values for ϵ c lead to nearly constant static pressure in the chamber while rapidly decreasing in the nozzle section.

4.2. Flame Response

Next, the results of a preliminary flame acoustic interaction analysis will be presented. Although the analysis is performed for LP1, it is qualitatively also applicable for LP2. Figure 15 shows the zoomed section of the pressure trace of LP1 between 9.2 and 9.5 s.
Within this section two different intervals are highlighted in gray. The first interval is characterized by small amplitudes in the high-frequency regime. The second interval features excitation of the chamber’s 1 L mode at approximately 1340 Hz. In the test sequence spectrograms for both load points (Figure 5 and Figure 6) it can be seen that the excitation of the chamber 1 L mode is more frequent for LP2. A potential explanation for this is the lower J-number, describing the less-effective mixing of the propellants.
A 2D Rayleigh Index combining fluctuating CH* radiation intensity and the acoustic field based on the unsteady pressure measurements and their phase correlation according to Equation (7) is illustrated in Figure 16 for the 1 L frequency in the first interval. The corresponding 2D Rayleigh Index for the second interval with excited amplitudes of the 1 L mode is given in Figure 17. It should be noted here that the fluctuating intensity has been normalized by the mean intensity and unsteady pressure signals by the mean chamber pressure. Both two-dimensional visualizations of the Rayleigh Indices have been plotted with the same limitations for the color axis. Therefore, qualitative and also, to a certain degree, quantitative comparisons are possible. While the red color indicates regions in which the intensity and pressure signal are in phase and thus the necessary condition for growing amplitudes is met, the absolute phase difference for both signals is greater than 90° in the blue region.
The overall integrated Rayleigh Index for both intervals is positive, which indicates that the necessary condition for growing thermoacoustic amplitudes is met. This seems reasonable considering an almost instantaneous transition from an unexcited to an excited state and thus only small perturbations are sufficient to switch between both thermoacoustic states. However, comparing both Rayleigh Indices, two major differences can be noticed. First the global interaction between the flame’s intensity and pressure is stronger for the excited interval of LP1. The integral Rayleigh Index over the whole optical accessible region shows a 17-times-higher value compared to the unexcited interval of LP1. Secondly, the response differs in the near injector region, which is known to play an important role in the stability of an engine [36,37]. While nearly no interaction occurs in first interval, a strong and positive interaction is identifiable for the second interval with an excitation of 1 L mode in the chamber.

5. Conclusions

Two different operating conditions met by a sub-scale rocket combustion chamber with large optical access were presented in this work. Within both LPs, periods of thermoacoustical stable and unstable behavior occurred.
The propellant combination LOX/CNG was injected through a shear coaxial injection element. For both load points, the steady-state flame opening angle was extracted from simultaneous radiation imaging filtered in the UV and blue wavelength ranges. For the measurements in the blue regime, the flame width was extracted additionally. A measurement for the flame length was not feasible; hence, no significant drop in intensity was noticeable in the optically accessible region. However, consolidation of these measurements with the axial development of temperature and pressure signals give well-defined information on the boundary conditions in the combustion chamber and enhances its utility as a test case for validating numerical modeling of LOX/CNG flames.
The influence of the momentum flux ratio and the velocity ratio on the flame’s topology has been analyzed. Higher values of those injection parameters lead to a wider flame and steeper opening angle for the CH* intensity measurements. These findings are in good agreement with the enhanced mixing due to increased J values proposed by the literature. On the other hand, the OH* intensity measurements showed the opposite behavior. Here, the amplification of the intensity was adjusted to provide high intensities in the near injector region. The higher measured angles are hypothesized to be a result of short-lived periods of a lifted flame and intermittent excitation of the first longitudinal resonance mode of the chamber. The increased value of opening angle and its uncertainty for LP2 thus indicate that the recurrence rate of the aforementioned flame events is higher. The analyzed optical data indicates unstable flame anchoring for shear coaxial injection elements and the propellant combination of LOX/CNG for the tested operating conditions.
As expected, the measured hot gas and structural temperatures were higher for the LP with an ROF of 3. Due to the high contraction ratio, the pressure distribution stayed nearly constant along the chamber axis for each load point before entering the nozzle section.
The calculated 2D Rayleigh Indices were in good agreement with the observed combustion behavior. During the interval of the heightened excitation of the chamber’s first longitudinal resonance frequency, a more intense flame response is noticeable. Additionally a higher interaction between pressure and flame occurred, especially in the near injector region, which is in good agreement with the literature, where the near injector region is shown to strongly contribute to engine stability. These findings provide early insights into the kind of flame dynamics that can arise for LOX/CNG combustion from main-stage scale shear coaxial injectors.

Author Contributions

Conceptualization, J.S.H.; formal analysis, J.M.; investigation, J.M., W.A., D.S. and J.S.H.; resources, R.S.; data curation, J.S.H.; writing—original draft preparation, J.M. and R.S.; writing—review and editing, J.M., W.A., R.S., D.S., J.S.H. and M.O.; visualization, J.M.; supervision, J.S.H. and M.O.; project administration, J.S.H. All authors have read and agreed to the published version of the manuscript.

Funding

This research received no external funding.

Acknowledgments

The work is associated with DLR project of Advanced Methods for reusable Aerospace vehicle DEsign Using artificial intelligence and interdisciplinary numerical Simulation (AMADEUS) and Future Fuels. The authors would also like to thank the crew of the P8 test bench. Special thanks to Alex Grebe for his assistance in preparing and performing the experiments.

Conflicts of Interest

The authors declare no conflict of interest.

References

  1. Hurlbert, E.A.; Ueno, H.; Alexander, L.; Klem, M.D.; Daversa, E.; Rualt, J.-M.; Manfletti, C.; Caruana, J.-N.; Asakawa, H.; Whitley, R.J. International Space Exploration Coordination Group Assessment of Technology Gaps for LOx/Methane Propulsion Systems for the Global Exploration Roadmap. In Proceedings of the AIAA SPACE, Long Beach, CA, USA, 13–16 September 2016. [Google Scholar]
  2. Klem, M.D. LOX/Methane In-Space Propulsion Systems Technology Status and Gaps. In Proceedings of the Southwest Emerging Technology Symposium, El Paso, TX, USA, 1 April 2017. [Google Scholar]
  3. Asakawa, H.; Nanri, H.; Aoki, K.; Kubota, I.; Mori, H.; Ishikawa, Y.; Kimoto, K.; Ishihara, S.; Ishizaki, S. The Status of the Research and Development of LNG Rocket Engines in Japan. In Chemical Rocket Propulsion; De Luca, L., Shimada, T., Sinditskii, V., Calabro, M., Eds.; Springer International Publishing: Cham, Switzerland, 2016; pp. 463–487. [Google Scholar]
  4. Simontacchi, P.; Blasi, R.; Edeline, E.; Sagnier, S.; Ravier, N.; Espinoas-Ramos, A.; Breteau, J.; Altenhoeffer, P. Prometheus: Precursor of new low-cost rocket engine family. In Proceedings of the 8th European Conference for Aeronautics and Space Sciences, Madrid, Spain, 1–4 July 2019. [Google Scholar]
  5. Gill, G.; Nurick, W. Liquid rocket engine injectors. In NASA-SP-8089; National Aeronautics and Space Administration: Washington, DC, USA, 1972. [Google Scholar]
  6. Huzel, D.K.; Huang, D.H. Modern Engineering for Design of Liquid-Propellant Rocket Engines; American Institute of Aeronautics and Astronautics: Washington, DC, USA, 1992. [Google Scholar]
  7. Harrje, D.T.; Reardon, F.H. Liquid Propellant Rocket Combustion Instability; Scientific and Technical Information Office, National Aeronautics and Space Administration: Washington, DC, USA, 1972. [Google Scholar]
  8. Hulka, J.; Hutt, J.J. Instability Phenomenology and Case Studies: Instability Phenomena in Liquid Oxygen/Hydrogen Propellant Rocket Engines. In Liquid Rocket Engine Combustion Instability; Yang, V., Anderson, W.E., Eds.; American Institute of Aeronautics and Astronautics: Washington, DC, USA, 1995; pp. 39–71. [Google Scholar]
  9. Schmidt, G. Flames: Technik der Flüssigkeits-Raketentriebwerke; DaimlerChryslerAerospace: Ottobrunn, Germany, 1999. [Google Scholar]
  10. Hardi, J.S. Experimental Investigation of High Frequency Combustion Instability in Cryogenic Oxygen-Hydrogen Rocket Engines. Ph.D. Thesis, The University of Adelaide, Adelaide, Australia, 2012. [Google Scholar]
  11. Jensen, R.J.; Dodson, H.C.; Claflin, S.E. LOX/Hydrocarbon Combustion Intability Investigation. In NASA-CR-182249; Rockwell International Corp.: Milwaukee, WI, USA, 1972. [Google Scholar]
  12. Salgues, D.; Mouis, A.-G.; Lee, S.-Y.; Kalitan, D.; Pal, S.; Santoro, R. Shear and Swirl Coaxial Injector Studies of LOX/GCH4 Rocket Combustion Using Non-Intrusive Laser Diagnostics. In Proceedings of the 44th AIAA Aerospace Sciences Meeting and Exhibit, Reno, NV, USA, 9–12 January 2006. [Google Scholar]
  13. Locke, J.; Pal, S.; Woodward, R. Chamber Wall Heat Flux Measurements for a LOX/CH4 Propellant Uni-Element Rocket. In Proceedings of the 43rd AIAA/ASME/SAE/ASEE Joint Propulsion Conference and Exhibit, Cincinnati, OH, USA, 8–11 July 2007. [Google Scholar]
  14. Hulka, J.R.; Jones, G.W. Performance and Stability Analyses of Rocket Thrust Chambers with Oxygen/Methane Propellants. In Proceedings of the 46th AIAA/ASME/SAE/ASEE Joint Propulsion Conference and Exhibit, Nashville, TN, USA, 25–28 July 2010. [Google Scholar]
  15. Banuti, D.; Raju, M.; Ma, P.C.; Ihme, M.; Hickey, J.-P. Seven questions about supercritical fluids–towards a new fluid state diagram. In Proceedings of the 55th AIAA Aerospace Sciences Meeting, AIAA 2017-1106, Grapevine, TX, USA, 9–13 January 2017. [Google Scholar]
  16. Richecoeur, F.; Scouflaire, P.; Ducruic, S.; Candel, S. High-Frequency Transverse Acoustic Coupling in a Multiple-Injector Cryogenic Combustor. J. Propuls. Power 2006, 22, 790–799. [Google Scholar] [CrossRef]
  17. Hardi, J.S.; Beinke, S.K.; Oschwald, M.; Dally, B.B. Coupling of Cryogenic Oxygen-Hydrogen Flames to Longitudinal and Transverse Acoustic Instabilities. J. Propuls. Power 2014, 30, 991–1004. [Google Scholar] [CrossRef]
  18. Beinke, S.K. Anaylses of Flame Response to Acoustic Forcing in a Rocket Combustor. Ph.D. Thesis, The University of Adelaide, Adelaide, Australia, 2017. [Google Scholar]
  19. Fiala, T.; Sattelmayer, T. Heat release and UV–Vis radiation in non-premixed hydrogen–oxygen flames. Exp. Fluids 2015, 56, 144. [Google Scholar] [CrossRef]
  20. Fiala, T.; Sattelmayer, T.; Gröning, S.; Hardi, J.; Stützer, R.; Webster, S.; Oschwald, M. Comparison Between Excited Hydroxyl Radical and Blue Radiation from Hydrogen Rocket Combustion. J. Propuls. Power 2017, 33, 490–500. [Google Scholar] [CrossRef]
  21. Hakim, L.; Ruiz, A.; Schmitt, T.; Boileau, M.; Staffelbach, G.; Ducruix, S.; Cuenot, B.; Candel, S. Large Eddy Simulations of Multiple Transcritical Coaxial Flames Submitted to a High-Frequency Transverse Acoustic Modulation. Proc. Combust. Inst. 2015, 35, 1461–1468. [Google Scholar] [CrossRef]
  22. Urbano, A.; Douasbin, Q.; Selle, L.; Staffelbach, G.; Cuenot, B.; Schmitt, T.; Ducruix, S.; Candel, S. Study of Flame Response to Transverse Acoustic Modes from the LES of a 42-Injector Rocket Engine. Proc. Combust. Inst. 2017, 36, 2633–2639. [Google Scholar] [CrossRef]
  23. Suslov, D.; Hardi, J.S.; Oschwald, M. Full length visualization of liquid oxygen disintegration in a single injector sub-scale rocket combustor. Aerosp. Sci. Technol. 2019, 86, 444–454. [Google Scholar] [CrossRef]
  24. Knab, O.; Riedmann, H.; Ivancic, B.; Höglauer, C.; Frey, M.; Aichner, T. Consequences of modeling demands on numerical rocket thrust chamber flow simulation tools. Prog. Propuls. Phys. 2019, 11, 317–346. [Google Scholar]
  25. Martin, J.; Armbruster, W.; Stützer, R.; General, S.; Knapp, B.; Suslov, D.; Hardi, J. Flame characteristics of a high-pressure LOX/H2 rocket combustor with large optical access. Case Stud. Therm. Eng. 2021, 28, 101546. [Google Scholar] [CrossRef]
  26. Haberzettl, A.; Suslov, D.; Brümmer, G.; Frank, A.; Oschwald, M. European Technology Test Facility for High Pressure Combustion P8. 20 Years Reserach and Technology Development; Deutscher Luft-und Raumfahrtkongress (DLRK): Braunschweig, Germany, 2016. [Google Scholar]
  27. Fdida, N.; Vingert, L.; Ordonneau, G.; Ristori, A.; Brossard, C.; Stützer, R.; Sender, J. Characterization of a Double Swirl Injector in a LOX/LCH4 Fueled Combustor on Mascotte Test Bench. In Proceedings of the 5th European Conference for Aeronautics and Space Sciences, Munich, Germany, 1–5 July 2013. [Google Scholar]
  28. Fiala, T. Radiation from High Pressure Hydrogen-Oxygen Flames and its Use in Assessing Rocket Combustion Instability. Ph.D. Thesis, Technical University of Munich, Munich, Germany, 2015. [Google Scholar]
  29. Kathrotia, T.; Fikri, M.; Bozkurt, M.; Hartmann, M.; Riedel, U.; Schulz, C. Study of the H + O + M Reaction Forming OH*: Kinetics of OH* Chemiluminescence in Hydrogen Combustion Systems. Combust. Flame 2010, 157, 1261–1273. [Google Scholar] [CrossRef]
  30. Leo, M.D.; Saveliev, A.; Kennedy, L.A.; Zelepouga, S.A. OH and CH Luminescence in Opposed Flow Methane Oxy-Flames. Combust. Flame 2007, 147, 435–447. [Google Scholar]
  31. Kojima, J.; Ikeda, Y.; Nakajima, T. Spatially resolved measurement of OH*, CH*, and C2* chemiluminescence in the reaction zone of laminar methane/air premixed flames. Proc. Combust. Inst. 2000, 28, 1757–1764. [Google Scholar] [CrossRef]
  32. Gaydon, A.G.; Wolfhard, H.G. Flames: Their Structure, Radiation, and Temperature; Chapman & Hall: London, UK, 1953. [Google Scholar]
  33. Padley, P.J. The origin of the blue continuum in the hydrogen flame. Trans. Faraday Soc. 1960, 56, 449–454. [Google Scholar] [CrossRef]
  34. Gaydon, A.G. Hydrogen Flames. In The Spectroscopy of Flames; Springer: Dordrecht, The Netherlands, 1974; pp. 99–126. [Google Scholar]
  35. Kendrick, D.; Herding, G.; Scouflaire, P.; Rolon, C.; Candel, S. Effects of a Recess on Cryogenic Flame Stabilization. Combust. Flame 1999, 118, 327–339. [Google Scholar] [CrossRef]
  36. Urbano, A.; Selle, L.; Staffelbach, G.; Cuenot, B.; Schmitt, T.; Ducruix, S.; Candel, S. Exploration of Combustion Instability Triggering Using Large Eddy Simulation of a Multiple Injector Liquid Rocket Engine. Combust. Flame 2016, 169, 129–140. [Google Scholar] [CrossRef]
  37. Schulze, M. Linear Stability Assessment of Cryogenic Rocket Engines. Ph.D. Thesis, Technical University of Munich, Munich, Germany, 2016. [Google Scholar]
Figure 1. Experimental combustion chamber configuration.
Aerospace 09 00410 g001
Figure 2. Injection system configuration [25].
Aerospace 09 00410 g002
Figure 3. Flame emission spectrum of a LOX/LCH 4 combustion at 11.5 bar [27].
Aerospace 09 00410 g003
Figure 4. Wavelength-dependent transmission of the optical bandpass filter with a center wavelength of 306.8 nm (left), and 436.0 nm (right) [25].
Aerospace 09 00410 g004
Figure 5. Test Sequences of first test with operating conditions and gray highlighted intervals used for extracting the data for load point 1.
Aerospace 09 00410 g005
Figure 6. Test Sequences of second test with operating conditions and gray highlighted interval used for extracting the data for load point 2.
Aerospace 09 00410 g006
Figure 7. Instantaneous snapshots of the OH* (top) and CH* (bottom) imaging in the interval between 9.1 and 9.5 s of LP1 with three different kinds of flame anchoring observed.
Aerospace 09 00410 g007
Figure 8. Instantaneous flame radiation imaging (OH*/CH*) of LP1.
Aerospace 09 00410 g008
Figure 9. Instantaneous flame radiation imaging (OH*/CH*) of LP2.
Aerospace 09 00410 g009
Figure 10. Time-averaged flame radiation imaging (OH*/CH*) of LP1.
Aerospace 09 00410 g010
Figure 11. Time-averaged flame radiation imaging (OH*/CH*) of LP2.
Aerospace 09 00410 g011
Figure 12. Temperature distribution of hot gas thermocouples downstream of injection plane.
Aerospace 09 00410 g012
Figure 13. Temperature distribution of thermocouples in chamber wall downstream of injection plane.
Aerospace 09 00410 g013
Figure 14. Pressure distribution in chamber downstream of injection plane.
Aerospace 09 00410 g014
Figure 15. High-pass filtered signal of p c c , 1 with a cut-off frequency of 300 Hz.
Aerospace 09 00410 g015
Figure 16. 2D Rayleigh Index of the chamber’s first longitudinal resonance mode based upon CH* radiation for the first interval in LP1.
Aerospace 09 00410 g016
Figure 17. 2D Rayleigh Index of the chamber’s first longitudinal resonance mode based upon CH* radiation for the second interval in LP1.
Aerospace 09 00410 g017
Table 1. Geometrical dimensions of injection systems.
Symbol d o , o r l o , o r d o , p o l o , p o
Unitmmmmmmmm
Value2.24.05.5127.0
Symbol d o , e x α l f , a n d f , e x
Unitmm°mmmm
Value6.3834.58.2
Symbol h f , g a p d c , e x h c , g a p l r e
Unitmmmmmmmm
Value0.550.00.44.0
Table 2. Steady state and injection conditions for both load points.
ParameterUnitLoad PointUncertainty
12
P c c bar66.866.2 ± 1.1 %
ROF 2.83.0 ± 5 %
m ˙ o kg/s0.3620.365 ± 3 %
m ˙ f kg/s0.1290.123 ± 3 %
m ˙ c kg/s0.2980.290 ± 3 %
T o K121125 ± 3.5  K
T f K279277 ± 3.5  K
T c K280277 ± 2.0  K
Table 3. Injection parameters and flame topology for both load points.
ParameterUnitLoad Point
12
V R 17.115.6
J 15.813.6
OH*
Opening angle°16 ± 828 ± 12
CH*
Opening angle°12.5 ± 6.59.5 ± 5.5
Flame widthmm20.3 ± 0.219.0 ± 0.2
Publisher’s Note: MDPI stays neutral with regard to jurisdictional claims in published maps and institutional affiliations.