Article

Development and Demonstration of a Novel Test Bench for the Experimental Validation of Fuselage Stiffened Panel Simulations

by
Panagiotis D. Kordas
*,
Konstantinos T. Fotopoulos
and
George N. Lampeas
Laboratory of Technology & Strength of Materials, Department of Mechanical Engineering and Aeronautics, University of Patras, 26504 Patras, Greece
*
Author to whom correspondence should be addressed.
Aerospace 2025, 12(3), 263; https://doi.org/10.3390/aerospace12030263
Submission received: 14 February 2025 / Revised: 17 March 2025 / Accepted: 18 March 2025 / Published: 20 March 2025

Abstract

:
The subject of the present work is the development and implementation of a novel testing facility to carry out an experimental campaign on an advanced fuselage panel manufactured from both thermoplastic and metallic materials, as well as the validation of its numerical simulation. The experimental arrangement was specifically designed, assembled, and instrumented to have multi-axial loading capabilities. The investigated load cases comprised uniaxial in-plane compression, lateral distributed pressure, and their combination. The introduction of pressure was enabled by inflatable airbags, and compression was applied up to the onset of local skin buckling. Calibration of the load introduction and inspection equipment was performed in multiple steps to acquire accurate and representative measurements. Data were recorded by external sensors mounted on a hydraulic actuator and an optical Digital Image Correlation (DIC) system. A numerical simulation of the fuselage panel and the test rig was developed, and a validation study was conducted. In the Finite Element (FE) model, several of the experimental configuration’s supporting elements and their connections to the specimen were integrated as constraints and boundary conditions. Data procured from the tests were correlated to the simulation’s predictions, presenting low errors in most displacement/strain distributions. The results show that the proposed test rig concept is suitable for stiffened panel level testing and could be used for future studies on similar aeronautical components.

1. Introduction

In the aircraft industry it has become common practice to carry out experimental studies on structural parts at increasing levels of scale and complexity. The practice referring to the hierarchical ordering of the experiments is called the building block approach. Both design and manufacturing departments [1], as well as structural assessment departments [2,3], in the aeronautical sector are implementing this approach. According to this methodology, full-scale testing on large parts, such as an aircraft fuselage, is not initially performed. Instead, material characterization campaigns are first conducted using coupons, followed by testing on structural details, and finally scaled up to the component level. The building block approach can provide several benefits when applied in this manner. The need to expend a considerable amount of resources and time on complex facilities is reduced, along with many of the associated risks. This is because data are up-streamed from the lower-level tests to define the upper-level test requirements regarding tooling and equipment. For this purpose, this methodology was initially developed by Airbus for the certification of the first composite wing box as part of a commercial civil aircraft [4] and has since been widely employed by NASA [5,6]. Taking the example of a fuselage, the first step is to determine one or multiple of its stiffened panels as critical. Then, instead of investigating the entire structure, one or more panels are subjected to representative design loads to satisfy the structural requirements of the whole fuselage. A significant amount of time and effort is saved in this way without compromising structural integrity, safety, etc.
Early applications of fiber-reinforced composites in both civil and military aircraft were relatively limited and comprised non-structural parts, such as aerodynamic fairings and flight control surfaces. However, since 1980, a significant surge has occurred in the widespread use of composite materials, as reported by Hiken [7], which now make up more than 20% of most airplanes by weight percentage. More specifically, during the last few decades, aircraft manufacturers have gradually implemented an increasing number of advanced carbon fiber-reinforced matrix systems into structural aircraft parts. One of the main reasons that composites constitute a substantial percentage of the material makeup of primary aircraft parts, like the fuselage, relates to their potential for considerably reducing the aircraft’s Manufacturer’s Empty Weight (MEW) [8,9]. This is due to their superior specific properties compared to many traditional metallic materials, leading, in most cases, to improved fuel and cargo efficiency.
In the present study, a component-level specimen is examined in a laboratory environment, which consists of a fuselage panel made of thermoplastic composite and metallic materials. Coupon and structural detail tests are generally used for the definition of characteristic composite material properties [10,11,12] and the evaluation of local damage formation and propagation, as well as strength degradation, under static and fatigue loading [13,14,15]. If, however, the goal is to investigate the general structural response of an aircraft part regarding stiffness and stability, specialized testing facilities have to be designed [16,17,18,19]. In contrast to coupon and element tests, it is usually neither correct nor practical to apply simple conventional gripping and loading methods to components. This is due both to the scale of the specimen and to the complexity involved in establishing an environment that recreates the forces and moments to which it is subjected during its life. Virtual simulation technologies and computational models [20,21] have often been used in conjunction with analytical/empirical formulations and rules to define all aspects of the testing facility, encompassing the supports, interfaces, and load-bearing elements. In particular, with regard to the buckling performance of composite stiffened panels, theoretical frameworks [22,23] and digital tools [24,25,26,27,28] have been developed to accurately predict and study buckling. Experimental campaigns usually accompany these simulations in order to validate the respective Finite Element models [29,30].
The standard procedure during the certification process of any aeronautical part requires that specimens undergo an exhaustive list of structural evaluations of their elastic, strength, buckling, fatigue, impact, etc., performance. In more recent years, composite materials have been integrated into airframe structures at an accelerated pace, and certification guidelines are constantly evolving to keep up with this new wave of materials [31,32]. Historically, the design of parts was inadvertently connected to large-scale tests performed on substantial portions of the aircraft (Figure 1). These installations stipulated that sensors should be placed at a large number of locations on the investigated part to continually monitor the strains, damage, vibrations, etc., that progressively arise after introducing external loads.
In later years, new approaches emerged to further de-risk the cost and time demands of these tests. These mainly consisted of the digital recreation of test rigs inside virtual environments by utilizing advanced computational tools such as Finite Element Analysis. The incorporation of virtual test methodologies into the certification process of aircraft and aerospace applications has been a subject of consideration [35,36]. Virtual modeling can be used for the prediction of failure, instabilities, and other critical phenomena. This approach provides the advantages of decreasing the amount of required inspection equipment and lowering the degree of sophistication of the experiment, since zones of interest are defined prior to instrumentation. Digital twins are a primary tool in virtual strategies, where a portion or the entirety of the installation and the specimen are reconstructed in digital format by taking into account all or most of their characteristic traits and properties. Examples have been provided by Prior [37,38], who proposed a computational framework to support the validation processes related to aircraft design and sizing. Examples of digital models simulating multi-axially loaded stiffened panels have been presented in the works of Grotto et al. [39] and Dongyun et al. [40], where damage propagation and post-buckling behavior were simulated and the developed models were experimentally validated.
A novel concept for an experimental installation to perform the structural evaluation of a fuselage composite panel has already been published by the authors [41]. In that publication, the investigated specimen was presented in detail, and a thorough account of the facility’s equipment, parts, and devices was provided. A numerical model predicted critical failure modes caused by compression buckling and by exceeding strength limits when the specimen was loaded with lateral pressure. The numerical data from the finite element model (FEM) were instrumental in determining optimal panel structural concepts and verifying the safe operation of the test rig. The work presented in the current study is a continuation and extension of the previous research. First, a series of tests has taken place to calibrate the loading and inspection equipment. Subsequently, an experimental campaign has been launched, investigating different loading conditions that included internal pressure, uniaxial compression, and a combination of pressure and compression. Results from the experimental investigation are used for the validation of a numerical model of the fuselage panel and the test bench, which has been developed within a Finite Element framework.

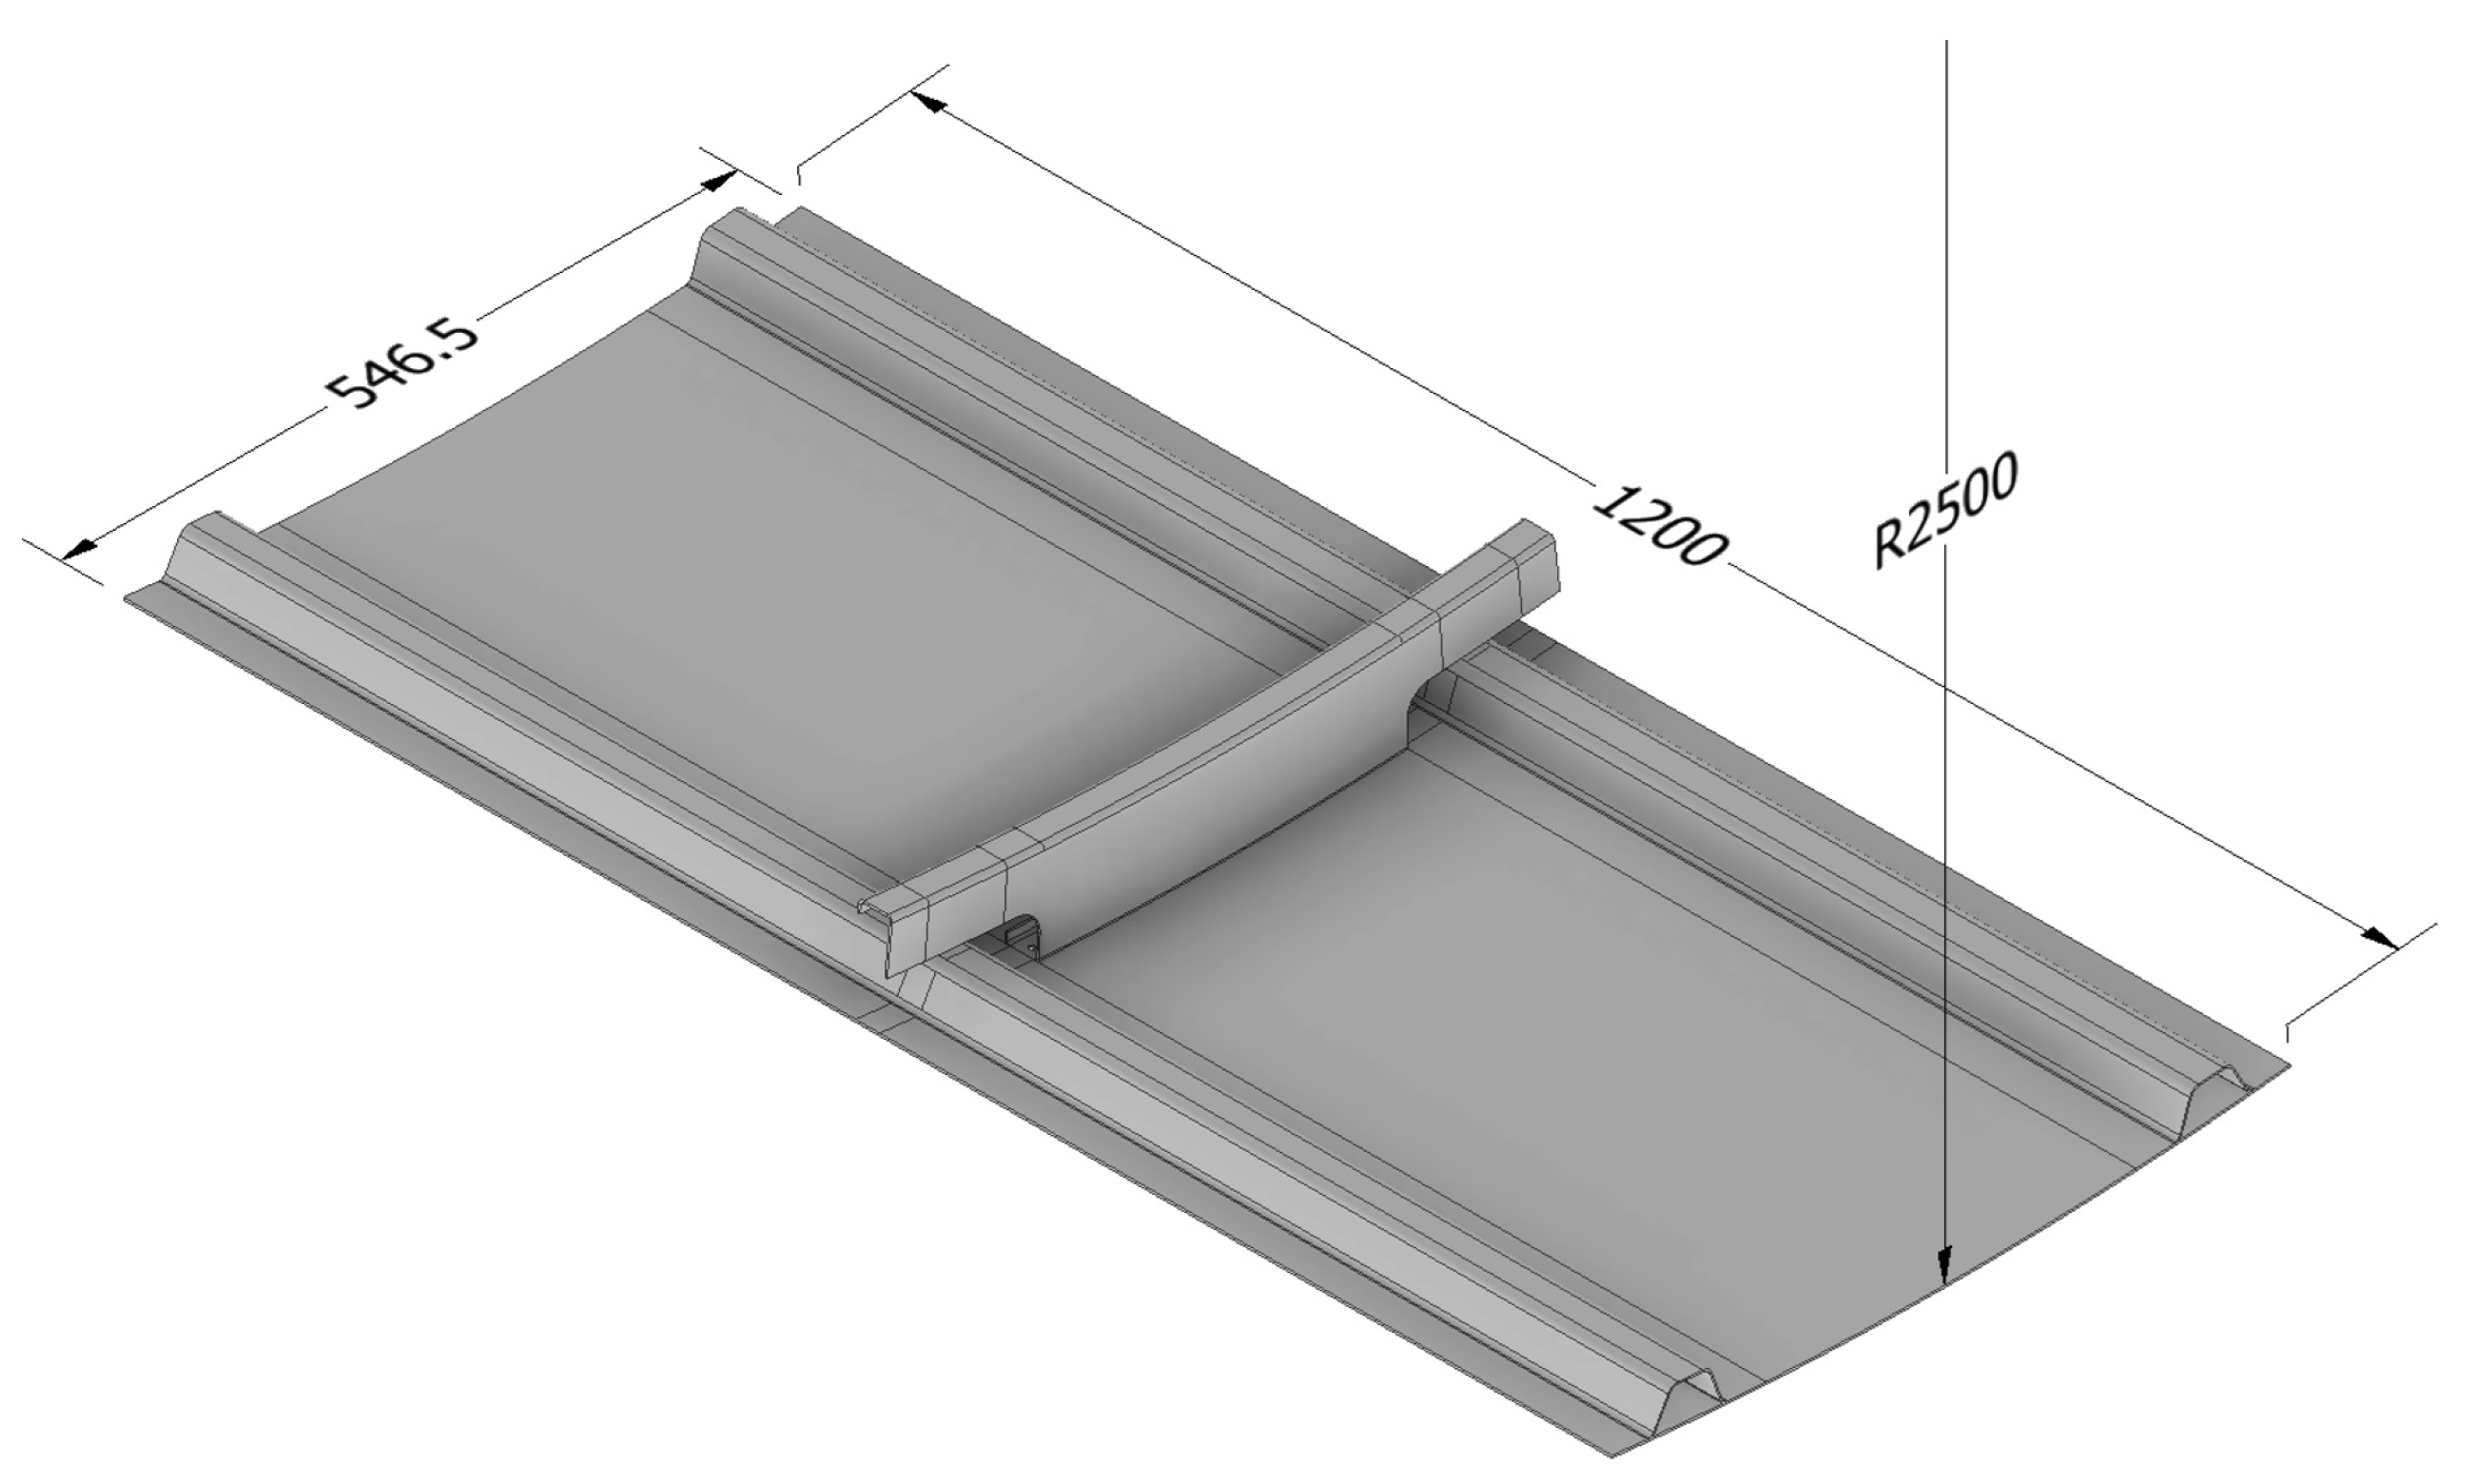
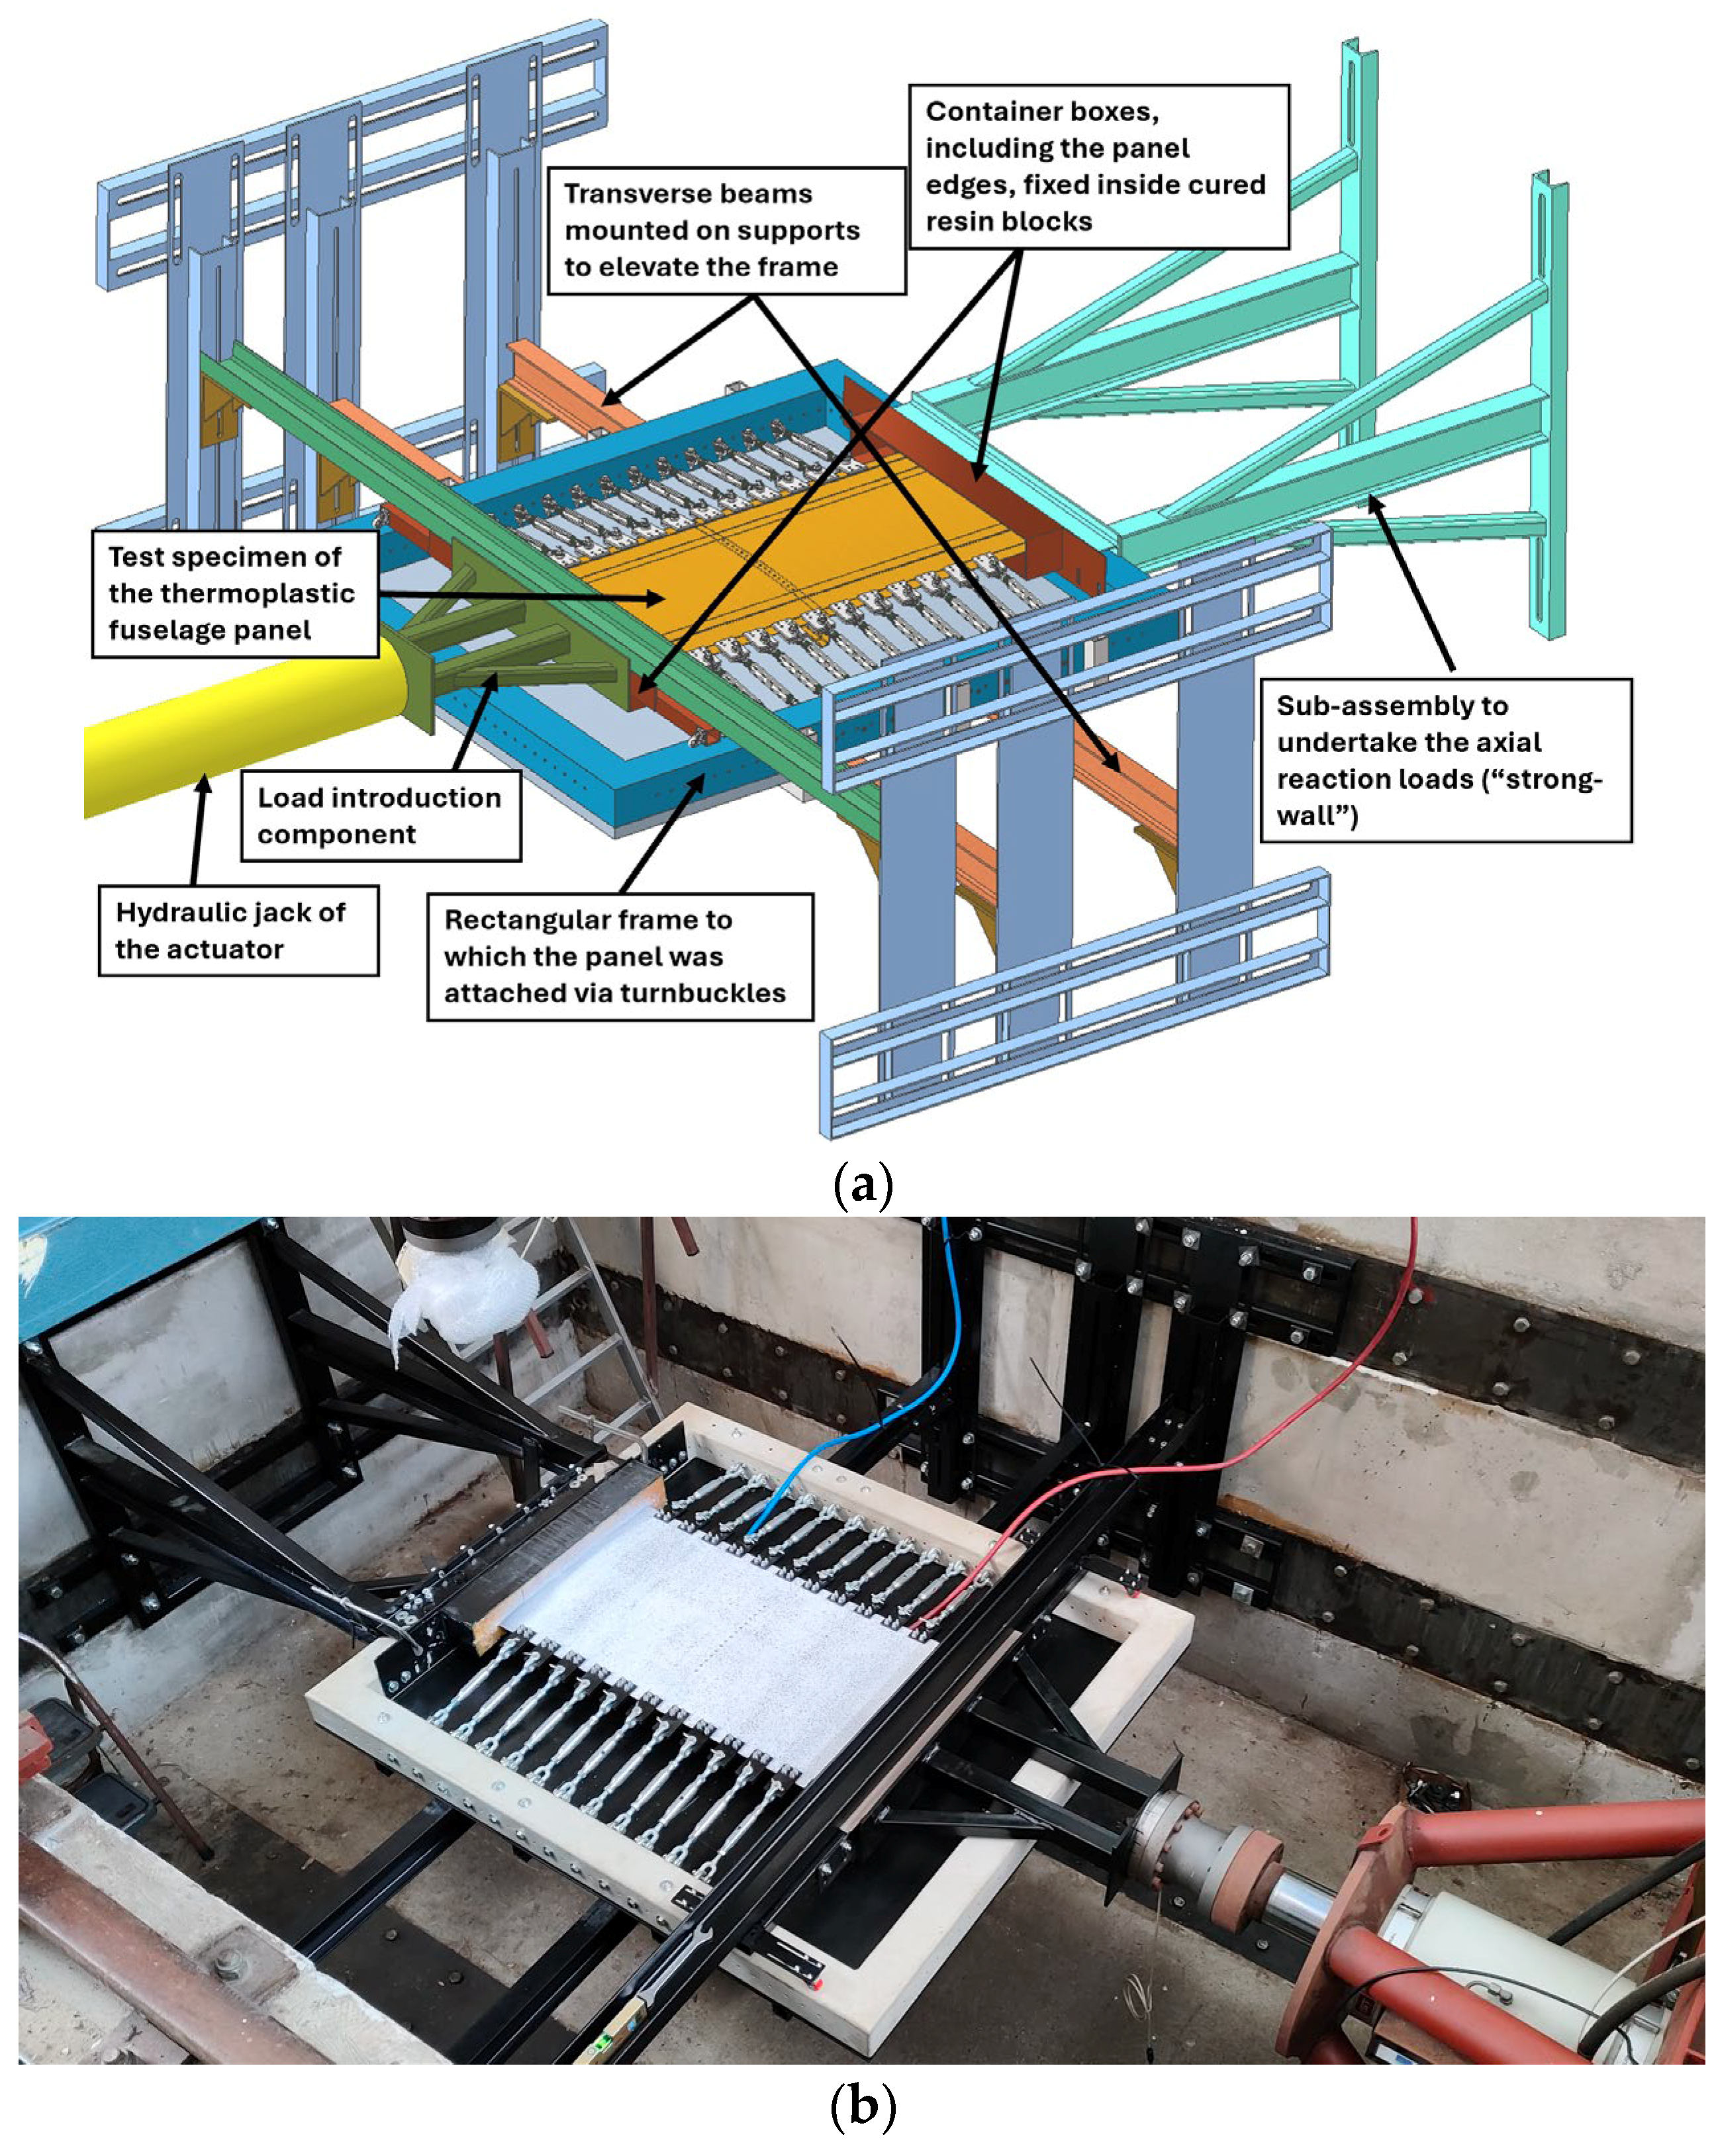
2. Description of the Specimen and Experimental Facility

The fuselage panel, manufactured by Adamant Composites, comprises a curved thin shell reinforced by two stiffeners along its longitudinal direction (stringers) and a stiff metallic frame along the circumferential direction. Different joining methods have been employed to attach the stiffening elements, such as traditional mechanical fastening and co-curing inside an autoclave. The manufacturing materials of the investigated panel comprise a variety of advanced materials and joining concepts. More precisely, the skin consists of a fiber-reinforced plate with a thermoplastic matrix (Low-Melting Point Polyaryletherketone or LMPAEK), while the stringers are manufactured from a toughened epoxy-matrix preform. Furthermore, the frame is manufactured from a 7000-series aluminum alloy sheet. The connection of the frame to the skin is achieved using bolts specialized for aeronautical applications according to the EN6115 specification, while the stringers are bonded to the skin by applying and curing an epoxy-based adhesive film. The fuselage panel features a multi-material configuration that implements various manufacturing and assembly techniques, both cutting-edge and more conventional.
In Figure 2, the manufactured stiffened panel is depicted in a 3D illustration, and its general dimensions are provided. As previously mentioned, the stiffened panel comprises three main components. The skin has a radius of curvature equal to 2500 mm and a constant thickness of 1.8 mm. The two stringers are omega hat-type profile beams and are installed close to the edges to allow for adequate space according to the stiffener pitches, which are characteristic of a typical aircraft fuselage. The frame is an aluminum sheet bent into a C-shape, with the bottom flange drilled. Material removal has been employed so that appropriate space is created at the frames for the stringers to pass through. The materials, laminations, and thicknesses of the skin, stringers, and frame, along with the materials for the adhesive film and bolts, have been procured from ADAMANT COMPOSITES LTD, Aghias Lavras and Stadiou street, PC 26504, Rio, Patras, Greece and are presented in Table 1.
The assembly of the experimental arrangement has taken place at the Laboratory of Technology and Strength of Materials (LTSM) facilities at the University of Patras. A 3D CAD illustration of the test rig is presented in Figure 3, along with an image of the final installed test bench. The general concept of this setup is to enable the application of different loading types. To that end, a multi-functional, adaptable configuration has been developed and assembled inside an experimental pit on the ground enclosed by four walls. It consists of various parts, marked with distinct colors in Figure 3. The main components are the hydraulic load application component (actuator), two height-adjustable I-beams fixed on wall-mounted supports, a rectangular frame (R-frame) affixed to a plate to support the airbags, and a rigid assembly at the rear side of the specimen that acts as a “strong wall”.
Two airbags are placed under the specimen to apply internal pressure. These airbags are fitted into the available space created by the two stringers and the stiffening frame. The airbags are filled with air, thereby increasing the pressure under the stiffened panel. The airflow is controlled by a venting system that includes pressure gauges and valves. The maximum internal pressure reached by the airbags is 0.2 bar. According to reference [42], a cabin differential pressure equal to 0.2 bar corresponds to a flight altitude between 10,000 and 15,000 feet, which is typical for smaller general aviation aircraft. Pressure is limited to this value for safety and practical reasons. Supporting rods extending sideways and connected to the R-frame are used to attach the stiffened panel to the test rig. These rods simulate the missing fuselage part, enabling representative boundary conditions for the internal pressure load case. A ball joint and a hinge joint are used at the rod/R-frame and rod/panel interfaces, respectively. Rigid loading blocks are fitted to the panel’s curved edges, and an epoxy resin mix is cured inside. The longitudinal compression loads applied by the actuator are gradually transferred through shear from the resin, which fills the loading blocks, to the surface of the stiffened panel. A third beam extends along the transverse direction from one side of the wall to the other to restrain any vertical movement caused by pressure. A film made of Teflon covers the contact area of this beam with the loading block on the front edge to minimize frictional resistance. Finally, an attachment with wheels is installed on the sides of the frontal container box to support the weight of the panel without inhibiting its motion along the longitudinal axis. Figure 4 shows in more detail the arrangement on the frontal edge to more clearly illustrate the function of the multiple devices contained therein.

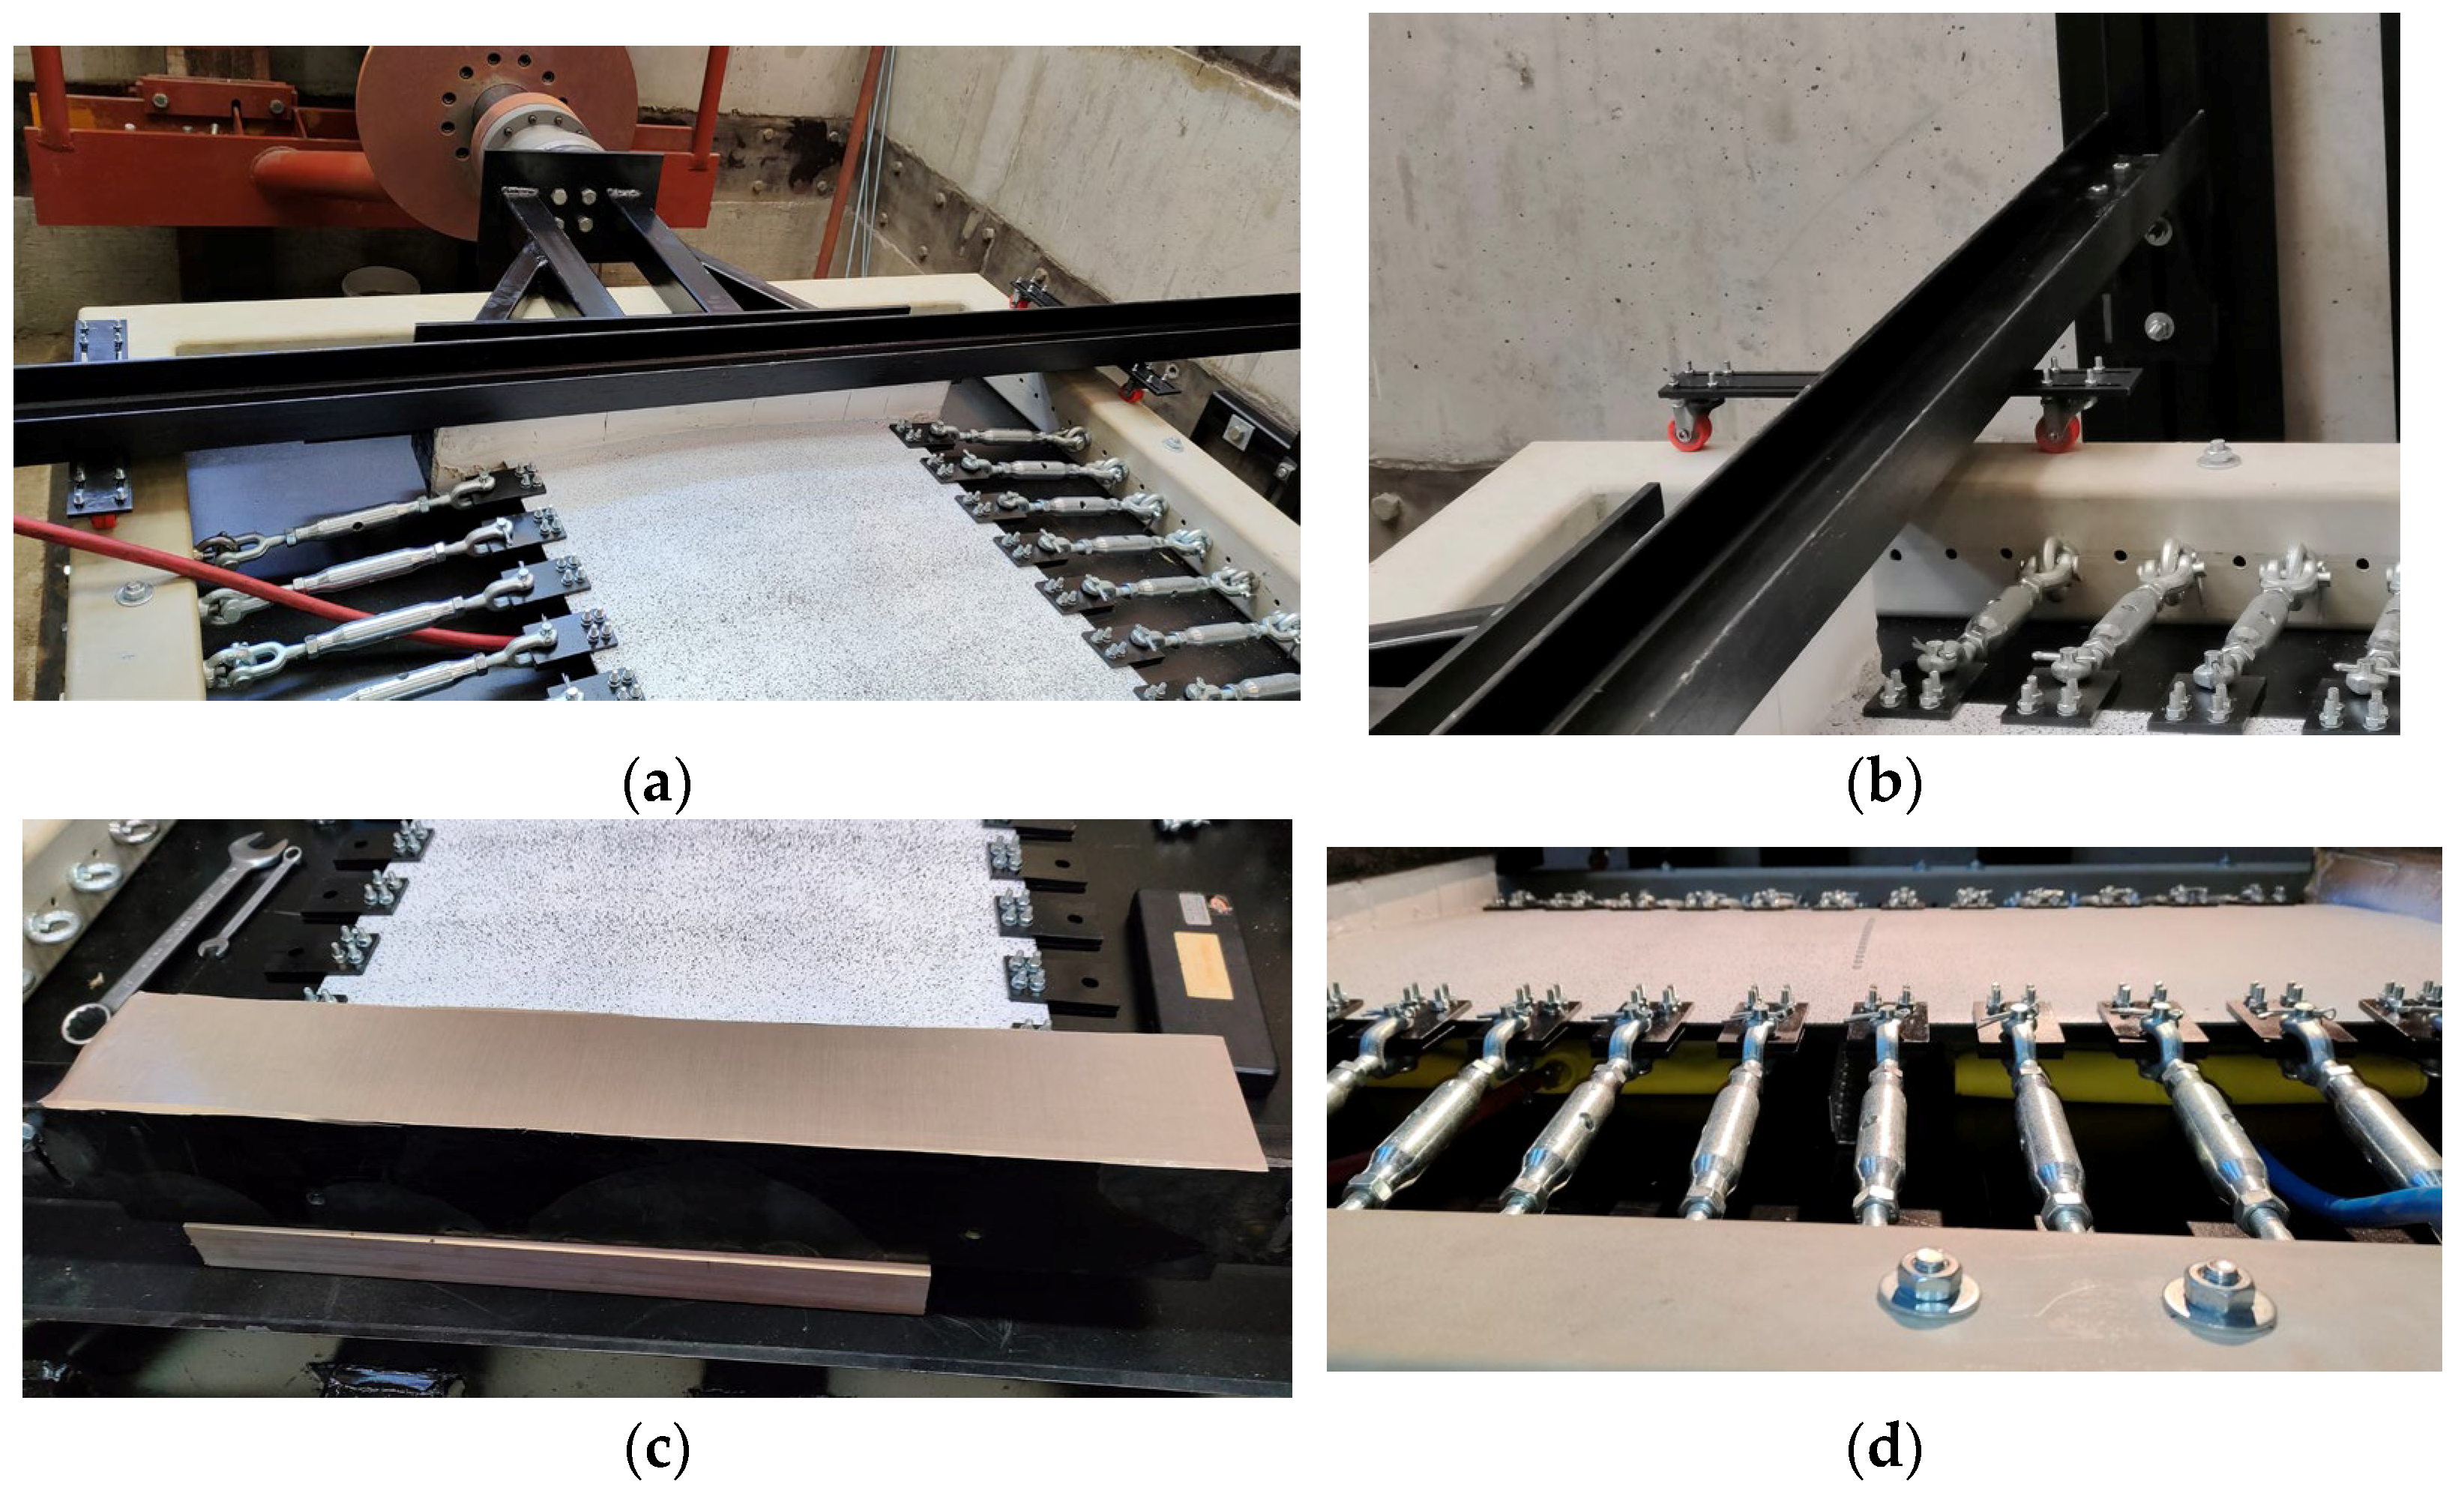
3. Setup and Calibration of the Load Introduction and Inspection Devices

In this section, the actuator and inspection equipment are described, along with their calibration process. In-plane compression is introduced to the specimen using an Instron servo-hydraulic actuator system device. At the same time, full-field image data are recorded by an optical sensor Digital Image Correlation (DIC) arrangement. The PID controller settings are configured according to the manufacturer’s specifications. Sensor data are continuously collected and processed during the tests at a high frequency of 50 Hz in order to ensure the accuracy of the data acquisition systems. The actuator’s control systems are presented in Figure 5.
Regarding the DIC sensors, a two-step process is followed: first, they are set up, and then they are calibrated to the correct values. The equipment for the DIC includes several devices: (a) the image capturing sensors (i.e., cameras), (b) the controller, (c) the computer module, and (d) the lighting devices. Adjustment of the camera’s focal length and aperture has been carried out using a flat surface with dimensions comparable to the dimensions of the test specimen, covered with a high-contrast, black-and-white speckle pattern, following the manufacturer’s recommendations.
The stiffened panel’s outer skin surface is covered with a specially created speckle pattern, suitable for recording by the DIC system (Figure 6a). Subsequently, the specimen is mounted on the test rig. The DIC cameras are positioned directly above the panel and the test rig at a suitable distance to ensure adequate image clarity, as well as to maximize the area measured by the cameras. The sensors are firmly fastened to a beam mounted on top of the test pit’s open ceiling, as seen in Figure 6b. Then, a cross-shaped specimen (i.e., calibration object) is placed on top of the panel (Figure 6c) and used to perform the in-depth, stereoscopic sensor calibration process. Powerful external lighting systems illuminate the specimen during calibration and testing procedures.
During sensor calibration, facet size and overlap are investigated. Facets can be described as pixel subsets that are discreetly processed from the rest to calculate displacements. Facet overlap, which is the percentage of facet area shared by neighboring facets, is kept at a constant value of 25% when assessing the size. Similarly, a constant size of 25 × 25 pixels is used when evaluating the overlap. The load cases used are a lateral pressure equal to 0.2 bar and in-plane compression equal to 2.2 kN, which is 5% of the predicted buckling load according to reference [41]. Table 2 is an array of all facet sizes and overlaps and the corresponding maximum displacements used to conduct the calibration study. The displacement data are also plotted in Figure 7
For the compression load case, convergence in facet size takes place at 25 × 25 pixels. In the case of pressure, the same size of 25 × 25 pixels is preferred over 25 × 25 pixels to limit processing time. Results on the overlap are more inconclusive, with no apparent convergence in the compression load case. It is concluded that the percentile overlap has a small effect on the generated output. A facet overlap equal to 50% is selected since it is the maximum overlap recommended by the manufacturer and the value approaching convergence in the pressure load case.

4. Description of the Finite Element Model (FEM)

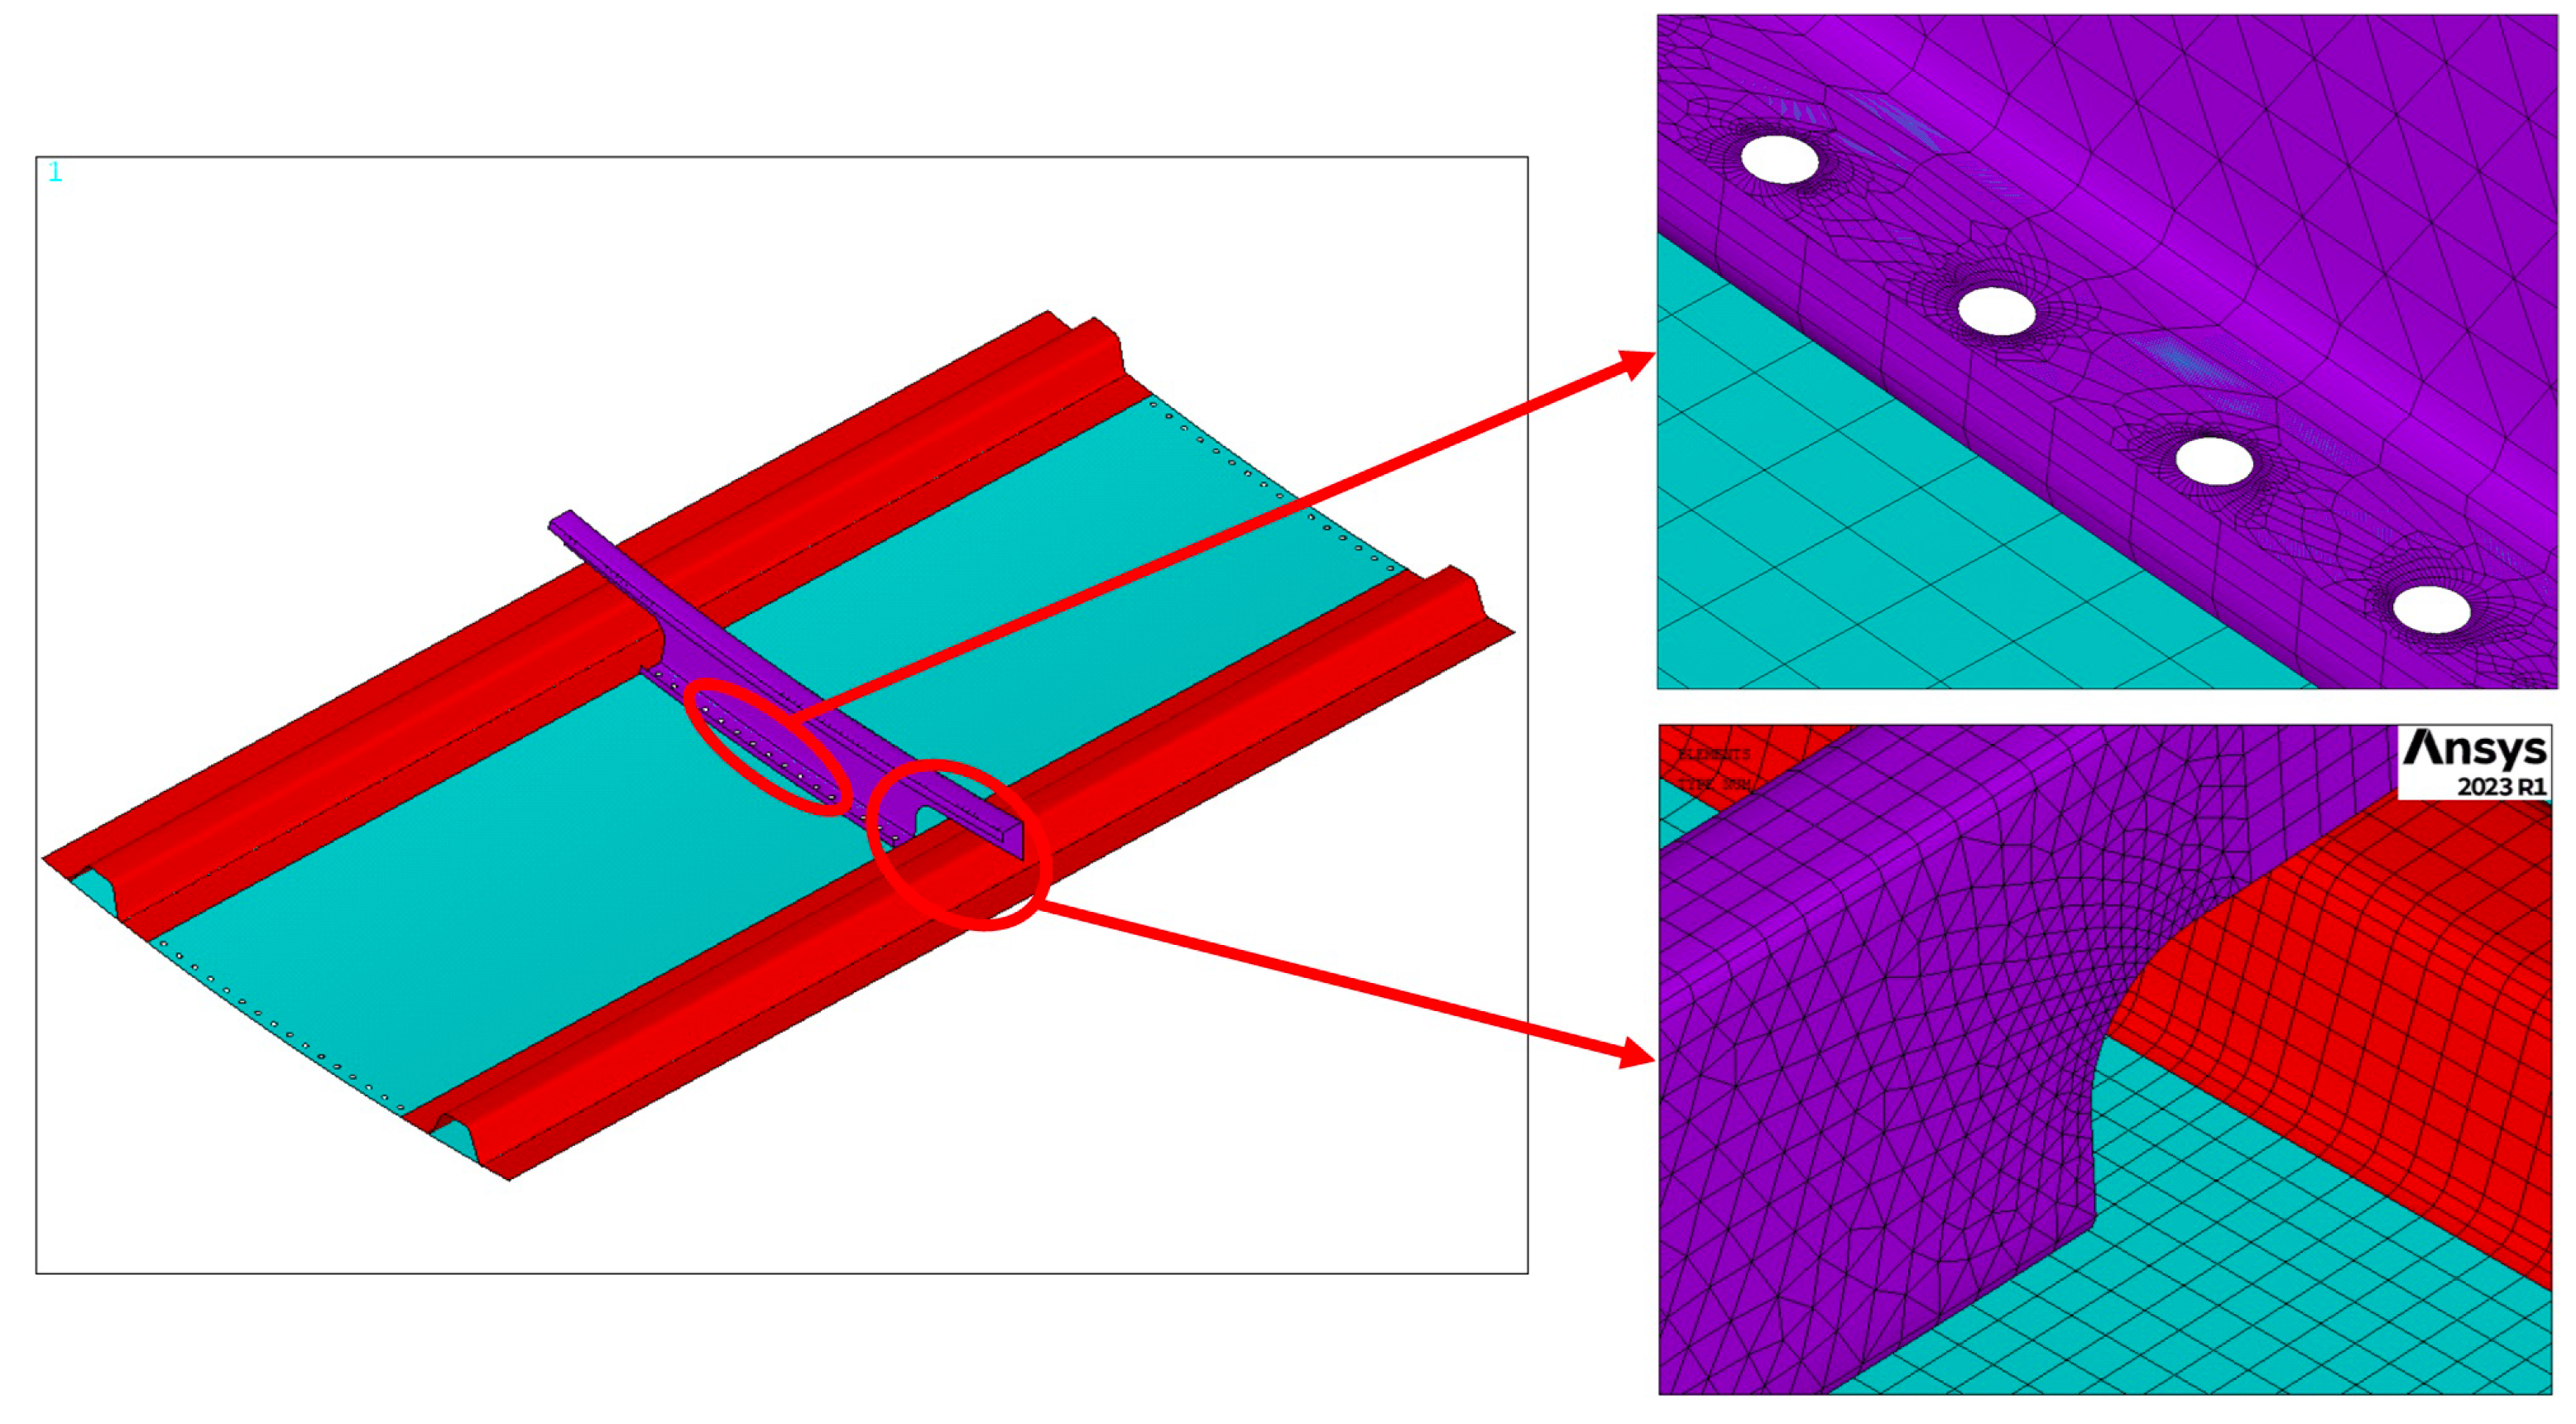
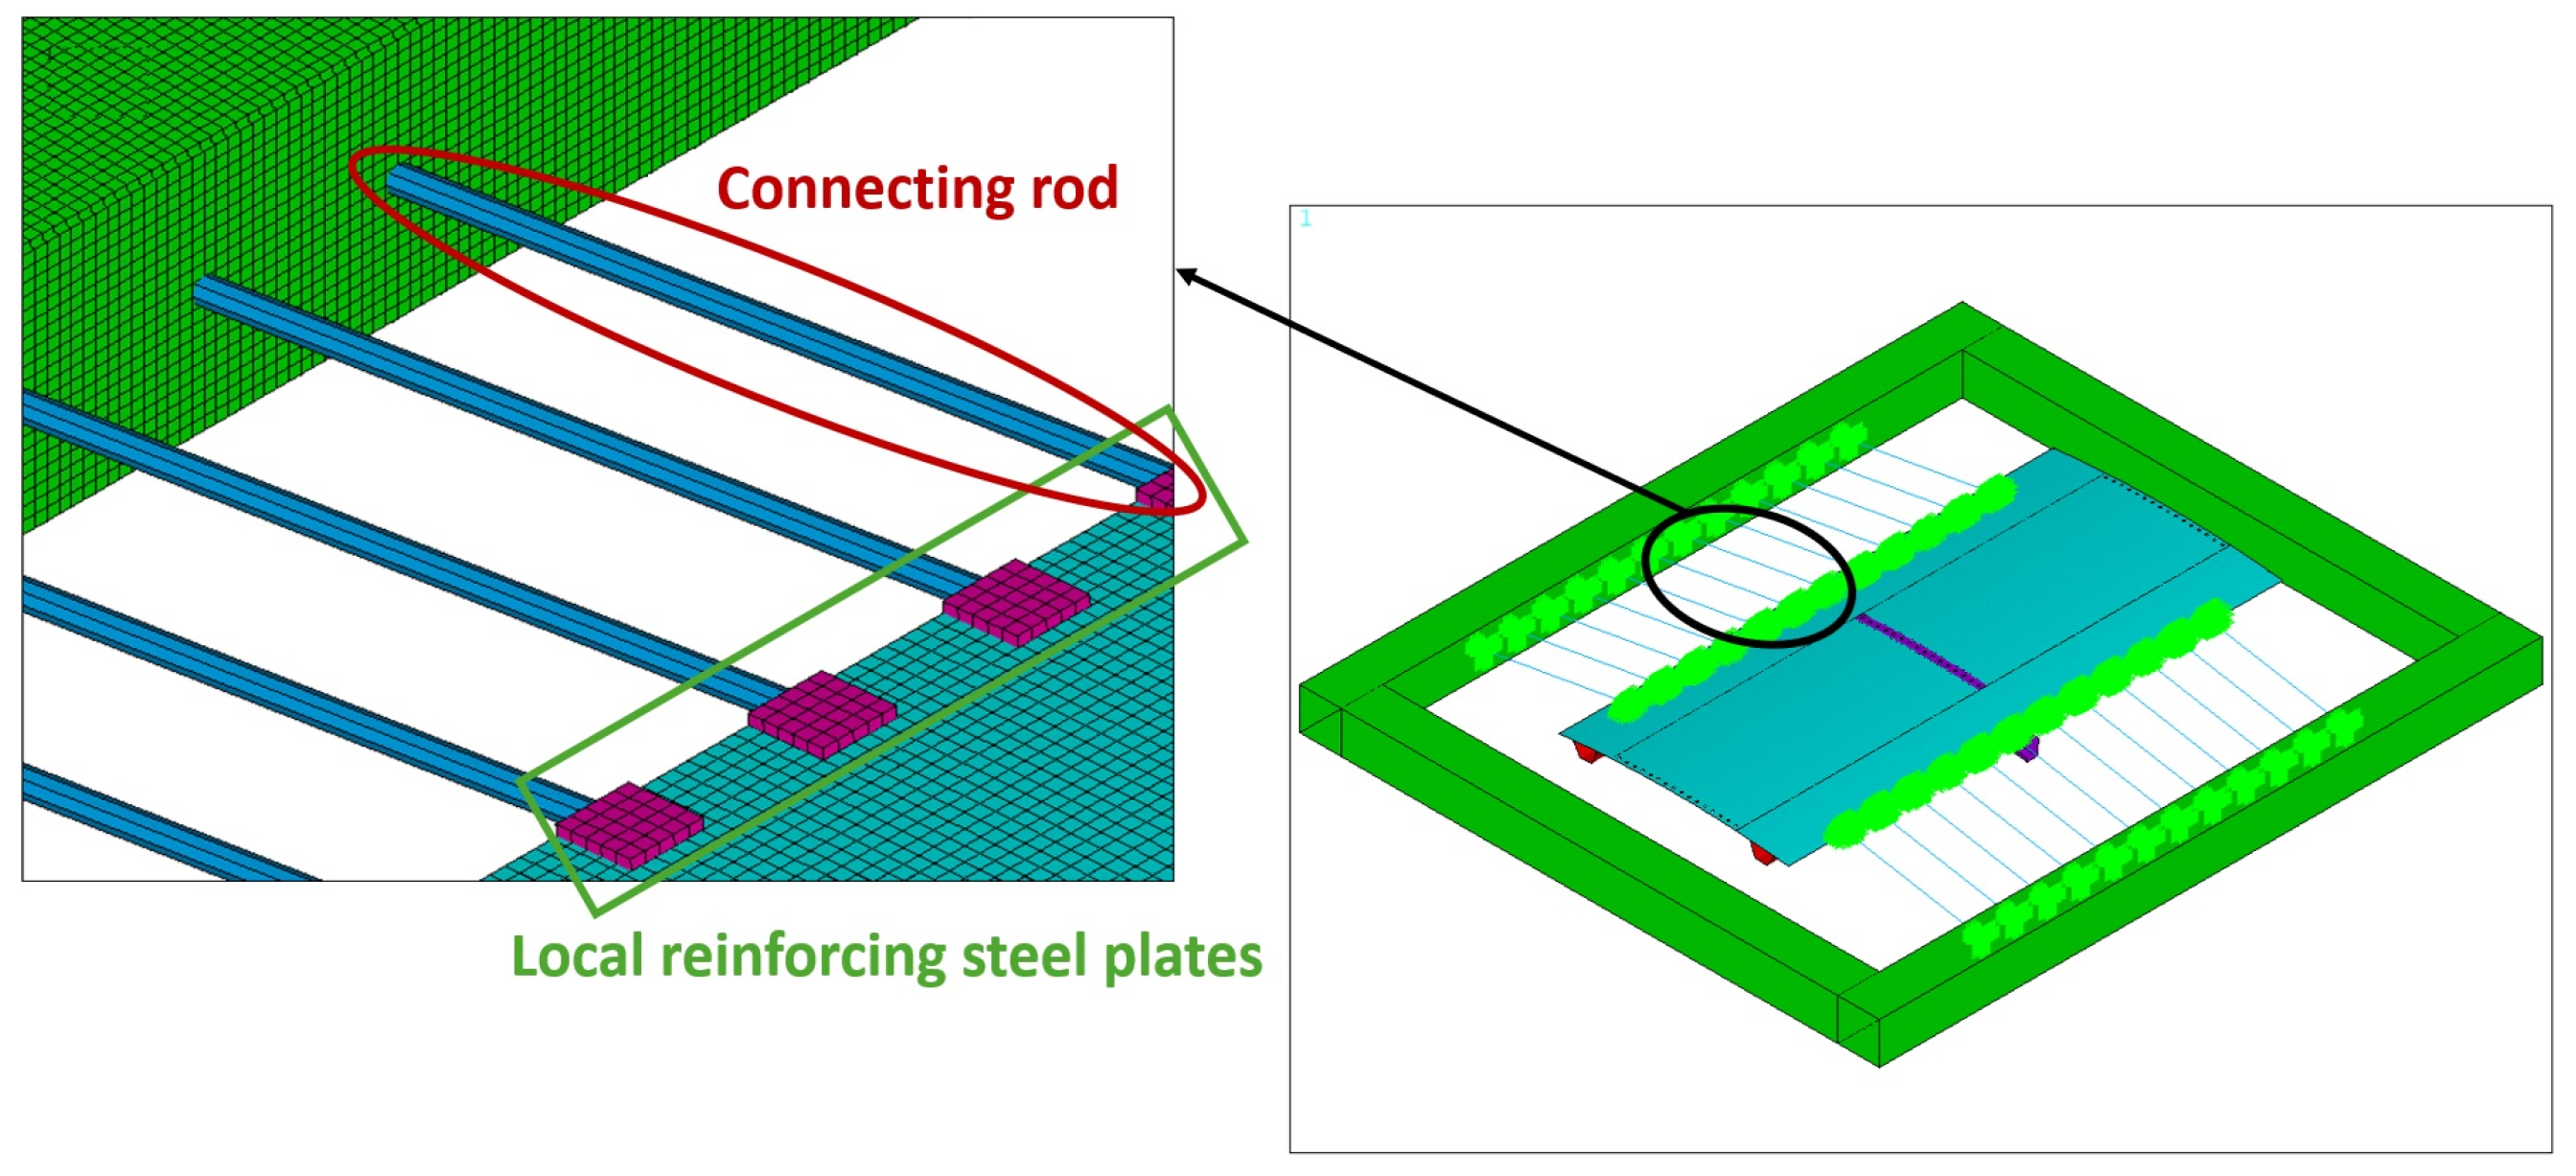
4.1. Development of the Finite Element Model

The modeling of the panel’s geometry is implemented by incorporating shell and, to a lesser degree, beam finite elements. Shell elements simulate the curved skin, the stiffeners, and the rectangular frame, while beams are used for the supporting rods. The virtual simulation is carried out in ANSYS APDL 2023 R1, which enables the parametric generation of the test rig’s geometry, its discretization into elements, the selection of boundary/loading conditions, the definition of post-processing settings, etc. The shell elements used in the present study are governed by the First Order Shear Deformation theory. In order to enhance computational efficiency, reduced integration points are used for the majority of shell elements, along with an hourglass control algorithm to avoid excessive element distortions. Full integration is the preferred formulation for the elements simulating the web of the stiffeners, since they are subjected to in-plane bending, which is a loading type known to cause hour-glassing. The most significant elements of the rig are explicitly modeled. These comprise the rectangular frame, the rods that support the specimen, and the plates located on the straight edges. The frame and the plates are modeled as shell elements, while the rods are modeled as two-node second-order beam elements.
The mesh grid is well-structured, comprising rectangular shells for most of the geometry. The size of the element edges is approximately 5 mm. Adaptive sizing options are incorporated, allowing for slight violations of precise dimensions in order to preserve the rectangular shape. A convergence study has been conducted and presented in previous work by the authors of [41], who suggested that a mesh size of 5 mm is optimal. An exception to the rectangular shape is the mesh of the frame webs, where triangular elements are the preferred choice. This selection is made because triangles are known to lead to improved discretization of geometries characterized by curved edges, such as the corners of the frame cutouts. Additionally, since a dense mesh is generated at the corners, the drawbacks of using triangular shell elements, like their less accurate shape functions and fewer integration points, are diminished. Nodes belonging to the stiffener flanges are merged with the skin, simulating ideal bonding conditions. Free meshing with a smaller size (0.1–0.5 mm) is locally applied around open holes where the panel has been drilled and mechanically fastened to other elements. Both the free and triangular meshes are shown in Figure 8.
On the subject of the loading conditions, lateral pressure is applied as a distributed force over the panel’s inner surface. Actuator loads are directly applied to one node at the frontal edge and administered to the rest by coupling certain degrees of freedom (DOFs). All DOFs of the panel’s rear edge are constrained (fixed boundary condition), encompassing the circumferential length of the panel contained in the stiff loading block that transmits the forces. The nodes in the areas where rods, connected to plates, are attached to the panel and to the rectangular frame have all their translational degrees of freedom coupled. The plates are modeled as four-node shells and are tied to the skin by merging the overlapping nodes (Figure 9).

4.2. Discrepancies in the Experimental Installation in Comparison to the Original Design and Modifications Made on the FEM

Discrepancies have been detected after assembling the test rig with regard to the original design. These inconsistencies have been thoroughly investigated and explained since they provide essential information for further fine-tuning the simulation and creating the final version of the FE model used for validation.
The DIC full-field optical measurement system by Aramis is able to interpolate the curved geometry of the panel’s outer surface using a cylindrical section. The results are presented in Figure 10a, where a radius of curvature equal to 2850 mm has been computed. This presents a discrepancy of 14% with respect to the targeted 2500 mm design curvature. This difference can be primarily attributed to a spring-back reaction, where the panel tries to return to its original flat geometry. The spring-back most likely occurred after the stiff curved beams, which forced the panel into its curved shape, were removed following the resin infusion. To a lesser extent, the radius of curvature could have also been affected by implications during the bonding/fastening of the stiffened panel’s different components, as well as by the intricate nature of the test rig assembly. In the developed FE model, the radius of curvature has been updated to match the as-built radius, taking advantage of the parametric manner in which the FE model was created.
The DIC Aramis visual processing algorithm has also been utilized to obtain precise measurements of the specimen’s dimensions after it was installed in the test rig. A coordinate system has been defined at the specimen’s rear edge to calculate the coordinates of all points on its surface. Useful data have been obtained to determine the specimen’s dimensions and out-of-plane orientation. The width and length of the specimen’s measured area have been calculated as 470 mm and 810 mm, respectively (Figure 10b and Figure 10c, respectively). Slight corrections were made regarding specimen positioning and size by directly implementing the data from the contours of Figure 10 in the FEM.
Figure 10d is a contour of the specimen’s out-of-plane coordinates with respect to the reference coordinate system. It can be observed that the frontal side is positioned 9.19 mm above the rear side, leading to the conclusion that the panel does not lie perfectly on a horizontal plane but rather presents a slight upward inclination toward the loading side. The non-horizontal position of the panel is attributed to minor misalignment during the installation of the various parts. To simulate this condition, a node has been generated at the point where the load is transferred by the actuator to the panel (Figure 11). The load is applied through this node using the approach of “master” and “slave” nodal constraint equations and couplings. Therefore, parasitic moments are introduced in the model while restraining excessive deformation in the loaded area. In the experiment, this out-of-plane moment is caused by the misalignment of the loading line with respect to the specimen’s horizontal plane. Minor adjustments to the constraint equations used to transmit the forces and moments to the area shown in Figure 11 have been made according to each load case.

5. Validation of the Numerical Simulation and Correlation with Experimental Results

In this section, the experimental results are presented, and the data are compared with the data calculated by the finite element model. The test plan comprises four different load cases. The first load case involves the application of internal pressure to the panel. The second load case investigates the response of the panel under linear compression loading conditions. The third load case is the application of compressive loads until buckling of the stiffened panel appears. The fourth load case comprises the combination of compression and internal pressure loads. The interaction mechanisms between the membrane stresses introduced by pressure and the stiffness loss caused by buckling are investigated.

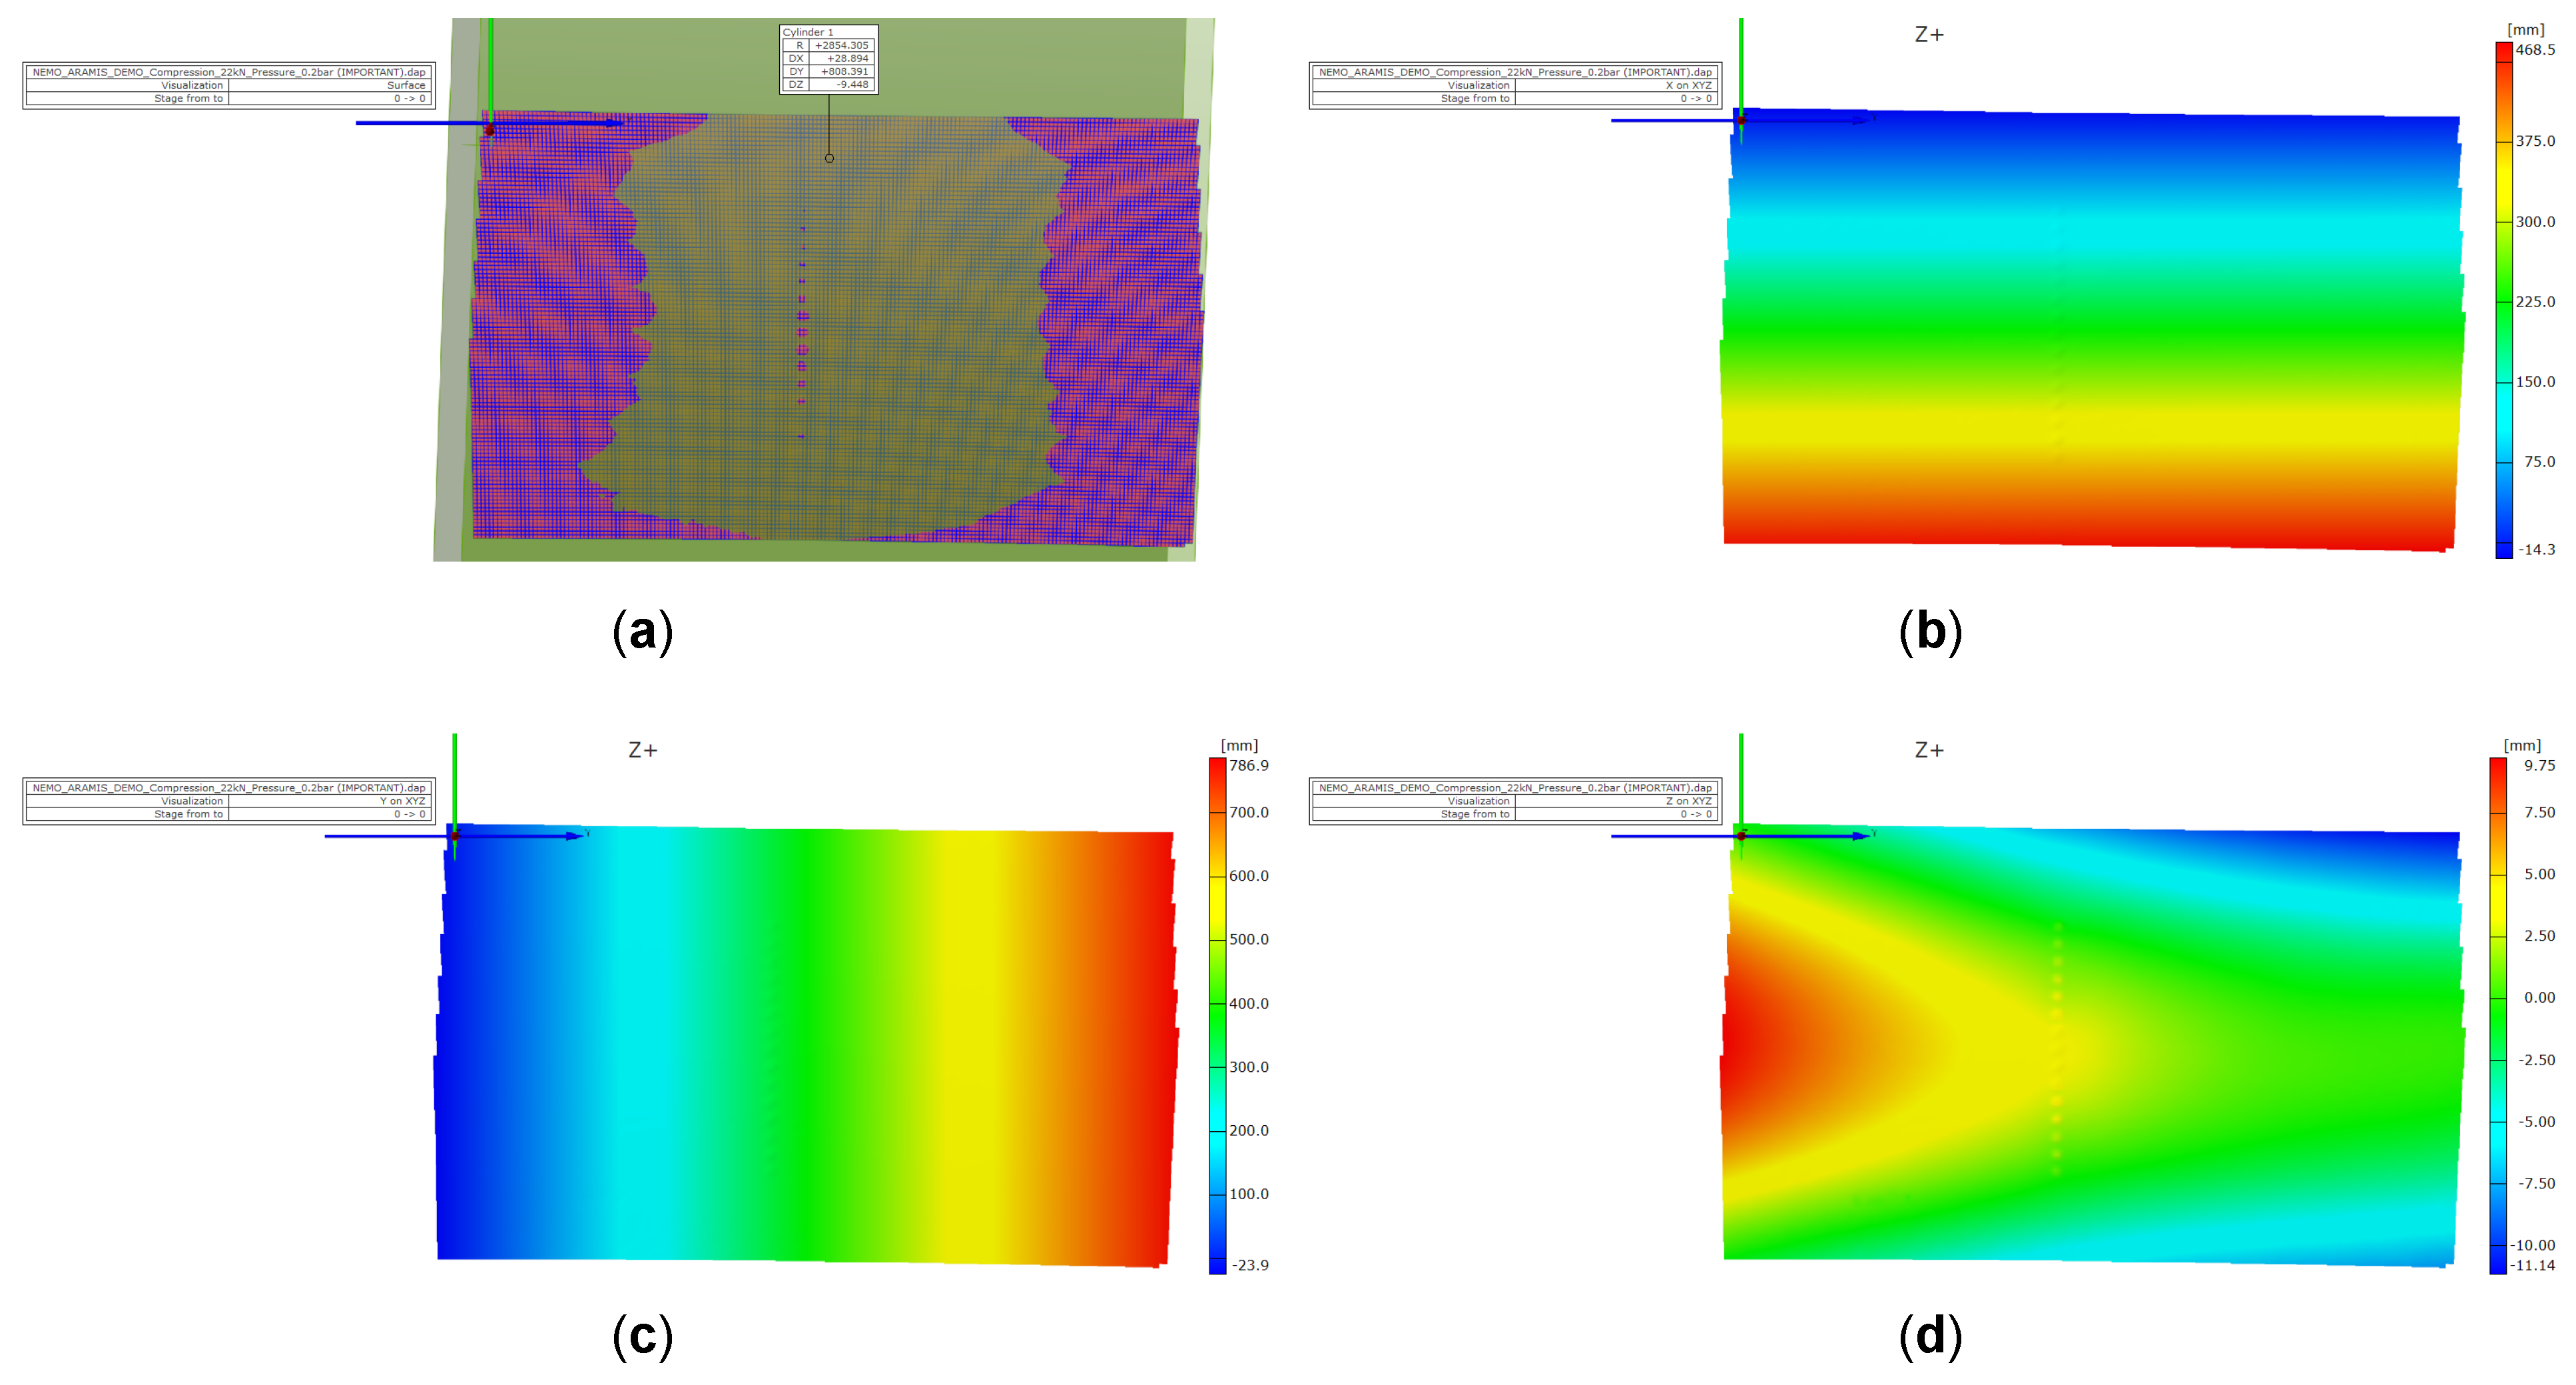
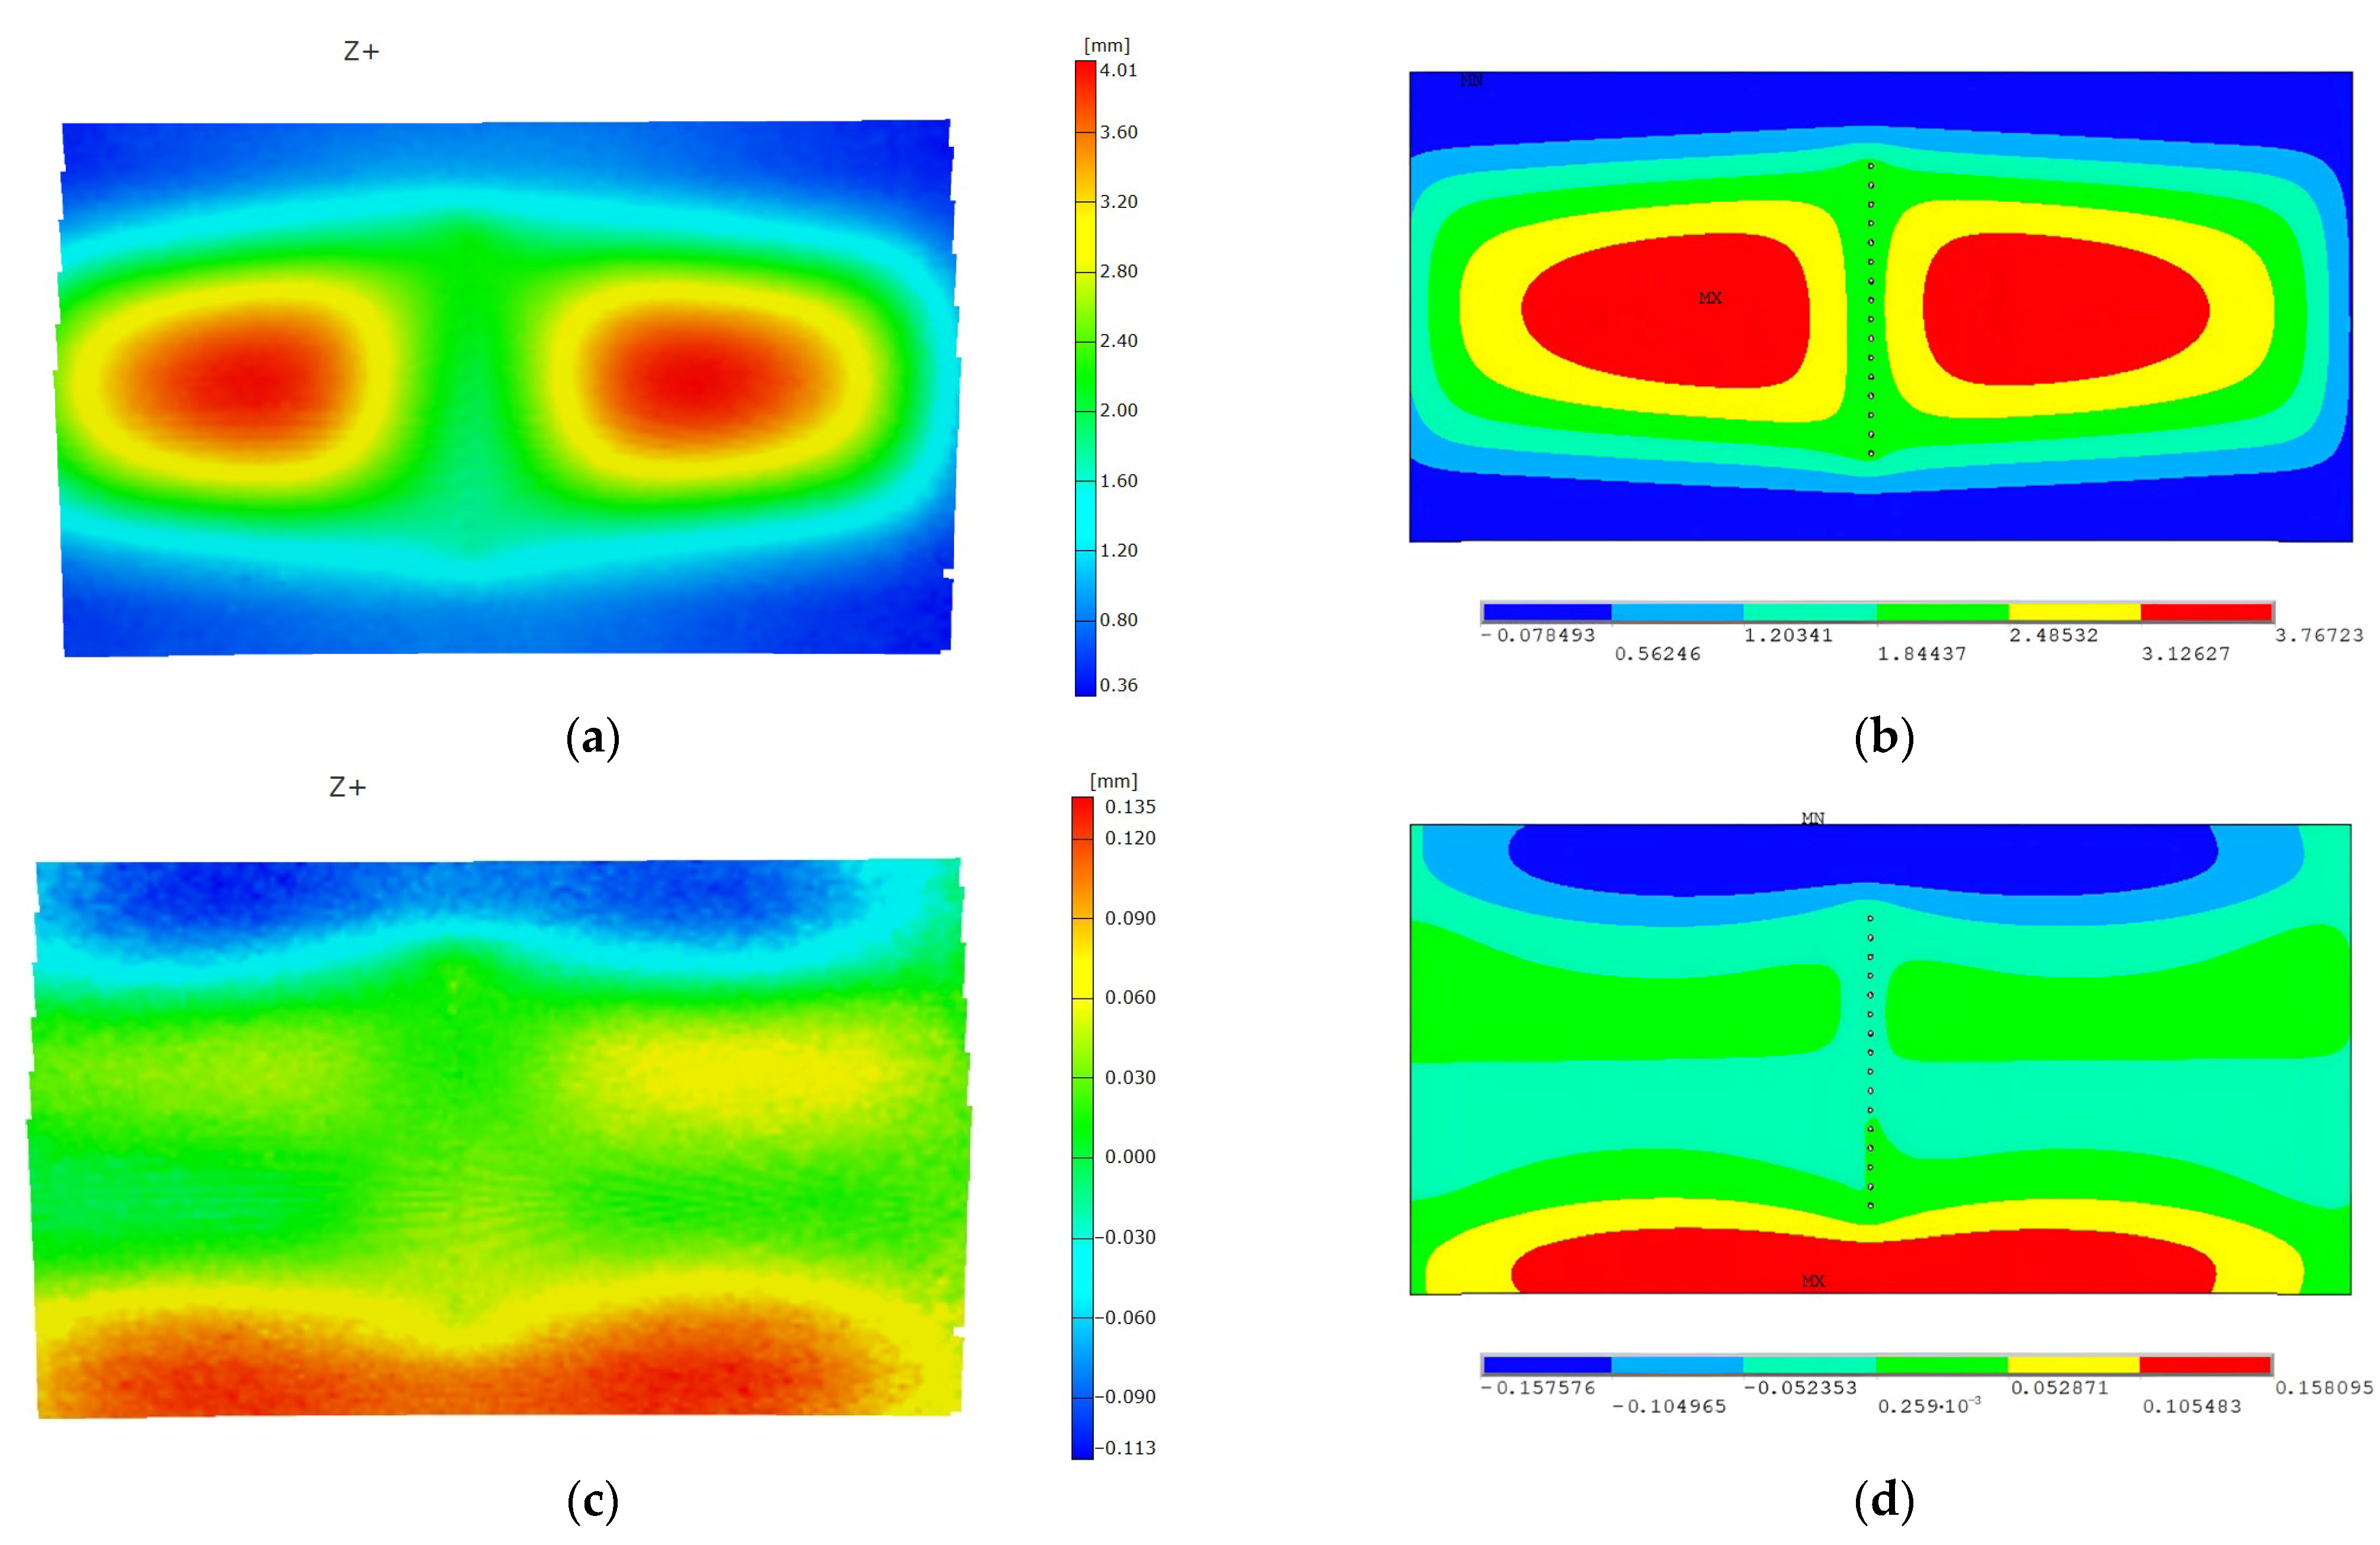
5.1. Load Case 1: Internal Pressure

Initially, the lateral pressure case is investigated. The images recorded by the DIC device are used as a reference to correlate with the numerically derived contours. The actuator was not operational during these tests. The airbags under the specimen were pressurized after the lateral rods were assembled. Several images were captured and processed to calculate contours of displacement and strain.
Starting with the out-of-plane displacements, which are the most prominent in this loading case, the contours predicted by the FE model are almost identical in terms of the distribution’s qualitative characteristics, as can be observed in Figure 12a,b (e.g., the location of peaks and valleys). As far as the exact values are concerned, the maximum displacement determined by the developed numerical model presents a deviation of 6% from the results derived experimentally by the DIC system.
When focusing on displacements along the transverse axis, the numerical and experimentally derived contours correlate well in terms of their shape (Figure 12c,d). The percentile deviations are more notable. However, the errors are still considered low since the absolute differences in displacements along this axis are small, between 0.03 and 0.05 mm.
A plot of the thermoplastic panel’s out-of-plane deflection as a function of the pressure applied by the airbag is illustrated in Figure 13. The experimentally measured values and the numerically predicted values are compared, presenting a very good correlation. Data have been procured by processing the DIC image and the FE contour at the location of maximum displacement in the center of the rectangular skin area, enclosed by the frame and stringer (Figure 12a,b). The trend of the lines deviates slightly at very low pressures, while demonstrating very similar slopes above 0.15 bar.
To further validate the capability of the numerical model in simulating not only the stiffness but also the elastic strain state of the thermoplastic panel, strain distributions are included in the correlation study.
By observing the numerical contour and the DIC image for the longitudinal strain component, some similarities are identified. These mainly comprise the compressed strip of skin where the frame is mechanically fastened (Figure 14a,b location 1), the concentrations at the first and last bolts (Figure 14a,b location 2), and the increased strains developed in the skin bays enclosed be the two stringers and the frame (Figure 14a,b location 3). Transverse strains compare well, showcasing the same contour characteristics in most of the three locations in Figure 14c,d.
The longitudinal strain, measured by the DIC, is equal to −0.08% at location 1 in Figure 14a, where the frame attaches to the skin. At location 2 (Figure 14a), stress concentrations near the bolts are experimentally found to be equal to 0.12%. The numerical simulation estimates strains in the order of 0.1% at both of these locations. The transverse component of strain concentrations at the first and last bolts also correlates well between FE and DIC (Figure 14c,d location 1). This is a clear sign that a portion of the bolts introduced bearing stresses to the skin, while at the last and first bolts, stress concentrations developed that typically cause shear-out and net section failure. Strains corresponding to location 2 present more pronounced deviations from the experiment, where higher strains are observed. Finally, compressive strains caused by the contact with the stringers (Figure 14c,d location 3) are determined to be equal to approximately 0.04–0.08% by both methods.
The correlation results of load case 1 are presented in Table 3.

5.2. Load Case 2: Linear Compression up to 11.5 kN

In this test, the fuselage panel is loaded in compression to first examine the response of the test rig and complete the actuator’s setup before studying the panel’s buckling performance.
During the initial compression test, the fuselage panel is subjected to a force of 11.5 kN. Regarding the actuator, both manual and automatic displacement control have been tested to observe any differences and select the most suitable approach.
Manual control of the hydraulic jack involves the direct application of displacement values according to user commands. On the other hand, displacement-based control is accomplished by programming loading routines using the Instron actuator’s software (Instron FastTrack 8800 Controller Firmware Version 8.16) and gradually ramping to the desired values in steps. In the experiments, the displacement of the actuator head is recorded by external LVDT sensors mounted on it. During the compression test of load case 2, the specimen is neither supported by rods nor tethered to the rectangular frame (Figure 15a). Displacing control is selected since it generally provides more refined adjustments during load introduction.
After the desirable function of the actuator’s PID controller has been verified, comparisons with the numerical predictions are made. In Figure 15b, the load-displacement curves are shown where the experimental curve is observed to be non-linear, exhibiting a smaller initial slope that gradually approaches the slope of the numerical curve. This phenomenon indicates possible gaps and loose connections at the rig’s interfaces, which adversely affect the specimen’s effective stiffness. After the loads are further increased, the rig’s influence is reduced, and compression is fully transmitted to the specimen. A maximum displacement of 0.249 mm has been measured in the test, while 0.227 mm is predicted by the FE model. This constitutes an 8.8% error in the simulation, which is considered acceptable at these lower loads due to the inherent tolerances of the test bench affecting measurements. In Figure 15b, both the linear fit and the secant line of the experimental data demonstrate a slope of the force–displacement curve that is comparable to the one predicted by the numerical analysis. Figure 16 showcases a comparison of the longitudinal displacement distribution at 11.5 kN that has been measured by the DIC system and calculated by the FE model. The contours correlate well with regard to their uniformity, presenting a similar gradient of deformation.

5.3. Load Case 3: Buckling Caused by Uniaxial Compression

The buckling behavior of the specimen is studied until local instabilities in the skin start to develop. Two types of analysis are used to simulate this phenomenon in numerical format. The first utilizes an eigenvalue solver to determine the most critical compressive buckling modes, while the second is a non-linear multi-step analysis that incorporates large deflection mechanics into the calculations.
The eigenvalue solver calculates critical modal shapes that comprise waveforms that consist of one notable “peak and valley” area (Figure 17a,b). This mode type is characteristic of large-aspect ratio, quasi-isotropic plates subjected to compression [41]. Only the first two critical buckling loads are presented, which are calculated to be 21.23 kN and 21.83 kN. The subsequent modes of buckling appear at loads significantly different from the loads applied during the experiment and are therefore not considered in this study.
Before performing correlation with the experimental results, a second analysis is performed, in which the load is progressively introduced in discrete load steps, and the influence of large rotations is added into the numerical formulation of the stiffness matrix. This analysis predicts elastic behavior up to 23 kN, where a sudden loss in stiffness has been calculated, indicating the onset of buckling. The numerical simulation calculates an out-of-plane deformation similar to what has been suggested by the eigenvalue analysis. Namely, the non-linear solver calculates an elliptically shaped depression on the frontal skin bay (Figure 17c). This is a sign of pronounced instability occurring in the skin, which starts to locally buckle between the stiffeners. Thus, the non-linear analysis is able to accurately predict the location of the buckling mode located in the skin bay, as shown in Figure 17c,d.
On the subject of examining the measurements acquired through the experimental procedure, DIC image data are presented and compared to both the eigenmodes and the large deflection analysis’s contours. The full-field images measured by the DIC sensors indicate a highly deformed circular area on the frontal skin bay (Figure 17d). This result is in relatively good agreement with the modal shapes from the eigenvalue analysis, while presenting an improved correlation with the large deflection analysis’ predictions. When comparing the magnitude of displacement, the experimental value is −2.95 mm, while its numerical counterpart is calculated to be −7.15 mm.
The specimen starts to buckle at 22.4 kN of compression during the experiment. On the other hand, the numerical simulations predict 21.23 kN (first eigenvalue), 21.83 kN (second eigenvalue), and 23 kN (non-linear analysis), leading to errors of 5.2%, 2.5%, and 2.7%, respectively. These results are in relatively close agreement with buckling studies performed on similar specimens [43,44]. The predictions do not appear to diverge significantly from the experiment, presenting excellent correlation.
To further evaluate the FE data, displacements along the longitudinal axis are compared with those obtained from the test. The contours corresponding to these displacements exhibit similar characteristics among the DIC images and the FE, showing a mostly uniform gradient of increasing magnitude (Figure 17e). However, in the test, an asymmetry is observed that is most pronounced near the actuator side (Figure 17f). The longitudinal component is not completely uniform close to the loaded area but varies along the transverse direction. A minimum longitudinal displacement value of −0.4 mm is derived. A 1% error is computed in relation to the numerically obtained displacement of −0.396 mm. All these data are showcased in Figure 18 in the form force–displacement curves.
The difference in apparent stiffness is expressed by either fitting the data with a linear function or using the maximum load with maximum displacement to form the secant line. The numerical curve is characterized by an estimated effective longitudinal stiffness equal to 58.5 kN/mm. The experimental curve yields values of 55.39 kN/mm and 55.82 kN/mm when applying linear or secant line fitting, respectively. In conclusion, as far as the in-plane compression is concerned, the FE model overestimates or underestimates the buckling loads by 3–5%, depending on the applied method, and is able to accurately simulate the thermoplastic panel’s effective compressive stiffness within an error of 5.2%.
The correlation results of load case 3 are presented in Table 4.

5.4. Load Case 4: Combined Loading Case (Compression and Internal Pressure)

In the last load case, the specimen’s buckling performance is assessed when lateral pressure is concurrently introduced by the airbags. The goal is to study the effect that the skin’s pressurization has on the loss of stiffness brought about by buckling due to compression. Some studies, found in references [44,45,46], propose that the biaxial stress state developed by lateral pressure has a positive impact on the buckling behavior. Most research suggests that pressure causes the stretching of the plate or shell and prestresses the material in tension, thereby making it more resistant to buckling collapse. In this study, pressure is applied up to 0.2 bar after subjecting the panel to compression.
In Figure 19, the DIC images are individually compared with the contours calculated by the FE analysis with respect to the out-of-plane and longitudinal components. Starting with the out-of-plane displacements, skin inflation is similar to the pressure load case; however, in the combined case, the distribution is asymmetric. Higher displacements are observed at the specimen’s rear than at the front.
This deformed state comprises a superposition of the deformation caused by compression and lateral pressure. The numerical model is not able to fully recreate this asymmetry; however, it nevertheless predicts a maximum out-of-plane displacement equal to 4.15 mm. This result is close to the average, calculated by Equation (1), of the two out-of-plane displacements located at each peak in Figure 19a. The percentile error between the FE result and the experimental average of the peaks is calculated to be 4%.
u z , a v e r a g e = u z , p e a k 1 + u z , p e a k 2 2 = 3.75   m m + 4.91   m m 2 = 4.33   m m
Displacements measured along the specimen’s longitudinal axis showcase an asymmetry in the transverse direction at the front, as well as the rear (Figure 19c). The numerical contours in Figure 19d do not fully capture this phenomenon, preserving symmetry in the transverse direction while predicting more notable deformation near the straight edges. Despite this, the magnitude of longitudinal displacement determined by the FE model coincides with the experiment, presenting only a 6% deviation.
As a next step, strain data are compared. Strain components along the longitudinal and transverse directions, as well as equivalent strains calculated according to the von Mises criterion, are included as part of this study. Overall, the strains recorded during the experiment indicate excellent agreement with the numerical contours regarding both their distribution and magnitude. The FE simulation managed to predict concentrations and local maxima/minima at the same locations as the test. These localized strain patterns were measured in the regions above the stiffener’s attachment to the skin and were partially caused by the stiffness mismatch due to the different materials of the components.
Figure 20 contains all numerical contours and distributions recorded and processed by the DIC software (ARAMIS v6.3). When focusing on the longitudinal component, the strip of skin near and on the opposite sides of the center, where the frame is attached to the panel (Figure 20a,b location 1), is subjected to compression. Concerning the transverse strains, concentrations around the first and last holes are prominent (Figure 20c,d location 1). Additionally, significant strains are developed inside the two skin bays, which are depicted in the DIC images (Figure 20c location 2), as well as in the numerical contours (Figure 20d location 2). Finally, the skin is compressed in the areas where the stringers were bonded to the skin, which prevented the straight edges from stretching due to the pressure load (Figure 20c,d location 3).
The hoop stresses typically generated in a pressurized fuselage were prominently illustrated in the corresponding strain distributions of Figure 20c,d. The von Mises equivalent strains demonstrated a high degree of correlation between the FE and DIC images, where, on both occasions, the maximum value was 0.3% in the region where the frame was bolted to the panel (Figure 20e,f location 1).
In order to investigate the effect of skin pressurization on the buckling behavior, two force–deflection curves are plotted in Figure 21a. Both curves comprise experimental results. The effect of adding pressure is an increase in the specimen’s effective stiffness. Additionally, as can be seen in Figure 19a, the inflation caused by pressurization prevents the collapse of the skin, which is observed in the compression-only test (Figure 17d). It is therefore concluded that internal pressure loading has a positive influence on the fuselage panel’s buckling performance when loaded in compression. Additionally, comparisons are made to the numerical results in Figure 21b. The final value of longitudinal displacement calculated by the FE is very close to the experimental value, presenting only a 2.5% deviation.
The correlation results of load case 4 are presented in Table 5.

6. Conclusions and Discussion

In this paper, the design, development, and implementation of a novel test rig concept are presented, aimed at the structural investigation of an innovative idea for a curved stiffened panel representing a fuselage section. Initially, the required tooling, equipment, and parts of the experimental arrangement were designed, assembled for installation, and calibrated. With regard to the numerical simulation aspect of the work, a finite element model was developed and validated through correlation with data procured from the experiments. Load, displacement, and strain data were used to ascertain if the stiffness of the test rig’s supports and connections was successfully simulated in the model. These comparisons provided valuable information to pinpoint deficiencies in the test rig’s design and lead to possible improvements.
Three loading scenarios were studied: in-plane compression, lateral pressure, and their combination. The specimen was subjected to compression until the skin started to buckle at 22.4 kN. Numerical simulations provided a wide array of data, which were presented as displacement and strain contours. Comparisons were made between the FE predictions and the experimental measurements, which generally indicated a satisfactory level of agreement. As far as the internal pressure load case was concerned, the specimen’s displacement contours matched very well in all directions. Strain data pertaining to the longitudinal and transverse orientations were successfully compared. The FE model was able to predict the strain distributions with reasonably high accuracy. Numerically calculated strain/stress concentrations near the region of frame attachment coincided with the DIC images.
The panel’s buckling response when loaded in compression was also simulated by applying both eigenvalue and large deflection methods. The critical loads at which local skin buckling initiated were calculated to be equal to 21–23 kN, depending on the approach. These results compared closely to the load observed during testing, presenting only minor discrepancies. Any deviations from the critical load were attributed to defects in the specimen or additional parasitic bending moments introduced by the actuator and the assembly. Nevertheless, the non-linear, large deflection, multi-step analysis was able to predict a similar buckling mode of local skin buckling.
The final load case was the combined compression and lateral pressure test, where the skin pressurization’s effect on buckling due to compression was studied. Furthermore, a wide variety of digital and experimental data were correlated. Numerical contours and distributions calculated by the DIC device correlated well in most cases. Finally, out-of-plane displacements and load–deflection curves indicated that lateral pressure had a positive impact on the fuselage panel’s buckling performance.
The present paper proposes a novel concept for a test bench to support structural experiments on a full-scale curved stiffened panel made of thermoplastic composite and metallic materials. An experimental campaign was carried out to validate a finite element model by performing correlations of stiffness, deflection, and strain data. Overall, the results obtained from this study verified that the proposed test bench, which can support both static and buckling tests, is a useful tool for testing stiffened panels under multi-axial loading conditions.

Author Contributions

Conceptualization, G.N.L.; methodology, P.D.K., K.T.F. and G.N.L.; formal analysis, P.D.K.; investigation, P.D.K. and K.T.F.; writing—original draft preparation, P.D.K.; writing—review and editing, K.T.F. and G.N.L.; supervision, G.N.L. All authors have read and agreed to the published version of the manuscript.

Funding

The work presented in the manuscript was partly funded by the project described below: Call for proposal: Clean Sky 2 Call for Proposals 08 (H2020-CS2-CFP08-2018-01); Proposal title: Development and execution of new test procedures for thermoplastic aircraft fuselage panels; Proposal ID: JTI-CS2-2018-CfP08-LPA-02-23; Project name: Novel Test Methods and Numerical Methodologies Towards a Comprehensive Understanding of the Structural Behaviour of Thermoplastic Fuselage Panels; Project acronym: NEMO; Project ID: 831996; Project code: ΓΓ2CS-0128605.

Data Availability Statement

The data presented in this study are available upon request from the corresponding author. The data are not publicly available due to ongoing research findings.

Conflicts of Interest

The authors declare no conflicts of interest.

References

  1. Harris, C.E.; Starnes, J.H., Jr.; Shuart, M.J. Design and Manufacturing of Aerospace Composite Structures, State-of-the-Art Assessment. J. Aircr. 2002, 39, 545–560. [Google Scholar] [CrossRef]
  2. Jones, R.; Peng, D. A Building Block Approach to Sustainment and Durability Assessment: Experiment and Analysis. Compr. Struct. Integr. 2023, 7, 73–101. [Google Scholar] [CrossRef]
  3. Markus, W. Building Block Approach for Development of Structural Health Monitoring Technologies Using Idealized Demonstrators. 2022. Available online: https://resolver.obvsg.at/urn:nbn:at:at-ubl:1-53692 (accessed on 2 March 2025).
  4. Tropis, A.; Thomas, M.; Bounie, J.L.; Lafon, P. Certification of the Composite Outer Wing of the ATR72. Proc. Inst. Mech. Eng. Part G 1995, 209, 327–339. [Google Scholar] [CrossRef]
  5. Hamm, K.R.; Phillips, D.R.; Imtiaz, K.S.; Raju, I.S. Revisiting Building Block Approaches for Structures. In Proceedings of the AIAA SCITECH 2022 Forum, San Diego, CA, USA, 3–7 January 2022. [Google Scholar] [CrossRef]
  6. Rouse, M.; Jegley, D.; McGowan, D.; Bush, H.; Waters, W. Utilization of the Building-Block Approach in Structural Mechanics Research. In Proceedings of the 46th AIAA/ASME/ASCE/AHS/ASC Structures, Structural Dynamics and Materials Conference, Austin, TX, USA, 18–21 April 2005. [Google Scholar] [CrossRef]
  7. Hiken, A. The Evolution of the Composite Fuselage—A Manufacturing Perspective. SAE Int. J. Aerosp. 2017, 10, 77–91. [Google Scholar] [CrossRef]
  8. Zhu, L.; Li, N.; Childs, P.R.N. Light-weighting in aerospace component and system design. Propuls. Power Res. 2018, 7, 103–119. [Google Scholar] [CrossRef]
  9. Kirubakaran, R.; Lokesharun, D.; Rajkumar, S.; Anand, R. Aircraft Wing Weight Optimization by Composite Material Structure Design Configuration. IOSR J. Mech. Civ. Eng. 2017, 14, 71–80. [Google Scholar]
  10. Zaragkas, T.; Psarras, S.; Sotiriadis, G.; Kostopoulos, V. Experimental Building Block Approach and Numerical Modelling of CF-LMPAEK. In Proceedings of the 11th International Conference on Composite Testing and Model Identification, Girona, Spain, 31 May–2 June 2023. [Google Scholar]
  11. Soden, P.D.; Hinton, M.J.; Kaddour, A.S. Lamina properties, lay-up configurations and loading conditions for a range of fibre reinforced composite laminates. In Failure Criteria in Fibre-Reinforced-Polymer Composites; Elsevier: Amsterdam, The Netherlands, 2004; Chapter 2.1; pp. 30–51. [Google Scholar] [CrossRef]
  12. Wright, T.; Hyder, I.; Daniels, M.; Kim, D.; Parmigiani, J.P. Effects of material property variation in composite panels. Aircr. Eng. Aerosp. Technol. 2017, 89, 274–279. [Google Scholar] [CrossRef]
  13. Warzok, F. Experimental and Numerical Characterisation of Fatigue Damage in Z-Pinned Composite Structures. Ph.D. Thesis, University of Bristol, Bristol, UK, 14 November 2017. [Google Scholar]
  14. Zhong, Z.; Wang, F.; Kong, F.; Chen, Y. Study of fatigue damage behavior in off-axis CFRP composites using digital image correlation technology. Heliyon 2024, 10, 3. [Google Scholar] [CrossRef]
  15. Riccio, A.; Castaldo, R.; Palumbo, C.; Russo, A. Delamination Effect on the Buckling Behaviour of Carbon–Epoxy Composite Typical Aeronautical Panels. Appl. Sci. 2023, 13, 4358. [Google Scholar] [CrossRef]
  16. Best, R.; Fleischer, T.; Götze, M.; Sachse, M.; Semsch, M. A Test Concept for Future Aircraft Fuselage Panels. In Proceedings of the ICAF 2009, Bridging the Gap between Theory and Operational Practice, Dordrecht, The Netherlands, 27–29 May 2009; pp. 3–14. [Google Scholar] [CrossRef]
  17. Zucco, G.; Oliveri, V.; Peeters, D.; Telford, R.; Clancy, G.J.; McHale, C.; Rouhi, M.; O’Higgins, R.; Young, T.M.; Weaver, P.M. Static Test of a Thermoplastic Composite Wingbox Under Shear and Bending Moment. In Proceedings of the 2018 AIAA/ASCE/AHS/ASC Structures, Structural Dynamics, and Materials Conference, Kissimmee, FL, USA, 7 January 2018. [Google Scholar] [CrossRef]
  18. Kordas, P.D.; Lampeas, G.N. Numerical and experimental investigation of a metallic fuselage stiffened panel loaded with a representative fuselage fatigue spectrum. Int. J. Fatigue 2024, 182, 108217. [Google Scholar] [CrossRef]
  19. Kordas, P.; Fotopoulos, K.; Lampeas, G.; Karelas, E.; Louizos, E. Design and development of an experimental bench concept for testing of fuselage stiffened panels, using a virtual testing methodology. Aircr. Eng. Aerosp. Technol. 2023, 96, 14–26. [Google Scholar] [CrossRef]
  20. Ostergaard, M.; Ibbotson, A.; Roux, O.; Prior, A. Virtual testing of aircraft structures. CEAS Aeronaut. J. 2011, 1, 83–103. [Google Scholar] [CrossRef]
  21. Lampeas, G.; Carelas, E.; Kordas, P.; Karanika, A.; Fotopoulos, K. Experimental validation of aircraft fuselage sections by testing at the stiffened panel level. In Proceedings of the Aerospace Europe Conference 2023—10th EUCASS—9th CEAS, Lausanne, Switzerland, 9–13 July 2023. [Google Scholar] [CrossRef]
  22. Stamatelos, D.G.; Lampeas, G.N.; Tserpes, K.I. Analytical calculation of local buckling and post-buckling behaviour of isotropic and orthotropic stiffened panels. Thin-Walled Struct. 2011, 49, 422–430. [Google Scholar] [CrossRef]
  23. Bisagni, C.; Vescovini, R. Analytical formulation for local buckling and post-buckling analysis of stiffened laminated panels. Thin-Walled Struct. 2009, 47, 318–334. [Google Scholar] [CrossRef]
  24. Fan, S.; Kroeplin, B.; Geier, B. Buckling, postbuckling and failure behavior of composite-stiffened panels under axial compression. In Proceedings of the Structural Dynamics and Materials Conference, Dallas, TX, USA, 13–15 April 1992. [Google Scholar] [CrossRef]
  25. Kumar, N.J.; Babu, P.R.; Pandu, R. Investigations on Buckling Behaviour of Laminated Curved Composite Stiffened Panels. Appl. Compos. Mater. 2014, 21, 359–376. [Google Scholar] [CrossRef]
  26. Ambur, D.R.; Jaunky, N.; Hilburger, M.H. Progressive failure studies of stiffened panels subjected to shear loading. Compos. Struct. 2004, 65, 129–142. [Google Scholar] [CrossRef]
  27. Psihoyos, H.; Fotopoulos, K.; Lampeas, G.; Waleson, J.; Brethouwer, M.; Romano, B.; Pearson, D. Development of a numerical methodology for the analysis of the post-buckling and failure behavior of butt-joint stiffened thermoplastic composite panels. Eng. Fail. Anal. 2024, 160, 108193. [Google Scholar] [CrossRef]
  28. Bin Kamarudin, M.N.; Mohamed Ali, J.S.; Aabid, A.; Ibrahim, Y.E. Buckling Analysis of a Thin-Walled Structure Using Finite Element Method and Design of Experiments. Aerospace 2022, 9, 541. [Google Scholar] [CrossRef]
  29. Zumaquero, P.L.; Correa, E.; Justo, J.; París, F. Transverse biaxial tests on long fibre reinforced composites. Compos. Struct. 2022, 297, 115868. [Google Scholar] [CrossRef]
  30. Rouse, W.J.; van den Brink, W.M.; Maas, R. Validation and correlation of aircraft composite fuselage structure models. In Proceedings of the ECCOMAS-2016 Congress, Hersonissos, Greece, 5–10 June 2016. [Google Scholar]
  31. Rouchon, J. Certification of Large Airplane Composite Structures. 1990. Available online: https://www.icas.org/ICAS_ARCHIVE/ICAS1990/ICAS-90-1.8.1.pdf (accessed on 25 February 2025).
  32. Guyett, P.; Cardrick, A. The certification of composite airframe structures. Aeronaut. J. 2016, 84, 188–203. [Google Scholar] [CrossRef]
  33. Hombergsmeier, E. Review of Aeronautical Fatigue Investigations in Germany during the Period April 2017 to March 2019; CTO Office, Central Research & Technology, Airbus; International Committee on Aeronautical Fatigue: Köln, Germany, 2019. [Google Scholar]
  34. PERI Philippines Formwork Scaffolding Engineering. Available online: https://www.peri.com.ph/projects/working-scaffold-airbus-germany.html (accessed on 18 December 2024).
  35. Völkerink, O.; Hühne, C. Virtual testing for design and certification of (fusion) bonded longitudinal joints in a fibre composite fuselage: A proposal using FEM-based progressive damage analysis. Compos. Part C Open Access 2022, 7, 100236. [Google Scholar] [CrossRef]
  36. Mauery, T.; Alonso, J.; Cary, A.; Lee, V.; Malecki, R.; Mavriplis, D.; Medic, G.; Schaefer, J.; Slotnick, J. A Guide for Aircraft Certification by Analysis; NASA/CR-20210015404; Langley Research Center: Hampton, VA, USA, 2021. [Google Scholar]
  37. Prior, A. Dassault Systèmes, Nonlinear simulation of large scale aircraft structures—Implications for certification methodology and high performance computing infrastructure. In Proceedings of the NAFEMS World Congress, Crete, Greece, 16–19 June 2009. [Google Scholar]
  38. Prior, A. Dassault Systèmes, Simulating damage and failure in aircraft structures. In Proceedings of the RAeS Conference: Challenges for the Next Generation-Concept to Disposal, Liverpool, UK, 14–16 October 2008. [Google Scholar]
  39. Grotto, F.; Peta, O.; Bouvet, C.; Castanié, B.; Serra, J. Testing Structural Elements under Multiaxial Loading: A Numerical Model of the Bench to Understand and Predict Complex Boundary Conditions. Aerospace 2024, 11, 68. [Google Scholar] [CrossRef]
  40. Ge, D.; Mo, Y.; He, B.; Wu, Y.; Du, X. Experimental and numerical investigation of stiffened composite curved panel under shear and in-plane bending. Compos. Struct. 2016, 137, 185–195. [Google Scholar] [CrossRef]
  41. Kordas, P.D.; Lampeas, G.N.; Fotopoulos, K.T. Numerical Investigation of an Experimental Setup for Thermoplastic Fuselage Panel Testing in Combined Loading. Aerospace 2024, 11, 175. [Google Scholar] [CrossRef]
  42. Aircraft Pressurization Systems. Integrated Publishing, Inc. Available online: https://www.tpub.com/ase2/75.htm. (accessed on 25 February 2025).
  43. Vescovini, R.; Bisagni, C. Semi-analytical buckling analysis of omega stiffened panels under multi-axial loads. Compos. Struct. 2015, 120, 285–299. [Google Scholar] [CrossRef]
  44. Qi, L. A Study of the Buckling Behavior of Stiffened Panels under Compression and Lateral Pressure. Master’s Thesis, Faculty of Aerospace Engineering, Delft University of Technology, Delft, The Netherlands, 2018. [Google Scholar]
  45. Paik, J.; Kim, B.J. Ultimate strength formulations for stiffened panels under combined axial load, in-plane bending and lateral pressure: A benchmark study. Thin-Walled Struct. 2002, 40, 45–83. [Google Scholar] [CrossRef]
  46. Rouse, M.; Young, R.; Gehrki, R. Structural Stability of a Stiffened Aluminum Fuselage Panel Subjected to Combined Mechanical and Internal Pressure Loads. In Proceedings of the 44th AIAA/ASME/ASCE/AHS/ASC Structures, Structural Dynamics, and Materials Conference, Norfolk, VA, USA, 7–10 April 2003. [Google Scholar] [CrossRef]
Figure 1. Experimental facilities tailored to full-scale aircraft part tests; (a) fuselage flight load fatigue test [33], (b) wing bending test [34].
Aerospace 12 00263 g001
Figure 2. Three-dimensional illustration of the investigated curved stiffened panel.
Aerospace 12 00263 g002
Figure 3. Experimental installation aimed at the structural investigation of fuselage panels: (a) 3D CAD model, (b) installed test rig with test specimen at LTSM facilities.
Aerospace 12 00263 g003
Figure 4. (a) Transversely oriented beam on the front of the panel and load introduction component, (b) attachment with wheels rolling on the top of the rigid block, (c) Teflon film applied to the top of the rigid block, (d) rods connecting the panel to the frame and airbags under the specimen.
Aerospace 12 00263 g004
Figure 5. Actuator control systems.
Aerospace 12 00263 g005
Figure 6. (a) Test specimen with appropriate speckle pattern on its surface, (b) DIC cameras positioned above the test rig, and (c) cross-shaped calibration object during the calibration procedure.
Aerospace 12 00263 g006aAerospace 12 00263 g006b
Figure 7. Figures of maximum displacement as a function of facet size and overlap for 2 load cases: facet size (25% overlap) in the case of (a) in-plane compression and (b) lateral pressure; facet overlap percentage (25 × 25 pixels facet size) in the case of (c) in-plane compression and (d) lateral pressure.
Aerospace 12 00263 g007
Figure 8. Numerical simulation of the fuselage panel, including details such as the holes and the cutouts made on the frame; skin highlighted with cyan, stringers with red and the frame with purple color.
Aerospace 12 00263 g008
Figure 9. Finite element model of the specimen with its supports, showcasing the connection to the rectangular frame; rods are highlighted in dark blue, rectangular frame and nodal couplings are highlighted in green, and steel plates are highlighted in magenta.
Aerospace 12 00263 g009
Figure 10. Contours calculated by the DIC system’s programming tool to determine the specimen’s (a) radius of curvature, (b) width, (c) length, and (d) out-of-plane position.
Aerospace 12 00263 g010
Figure 11. Side view of the loaded panel edge, where the actuator’s force (highlighted as a red vector) is transferred by a master node via nodal couplings (highlighted as magenta points) to a zone simulating the part of the panel (highlighted with blue and red) infused with resin inside the rigid block.
Aerospace 12 00263 g011
Figure 12. Full-field optical measurements and numerical contours of displacements for the pressure-only load case; out-of-plane deformation in the (a) experiment and the (b) FE analysis; transverse deformation in the (c) experiment and the (d) FE analysis.
Aerospace 12 00263 g012
Figure 13. Load–deflection curve for load case 1 (lateral pressure) to compare numerical (colored in red) and experimental (colored in blue) results.
Aerospace 12 00263 g013
Figure 14. Full-field optical measurements and numerical contours of strains for the pressure-only load case; longitudinal component in the (a) experiment and the (b) FE analysis; transverse component in the (c) experiment and the (d) FE analysis.
Aerospace 12 00263 g014
Figure 15. (a) Experimental arrangement used during the 11.5 kN compression test; (b) load–deflection diagram, where the loading curves of the numerical simulation (line colored in red) and the experiment (dot line colored in back) are illustrated, along with its linear fit (dashed line colored in blue) and its secant line (dashed line colored in green).
Aerospace 12 00263 g015
Figure 16. (a) Longitudinal displacement predicted by the numerical analysis, (b) longitudinal displacement measured by DIC.
Aerospace 12 00263 g016
Figure 17. Contour plots measured by the DIC device and numerically calculated regarding buckling of the panel when compressed; (a) first eigenmode, (b) second eigenmode, (c) out-of-plane deformation predicted by the non-linear analysis at the last step, (d) out-of-plane deformation measured by DIC, (e) longitudinal displacement predicted by the non-linear analysis at the last step, (f) longitudinal displacement measured by DIC.
Aerospace 12 00263 g017aAerospace 12 00263 g017b
Figure 18. Force–displacement curves; numerical data highlighted in a red dashed line; experimental data highlighted in a black dotted line; linear fit highlighted in a blue dashed line; secant highlighted in a green dashed line.
Aerospace 12 00263 g018
Figure 19. Full-field optical measurements and numerical contours of displacements for the combined compression and pressure load case; out-of-plane deformation in the (a) experiment and the (b) FE analysis; longitudinal deformation in the (c) experiment and the (d) FE analysis.
Aerospace 12 00263 g019aAerospace 12 00263 g019b
Figure 20. Full-field optical measurements and numerical contours of strains for the combined compression and pressure load case; longitudinal component in the (a) experiment and the (b) FE analysis; transverse component in the (c) experiment and the (d) FE analysis; equivalent von Mises strains in the (e) experiment and the (f) FE analysis.
Aerospace 12 00263 g020aAerospace 12 00263 g020b
Figure 21. (a) Experimental-only force–displacement curves of the compression-only (highlighted in red color) and compression plus pressure load cases (highlighted in blue color); (b) force–displacement curves of the compression plus pressure load case, as measured in the experiment (highlighted as a blue solid line) and as predicted by the numerical model (highlighted as a red dashed line).
Aerospace 12 00263 g021
Table 1. Table of the materials, laminations, and thicknesses of the panel’s main structural components (All items and materials procured from ADAMANT COMPOSITES Ltd., Patras, Greece).
Materials and Thicknesses of the Investigated Panel
ComponentMaterialLaminationThickness (mm)
SkinLMPAEK composite[+45/−45/90/0/90/0/90/−45/+45]1.8
StringerToughened epoxy composite[45/−45/0/90/0/−45/45]1.3
Frame7000 series aluminum alloy-2
Adhesive filmFM 300-2 epoxy resin system --
EN6115 BoltsAlloy steel 4340--
Table 2. Convergence study on the image processing parameters of the DIC device, pertaining to facet size and overlap.
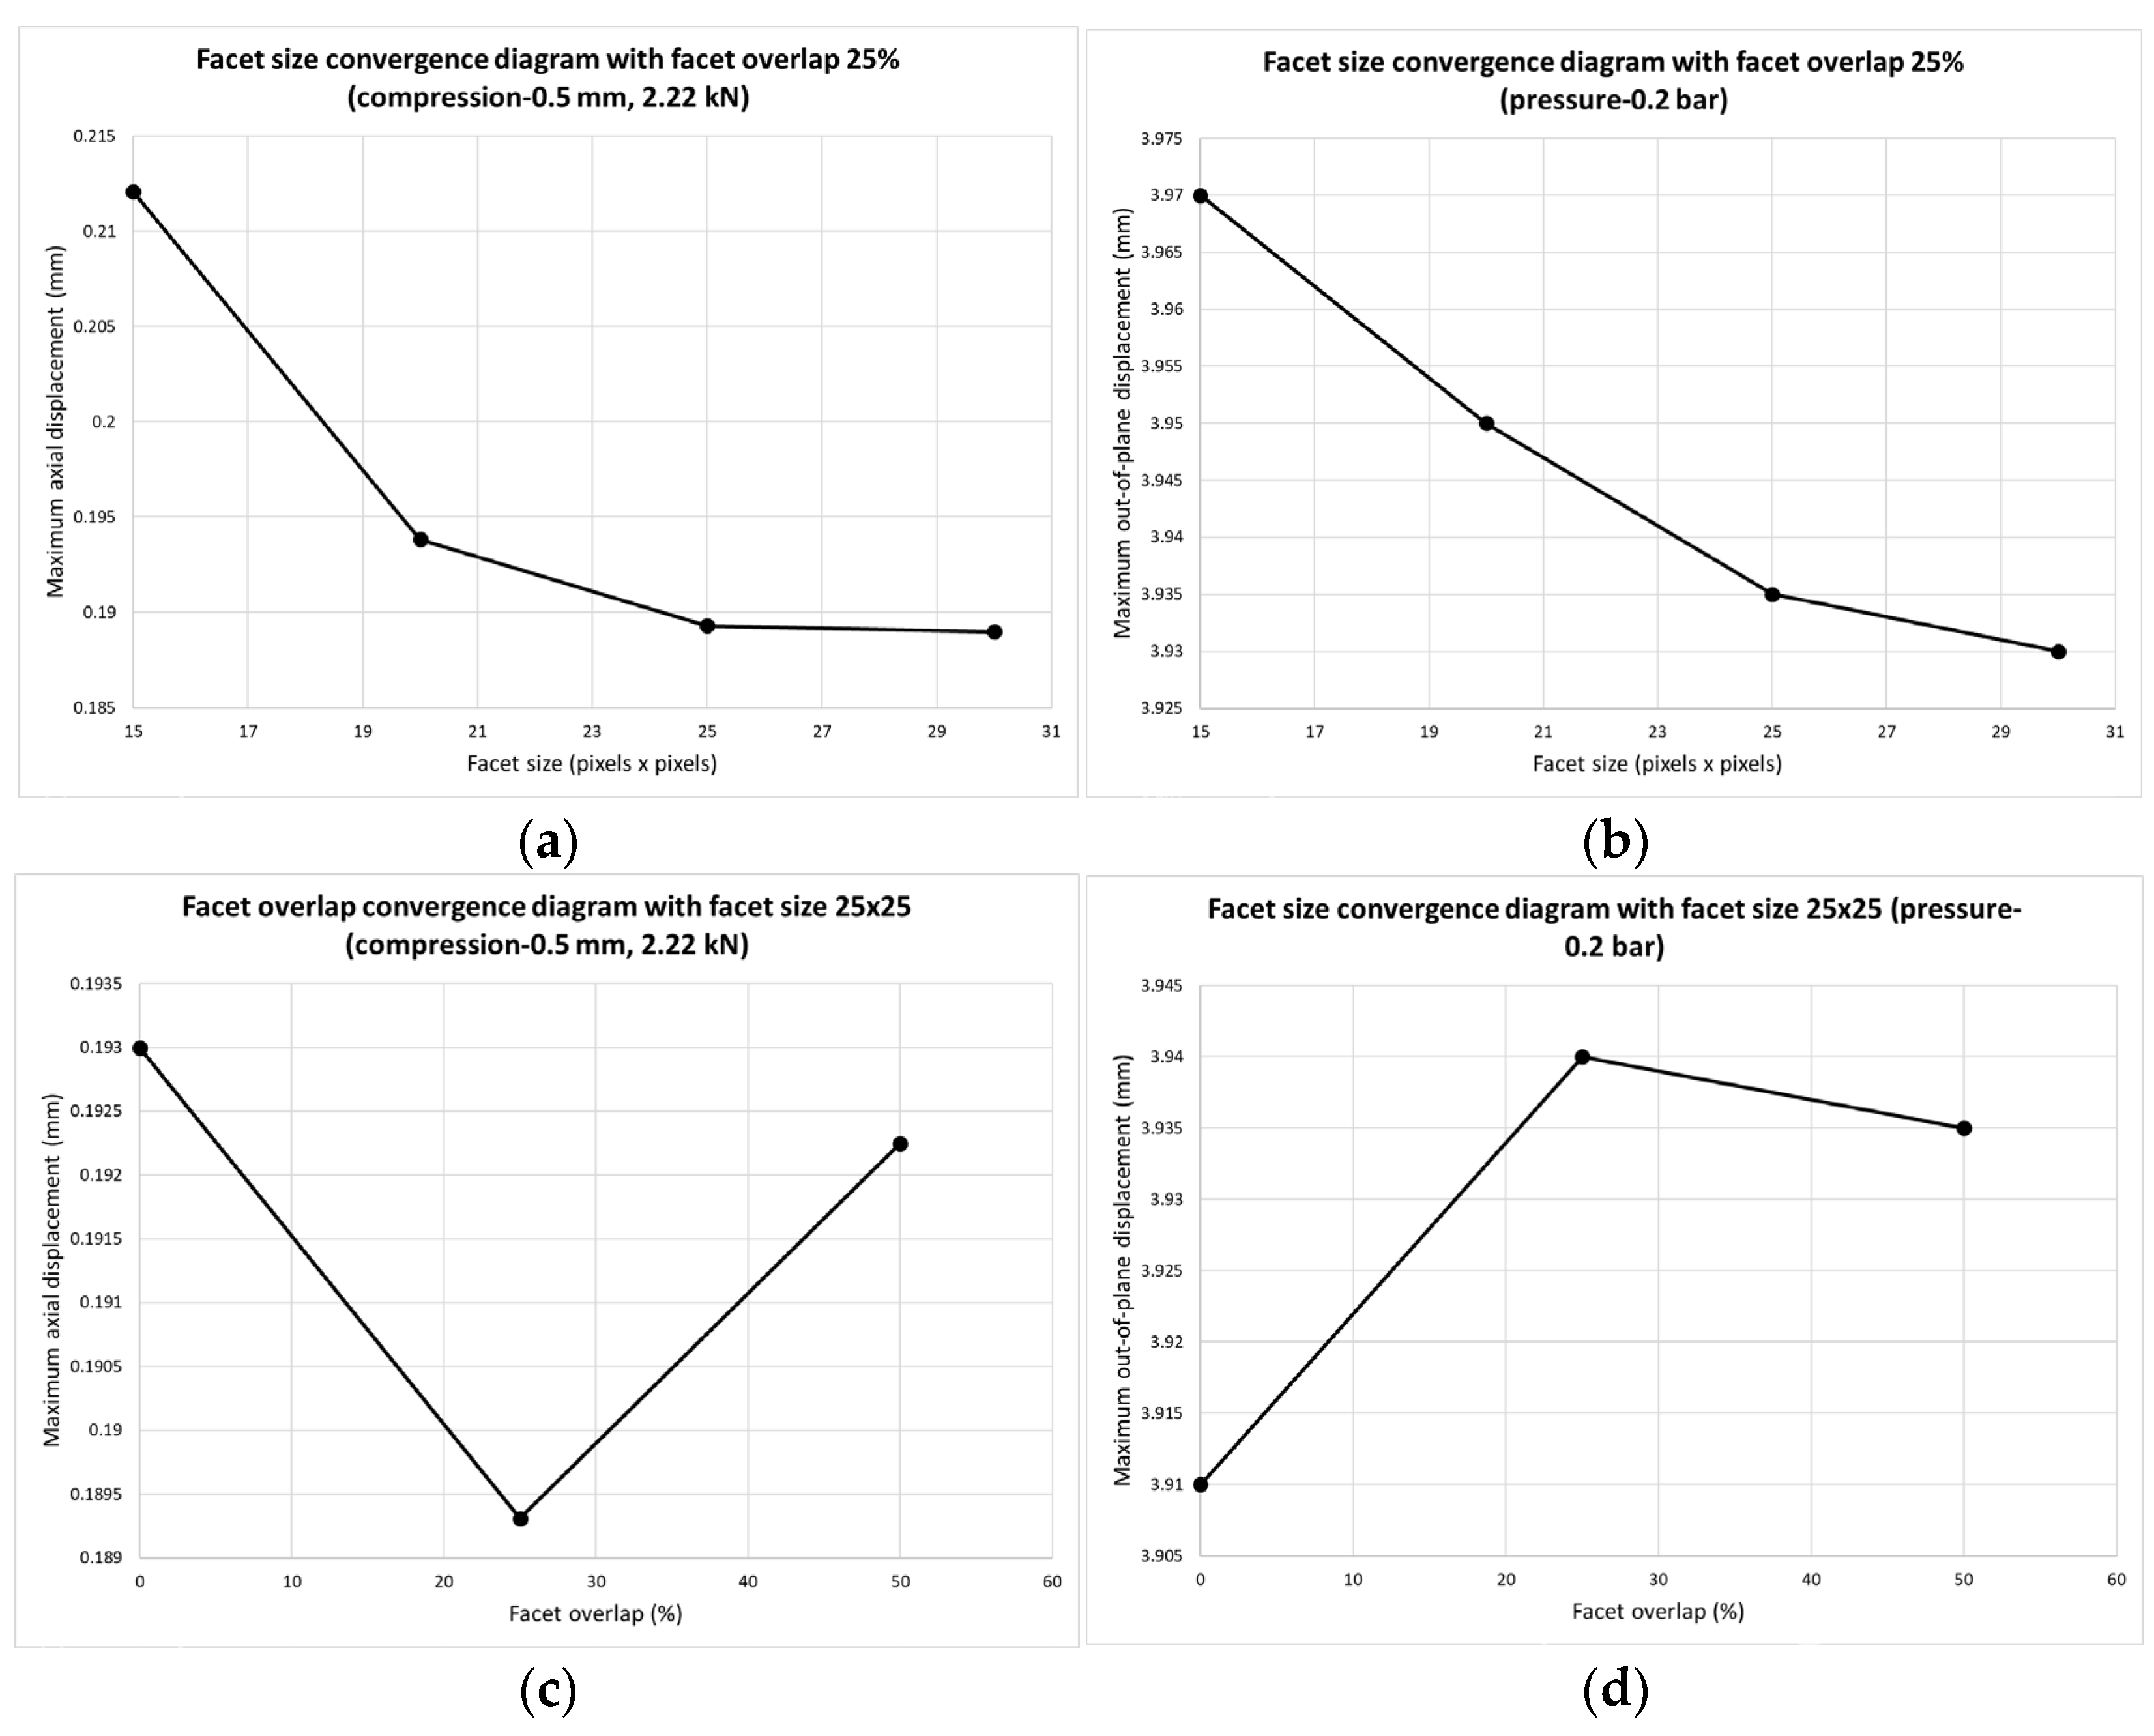
Facet Size Convergence Study (25% Facet Overlap)
Load Case15 × 15 Pixels20 × 20 Pixels25 × 25 Pixels30 × 30 Pixels
Compression (2.2 kN)0.212 mm0.194 mm0.18931 mm 0.189 mm
Lateral pressure (0.2 bar)3.97 mm3.95 mm3.935 mm3.93 mm
Facet Overlap Convergence Study (25 × 25 Pixel Facet Size)
Load Case0%25%50%-
Compression (2.2 kN)0.193 mm0.18931 mm0.19225 mm-
Lateral pressure (0.2 bar)3.91 mm3.935 mm3.93 mm-
Table 3. List of experimental and numerical data for load case 1 and their correlation.
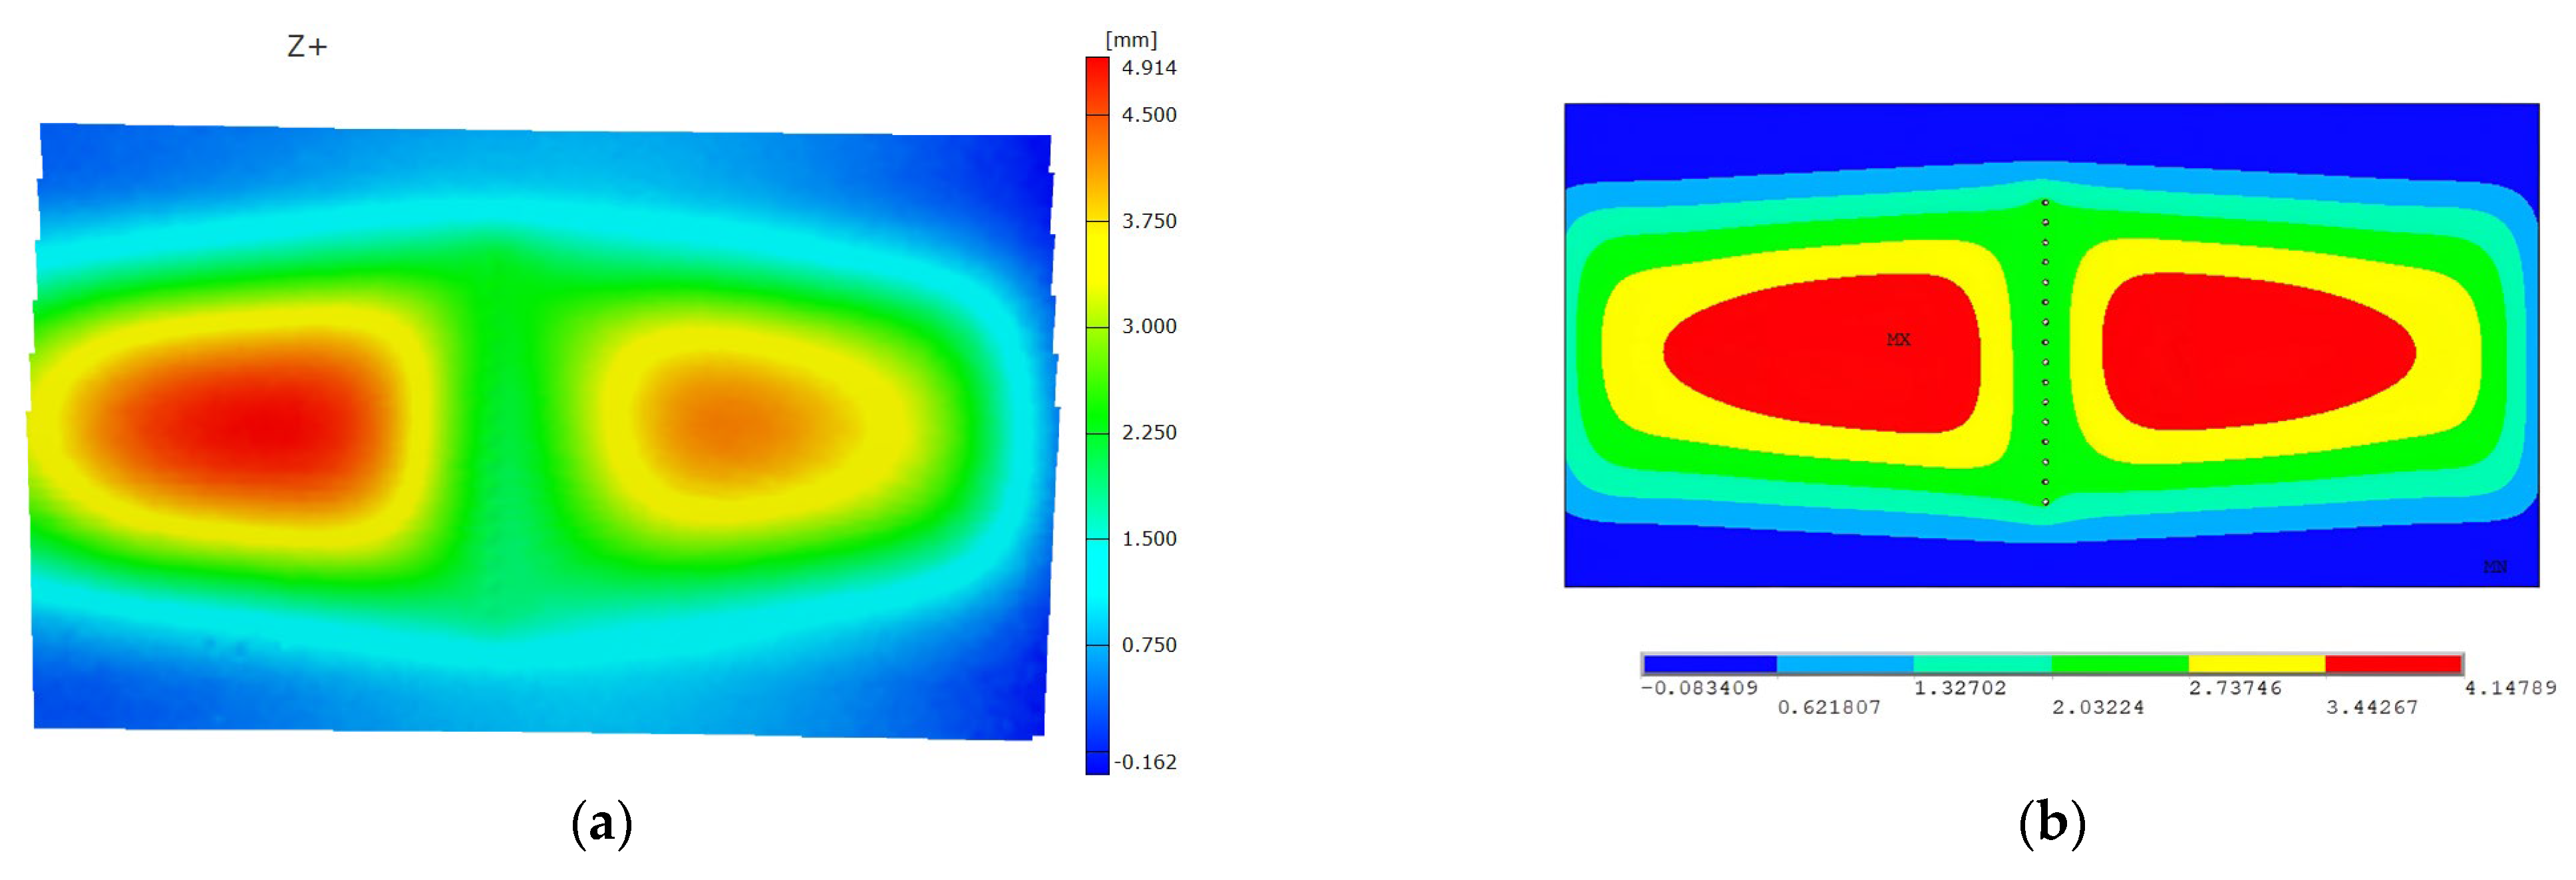
Pressure-Only Load Case—Displacements (mm)
Result TypeOut-of-Plane (max.)Transverse (max. and min.)
Finite element model4.010.158 and −0.157
Experiment3.770.135 and −0.113
Percentile deviation (%)6.4%17% and 39.8%
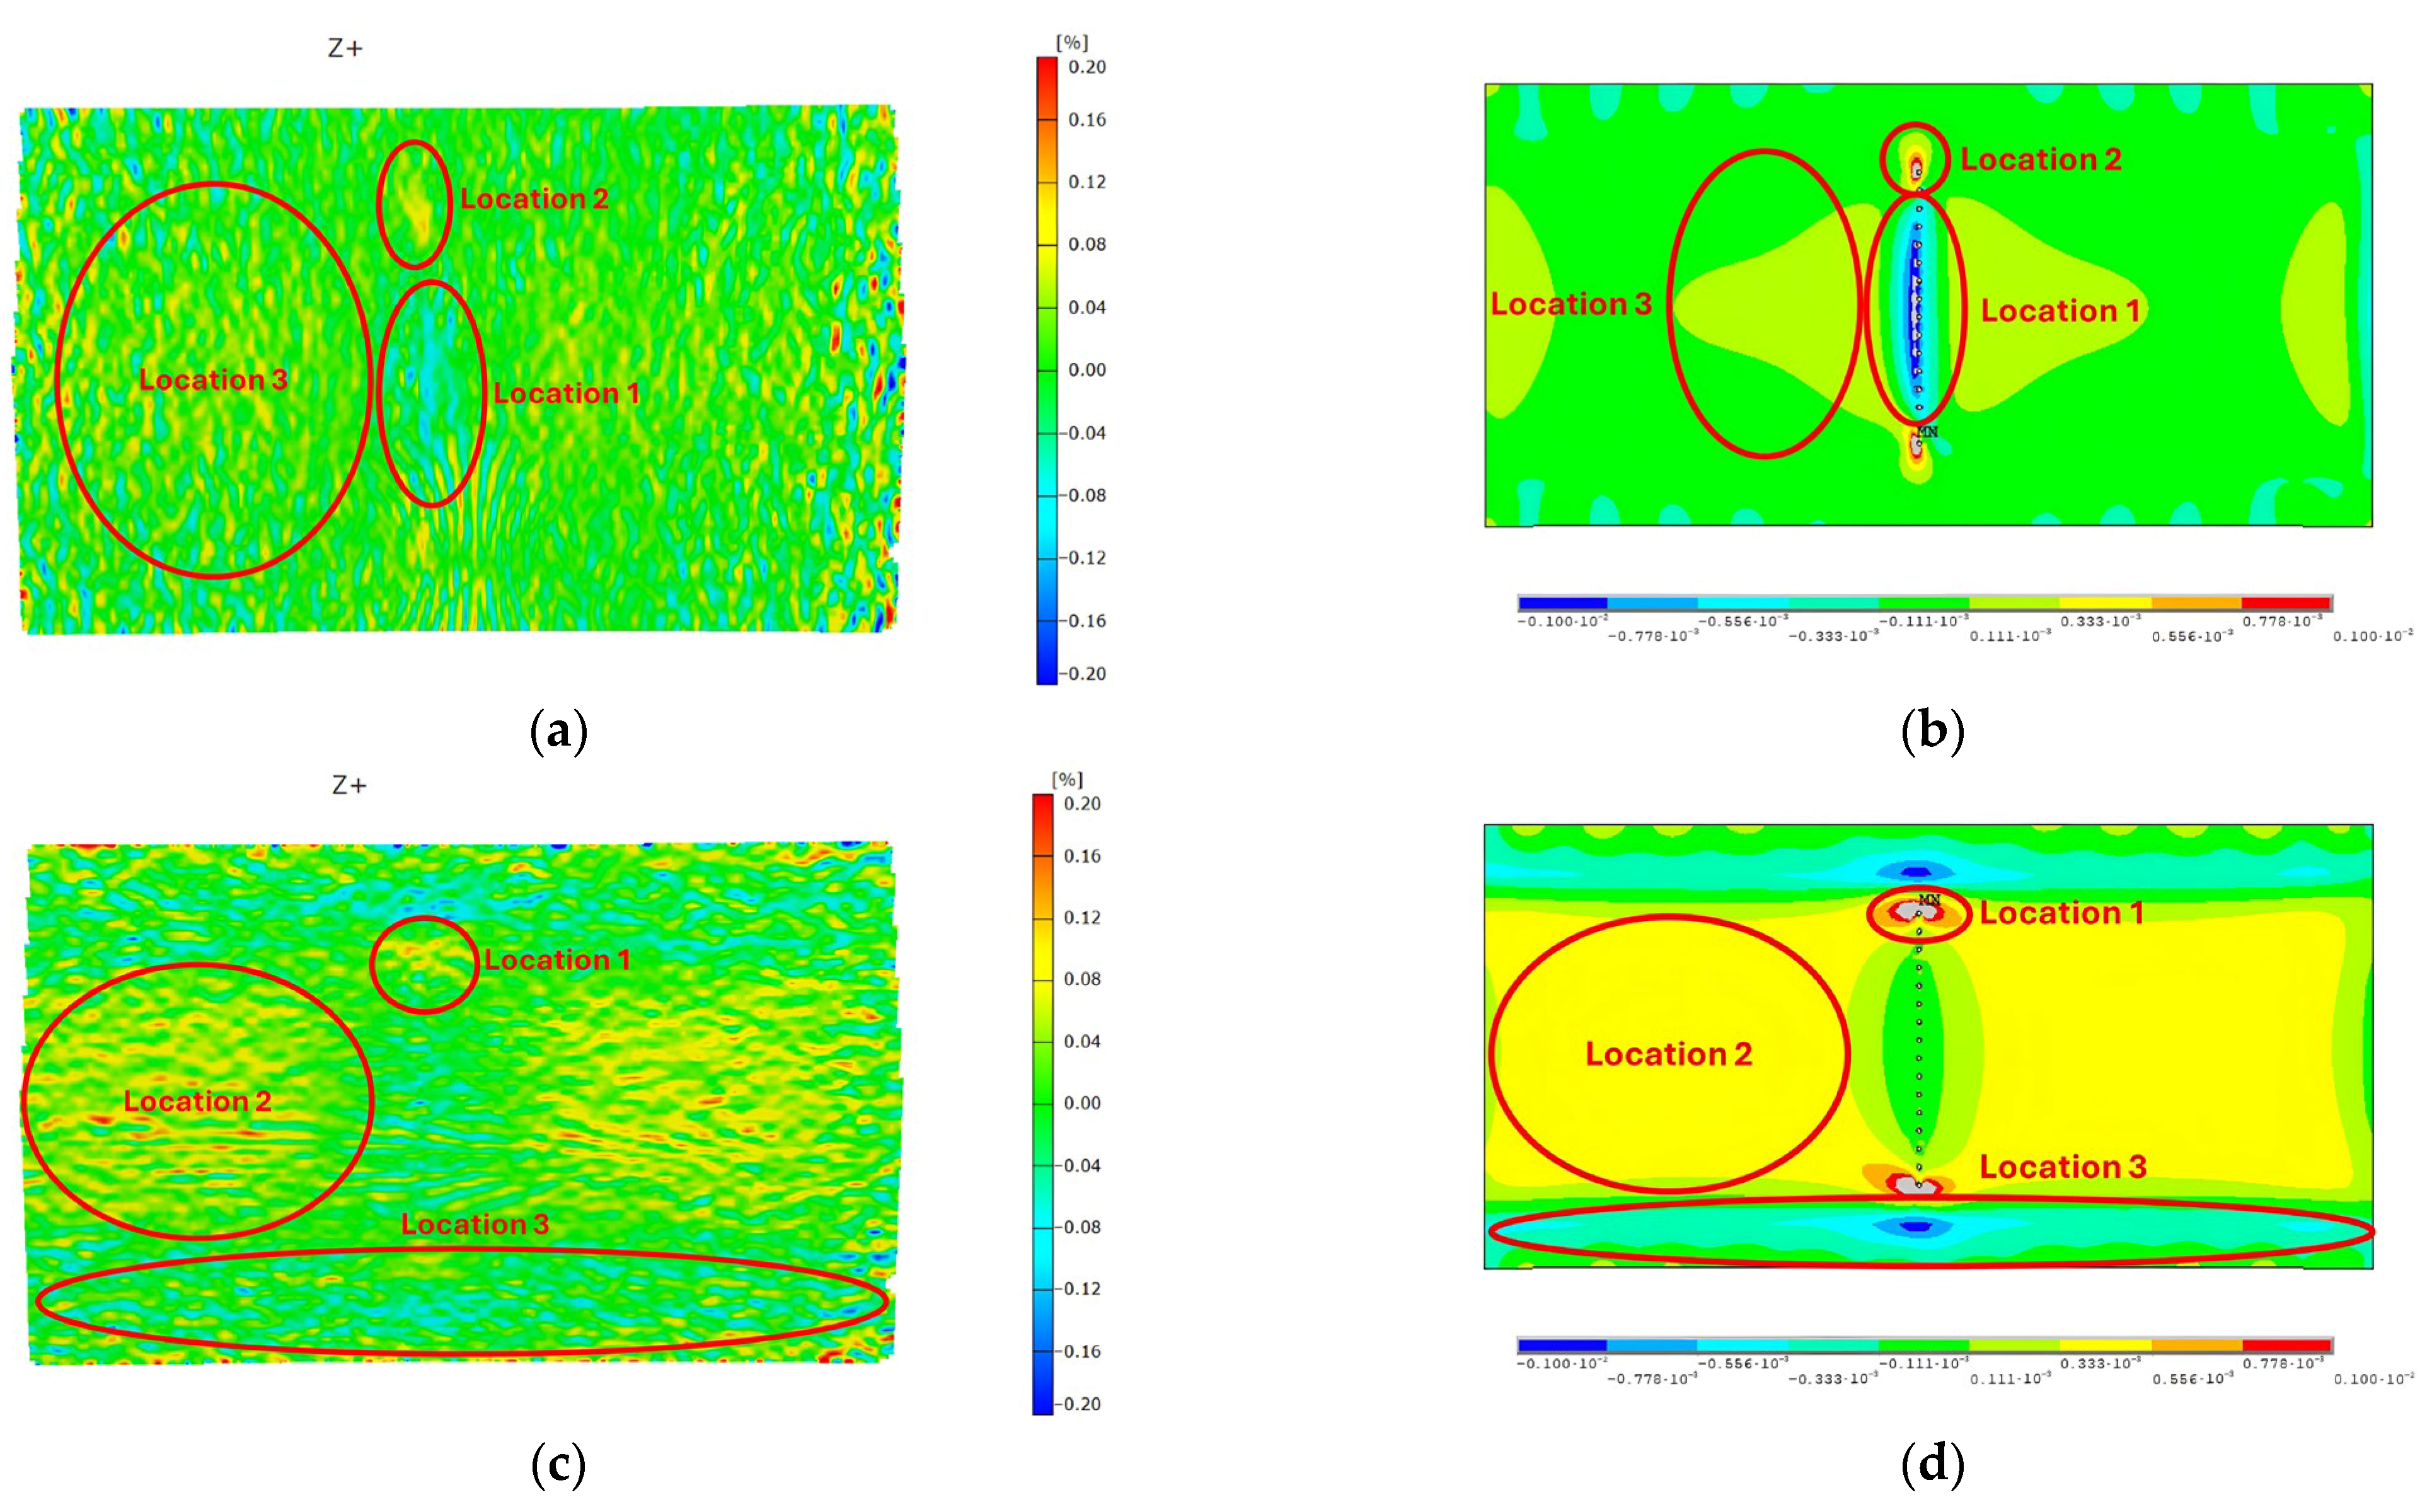
Pressure-Only Load Case—Strains (%)
LongitudinalTransverse
Finite element model−0.1% (location 1), 0.1% (location 2) 0.1% (location 1), −0.778% (location 3)
Experiment−0.12% (location 1), 0.08% (location 2) 0.12% (location 1), −0.08% (location 3)
Percentile deviation (%)16.7%, 25% 16.7%, 2.7%
Table 4. List of experimental and numerical data for load case 3 and their correlation.
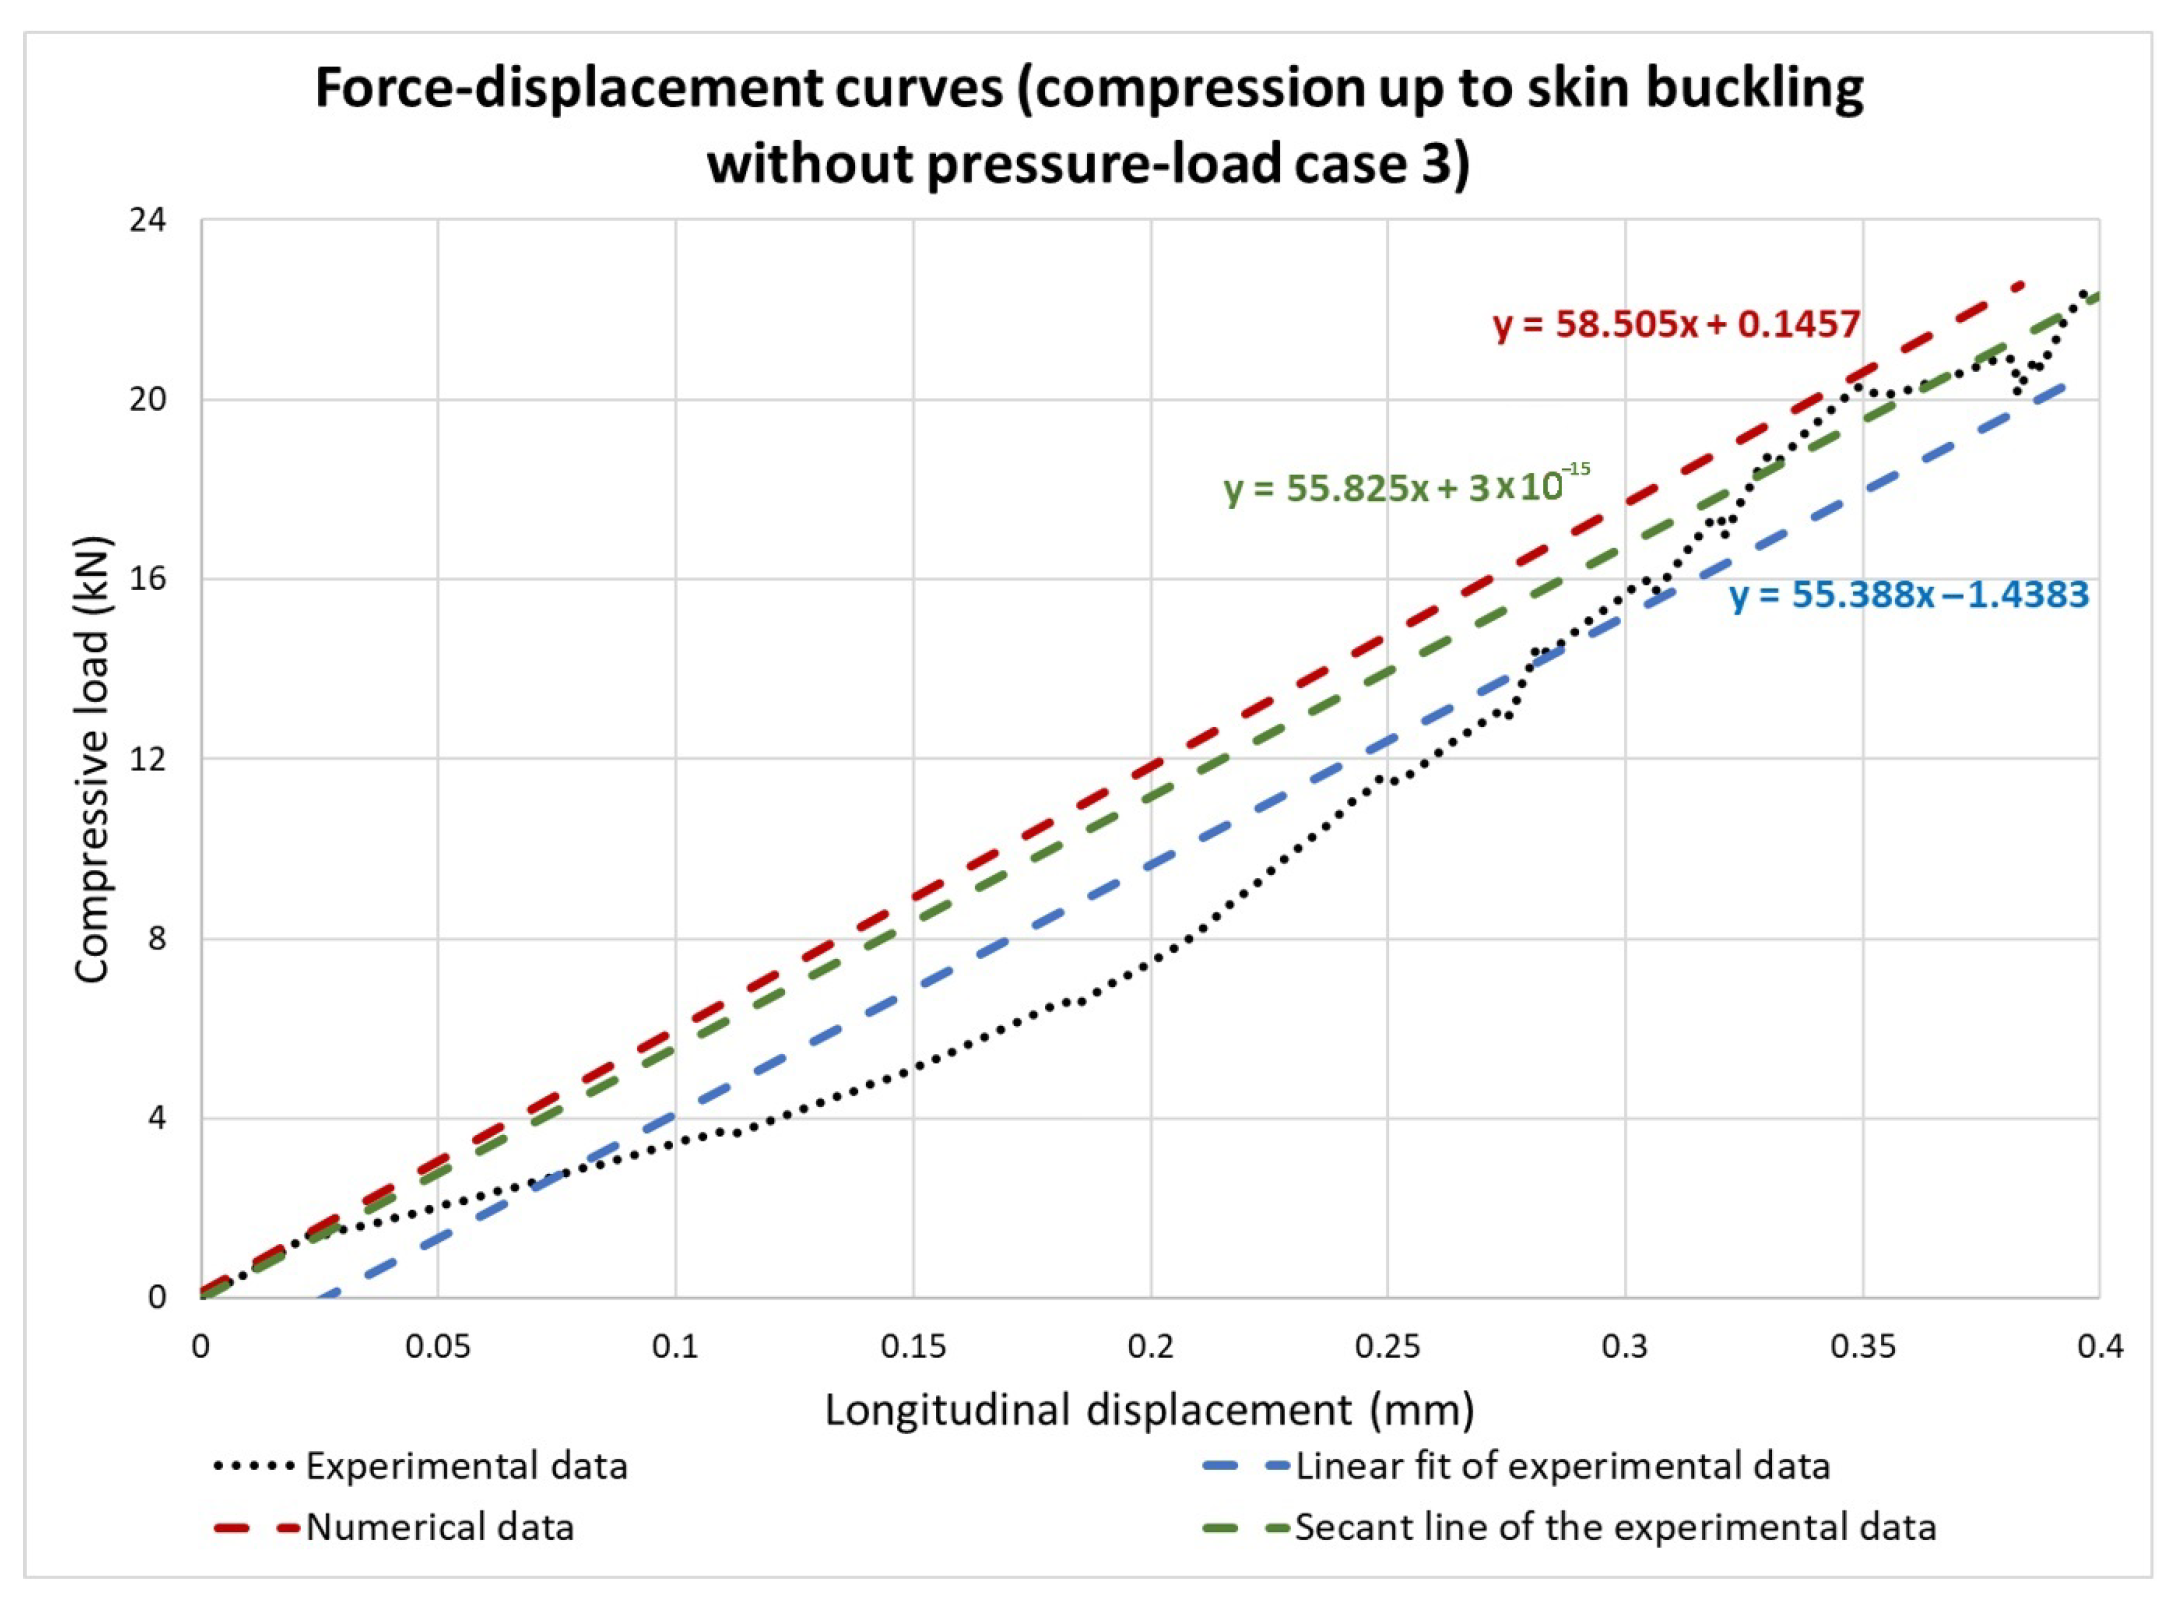
Compression-Only Load Case
Longitudinal Displacement (mm) Critical Buckling Load (kN)Longitudinal Stiffness (kN/mm)
Finite element model−0.39621.23 (first eigenvalue), 21.83 (second eigenvalue, 23 (non-linear analysis)58.5
Experiment−0.422.455.5 (average)
Percentile deviation (%)1%5.2%, 2.5%, 2.7%5.2%
Table 5. List of experimental and numerical data regarding key results and calculated deviations.
Combined Compression and Pressure Load Case Strains (%)—Approximations at Each Location
Longitudinal TransverseEquivalent von Mises
Finite element model0.157% (location 1)0.157% (location 1), −0.1% (location 3)0.23% (location 1)
Experiment0.16% (location 1)0.16% (location 1), −0.08% (location 3)0.27% (location 1)
Percentile deviation (%)2.5%2.5%, 25%14.8%
Disclaimer/Publisher’s Note: The statements, opinions and data contained in all publications are solely those of the individual author(s) and contributor(s) and not of MDPI and/or the editor(s). MDPI and/or the editor(s) disclaim responsibility for any injury to people or property resulting from any ideas, methods, instructions or products referred to in the content.

