
Flight Simulation of Fire-Fighting Aircraft Based on Multi-Factor Coupling Modeling of Forest Fire
School of Aeronautic Science and Engineering, Beihang University, Beijing 100083, China
*
Author to whom correspondence should be addressed.
Aerospace 2024, 11(4), 267; https://doi.org/10.3390/aerospace11040267
Submission received: 20 January 2024
/
Revised: 19 March 2024
/
Accepted: 25 March 2024
/
Published: 29 March 2024
(This article belongs to the Special Issue Advanced Aircraft Technology)
Abstract
:Forest fires can develop rapidly and may cause a wide range of hazards. Therefore, aerial firefighting, which has the ability to respond and reach fire fields quickly, is of great significance to the emergency response to and subsequent extinguishing of forest fires. The burning of forest fires generates a lot of heat and smoke, which changes the air flow environment and vision over the region and brings challenges to aerial firefighting. In the present work, aerial forest firefighting simulation was divided into the forest fire spread model, the air flow model and the aircraft flight dynamic and automatic control model. Each model was constructed based on a physical method. An integrated framework was designed to realize the interaction among fire fields, airfields, and aircraft, and is verified. The proposed framework can be used for the emergency response decision of aerial forest fire fighting and subsequent fire-fighting mission planning.
1. Introduction
Forest fires play a role in the regeneration of plant communities [1], but with climate change, tree regeneration after severe wildfires could decline and lead to changes in ecosystems [2]. Due to the difficulty of detecting forest fires when they are started and dispatching a fire-fighting force to the fire field within a short time, forest fires often have a bad impact on the local natural environment and human living areas, and serious forest fires also cause huge economic losses [3,4]. For forest fires, aerial firefighting is a fast and efficient way to extinguish fires. Fixed-wing aircraft, helicopters, and other aircraft can carry water, flame retardants or other fire-fighting equipment, and quickly respond to the initial stage of forest fire spread. Aircraft can carry out firefighting operations and cooperate with ground fire-fighting forces in the case of large-scale forest fires. Due to the danger of fire, aircraft often need to execute specific tactics and maneuvers when delivering fire extinguishing agents. The term “air attack” is used to describe this behavior, and also reflects the complex piloting skills required.
The first attack involved in aerial forest firefighting has the greatest impact on the forest fire spread and the subsequent continuous fire suppression operations. In terms of the first attack, relevant research established the deployment model of aircraft and resources, based on a resource scheduling and planning method [5,6,7,8,9]. The deployment model is mainly based on the data analysis of regional historical fire situations. Such a model is only relevant to the deployment of the aircraft, which cannot simulate the burning area or support the decision making process for aircraft emergency responses. Therefore, for aerial forest fire fighting, it is necessary to establish a complete fire spread model, which can not only assist decision makers in carrying out reasonable force distribution for aerial firefighting during forest fires, but also helps pilots to carry out safe and efficient firefighting operations. The spread of forest fires is affected by many factors such as terrain, wind speed and direction, fuel load in the burning area, and the water content of forest trees, etc. The models used for simulation are mainly divided into the following three types:
- Empirical model
This model uses an empirical fire spread equation, which is used to quickly estimate the fire spread rate, such as using the logistic regression model to quickly estimate the burned area [10].
- 2.
- Semi-empirical model
This model calculates the rate of fire spread using semi-empirical relationships, such as FARSITE [11].
- 3.
- Physics-based models
Based on the law of the conservation of energy and computational fluid dynamics, the spread of forest fires and the simulation of the atmosphere are realized by this type of model, including NCAR’s Coupled Atmosphere–Wildland Fire–Environment (CAWFE) [12], the FIRETEC simulator [13], and NIST’s Fire Dynamics Simulator (WFDS) [14,15].
With the increase in computing power, research on the model of forest fire spread mainly focuses on physics-based models, and the related computational models are explored to improve the computational speed. In [16], fire spread in Canada is simulated based on a geographic information system and cellular automata (CA), and the results are similar to those of elliptical wave propagation principles. Physical equations of flame spread reaction and radiation are applied the to CA, which improve the accuracy of the original CA-based forest fire spread model [17], and different calculation architecture is also taken into account in CA to achieve the rapid simulation of fire spread [18]. The non-linear effects caused by forest fuel pyrolysis and moisture evaporation in fire spread was simulated by solving the three-dimensional equation of heat conduction with a local one-dimensional method [19]. A hybrid stochastic Lagrangian–cellular automata framework was used to simulate the impact of turbulent wind and maintain the key physics processes while speeding up the execution [20]. For more detailed simulation and visualization of the fire spread, the environmental meteorological factors were combined with the forest fire propagation process, and a single-tree pyrolysis model was constructed [21]. On the other hand, some studies are also trying to simulate the non-linear process of forest fire spread through non-physical models, such as the dynamic data-driven genetic algorithm (DDDGA) [22] and artificial neural networks [23]. The accuracy of artificial neural networks (ANN) reached 85% compared with the CA-based physical model.
In terms of aerial firefighting, research mainly focuses on UAV fire field detection [24,25,26,27,28]. For the fire extinguishing agent delivering procedure, the simulation of aircraft water delivery and danger zone avoidance was carried out based on a simplified fixed-wing aircraft kinematics model and a simplified physical model of forest fire spread, tracking burning embers using the particle method [29,30]. Also, in [29], the forest fire spread model was compared and indicated the limitations of real-time accuracy and easy practical use. In the application of these forest fire spread models in aerial firefighting, forest fire spread is mainly established to provide fire data for aircraft detection and firefighting behaviors, and the framework proposed in [29] considers the influence of local wind speed on the flight and sprinkling process of aircraft, so as to enhance the interaction between fire and aircraft. Because aircraft often need to approach burning areas when performing reconnaissance and firefighting tasks and are affected by the hot air flow generated by combustion, convection of the air flow occurs in these areas, which affects the flight safety. In the meantime, the combustion of tree fuel often produces soot, which is suspended in the air or carried up to the air by the hot air current, in the form of smoke masses, smoke plumes, etc. This factor could affect pilots’ choice of water dropping points, and pilots should also avoid driving aircraft into these smoke masses, because they may have adverse effects on aircraft engines. The treatment of smoke in the physical model includes the density method such as in WFDS [14,15], as well as the particle method [29]. Physics-based models are also used in the field of graphics for the visualization of smoke to track smoke concentrations [31,32,33,34]. Another smoke simulation is based on the Gaussian plume model, which simulates the smoke diffusion and obtains the smoke density distribution results [35,36].
Although, there have been many studies on the forest fire propagation model based on the physical model, and there are related forest fire spread simulation systems. Also, some aircraft firefighting application explorations have been carried out based on the forest fire propagation simulation, but there are still some problems:
Models with a higher degree of fidelity require more parameter settings, and they also demand greater computational resources, resulting in longer computation times, and they are more difficult to deploy and apply on the front line.
The application of computational fluid dynamics (CFD) in models predominantly concentrates on the air movement within fire fields, yet the limitations of real-time and practical use make it unsuitable for aerial forest firefighting simulations.
The aircraft dynamics models used in simulations are relatively simplified, making it challenging to accurately represent the characteristics of aircraft flying over fire fields and performing water dropping operations. This limitation affects the requirements for system-based deduction, assessment, and similar needs.
Based on the above contents, this paper, focusing on the use of aircraft in aerial reconnaissance and water dropping in aerial forest firefighting, establishes a physics-based model of forest fire spread and aircraft flight dynamics, achieving the following functionalities:
- Developed a physical model for forest fire propagation, and implemented a simulation of fire spread using a cellular automaton approach;
- Established an aerodynamics model for the burning area, simulating the density and flow of air components and smoke;
- Created a six-degree-of-freedom flight dynamics model for both fixed-wing aircraft and helicopters, along with a control model;
- Designed a data interchange and logical architecture to facilitate interaction among the forest fire, airflow, and aircraft models.
The structure of this paper is organized as follows: Section 2 abstracts and describes the problem addressed in this study and presents the general assumptions for modeling. Section 3 details the methods used for modeling and description. Section 4 describes the framework of the model. Section 5 conducts simulation deduction based on the constructed simulation computation framework. The results are discussed in Section 6. And symbols used to describe the models are shown in the appendix table after the Conclusions.
2. Problem Description and Assumption
Crown fire, as a modeling object for forest fire spread, differs from surface fire and ground fire. Crown fire destroys leaves, scorches branches and trunks in the upper part of forests, and burns ground cover, saplings, and underbrush in the lower part. The destruction of combustible materials in the forest is vertically comprehensive, allowing for an overall average modeling of combustibles and forest fire.
Due to the combustion of the crown fire, carbon oxide and carbon dioxide are produced, along with methane released from surface humus due to heating. In studying the heat transfer process between forest fire spread and the atmospheric environment, for simplification, the heat conduction of a forest fire to the air, comprising convective and radiative heat transfer, is reduced to its impact on air temperature. This emphasizes the study of temperature changes, gas production and consumption, and the resultant environmental alterations.
The established model in this paper refers to the forest fire propagation radiation model based on CA [17] and the mesh-based fluid dynamics model and its boundary conditions [34]. The fire fighting scenario concept for this study is shown in Figure 1.
2.1. Spatial Discretization
This paper discretizes the forest area according to the side length of the cells in the forest fire spread model based on cellular automata. It adopts the Moore neighborhood definition, whereby each cell has eight neighboring cells (shown in Figure 2).
For the upper atmospheric environment, the dimensionality changes from two-dimensional at the ground level to three-dimensional. If the cellular adjacency method shown in Figure 2 is used, updating the grid values would require the corresponding values of 26 neighboring grids. Therefore, the grid division form as shown in Figure 3 is considered, employing the Von Neumann type of neighborhood, which only considers the values of the four adjacent grids in the upper, lower, and horizontal directions. This approach significantly reduces the computational load and data access requirements. When dividing the grids, the side length of each grid is kept consistent with that of the cellular automata in the ground-level forest area.
Considering the importance of boundary conditions in the flow field simulation, a layer is assigned to the periphery of the mesh as the input of the boundary conditions. Thus, there will be cellular automata with an amount of , and grids with a size of .
2.2. Fuel Bed and Fire Model
This paper addresses the issue of large-scale forest fire spread. Although there are studies on pyrolysis and radiation models for individual trees, mainly aimed at visualizing forest fire spread, these are not applicable to the problem investigated in this paper. Therefore, it is necessary to consider the forest as a whole entity and study its fuel characteristics and the forest fire model. The total mass of individual trees, their water content, and the height of flames during combustion are averaged to adapt to the modeling approach of cellular automata.
The forest is regarded as an isotropic fuel bed, and in each cell area, this fuel bed possesses the following properties:
- Thickness
The average of the tree height in the current forest area was taken as the fuel bed thickness.
- Combustible density
The density of dry combustibles in the current forest area, measured in .
- Percentage of water content in combustibles
At present, the water content of the forest area is only compared to the dry combustible, and there is no dimension.
- Temperature
The current forest area temperature, measured in .
- The calorific value of combustion of combustibles
Measured in .
Based on the above properties, the total mass of the trees in the cell can be expressed as:
For the flames, it is assumed that their consumption of the fuel bed in the direction of fire spread is linear, with the combustible material in the burnt areas reduced to zero. For simplification, the height of the flames is averaged, assuming that the vertical distance from the top of the flames to the ground in the burning area is uniformly , and the width of the burning area in the direction of spread is (). A schematic of the fuel bed and flame model is shown in Figure 4.
2.3. Subcellular Hypothesis
The flame must be capable of spreading within a single cell before being extinguished, meaning for a forest fire with a spread rate of , the minimum time required for it to spread within a cell is
Within the cell, the spreading process is discretized spatially, that is, the cell is discretized based on the unit distance between trees. The cell scale is used to measure the relative proportion between the cell and the trees, which is
From this, the average time for the flame to spread between trees is
3. Modeling Method
This paper models the fire spread process, air flow over the fire scene, and aircraft, and then constructs a computational framework to update the statuses of each part and facilitate interaction among the models.
3.1. Forest Fire Spread Model
First, the combustion process is modeled. The model for radiative heat transfer is developed, ignoring convective heat transfer and thermal conduction, as well as the heat absorption after the combustion of the trees is complete. It is assumed that the maximum temperature during tree combustion is uniformly , leading to the following combustion model for the cell:
The equations above describe how the temperature and fuel density change in the cell. The temperature change is determined by three factors corresponding to items on the right side of the first equation, respectively, which include the difference between cell temperature and ambient temperature , evaporation of water inside the cell, and radiation received from other cells. The second equation describes the fuel change in the cell, and the effects of fuel as well as the wind and terrain are reflected by the coefficients and .
In this model, the heat dissipation coefficient is simplified to be relevant to the fuel bed thickness, resulting in:
For cells in a burnt-out state, the heat dissipation coefficient is further modified by the change in fuel content:
The subcellular hypothesis correction factor is used to correct the time effect caused by the subcellular hypothesis mentioned in Section 2.3. In order to ensure that the number of burned trees does not exceed the original number of trees after the dispersion inside the cell, the cell ratio needs to be adjusted downward, which is:
From Equation (5), the time for a cell to be fully burnt can be expressed as follows, where is taken as one to obtain the minimum value for
For the thermal radiation of a cell, the total radiation power of its equivalent black body surface is
and the surface area is
According to the laws of radiative heat transfer, the radiation angle coefficient , which represents the heat transfer from the equivalent black body surface to the forest tree surface, is:
The surfaces and represent the black body surface and tree surface under radiation, respectively; measures the length of the vector which starts from a micro area in to a micro area in ; and the angles and represent the angle from the vector to the normal of and respectively. This coefficient represents the proportion of the radiation power from the fire line’s equivalent black body surface within the cell to the total radiation power; hence, the effective total radiation power of the fire line’s equivalent black body surface within the cell is:
Therefore, the average time mentioned in Section 2.3 for the flame to spread between trees can be obtained by comparing the heat required for a cell to transition from ambient temperature to ignition with . is composed of the heat needed from the ambient temperature to the ignition temperature and the heat needed for water to evaporate. Thus,
For the eight neighboring cells of a given cell, the sum of the radiation intensities they receive is the total radiation intensity of the central cell. Based on the distance relationship between the cells, with the first neighboring cell in the due north direction being number one, and proceeding in a clockwise direction, the radiation received by the i-th neighboring cell of the central cell is:
In Equations (10)–(15), the radiation power that a cell could absorb is described.
When considering the impact of the wind and terrain on the spread of forest fires, both of their effects on radiative heat transfer and on fuel consumption are considered.
For the radiative heat transfer aspect, the influence is measured by the wind speed correction factor and the terrain slope correction factor , which are:
where is the wind correction constant, represents the wind speed in the area of the cell with flames, is the angle between the horizontal projection of the wind speed and the direction of flame spread, and is the slope correction constant. And represents the slope angle in the direction of the eight neighboring cells of the central cell, which is:
where
By substituting (16)–(20) into (15), the following can be obtained:
For the part concerning the impact on fuel consumption, the effects of wind and terrain on fuel consumption are simplified, assuming that during combustion, the fuel consumption rate is altered only by adjusting the height of the flames . Using the flame height calculated under the condition of flat terrain and no wind in (5) as a reference, the following can be obtained:
3.2. Forest Fire Combustion Reaction Model
The air composition and airflow in and around the burning area are important factors affecting aerial firefighting. Smoke can obscure a pilot’s vision, while wind speed and direction can influence decisions regarding flight paths and the dispersal of fire retardants during firefighting operations. To model the impact of a forest fire’s combustion reaction on the atmosphere above and around it, first, based on the Navier–Stokes equations, the motion of air is modeled as:
In the area of the forest fire, the atmospheric environment is treated as an incompressible flow field, i.e., ; thus, the pressure gradient term in (23) can be removed, resulting in:
In the calculation of the flow field in the fire environment, the forces on a gas parcel are mainly divided into three parts. The first is the force due to pressure differences caused by temperature differences between the gas parcel and the surrounding air. The force in three dimensions can be written as:
are coefficients that measure the effect of temperature and density on the gas.
To smooth the characteristics of the flow field and avoid the loss of small-scale details due to computational dissipation, vorticity confinement [34] is introduced as another force on the gas parcel:
The third part of the force applied to the gas parcel is due to the presence of the aircraft. In the flight of fixed-wing aircraft or helicopters, they encounter air resistance and lift, resulting in the air at the corresponding location being subjected to forces of the same magnitude but in opposite directions. Due to the large number and complex shapes of surfaces on various types of aircraft generating aerodynamic effects and considering the fact that the size of the aircraft is much smaller than the modeled atmospheric dimensions, the forces generated by the aircraft are simplified. They are resolved into a force along the direction of the aircraft’s flight, with the same magnitude as the drag on the aircraft, and a force in the opposite direction to the aircraft’s lift, with the same magnitude as the lift on the aircraft. Therefore, the force exerted by the aircraft on the atmosphere is:
Consequently, for the atmosphere above and around the fire area, the forces it experiences are:
The Gauss–Seidel relaxation method is used to calculate the diffuse step, and tracing the speed backwards is adopted to solve the advecting part.
A similar approach is used for the density and temperature fields in the atmospheric environment above the fire, which are:
where represents the density source, represents the temperature source, is density for air component, and is the temperature.
In the model, both are maintained in the same location in the cells where the forest fire is burning.
For the atmospheric environment in the area of a forest fire, changes in density and temperature are caused by the combustion process. In the case of crown fires, the main combustible materials include branches and trunks, as well as leaves and ground cover. The composition of these materials is complex, making it difficult to quantify their oxygen consumption and the production of by-products like carbon dioxide and carbon monoxide. In simulation calculations, the reactants of combustion are simplified, focusing mainly on the primary components such as trunks and branches. The average molecular formula of the trees is . The combustion process of these components is as follows:
Combustion products , as well as that may be produced when substances like humus are present on the ground, will react with oxygen in the air if they reach their ignition points, as shown in:
The reactions proceed stepwise according to the minimum combustion temperatures of the reactants. Since the ignition points of all reactants are higher than the boiling point of water at the location, it is assumed that water in the combustion products enters the atmosphere as steam. Smoke, as a particle produced by incomplete combustion, is assumed to originate from the unburned part of the forest. In calculations, the amount of smoke generated is estimated based on the amount of carbon. For simplicity, the rate of smoke production is assumed to have the following relationship with the combustion temperature:
The combustion temperature is obtained from the fire spread model. The fire field transfers heat to the gases through radiation, thermal conduction, and convection, among other methods. For simplification, at any given moment, the temperature relationship between a burning cell and the air in that grid is assumed to be:
Also, considering the characteristics of radiation, the temperature of the grids surrounding a fire cell will tend to approach the temperature of the fire cell over time, as is expressed in:
If the wood undergoes incomplete combustion, its combustion products, and potentially , can burn outside the wood cell. The heat released from these reactions affects the local temperature, as shown in:
The represents the calorific value of a certain combustible gas component, and represents the amount of that component. Due to the presence of water vapor, the humid air coefficient is introduced, with .
In calculations, the initial amount of air substance in each grid is obtained from the ideal gas state equation and the hydrostatic equation, as shown in:
From which it can be derived that:
For atmospheric temperature, taking the standard temperature at sea level as , and assuming that the vertical lapse rate of temperature in the troposphere is constant, the temperature at any altitude is:
Integrating (41) over height,
Similarly, based on the ideal gas state equation, the ratio of the amount of gas at any altitude to that at sea level is:
Substituting (43) into the above equation leads to:
When calculating the atmospheric environment, the boundaries need to be addressed. Based on the assumptions above, at the boundary between the modeled atmospheric area and the surrounding atmosphere, there is:
At the interface between the gas and the forest, it is assumed that gas does not flow in or out of the boundary,
3.3. Aircraft Flight Dynamics and Control Model
The aerodynamics and control model of the aircraft are divided into two types: fixed-wing aircraft and helicopters, each modeled according to their distinct characteristics. Compared with conventional aircraft, the aircraft using water tanks for water dropping is not significantly different in its aerodynamic shape, so it can be modeled according to the conventional aircraft flight dynamics.
For the aerodynamics model of helicopters, which are mostly single-rotor with a tail rotor configuration for aerial firefighting, this paper also models this type of helicopter dynamics. Initially, based on blade element theory, the rotor is modeled. Blade element theory allows for more detailed aerodynamic analysis of the rotor and can also achieve faster computational effects by reducing the number of divisions. For a single helicopter blade:
The velocity for a blade element at a distance from the center of the rotor disc is the sum of the linear velocity of the blade element rotating around the center of the rotor disc, the linear velocity caused by the rotation of the helicopter body, and the airspeed of the helicopter. Consequently, the lift, drag, and corresponding torque on the blade element can be calculated:
Thus, for this blade element, the resultant force and torque are:
Summing up these equations, the resultant force and torque on a single blade are obtained:
Therefore, for a helicopter, the combined force and torque generated by the rotor are:
Similarly, based on blade element theory and neglecting the linear velocity due to blade rotation in (51), and based on (52) and (53), the combined force and torque for fixed-wing surfaces like the horizontal tail, vertical tail, and side wings of the fuselage can be obtained.
For the fuselage, treating it as an equivalent airfoil for lift and drag calculations, the helicopter’s airspeed is decomposed along the chord and span directions of the fuselage:
And through , the combined force and torque on the fuselage can be calculated. Using the combined force and torque , the overall acceleration and angular acceleration are obtained as
Another part of the aircraft model is the controlling part. For real-time simulation, it is convenient to conduct a human-in-loop simulation. Yet for human-not-in-loop simulation, it is necessary to construct an auto-control model so that aircraft can fly on their own. In the simulation of this research, helicopter flight planning is achieved by setting waypoints and desired speeds at these waypoints, hence constructing an automatic flight control model for the helicopter. The PID control method is introduced to fulfill the demand. Though it is a little different from the human control habits of a method like deep learning of the piloting data, the PID method is intuitive and easily explicable, and attitude controlled by the PID method still follows the rules of piloting aircraft.
Using the PID control method, the flight control of the helicopter is realized:
For all of the coefficients, , so that proportional, integral, and derivative control are all used for flight control. And the control inputs are proportionally added to the corresponding control variables:
The pitch and roll control for helicopters is mainly achieved by controlling the direction of , and height control is achieved by changing the value of this pulling force from the rotor. The yaw control is much simpler since the direction of a helicopter relies on the tail rotor changing or staying the same; thus, changing the force provided by the tail rotor would change the yaw simultaneously.
For fixed-wing aircraft used in aerial firefighting, most are conventionally configured aircraft with propulsion systems including piston propellers, turboprop engines, and turbofan engines. Despite the difference between propulsion systems, fixed-wing aircraft commonly acquire thrust force through them. Thus, the fixed-wing aircraft model is constructed by modeling aero force including lift force, drag force, and thrust force by the propulsion system.
Unlike the rotor of a helicopter, the wing installation angle of a fixed-wing aircraft is fixed, and the wing forces mainly depend on the action of various control surfaces. The flight dynamics model involves calculating the forces on the wings and control surfaces of the fixed-wing aircraft to determine the total force and torque on the aircraft, leading to its acceleration and angular acceleration. Taking the wing as the main aerodynamic surface and ignoring the aerodynamic force of the body, the aerodynamic force added to the whole aircraft can be expressed as
With the thrust force provided by the propulsion system and the gravity of the whole aircraft, the velocity of a fixed-wing aircraft is dominated by these four forces, while the side force is ignored as a simplification. Therefore, the velocity of the aircraft can be expressed as
Attitude control and maintenance are realized based on each aerodynamic control surface. The control surfaces include elevators, ailerons, flaps, and rudders. In building the flight dynamics model, the aerodynamic forces generated by the deflection of these four types of control surfaces are calculated, and the torque produced by each control surface is computed based on its effective point of action and the distance from the aircraft’s center of gravity. The forces and torques caused by the deflection of the control surfaces contribute to the total force and torque on the aircraft. It is simplified to assume that the aerodynamic force caused by aileron deflection has no net effect on the total force of the aircraft, and the aerodynamic force caused by flap deflection has no net effect on the torque of the aircraft. Each control surface that is not in the neutral position will contribute corresponding forces and moments to the whole aircraft, which can be written as the following set
where the subscript stands for elevator, stands for aileron, stands for rudder, and stands for flap.
For the control of fixed-wing aircraft, the PID method, as in (63) and (64), is used. By calculating the various state quantities of the fixed-wing aircraft, its thrust and the control quantities of various control surfaces are obtained. The pitch angle is controlled by the elevator, and hovering relies on the roll angle; thus, both roll and yaw are controlled by the aileron, while the rudder controls the yaw angle on the ground. And the flap is used when taking off or landing.
4. Model Framework
The aerial forest firefighting simulation model is structurally divided into three parts according to the modeling logic: the fire spread part, the fire scene environment part, and the aircraft part. The overall framework of the model is shown in Figure 5. The whole framework is calculated based on the time step, and the state of the model is updated at every time moment. By the discretization of time, it is possible to turn all the differentials of time in Chapter 3 into integrals of delta time.
The fire spread part utilizes cellular automata, taking geographic data, meteorological data, fuel bed data, as well as spatial division rules and adjacency rules as cell inputs to generate corresponding cells. Cells are categorized into multiple states, mainly pre-combustion, during combustion, and post-combustion, with further detailed subdivisions based on different reaction states. The transition of cell states follows specific state transition rules. The radiation between cells is implemented through a radiation model. The radiation amount from adjacent cells serves as input for the radiation model, which then calculates the current cell’s propagation vector for the spread. This is followed by computing the current radiation amount of the cell, which also serves as input for other adjacent cells. The operational flow of the fire spread part is illustrated in Figure 6.
The fire area environment part adopts a grid discretization approach, dividing the space above the fire scene according to a spatial scale consistent with the cells. It uses geographic data and initial meteorological data as inputs, while also receiving the current combustion temperature state parameters of each cell in the fire scene. The N-S (Navier–Stokes) model part processes the grid’s velocity, temperature, and densities of various gases. The computations follow the sequence of first adding source terms, then diffusing, and finally advecting. After each step, the boundary model is relied upon to apply boundary constraints to the computed results. Each computational update first calculates the velocity parameters, using the temperature parameters from the previous step in the calculation of force terms for the velocity parameters, and then computes the updates of temperature and density in the current velocity field. The operational flow of the fire scene environment part is illustrated in Figure 7.
The aircraft part updates the lift and drag experienced by the aircraft by receiving the velocity field parameters of the air flow above the fire scene. Subsequently, it calculates the resultant torque, which is used to update the aircraft’s flight status parameters. Geographic data are input to determine the aircraft’s anticipated waypoints, and the waypoint data, along with the flight status data, serve as inputs to the PID controller. The output of the PID calculation, used as the control quantity, updates the flight status parameters. The position and attitude information of the aircraft during the water dropping process are output as water dropping information, which is input into the fire spread part to update the water content data of the corresponding area cells. The aircraft’s position and attitude information, as well as the aerodynamic forces it experiences, are all used as force terms for calculating the velocity field of the fire scene environment. The operational flow of the aircraft part is illustrated in Figure 8.
5. Simulation and Result
The simulation validation is conducted by individually simulating and testing the three components: fire spread, fire scene environment, and aircraft. Finally, based on this computational architecture, a simulation experiment for water-dropping aircraft fire extinguishment is designed. All simulations are performed in real time. The simulation validation platform uses a Windows 10 operating system, with an Intel i7 11th generation CPU and an Nvidia RTX 3070 GPU.
The fire spread part adopts the model established in [17], whose simulation and validation have already been conducted in the paper; hence, this article does not perform separate simulation validation for the fire spread model.
5.1. Simulation for Airfield above Forest Fire
The combustion model is simulated to test the production of various reactants under different fuel-to-air ratios. Using 100 moles of air as the simulation subject, the results after the complete reaction of each component are calculated. The amount of oxygen in the air is set at 21 moles, carbon dioxide is at 0.04 moles, and other air components (nitrogen, rare gases, etc.) total 78.96 moles. Additionally, the influence of methane generated from biological decomposition on the reaction is considered. The total amount of wood involved in the reaction, the total amount of methane that can be released, and the total amount of smoke are set. The variations in the content of each type of substance at different temperatures are shown in Figure 9.
Two-dimensional fire scene environment calculation is a reasonable validation of the three-dimensional fire scene calculation. Taking the horizontal X direction (East) and vertical Y direction (Sky), with the velocity in the Z direction always set to zero, constitutes a two-dimensional fire environment. Compared to the three-dimensional fire scene, the two-dimensional fire scene is consistent in terms of computational architecture, formulas, etc. There is no fundamental difference in the operations of two-dimensional and three-dimensional vectors. Additionally, the two-dimensional fire environment calculation facilitates result observation, has a lower computational load, and can quickly validate the accuracy of fire scene environment calculations and adjust various parameters. Therefore, the correctness of the two-dimensional fire environment calculation can be extrapolated to the three-dimensional fire scene.
The simulation uses a grid with a size of . The grid amount in each axis is a multiple of 32 (25), making it convenient for GPU thread allocation. The gird size is , with an initial wind speed set at 6 m/s in the positive X-axis direction. The air components are based on sea-level air density, with , corresponding to approximately 68,000 moles of , 101.4 moles of , and a total of 259,066.557 moles for and other non-reactive gases. The quantities of each gas component in the grids at different altitudes are calculated based on Equation (45). The amount of carbon available for combustion from the wood is set as 20,000 moles/s, with the content of oxygen and hydrogen elements as per the proportions mentioned in the model above. The maximum amount of methane generated is set at 100 moles/s, and the maximum amount of smoke produced at 10,000 moles/s. The advection speed of the smoke is set at 0.8 times the speed of the airflow. The simulation models the changes in the airflow field above the burning area under the condition of a constant burning area to observe the time-varying characteristics of the airflow field model. In unburned areas at sea level, the temperature is 298.15 K, while in the burning area, temperatures range from 598.15 K to 1398.15 K. The simulation results are shown in Figure 10.
5.2. Simulation for Aircraft with Constant Wind
The ability of the aircraft to track waypoints in a constant wind field environment is validated. Waypoints are obtained through the planning and decision making of flight paths. The aircraft’s simulated flight path and corresponding attitudes are then used to calculate the simulated results of water dropping.
For the entire process of aerial forest firefighting, the main actions of the aircraft include loading fire retardants, taking off from the airport, flying to the fire area along a predetermined route, descending to the water dropping altitude for operations, and returning. For helicopters, fire retardants can be sourced from nearby lakes or other water bodies near the fire scene. The aircraft model established in this paper is primarily used for decision making during the water dropping process, including flight path and water dropping point selection. These decisions can be implemented by planning the aircraft’s waypoints. Therefore, the simulation validation of the aircraft mainly focuses on its ability to track waypoints. In this paper, the simulation validation covers the aircraft’s turning process after takeoff, as well as the descent into the water dropping phase followed by ascent.
The angle of each control surface of the helicopter and fixed wing is strictly limited to the movable range to ensure that it does not exceed the allowable range.
In the simulation, the helicopter configuration is set as a single rotor with a tail rotor, with four main rotor blades, and a weight of 10 tons. The simulation results of the helicopter transitioning to level flight after takeoff are shown in Figure 11, and the results of the descent followed by ascent are shown in Figure 12.
For fixed-wing aircraft, the configuration is set as a conventional layout with a T-tail and four turboprop engines, with a total weight set at 40 tons. The simulation results of the fixed-wing aircraft’s takeoff roll, climb, and subsequent turn are shown in Figure 13, and the results of the descent followed by the ascent are shown in Figure 14.
5.3. Simulation for Aircraft with Time-Varing Wind
In this section, the performance of the aircraft control model in the process of dropping water is tested. The velocity at which the aircraft releases water goes through a process of increasing, remaining constant, and decreasing. As a comparison, the flight state of the aircraft without water is also simulated. The results are shown in Figure 15 and Figure 16.
The flight of the aircraft in a changing wind field is tested and validated, with the scenario set as the aircraft conducting water dropping on a fire located on a slope. The wind field is determined by the calculations of forest fire spread and air field. Additionally, the wind speed at the boundary conditions is input to obtain the flight trajectory and attitude of the aircraft in a constant wind field, which is used for comparison.
The simulation results for the helicopter are shown in Figure 17. The flight paths in both time-varying and constant wind conditions indicate that the helicopter’s flight control model can maintain good tracking performance for waypoints in a time-varying wind field. The changes in the helicopter’s attitude angles during the simulation process are shown in Figure 18, and the changes in the control quantities are shown in Figure 19. The statistical data for various control quantities are illustrated in Figure 20.
The simulation results for the fixed-wing aircraft are shown in Figure 21. The flight paths in both time-varying and constant wind conditions demonstrate that the fixed-wing aircraft’s flight control model can maintain good waypoint tracking performance in a time-varying wind field. The changes in the attitude angles of the fixed-wing aircraft during the simulation are shown in Figure 22, and the changes in the control quantities are presented in Figure 23. The statistical data for various control quantities are illustrated in Figure 24.
5.4. Simulation for Air Field above Forest Fire
Based on the simulation computational framework established in this paper, aerial forest firefighting is simulated. The main decision factor in this scenario is the water dropping location of the aircraft. Therefore, the simulation focuses on the impact of aircraft water dropping and the location of water dropping on the spread of the forest fire. The water dropping location is determined by a combination of factors including the time of the aircraft’s arrival at the fire scene, the aircraft’s position, attitude, flight speed, the fire spread situation, and the visibility conditions of smoke above the fire scene. In practical applications, more complex decision-making models for selecting aircraft water dropping locations can be constructed based on these parameters. However, this paper primarily focuses on building and validating a simulation of aerial forest firefighting, thus simplifying the decision making process. The aircraft is simulated to arrive at the fire scene at a specified time and conduct water dropping based on the fire scene conditions. The tracking characteristics of the aircraft’s flight path have already been simulated in the aircraft simulation section.
In the simulation, the cell size and grid size of both the fire scene and the environmental cellular automaton above the fire scene are set to 20 m. The central point of the fire scene area is located at 102.071° E, 28.62215° N, with the number of cells and grids in both the longitude and latitude directions set to 448. Omitting the middle process of the aircraft taking off from the airport and flying to the fire scene, the simulation uses a helicopter for water dropping as an example, simulating the helicopter arriving at the fire scene and conducting water dropping at s, s, and s. The water dropping location is set at the point of highest fire intensity in the current fire scene area, with the direction of water dropping along the tangent of the spread direction. The post-water dropping fire spread situation is shown in Figure 25, where black areas represent burned regions, red areas indicate actively burning regions, and the blue dot at the moment of water dropping represents the water dropping location. The natural spread of the fire without water dropping is shown in Figure 26. In the fire spread model, the number of cells in a burning state is counted, and the change in cell numbers is shown in Figure 27, where there is a significant reduction in the number of burning cells after three water droppings.
6. Discussion
Based on the simulation results of the airflow field above the fire scene using the combustion reaction model, it can be observed that the airflow field is influenced by the boundary conditions of the terrain. The rising air currents are also a result of the temperature increase caused by combustion. Moreover, there are localized vortices within the flow field. The calculated results for various gas components and smoke show that the fire scene environment model can maintain numerical stability over prolonged computations and accurately represent the transport and diffusion of different air components and smoke with the airflow. For forest fire spread and environment simulation, this research adopts data-oriented programming instead of object-oriented programming for the consideration of computing architecture during the construction of programs. Especially for environmental simulation, it is a recommended way to compute it entirely using GPUs.
In the aircraft simulation, by setting corresponding waypoints, the aircraft can effectively track the flight path. Although the parameters of PID have a strong correlation with the parameters of the aircraft, the PID control method can still maintain the control of the aircraft when the weight changes greatly. It is also observable that the helicopter model and fixed-wing aircraft model used for validation exhibit non-linear changes in position and flight attitude angles during tracking. This is related to both the intrinsic flight dynamics of the aircraft and the characteristics of the PID control method, reflecting that the aircraft flight dynamics and control model constructed in this paper can accurately represent the flight and control characteristics of the aircraft. By adjusting waypoints and the desired speed of the aircraft, the tracking of the flight path can be modified, consistent with the control of aircraft in actual situations. The time-varying wind field has a certain impact on the flight and control of the aircraft, but overall, it still maintains tracking of the waypoints. The control quantities show the same overall trend in terms of changes, though their specific values differ from those in a constant wind field. Although the PID control method cannot completely simulate the human piloting behavior, it still has important value for the simulation results of the aircraft attitude in the human-not-in-loop circumstance. At the same time, in addition to the PID control method, more factors can be taken into account in the future to achieve the control of aircraft.
Finally, a joint simulation of the fire scene and the aircraft was conducted, testing the impact of water dropping by the aircraft on the fire spread at multiple moments. The results effectively demonstrate the influence of water dropping on fire spread. Future developments could involve constructing more complex models for deciding water dropping points and developing aircraft route planning models, enabling aircraft to avoid smoke plumes during flight and water dropping operations.
7. Conclusions
This paper establishes a comprehensive computational and interactive framework, encompassing all key elements of aerial forest firefighting. A mathematical model for forest fire spread is developed based on radiative heat transfer, considering terrain and meteorological conditions. Furthermore, a mathematical model for the generation and movement of gases and smoke above the fire scene is created based on the Navier–Stokes (N-S) equations and the forest fire combustion reaction process. Based on the single-rotor with tail rotor configuration, a conventional layout, and the PID control method, mathematical models for the aerodynamics and control of helicopters and fixed-wing aircraft are, respectively, constructed. The models were validated through individual and overall simulations of each component.
This computational framework can be used for decision making and validation in aerial forest firefighting, as well as for simulating and validating the firefighting efficacy of various types and models of aircraft. The next step is to develop comprehensive models for aircraft route planning in forest firefighting and decision-making models for water dropping points. These models aim to enable automatic decision making and simulation for the entire process of aerial firefighting, providing a basis for real-world decisions in aerial forest firefighting.
Author Contributions
Conceptualization, H.L. and S.L.; methodology, S.L.; validation, S.L. and Y.T.; writing—review and editing, S.L., H.L. and Y.T. All authors have read and agreed to the published version of the manuscript.
Funding
This research received no external funding.
Data Availability Statement
Data is contained within the article.
Conflicts of Interest
The authors declare no conflict of interest.
Abbreviations
| Side length of a cellular automaton | |
| The prefactor of Arrhenius equation | |
| The average chord length of a blade element | |
| The heat capacity of the moisture contained in the forest | |
| The average heat capacity of solid matter of forest, including solid combustibles and non-combustible minerals | |
| Drag coefficient | |
| Lift coefficient | |
| Specific heat capacity of air | |
| Average distance of trees | |
| blade element center to rotor axis center | |
| The drag on the aircraft | |
| The activation energy | |
| The force on the air flow field | |
| The force on the air flow field due to the aircraft | |
| The force on the air flow field due to vorticity scale | |
| The force on the air flow field due to the downwash caused by aircraft | |
| The force on the air flow field due to the thrust of aircraft | |
| The force on the air flow field due to pressure difference | |
| The aerodynamic force on the aircraft | |
| Acceleration of gravity | |
| Heat dissipation coefficient, W/Km2 | |
| The moment of momentum of the aircraft | |
| Temperature ratio coefficient between air flow field and forest fire | |
| Average heat transfer coefficient in height, and set the value | |
| Control quantity coefficient | |
| Proportional coefficient | |
| Integral coefficient | |
| Derivative coefficient | |
| Length of the blade element | |
| The lift force on the aircraft | |
| Vertical lapse rate of atmospheric temperature | |
| The evaporation latent heat of water where evaporation temperature is | |
| Molar mass of air | |
| Aerodynamic torque applied to the aircraft | |
| Cell scale of CA | |
| Ground normal direction | |
| The amount of substance of air | |
| The amount of substance of a gas | |
| The amount of substance of air at standard atmospheric pressure at sea level | |
| The unitized gradient of curl of air flow field | |
| Total radiated power | |
| Total effective radiated power | |
| Total radiant heat power of other blocks absorbed by forest unit area | |
| Standard atmospheric pressure | |
| The calorific value of a gas | |
| Heat required by cell from normal temperature to ignition state | |
| Ideal gas constant | |
| The distance between the center of the ith blade element and the center of the rotor axis | |
| Vector directed from the rotor center to the blade element center | |
| The distance between the center of the ith blade element and the helicopter’s center of gravity | |
| Wing area | |
| Equivalent blackbody plane area | |
| Ambient temperature | |
| Temperature of the air flow field | |
| Assumed forest highest burning temperature | |
| Evaporation temperature | |
| Ignition temperature of trees | |
| Sea level temperature at standard atmospheric pressure | |
| The time from ignition to burnout of fuel | |
| Velocity vector of the air flow field | |
| The speed of the i-th blade element caused by the rotation of the rotor | |
| The speed of the i-th blade element caused by the rotation of the helicopter | |
| The airspeed of the helicopter | |
| The speed of the i-th blade element | |
| The side force on the aircraft | |
| Dirac symbol | |
| Density diffusion coefficient of air flow field | |
| Temperature diffusion coefficient of air flow field | |
| The coefficient of the force on the air flow field due to density | |
| The coefficient of the force on the air flow field due to the temperature difference | |
| Specific heat capacity coefficient of wet air | |
| Diffusion coefficient of air flow field | |
| The density of the air flow field | |
| Residual ash density | |
| Boltzmann constant | |
| Radiation Angle coefficient | |
| Subcellular hypothesis correction factor | |
| Wind and terrain consumption correction factor | |
| Curl of the air flow field | |
| The angular velocity of the rotor | |
| The angular velocity of the helicopter |
References
- Shatford, J.P.A.; Hibbs, D.E.; Puettmann, K.J. Conifer Regeneration after Forest Fire in the Klamath-Siskiyous: How Much, How Soon? J. For. 2007, 105, 139–146. [Google Scholar]
- Stevens-Rumann, C.S.; Morgan, P. Tree Regeneration Following Wildfires in the Western US: A Review. Fire Ecol. 2019, 15, 15. [Google Scholar] [CrossRef]
- Haque, M.K.; Azad, M.A.K.; Hossain, M.Y.; Ahmed, T.; Uddin, M.; Hossain, M.M. Wildfire in Australia during 2019–2020, Its Impact on Health, Biodiversity and Environment with Some Proposals for Risk Management: A Review. J. Environ. Prot. 2021, 12, 391–414. [Google Scholar] [CrossRef]
- Minhua, Y.; Gerth, F.; Ramiah, V.; Muschert, G.W. The Impact of the 2019 Australian Bushfire: Financial Markets, Air Pollution, and Economic Effects. Rev. Pac. Basin Financ. Mark. Policies 2023, 26, 2350020. [Google Scholar] [CrossRef]
- Hodgson, M.J.; Newstead, R.G. Location-Allocation Models for One-Strike Initial Attack of Forest Fires by Airtankers. Can. J. For. Res. 1978, 8, 145–154. [Google Scholar] [CrossRef]
- Hirsch, K.G.; Corey, P.N.; Martell, D.L. Using Expert Judgment to Model Initial Attack Fire Crew Effectiveness. For. Sci. 1998, 44, 539–549. [Google Scholar]
- Haight, R.G.; Fried, J.S. Deploying Wildland Fire Suppression Resources with a Scenario-Based Standard Response Model. INFOR Inf. Syst. Oper. Res. 2007, 45, 31–39. [Google Scholar] [CrossRef]
- Chow, J.Y.J.; Regan, A.C. Resource Location and Relocation Models with Rolling Horizon Forecasting for Wildland Fire Planning. INFOR Inf. Syst. Oper. Res. 2011, 49, 31–43. [Google Scholar] [CrossRef]
- Feldens Ferrari, J.; Chen, M. A Mathematical Model for Tactical Aerial Search and Rescue Fleet and Operation Planning. Int. J. Disaster Risk Reduct. 2020, 50, 101680. [Google Scholar] [CrossRef]
- Podur, J.J.; Martell, D.L.; Podur, J.J.; Martell, D.L. A Simulation Model of the Growth and Suppression of Large Forest Fires in Ontario. Int. J. Wildl. Fire 2007, 16, 285–294. [Google Scholar] [CrossRef]
- Finney, M.A. FARSITE, Fire Area Simulator—Model Development and Evaluation; US Department of Agriculture, Forest Service, Rocky Mountain Research Station: Fort Collins, CO, USA, 1998.
- Coen, J.L. NCAR Technical Notes; National Center for Atmospheric Research: Boulder, CO, USA, 2013. [Google Scholar]
- Linn, R.R.; Harlow, F.H. FIRETEC: A Transport Description of Wildfire Behavior; Los Alamos National Lab. (LANL): Los Alamos, NM, USA, 1997.
- Mell, W.; Charney, J.; Jenkins, M.A.; Cheney, P.; Gould, J. Numerical Simulations of Grassland Fire Behavior from the LANL-FIRETEC and NIST-WFDS Models. In Remote Sensing Modeling and Applications to Wildland Fires; Springer: Berlin/Heidelberg, Germany, 2013; pp. 209–225. [Google Scholar]
- McGrattan, K.B.; Baum, H.R.; Rehm, R.G.; Hamins, A.; Forney, G.P.; Floyd, J.E.; Hostikka, S.; Prasad, K. Fire Dynamics Simulator–Technical Reference Guide; National Institute of Standards and Technology, Building and Fire Research: Gaithersburg, MD, USA, 2000.
- Yassemi, S.; Dragićević, S.; Schmidt, M. Design and Implementation of an Integrated GIS-Based Cellular Automata Model to Characterize Forest Fire Behaviour. Ecol. Model. 2008, 210, 71–84. [Google Scholar] [CrossRef]
- Liu, Y.; Liu, H.; Zhou, Y.; Sun, C. Spread Vector Induced Cellular Automata Model for Real-Time Crown Fire Behavior Simulation. Environ. Model. Softw. 2018, 108, 14–39. [Google Scholar] [CrossRef]
- Pais, C.; Carrasco, J.; Martell, D.L.; Weintraub, A.; Woodruff, D.L. Cell2Fire: A Cell-Based Forest Fire Growth Model to Support Strategic Landscape Management Planning. Front. For. Glob. Chang. 2021, 4, 692706. [Google Scholar] [CrossRef]
- Baranovskiy, N.V.; Kirienko, V.A. Mathematical Simulation of Forest Fuel Pyrolysis and Crown Forest Fire Impact for Forest Fire Danger and Risk Assessment. Processes 2022, 10, 483. [Google Scholar] [CrossRef]
- Mastorakos, E.; Gkantonas, S.; Efstathiou, G.; Giusti, A. A Hybrid Stochastic Lagrangian—Cellular Automata Framework for Modelling Fire Propagation in Inhomogeneous Terrains. Proc. Combust. Inst. 2023, 39, 3853–3862. [Google Scholar] [CrossRef]
- Meng, Q.; Huai, Y.; You, J.; Nie, X. Visualization of 3D Forest Fire Spread Based on the Coupling of Multiple Weather Factors. Comput. Graph. 2023, 110, 58–68. [Google Scholar] [CrossRef]
- Denham, M.; Wendt, K.; Bianchini, G.; Cortés, A.; Margalef, T. Dynamic Data-Driven Genetic Algorithm for Forest Fire Spread Prediction. J. Comput. Sci. 2012, 3, 398–404. [Google Scholar] [CrossRef]
- Wu, Z.; Wang, B.; Li, M.; Tian, Y.; Quan, Y.; Liu, J. Simulation of Forest Fire Spread Based on Artificial Intelligence. Ecol. Indic. 2022, 136, 108653. [Google Scholar] [CrossRef]
- Yuan, C.; Zhang, Y.; Liu, Z. A Survey on Technologies for Automatic Forest Fire Monitoring, Detection, and Fighting Using Unmanned Aerial Vehicles and Remote Sensing Techniques. Can. J. For. Res. 2015, 45, 783–792. [Google Scholar] [CrossRef]
- Shaffer, J.A.; Carrillo, E.; Xu, H. Hierarchal Application of Receding Horizon Synthesis and Dynamic Allocation for UAVs Fighting Fires. IEEE Access 2018, 6, 78868–78880. [Google Scholar] [CrossRef]
- Wardihani, E.; Ramdhani, M.; Suharjono, A.; Setyawan, T.A.; Hidayat, S.S.; Helmy, S.W.; Triyono, E.; Saifullah, F. Real-Time Forest Fire Monitoring System Using Unmanned Aerial Vehicle. J. Eng. Sci. Technol. 2018, 13, 1587–1594. [Google Scholar]
- Kinaneva, D.; Hristov, G.; Raychev, J.; Zahariev, P. Early Forest Fire Detection Using Drones and Artificial Intelligence. In Proceedings of the 2019 42nd International Convention on Information and Communication Technology, Electronics and Microelectronics (MIPRO), Opatija, Croatia, 20–24 May 2019; pp. 1060–1065. [Google Scholar]
- Liu, Y.X.; Liu, H.; Tian, Y.L.; Sun, C. Distributed Control Method of Multiple UAVs For Persistent Wildfire Surveillance. Acta Aeronaut. Astronaut. Sin. 2020, 41, 323318. (In Chinese) [Google Scholar] [CrossRef]
- Zohdi, T.I. A Machine-Learning Framework for Rapid Adaptive Digital-Twin Based Fire-Propagation Simulation in Complex Environments. Comput. Methods Appl. Mech. Eng. 2020, 363, 112907. [Google Scholar] [CrossRef]
- Zohdi, T.I. A Digital Twin Framework for Machine Learning Optimization of Aerial Fire Fighting and Pilot Safety. Comput. Methods Appl. Mech. Eng. 2021, 373, 113446. [Google Scholar] [CrossRef]
- Stam, J. Stable Fluids. In Proceedings of the 26th Annual Conference on Computer Graphics and Interactive Techniques, Los Angeles, CA, USA, 8–13 August 1999; pp. 121–128. [Google Scholar]
- Fedkiw, R.; Stam, J.; Jensen, H.W. Visual Simulation of Smoke. In Proceedings of the 28th Annual Conference on Computer Graphics and Interactive Techniques, Los Angeles, CA, USA, 12–17 August 2001; pp. 15–22. [Google Scholar]
- Stam, J. Real-Time Fluid Dynamics for Games. In Proceedings of the Game Developer Conference, San Jose, CA, USA, 4–8 March 2003; Volume 18, p. 25. [Google Scholar]
- Wu, E.; Liu, Y.; Liu, X. An Improved Study of Real-Time Fluid Simulation on GPU. Comput. Animat. Virtual Worlds 2004, 15, 139–146. [Google Scholar] [CrossRef]
- Lotrecchiano, N.; Sofia, D.; Giuliano, A.; Barletta, D.; Poletto, M. Pollution Dispersion from a Fire Using a Gaussian Plume Model. Int. J. Saf. Secur. Eng. 2020, 10, 431–439. [Google Scholar] [CrossRef]
- Lee, B.; Cho, S.; Lee, S.-K.; Woo, C.; Park, J. Development of a Smoke Dispersion Forecast System for Korean Forest Fires. Forests 2019, 10, 219. [Google Scholar] [CrossRef]
Figure 1.
Conceptual diagram of fire extinguishing scenario. The arrows represent air flow above the fire field.
Figure 1.
Conceptual diagram of fire extinguishing scenario. The arrows represent air flow above the fire field.
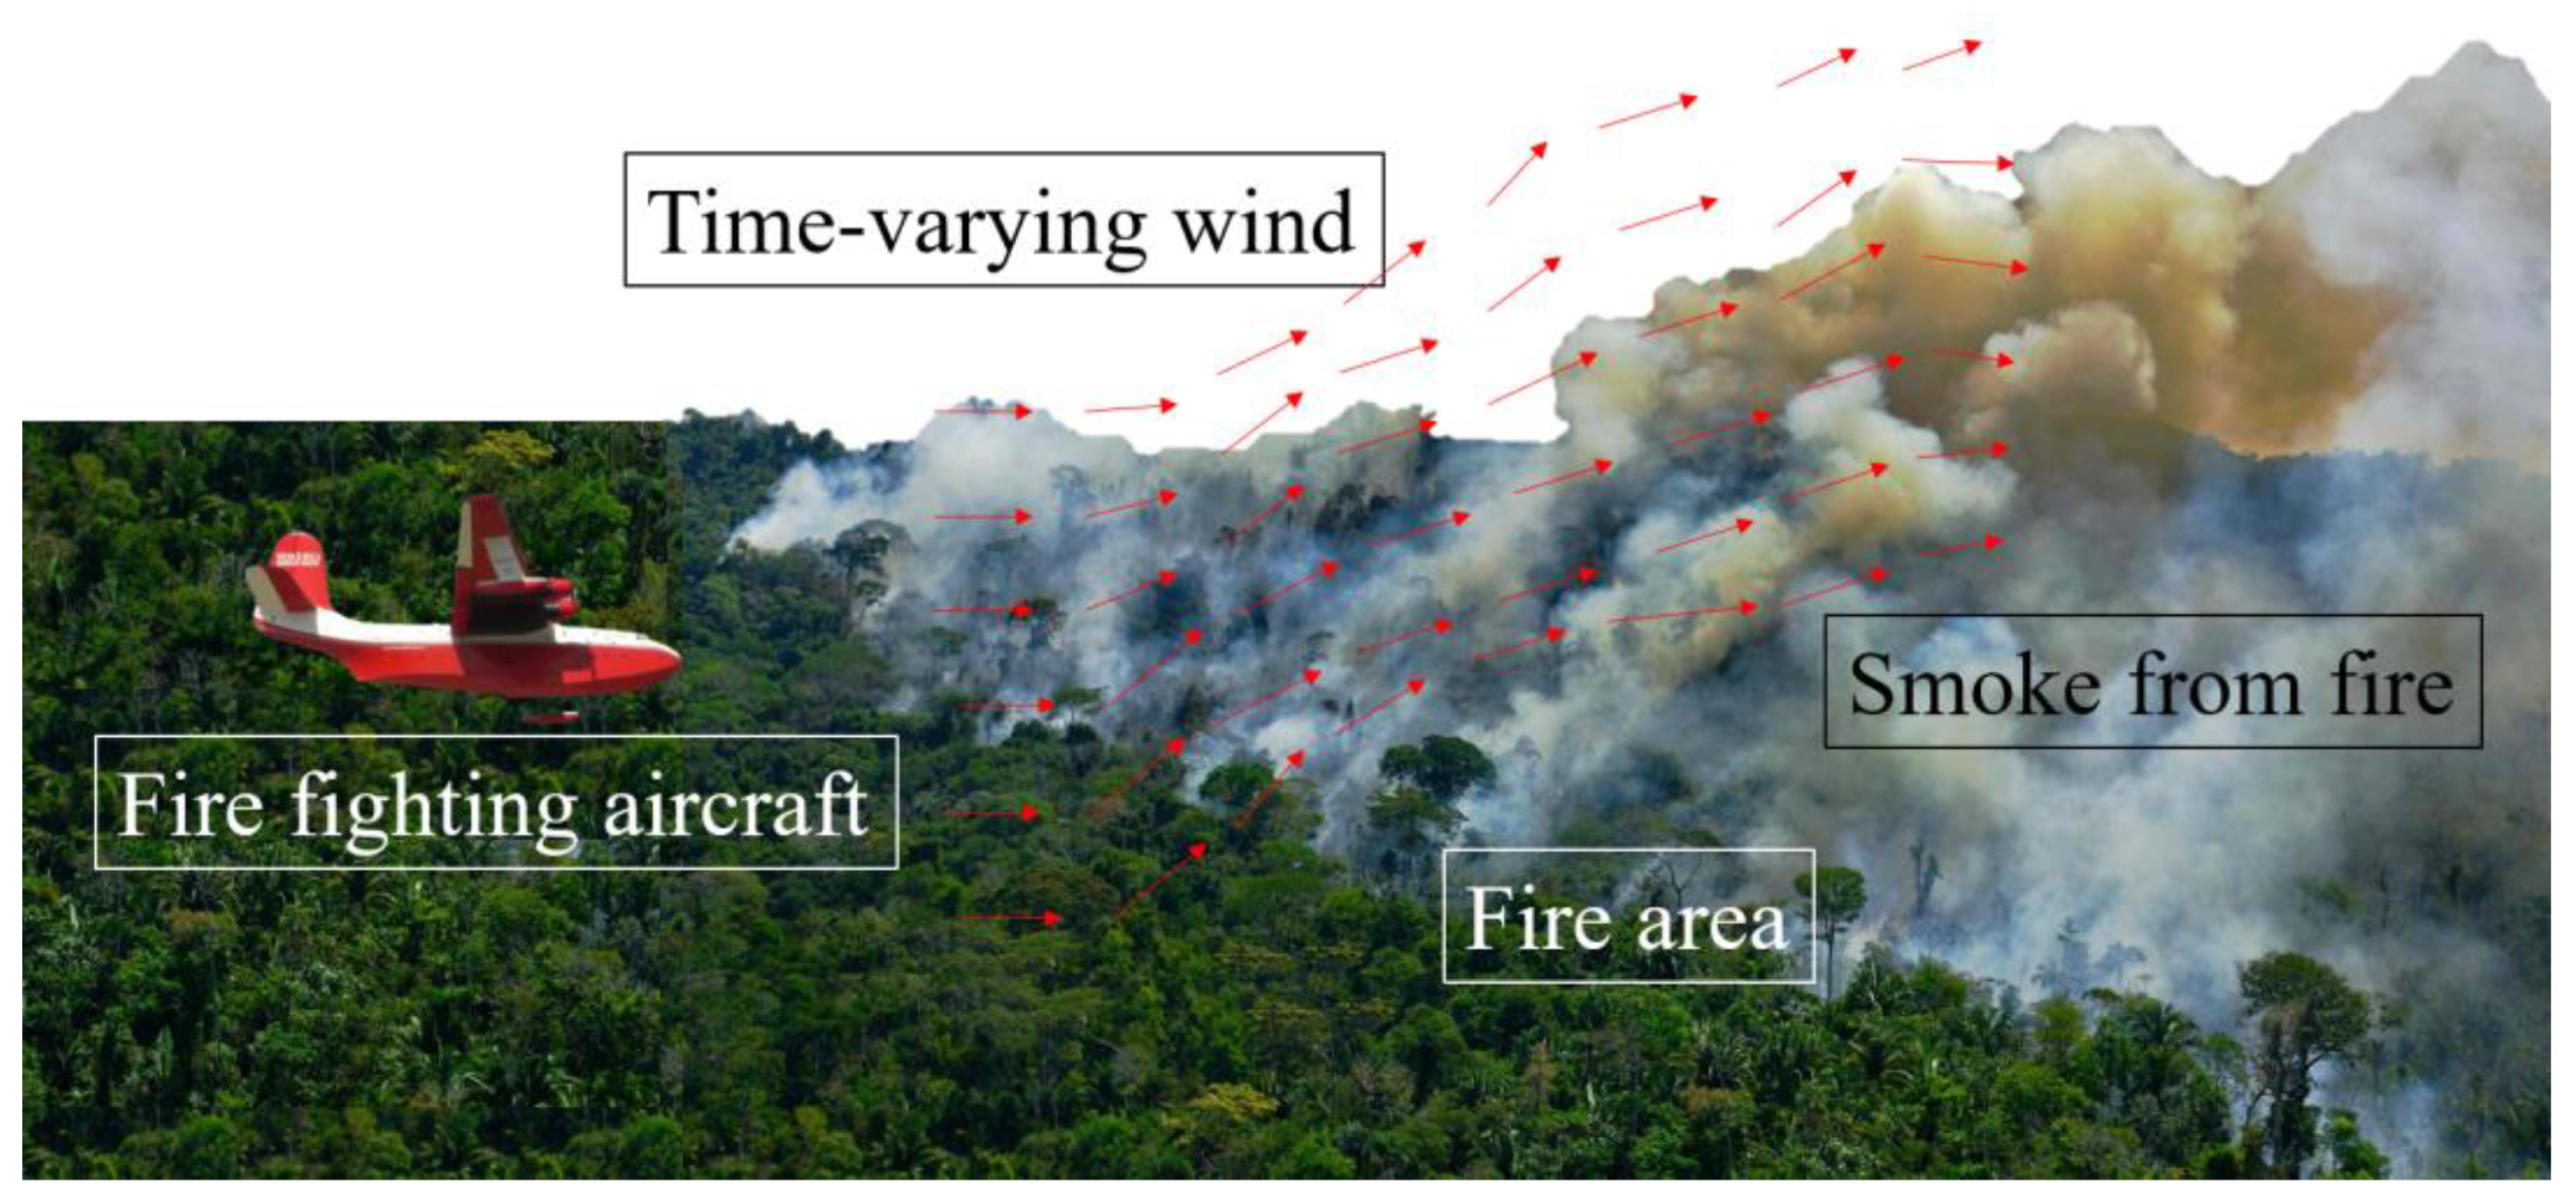
Figure 2.
The Moore neighborhood. Blue cell represents the center cell, and the red cells around are neighbor cells in eight directions.
Figure 2.
The Moore neighborhood. Blue cell represents the center cell, and the red cells around are neighbor cells in eight directions.
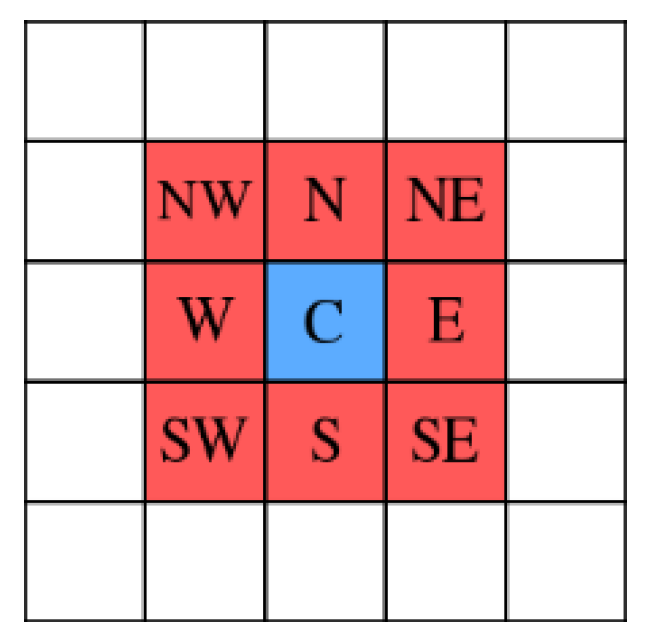
Figure 3.
Mesh division in three-dimensional space.
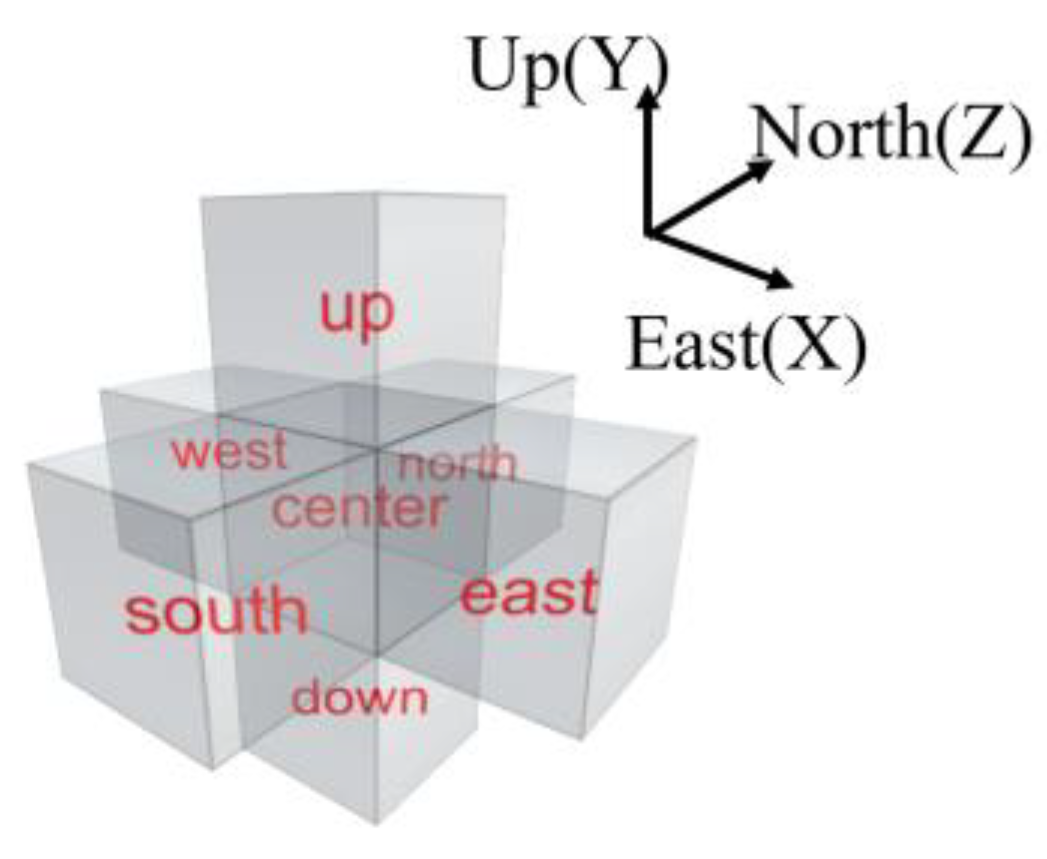
Figure 4.
The fuel bed and fire model. The black color represents burnt area. The green color represents fuel bed with thickness . The red color represents burning area. The border between burning area and unburning area is fire front.
Figure 4.
The fuel bed and fire model. The black color represents burnt area. The green color represents fuel bed with thickness . The red color represents burning area. The border between burning area and unburning area is fire front.
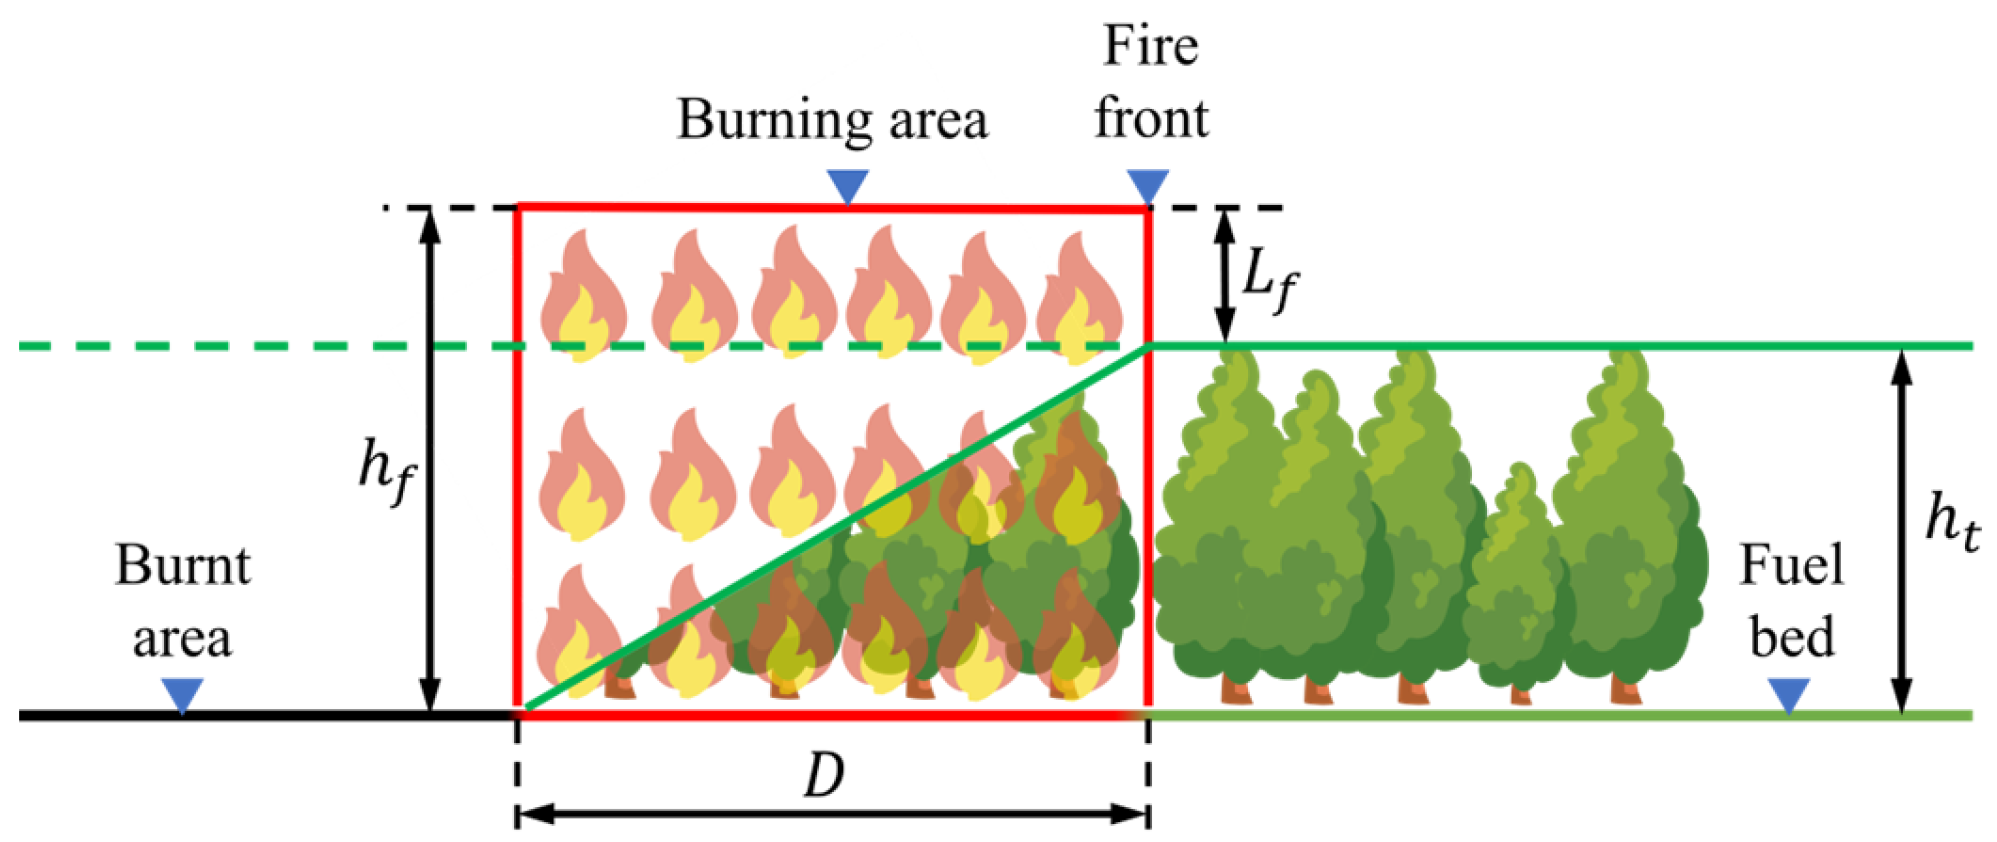
Figure 5.
Framework of data flow between each part.

Figure 6.
Operation process of fire spread.

Figure 7.
Operation process of air field above.
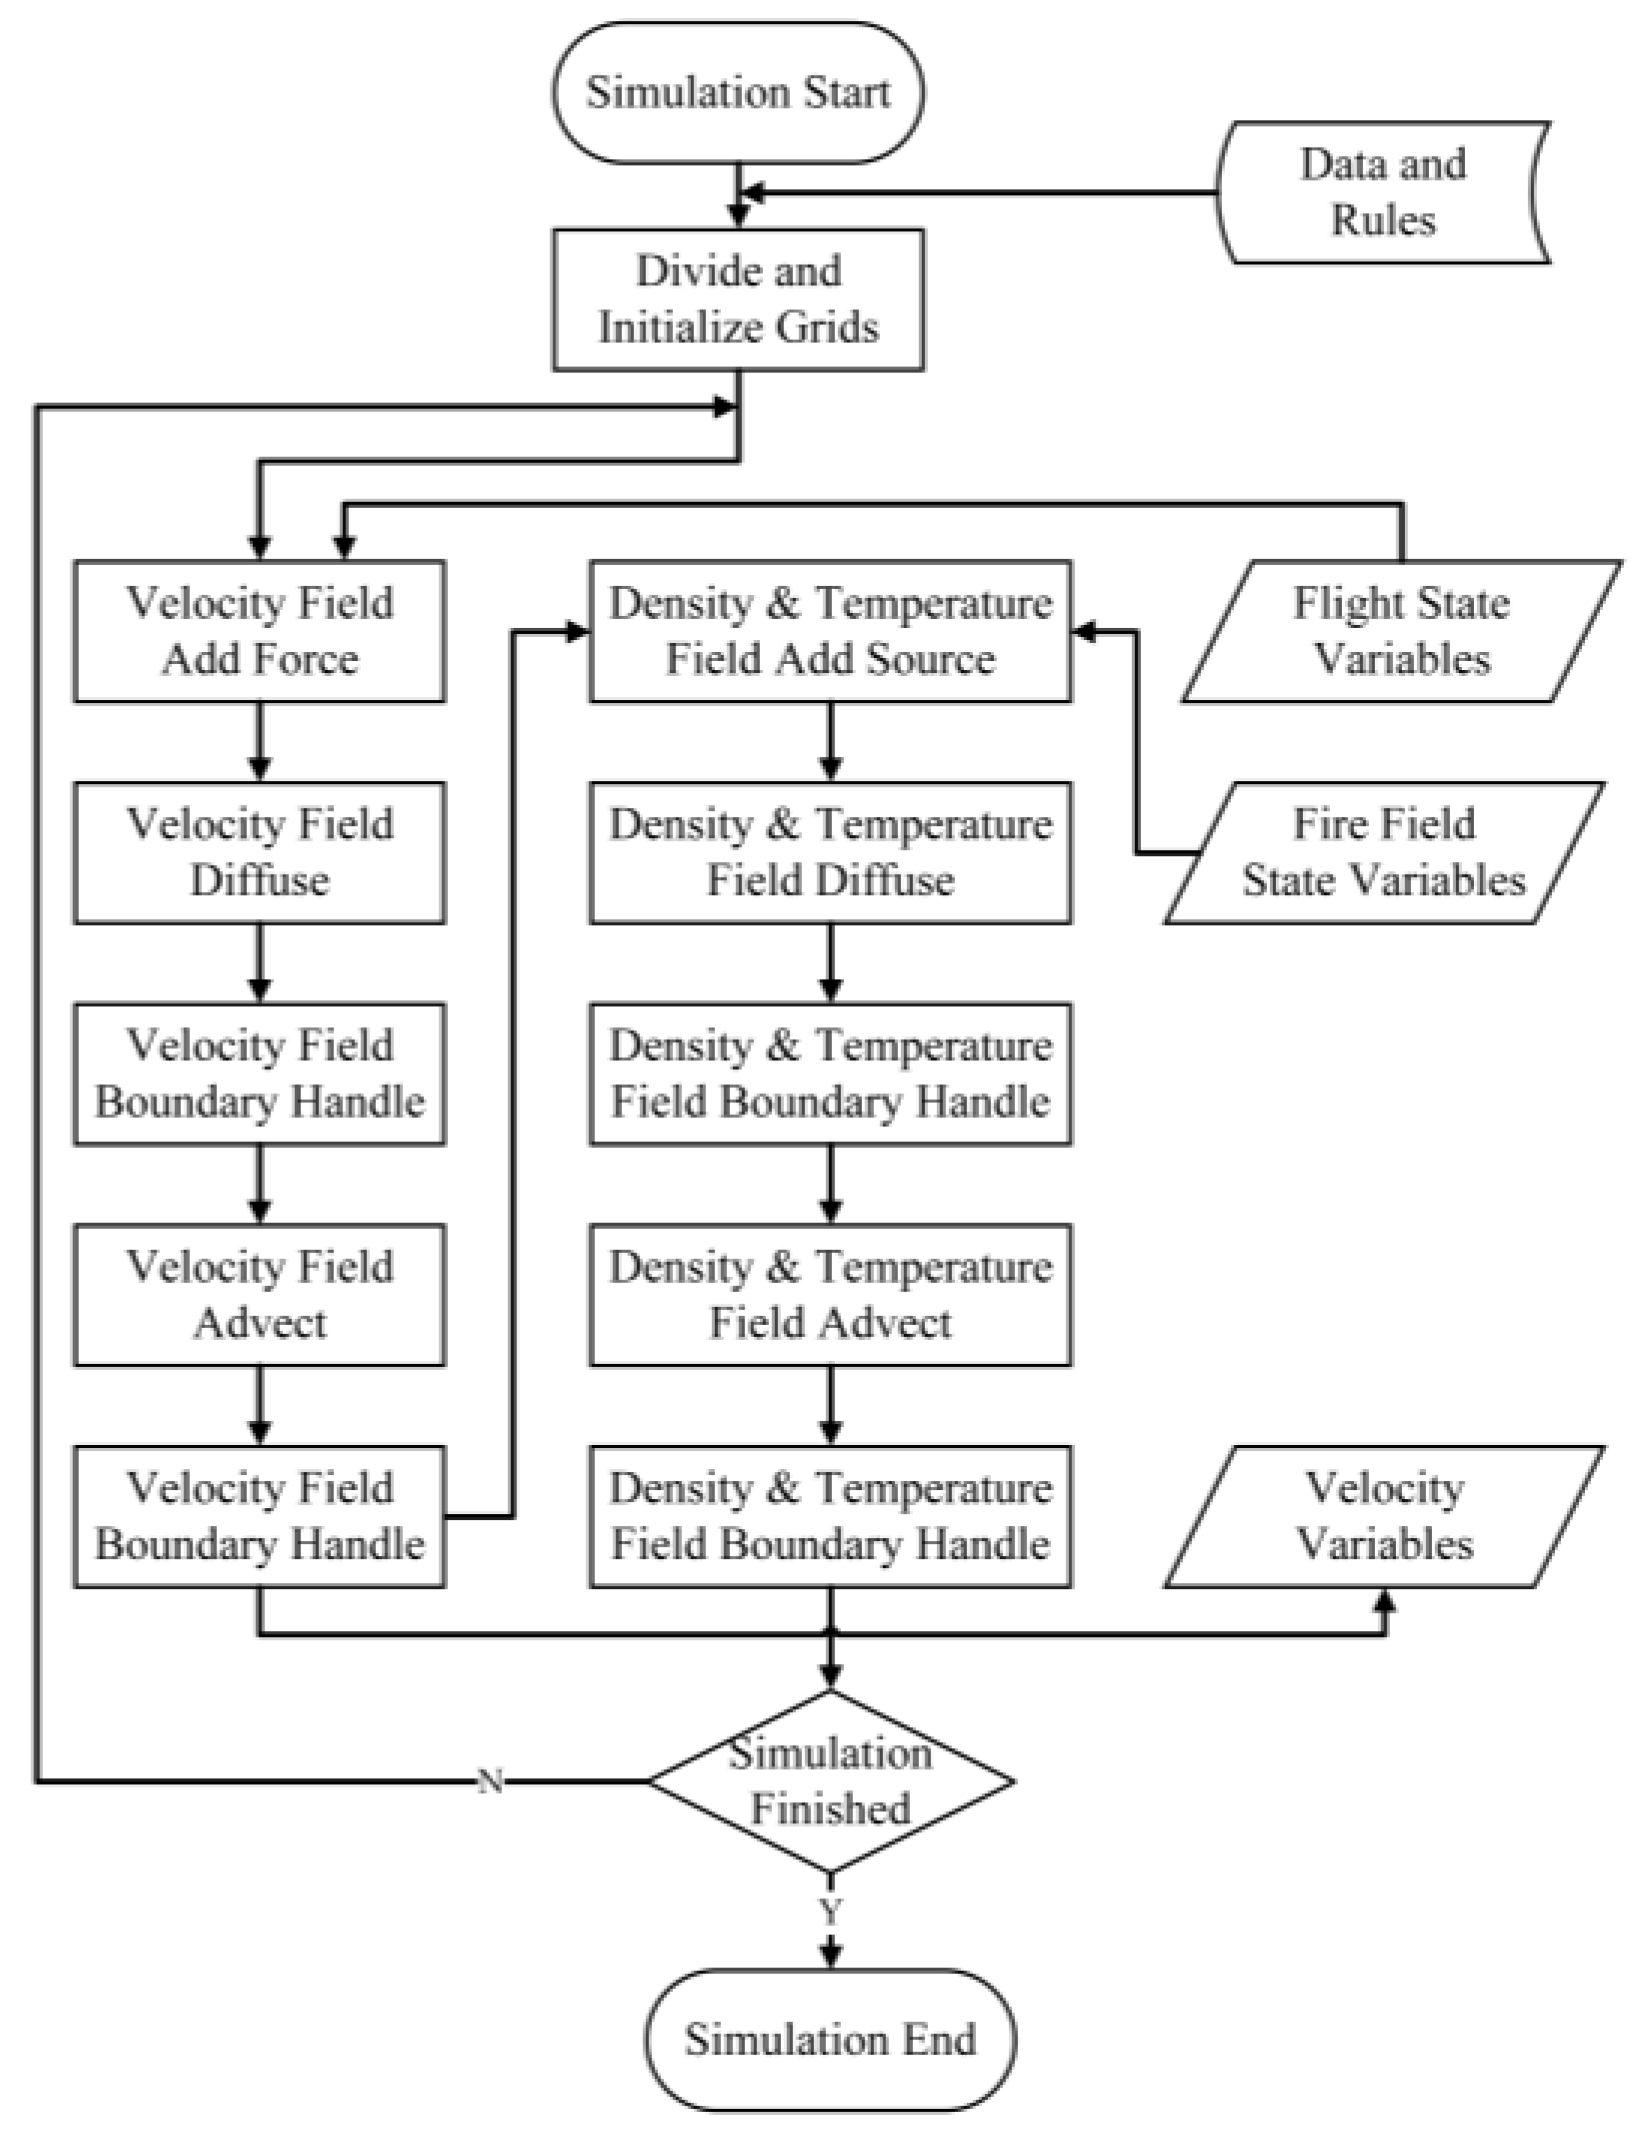
Figure 8.
Operation process of aircraft.
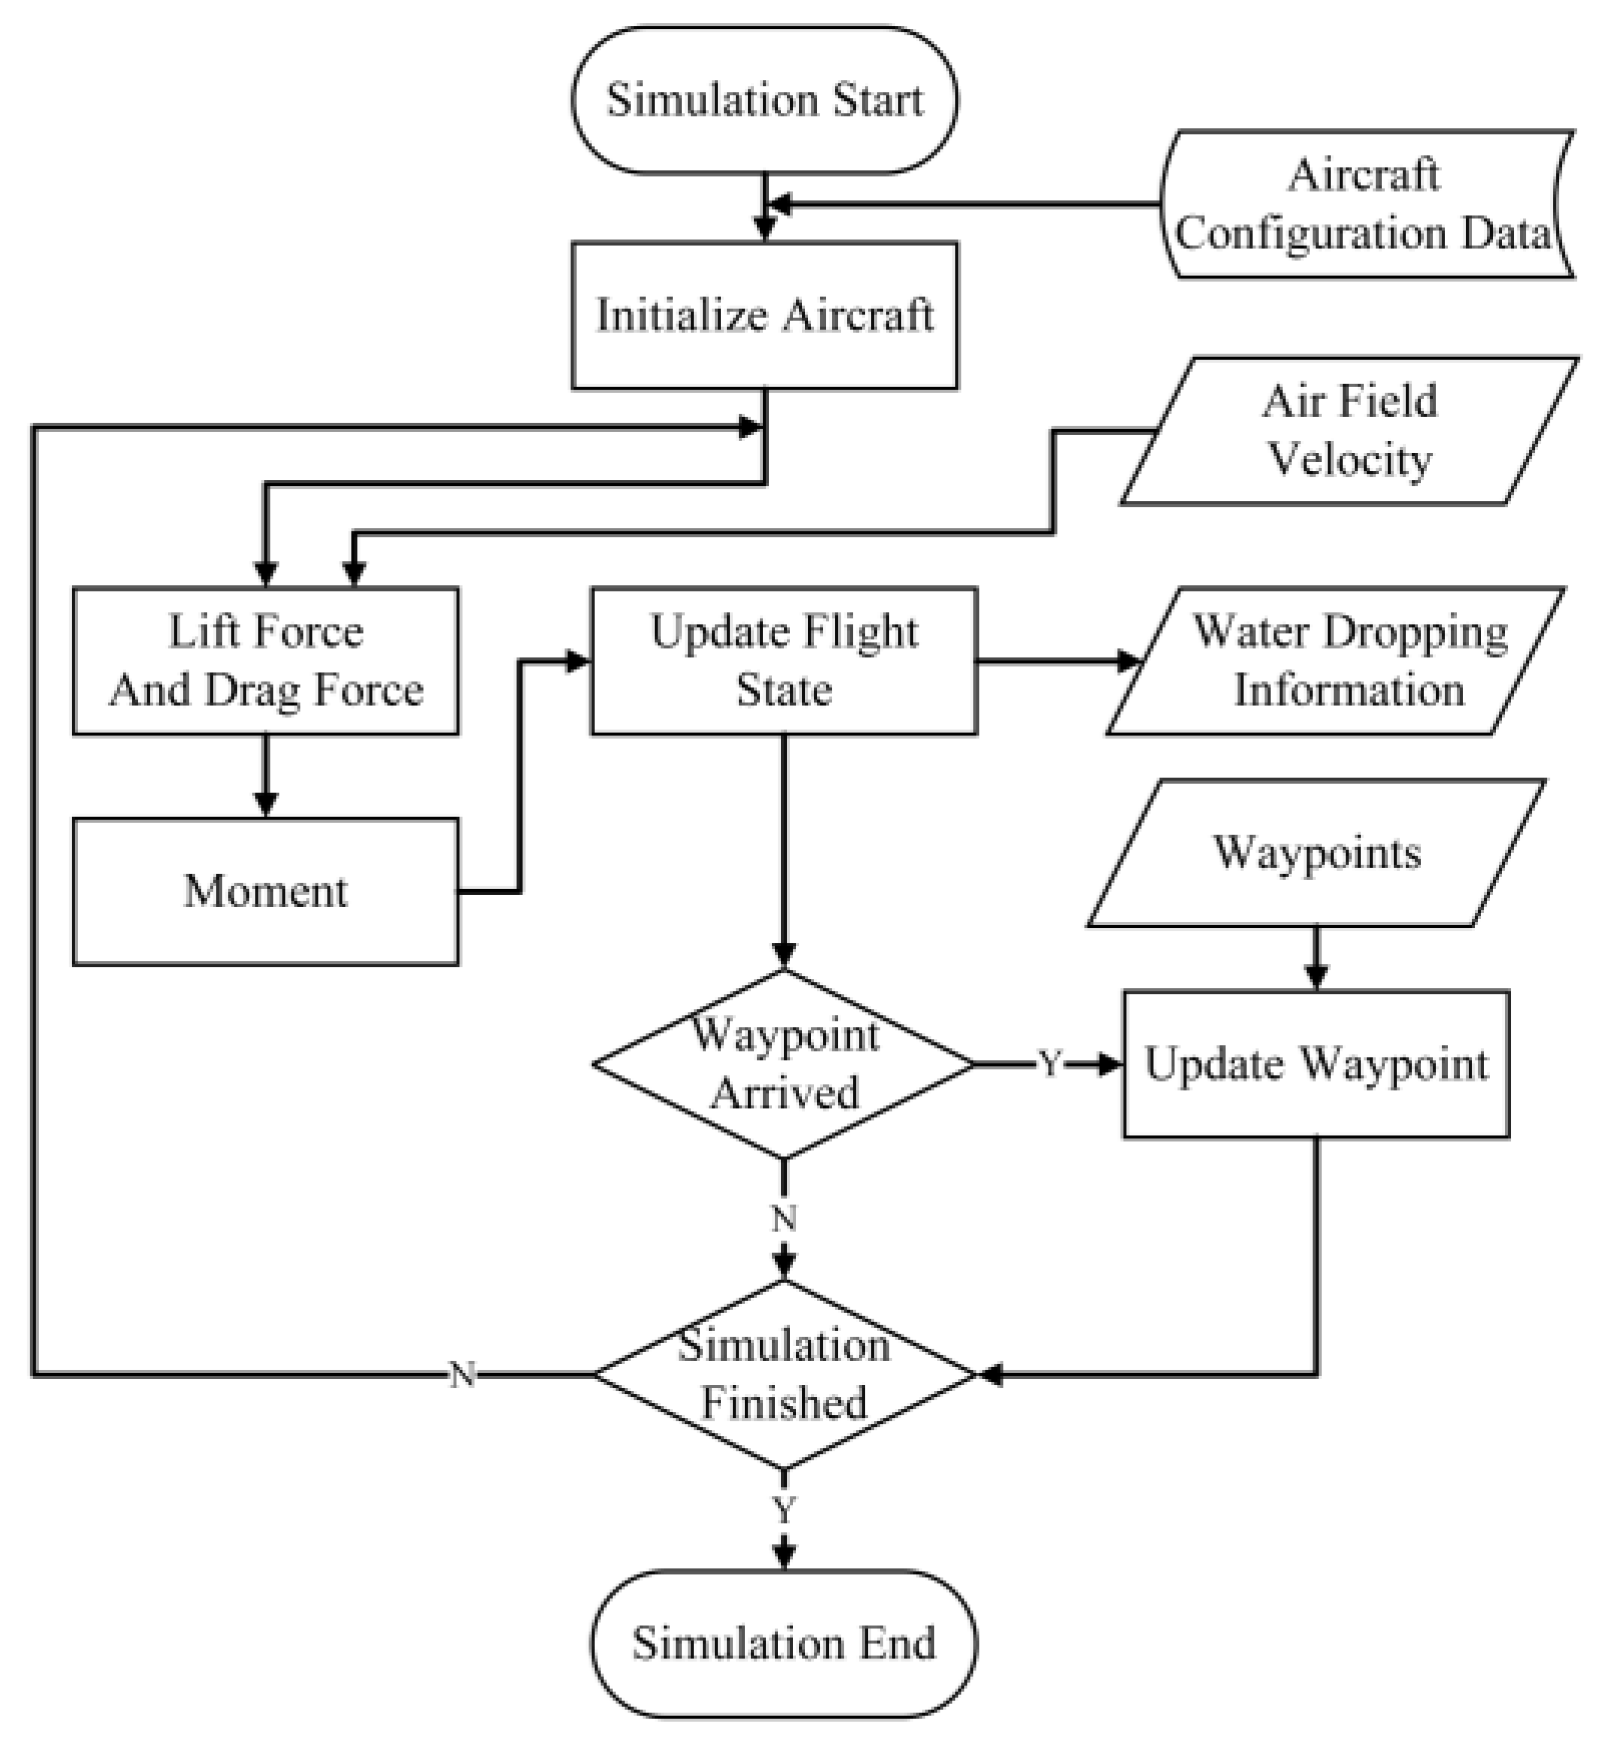
Figure 9.
Simulation results of each component gas in air with different amount of substance.
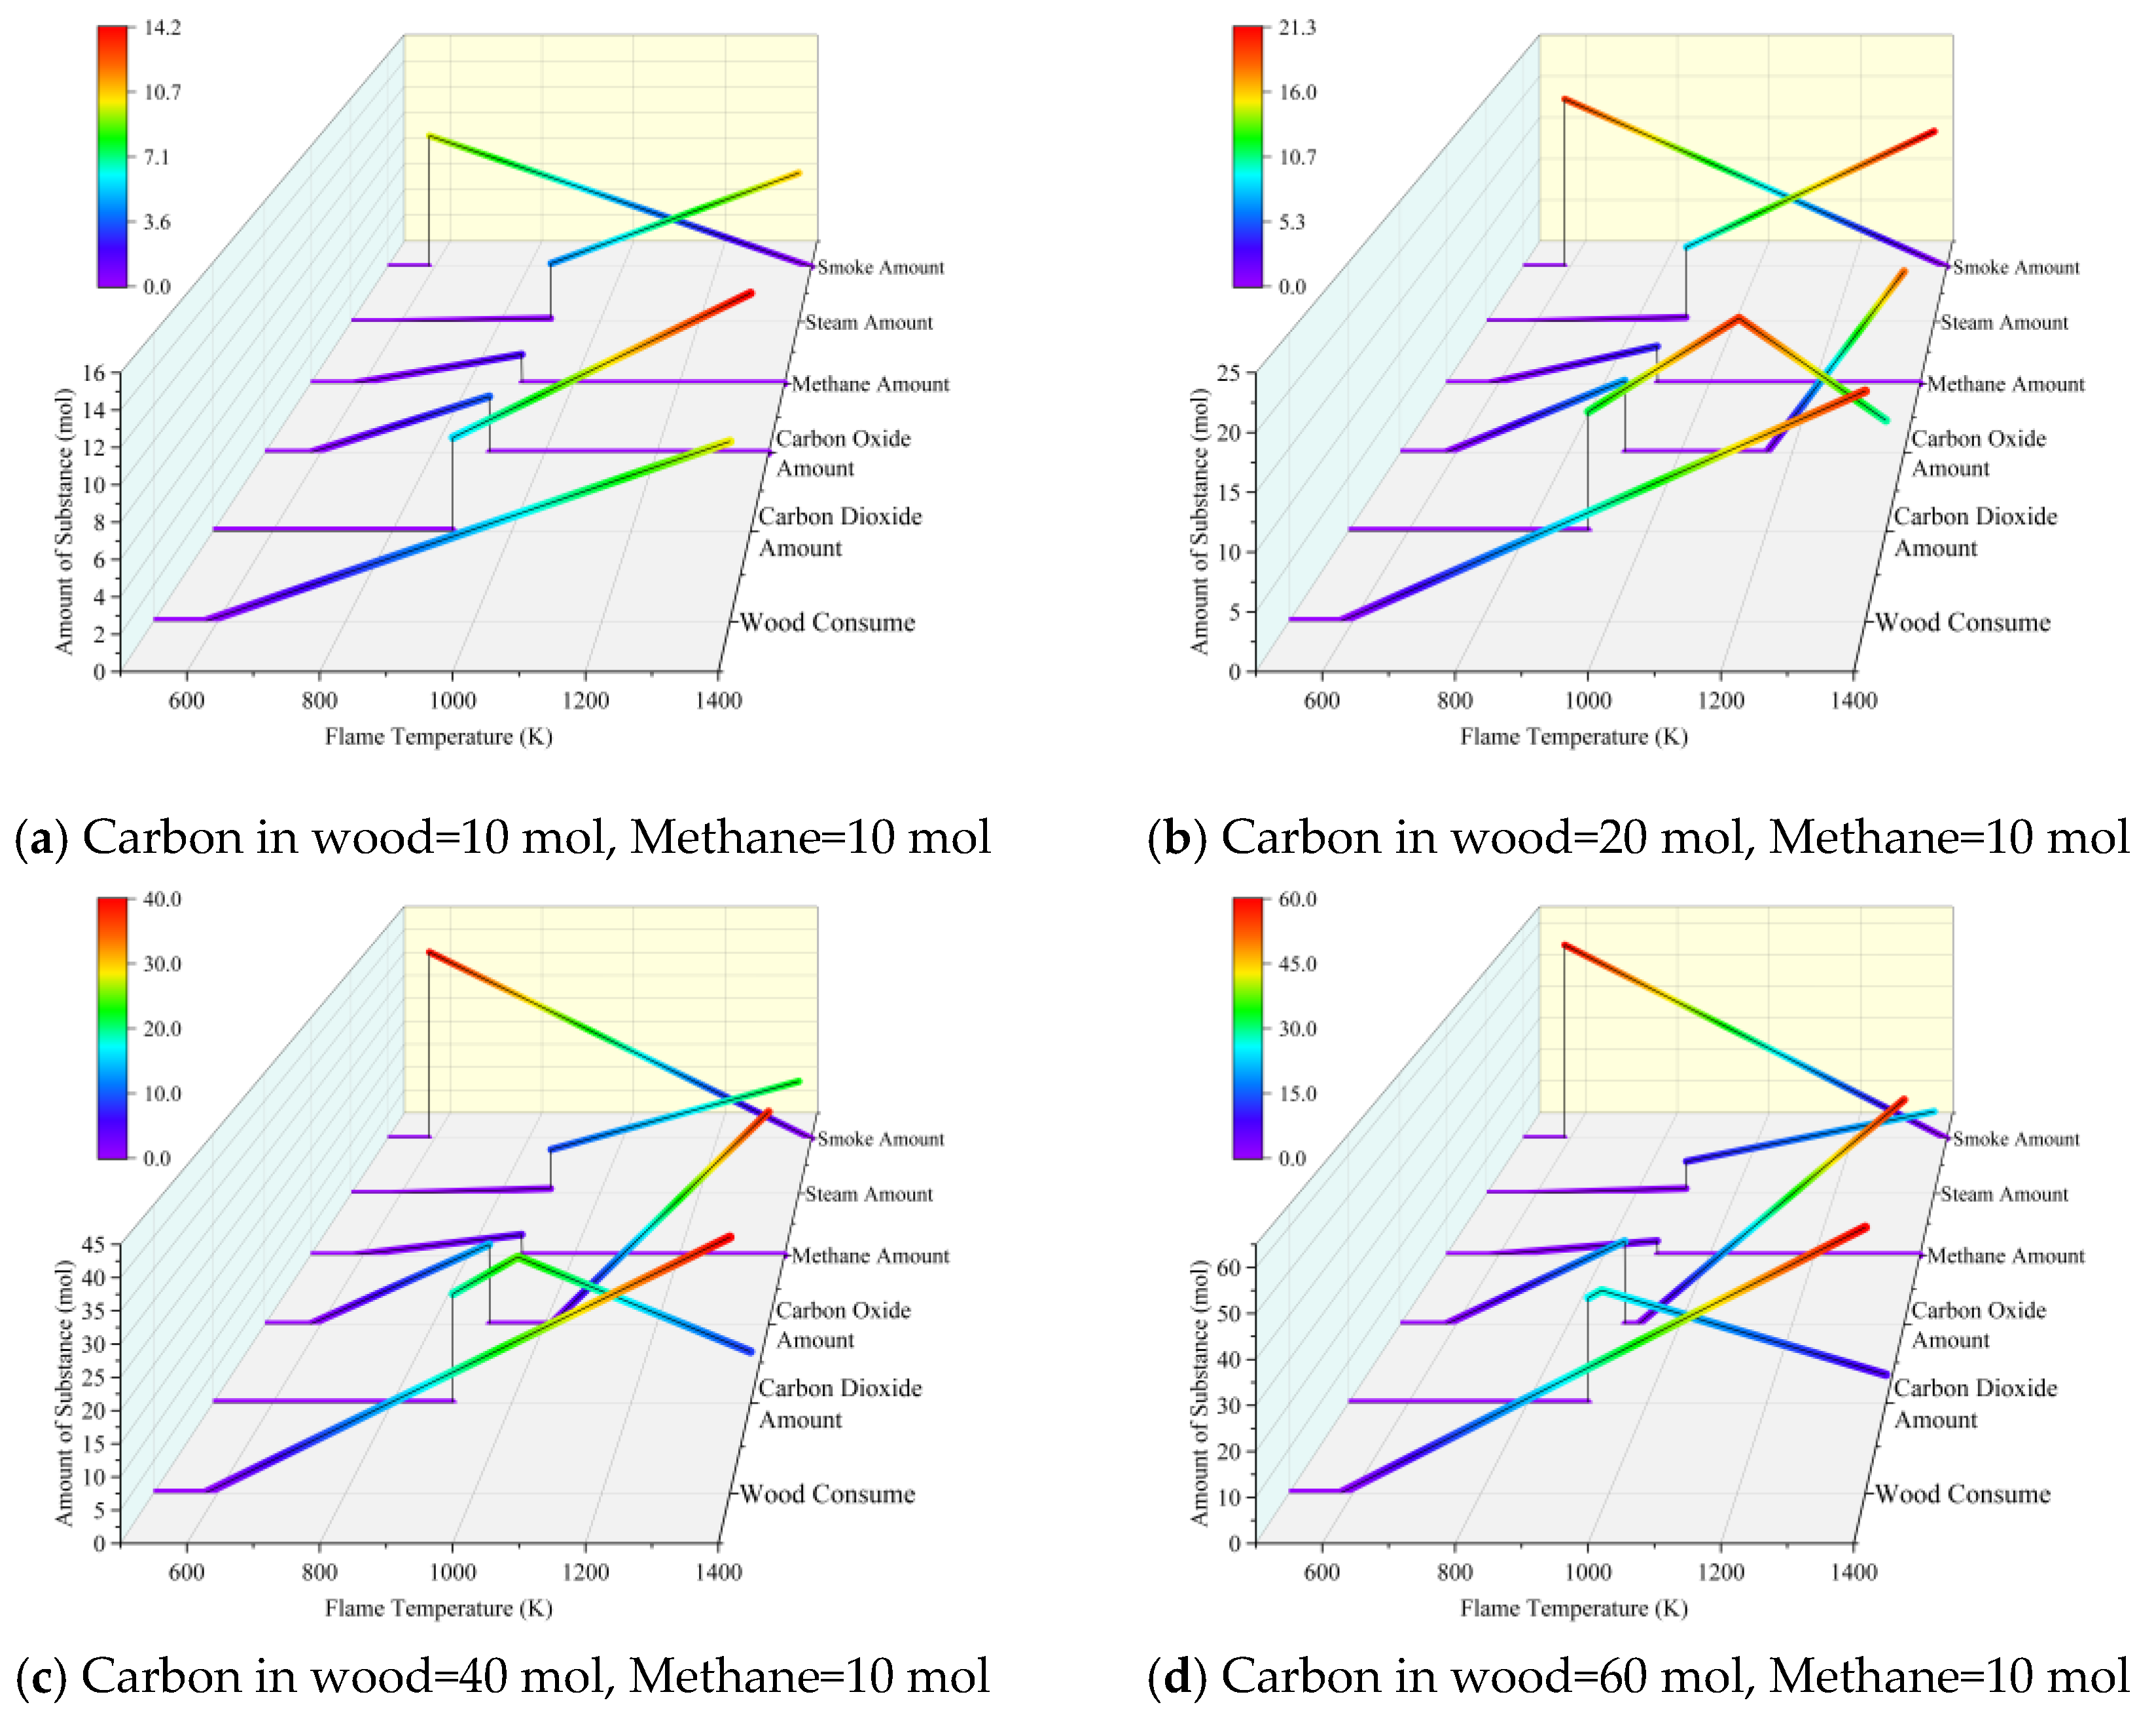
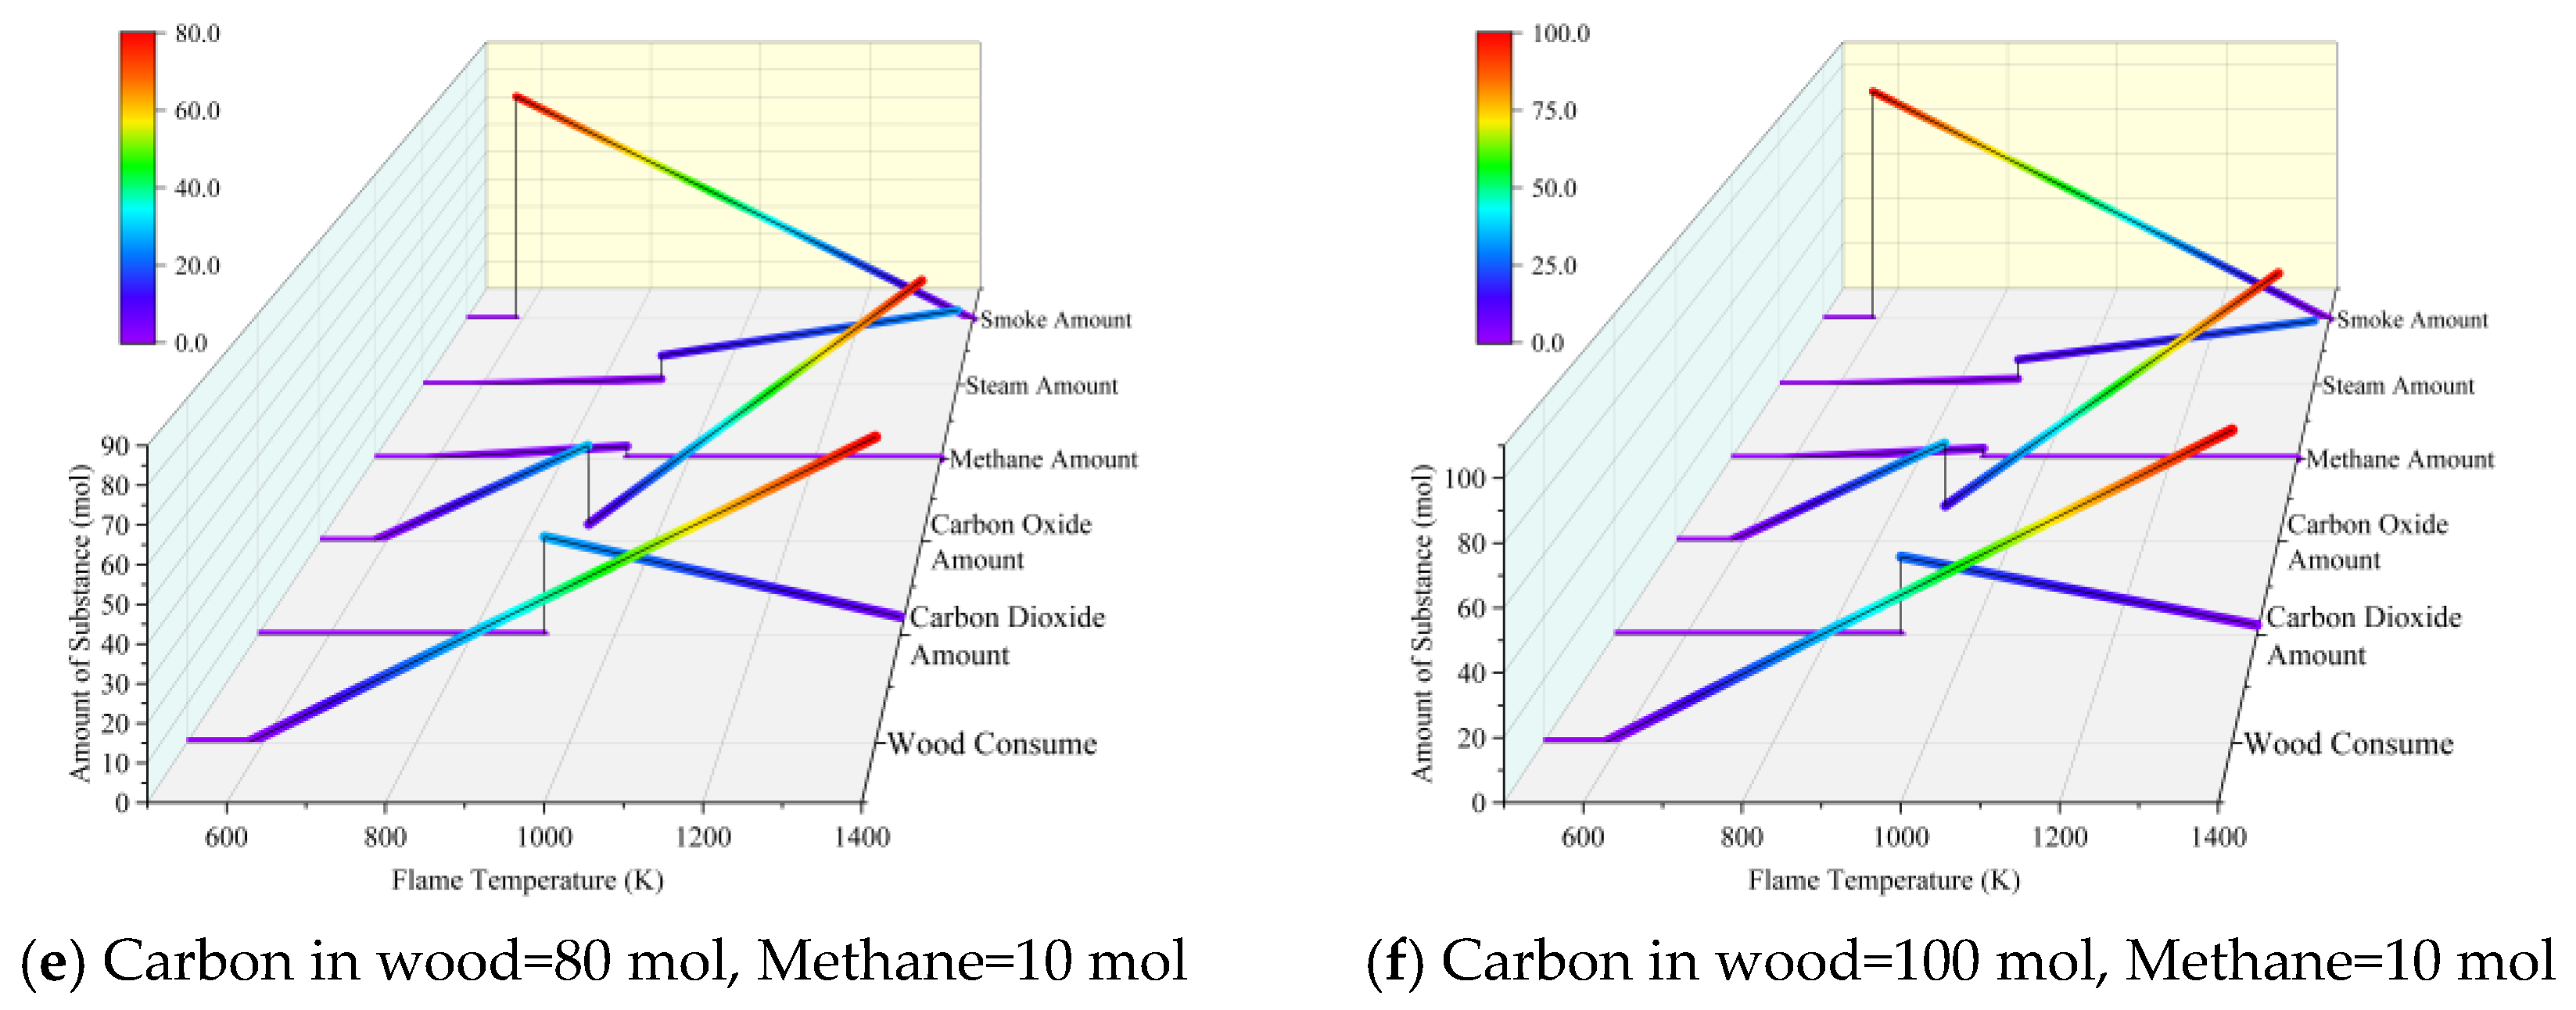
Figure 10.
Simulation results of two-dimensional air flow field.

Figure 11.
Path result of helicopter taking off simulation. The black line is the projection of actual route.
Figure 11.
Path result of helicopter taking off simulation. The black line is the projection of actual route.
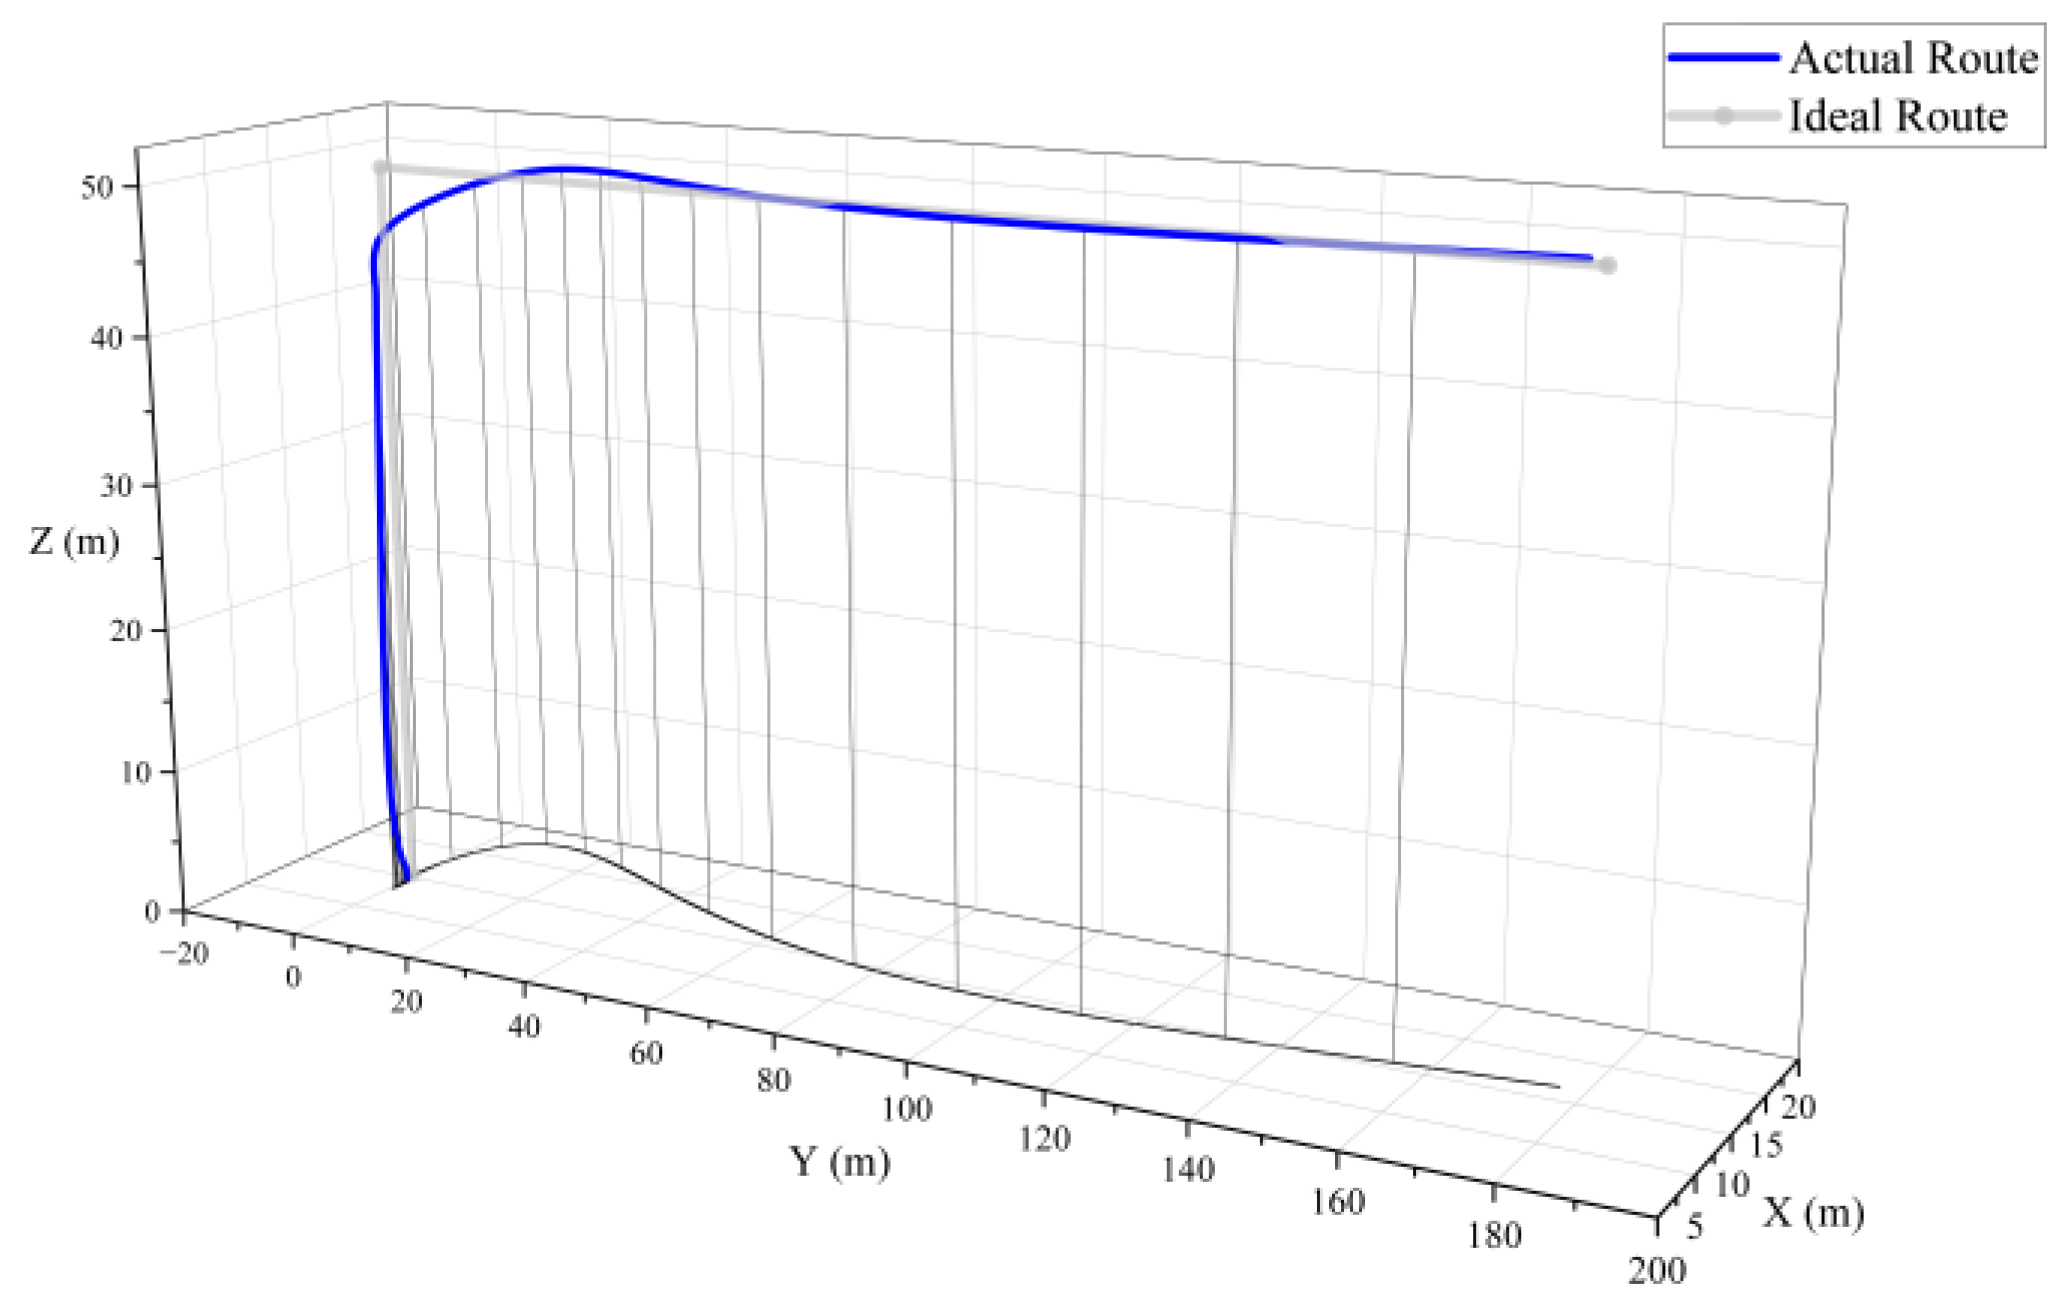
Figure 12.
Path result of helicopter descent, level flight, and pull up simulation. The black line is the projection of actual route.
Figure 12.
Path result of helicopter descent, level flight, and pull up simulation. The black line is the projection of actual route.

Figure 13.
Path result of fixed-wing aircraft taking off simulation. The black line is the projection of actual route.
Figure 13.
Path result of fixed-wing aircraft taking off simulation. The black line is the projection of actual route.
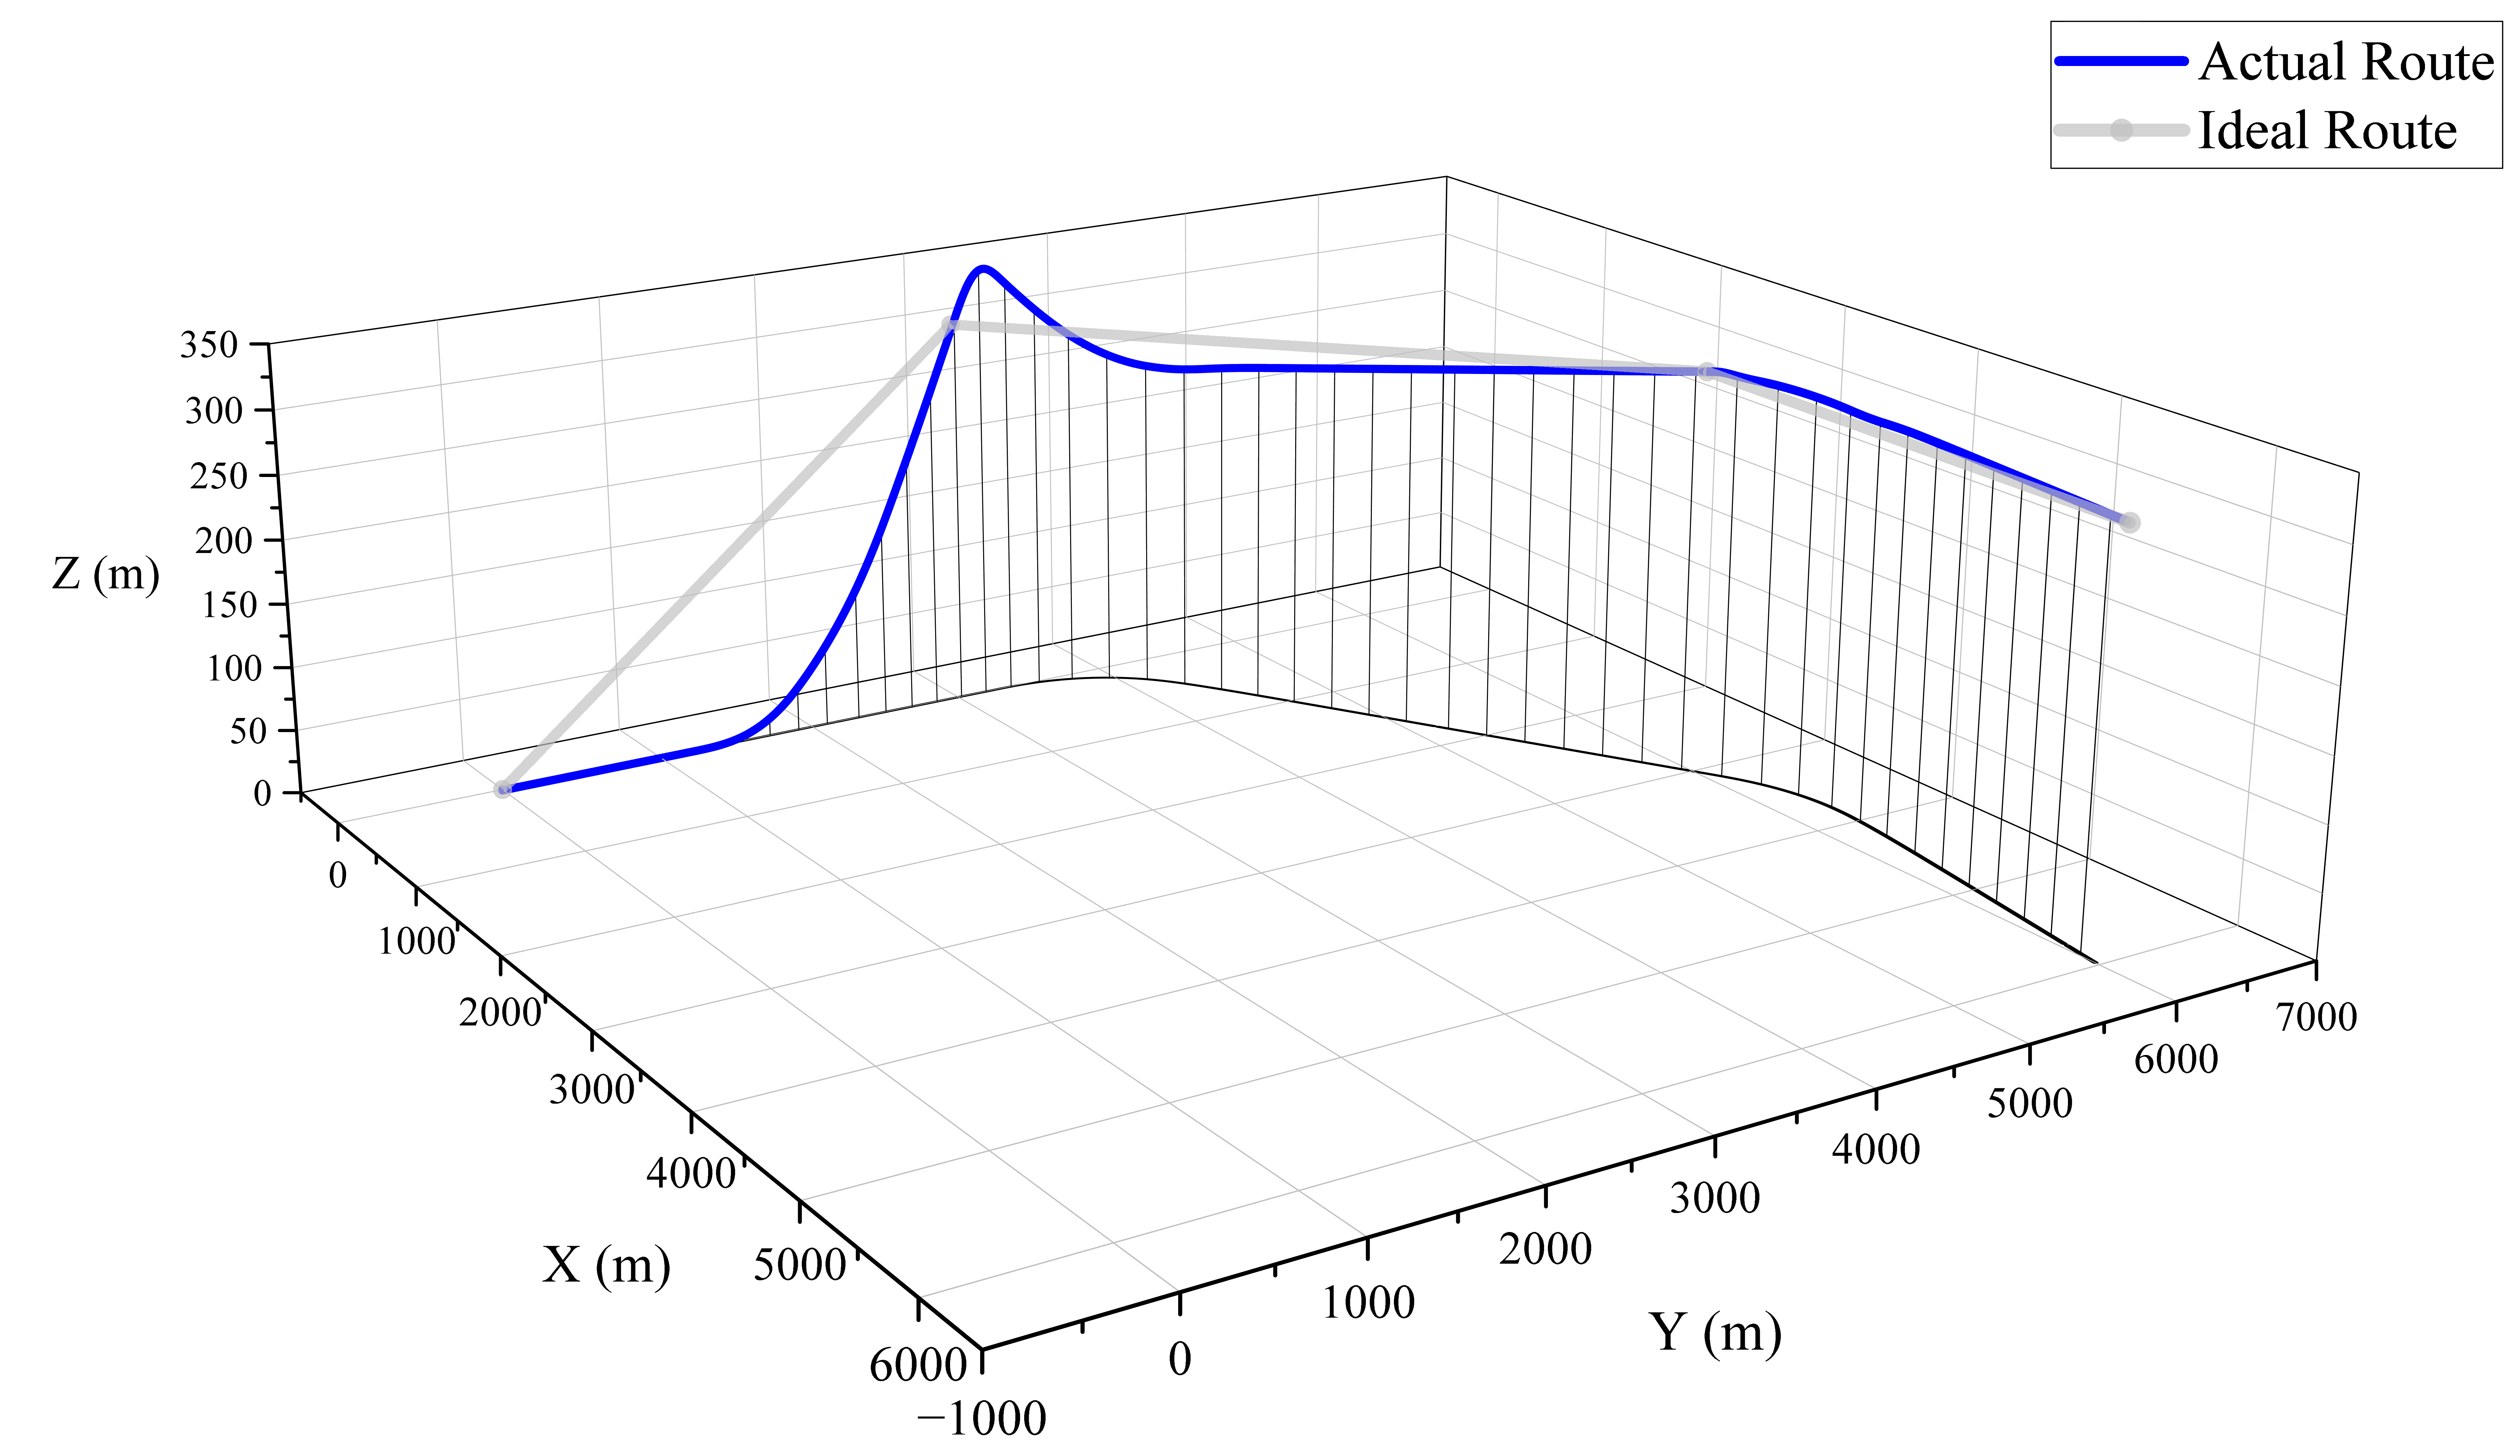
Figure 14.
Path result of fixed-wing aircraft descent, level flight, and pull up simulation. The black line is the projection of actual route.
Figure 14.
Path result of fixed-wing aircraft descent, level flight, and pull up simulation. The black line is the projection of actual route.

Figure 15.
Attitude changes for helicopter.
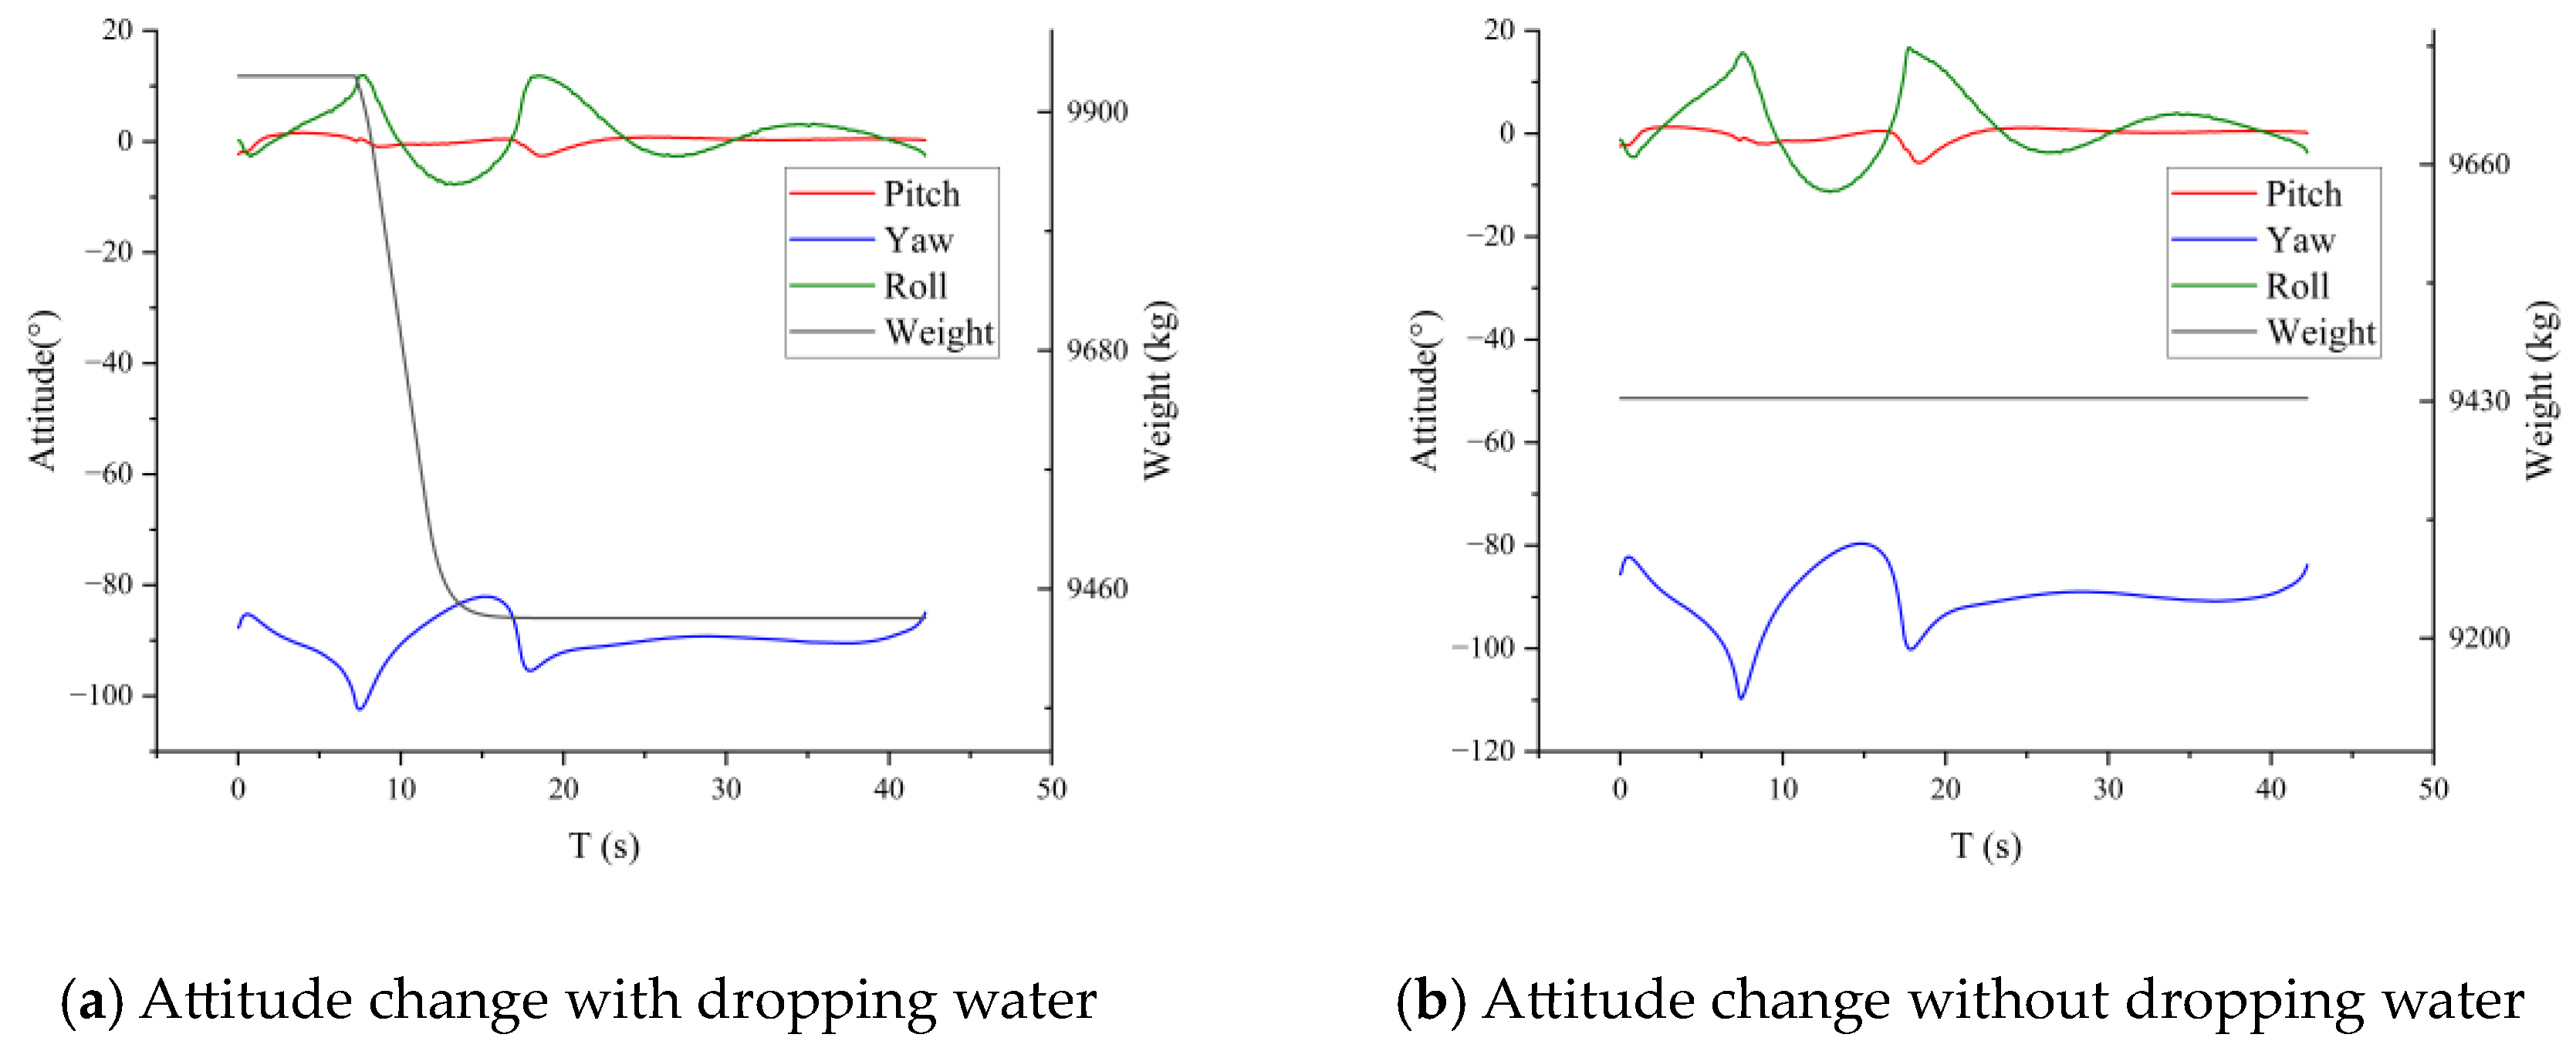
Figure 16.
Attitude changes for fixed-wing aircraft.
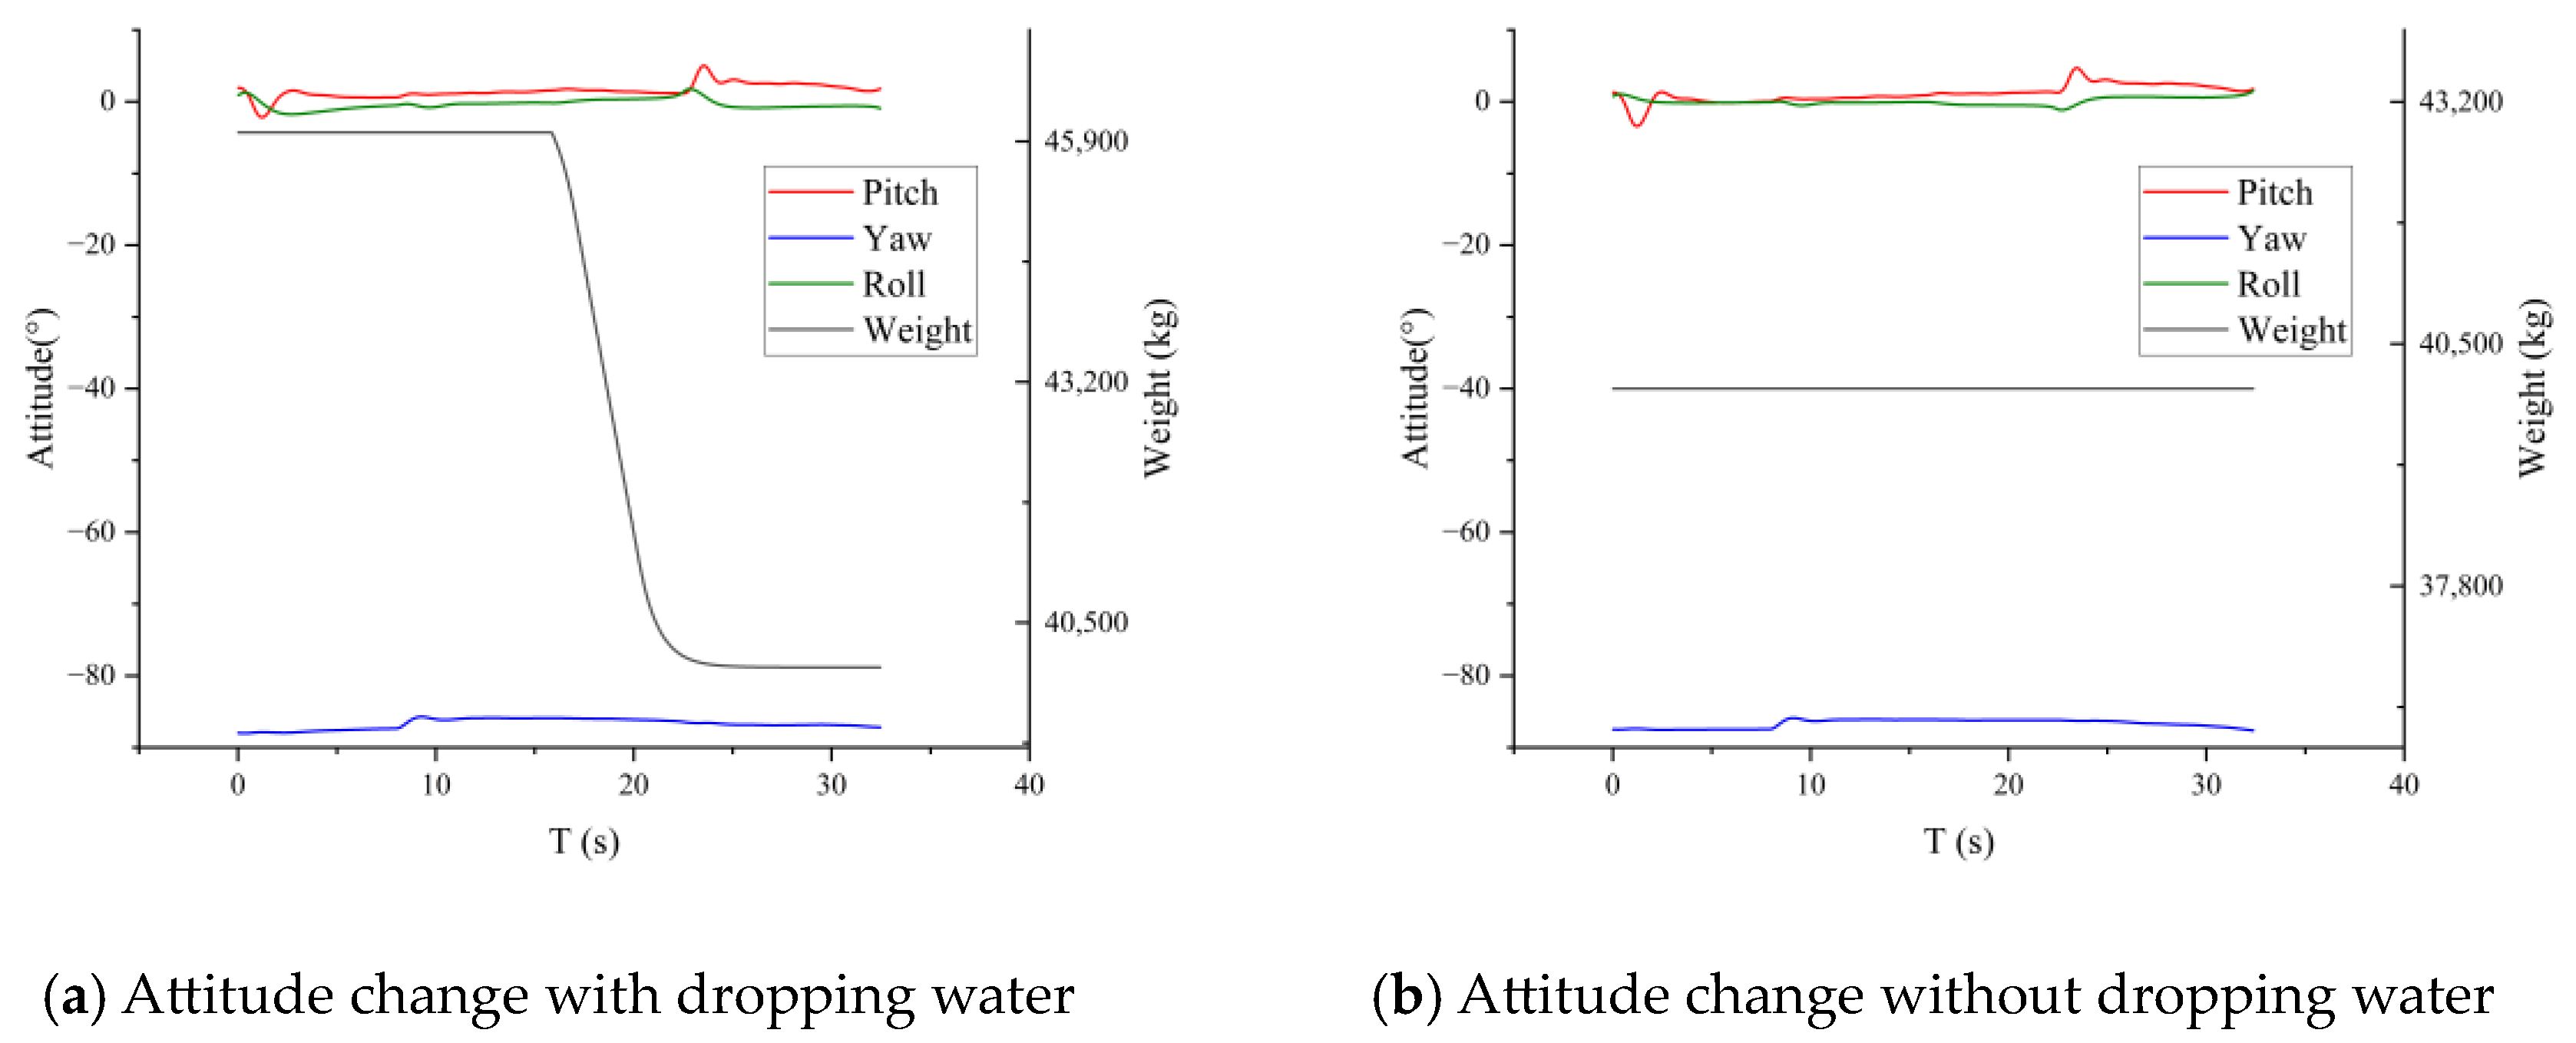
Figure 17.
Flight path result of helicopter simulation.

Figure 18.
Attitude result of helicopter simulation.

Figure 19.
Attitude control of helicopter simulation.
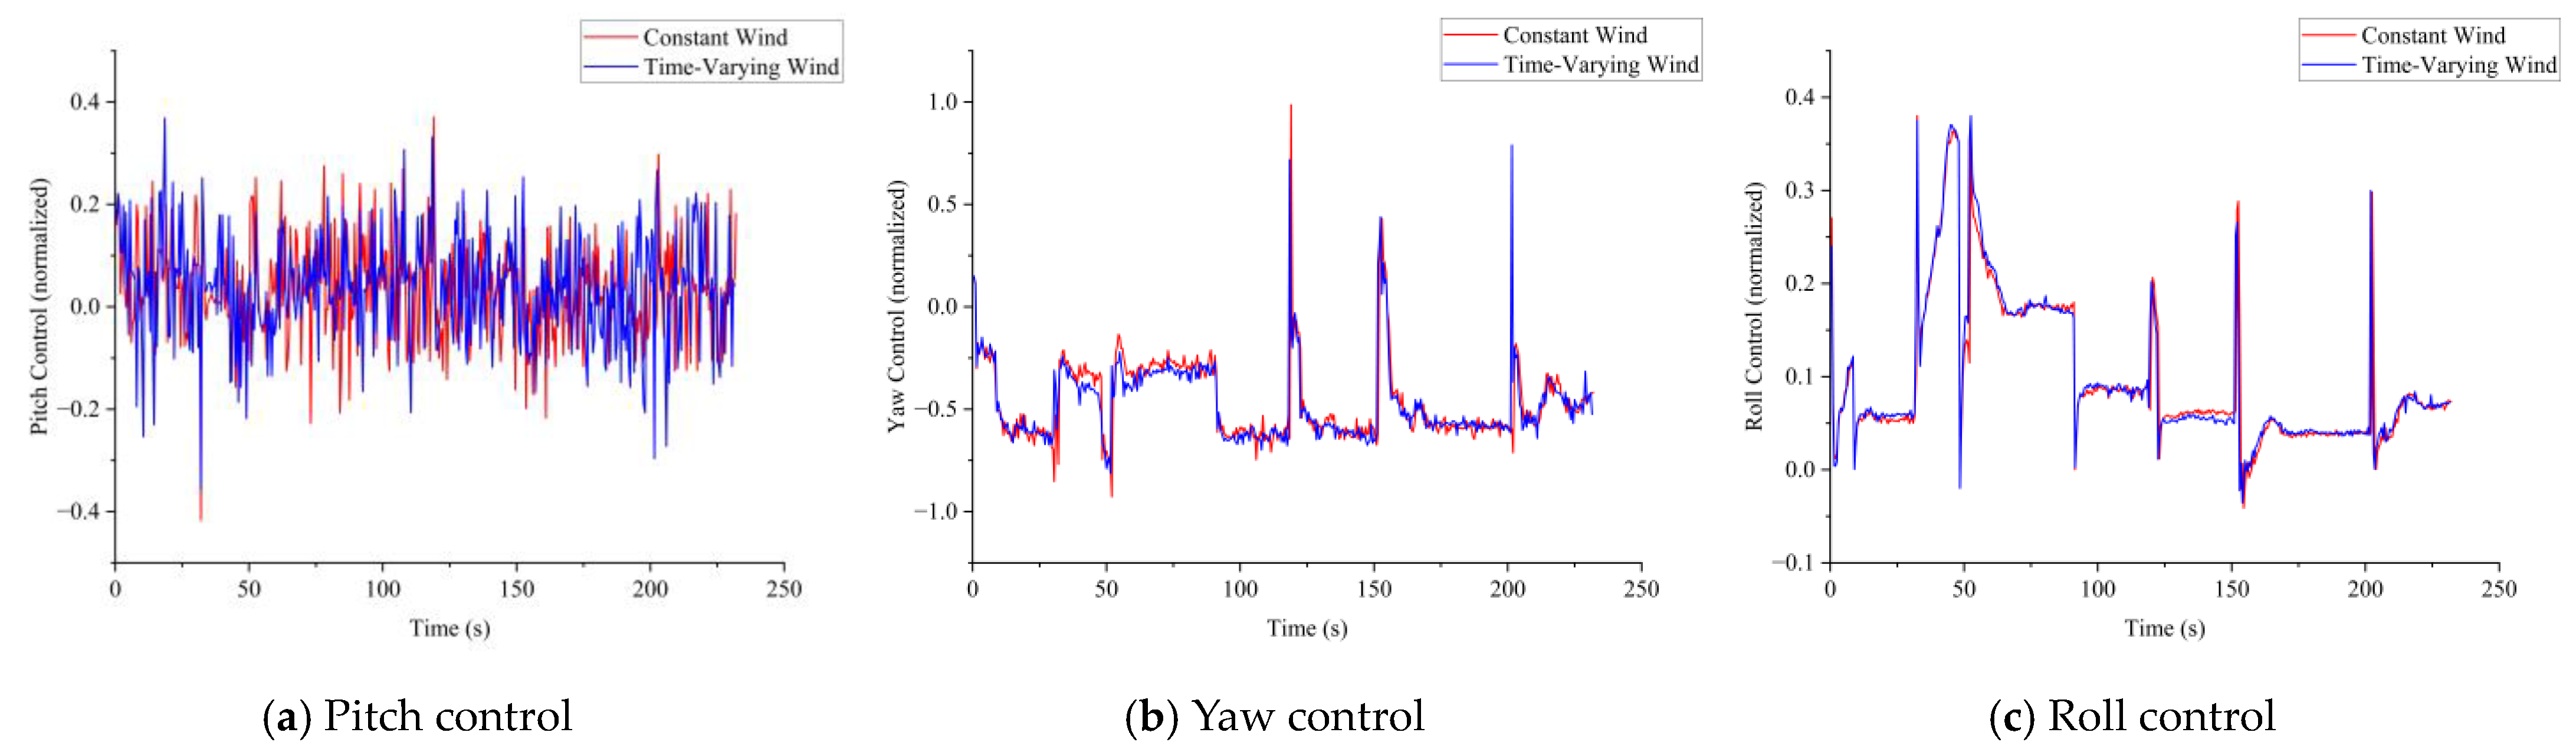
Figure 20.
Statistical data for various control quantities of helicopter. The blue symbols have the same meaning as the red symbols.
Figure 20.
Statistical data for various control quantities of helicopter. The blue symbols have the same meaning as the red symbols.

Figure 21.
Flight path result of fixed-wing aircraft simulation.
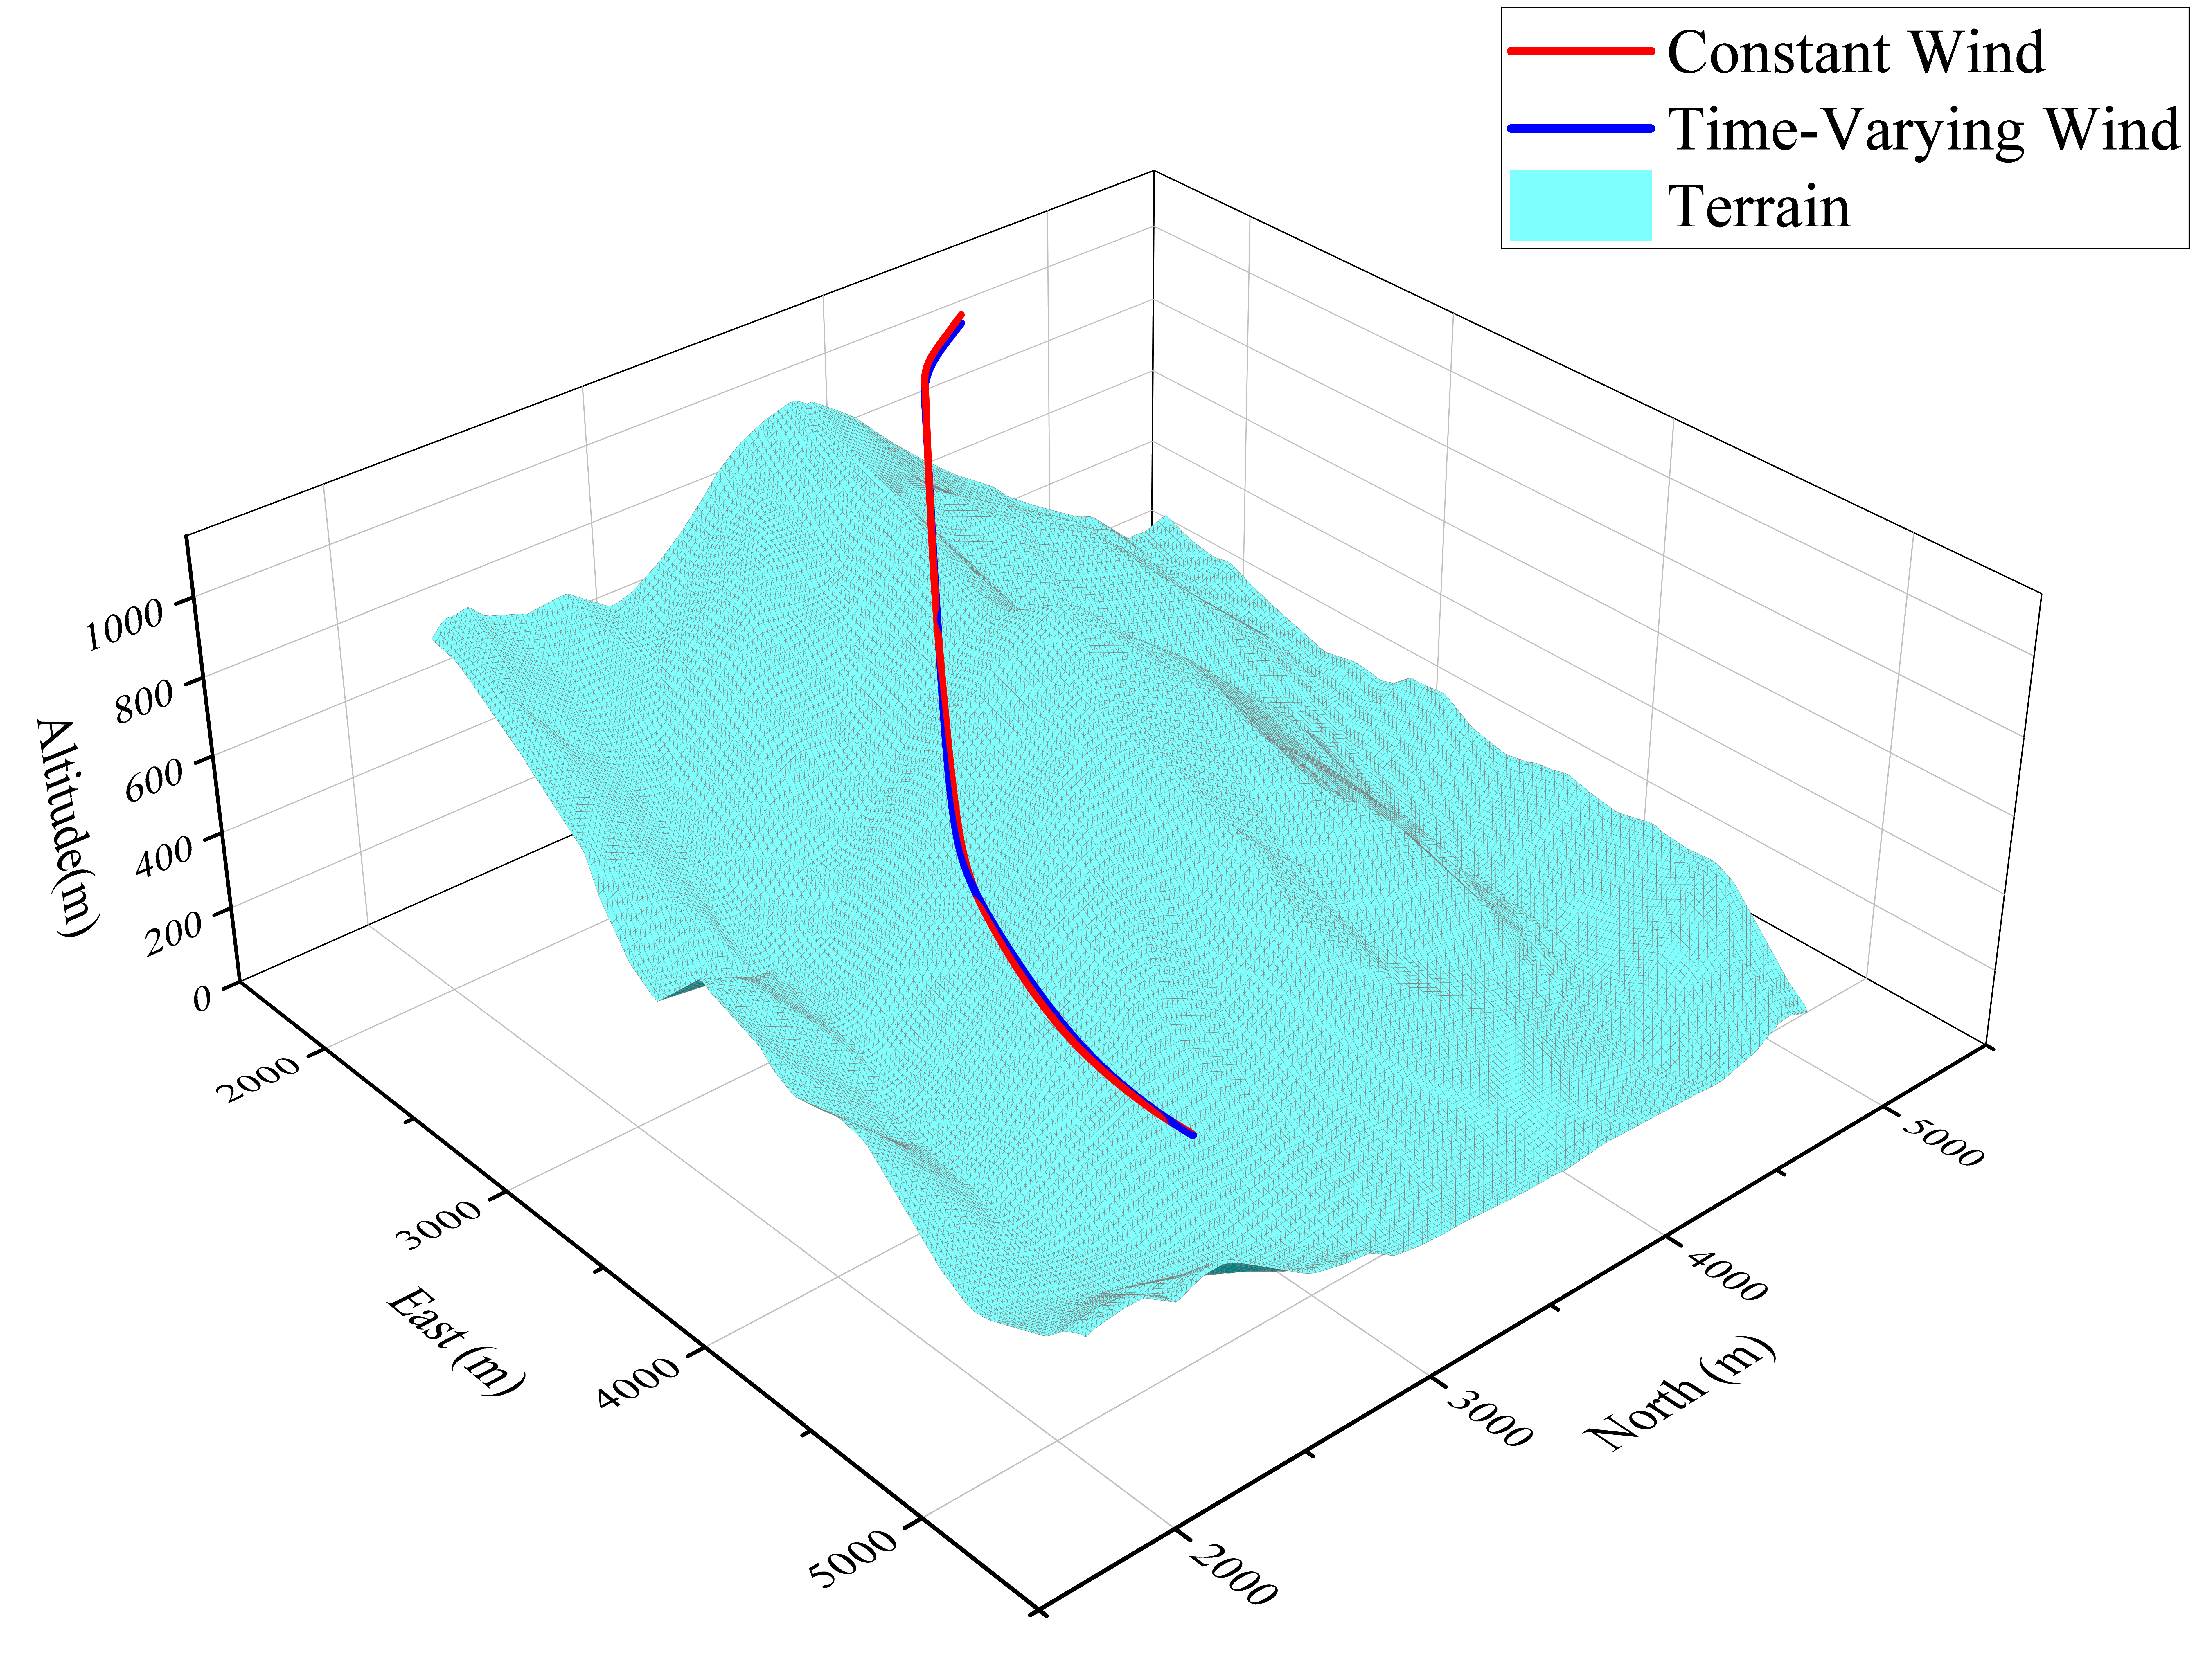
Figure 22.
Attitude result of fixed-wing aircraft simulation.

Figure 23.
Attitude control of fixed-wing aircraft simulation.
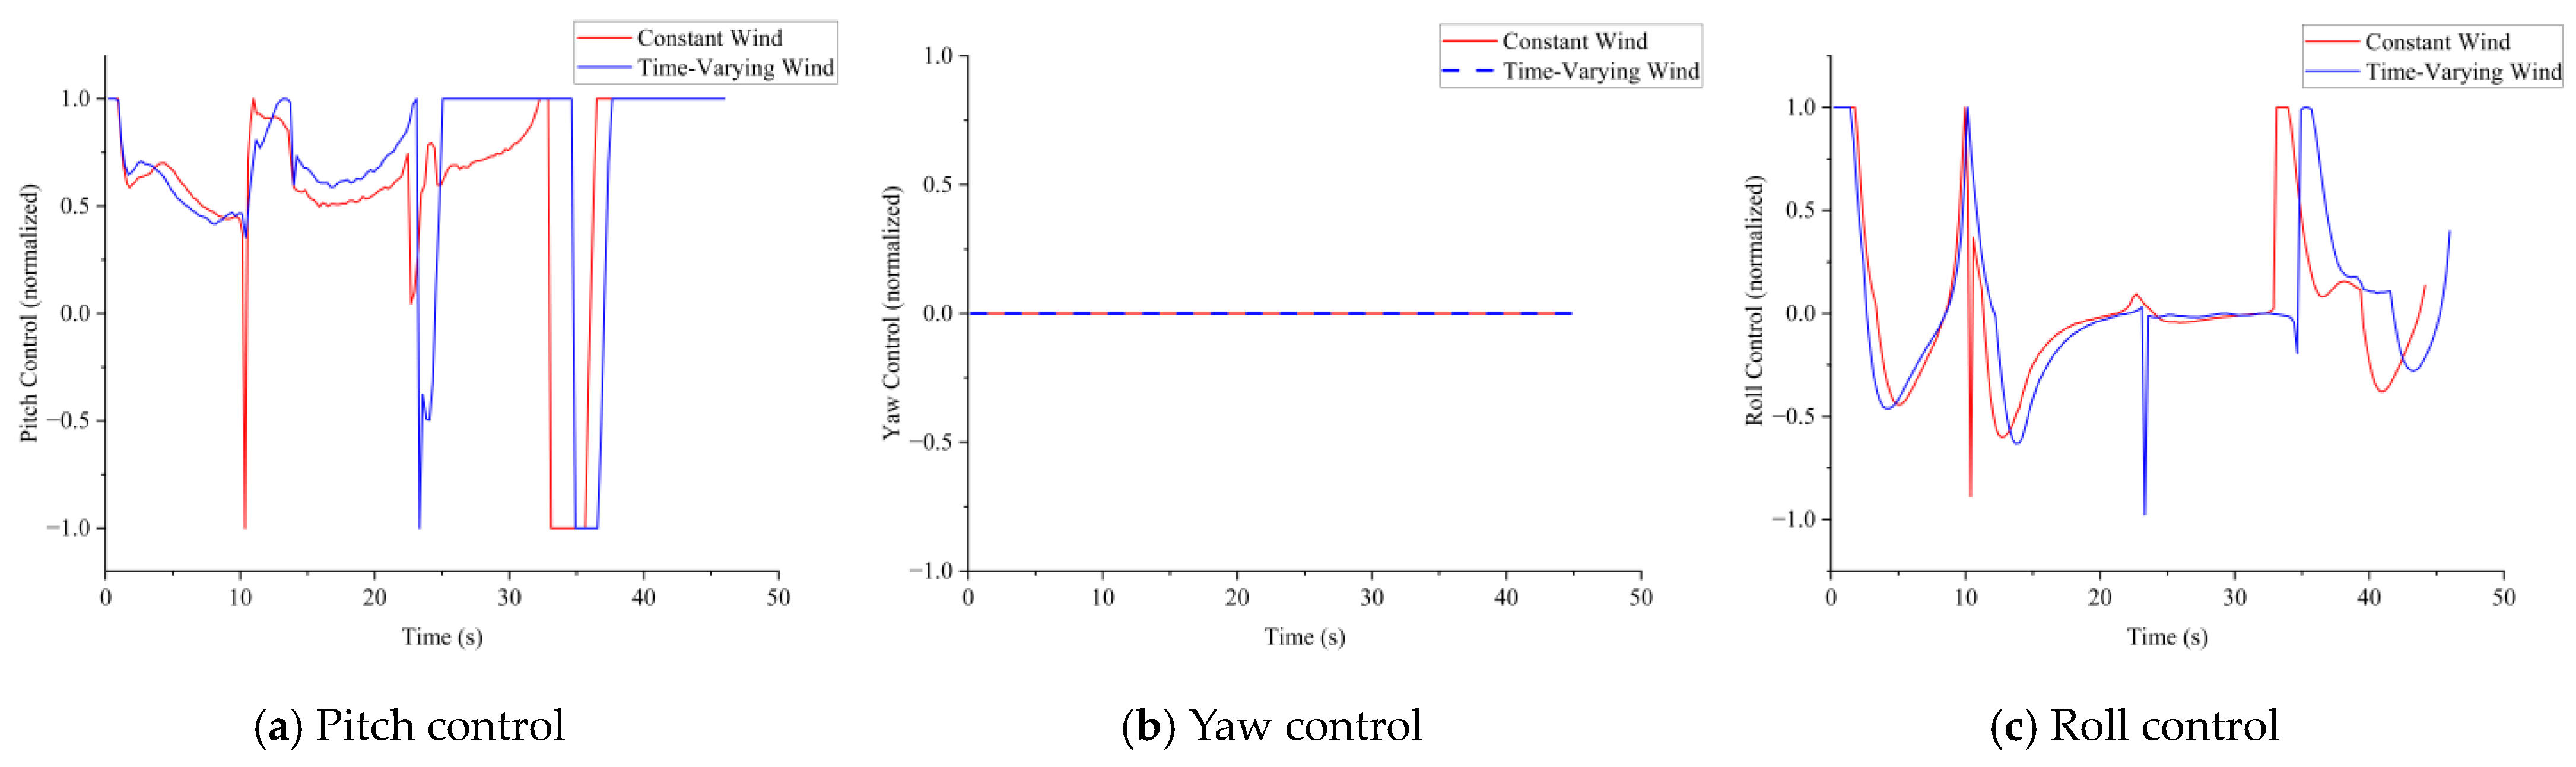
Figure 24.
Statistical data for various control quantities of fixed-wing aircraft. The blue symbols have the same meaning as the red symbols.
Figure 24.
Statistical data for various control quantities of fixed-wing aircraft. The blue symbols have the same meaning as the red symbols.
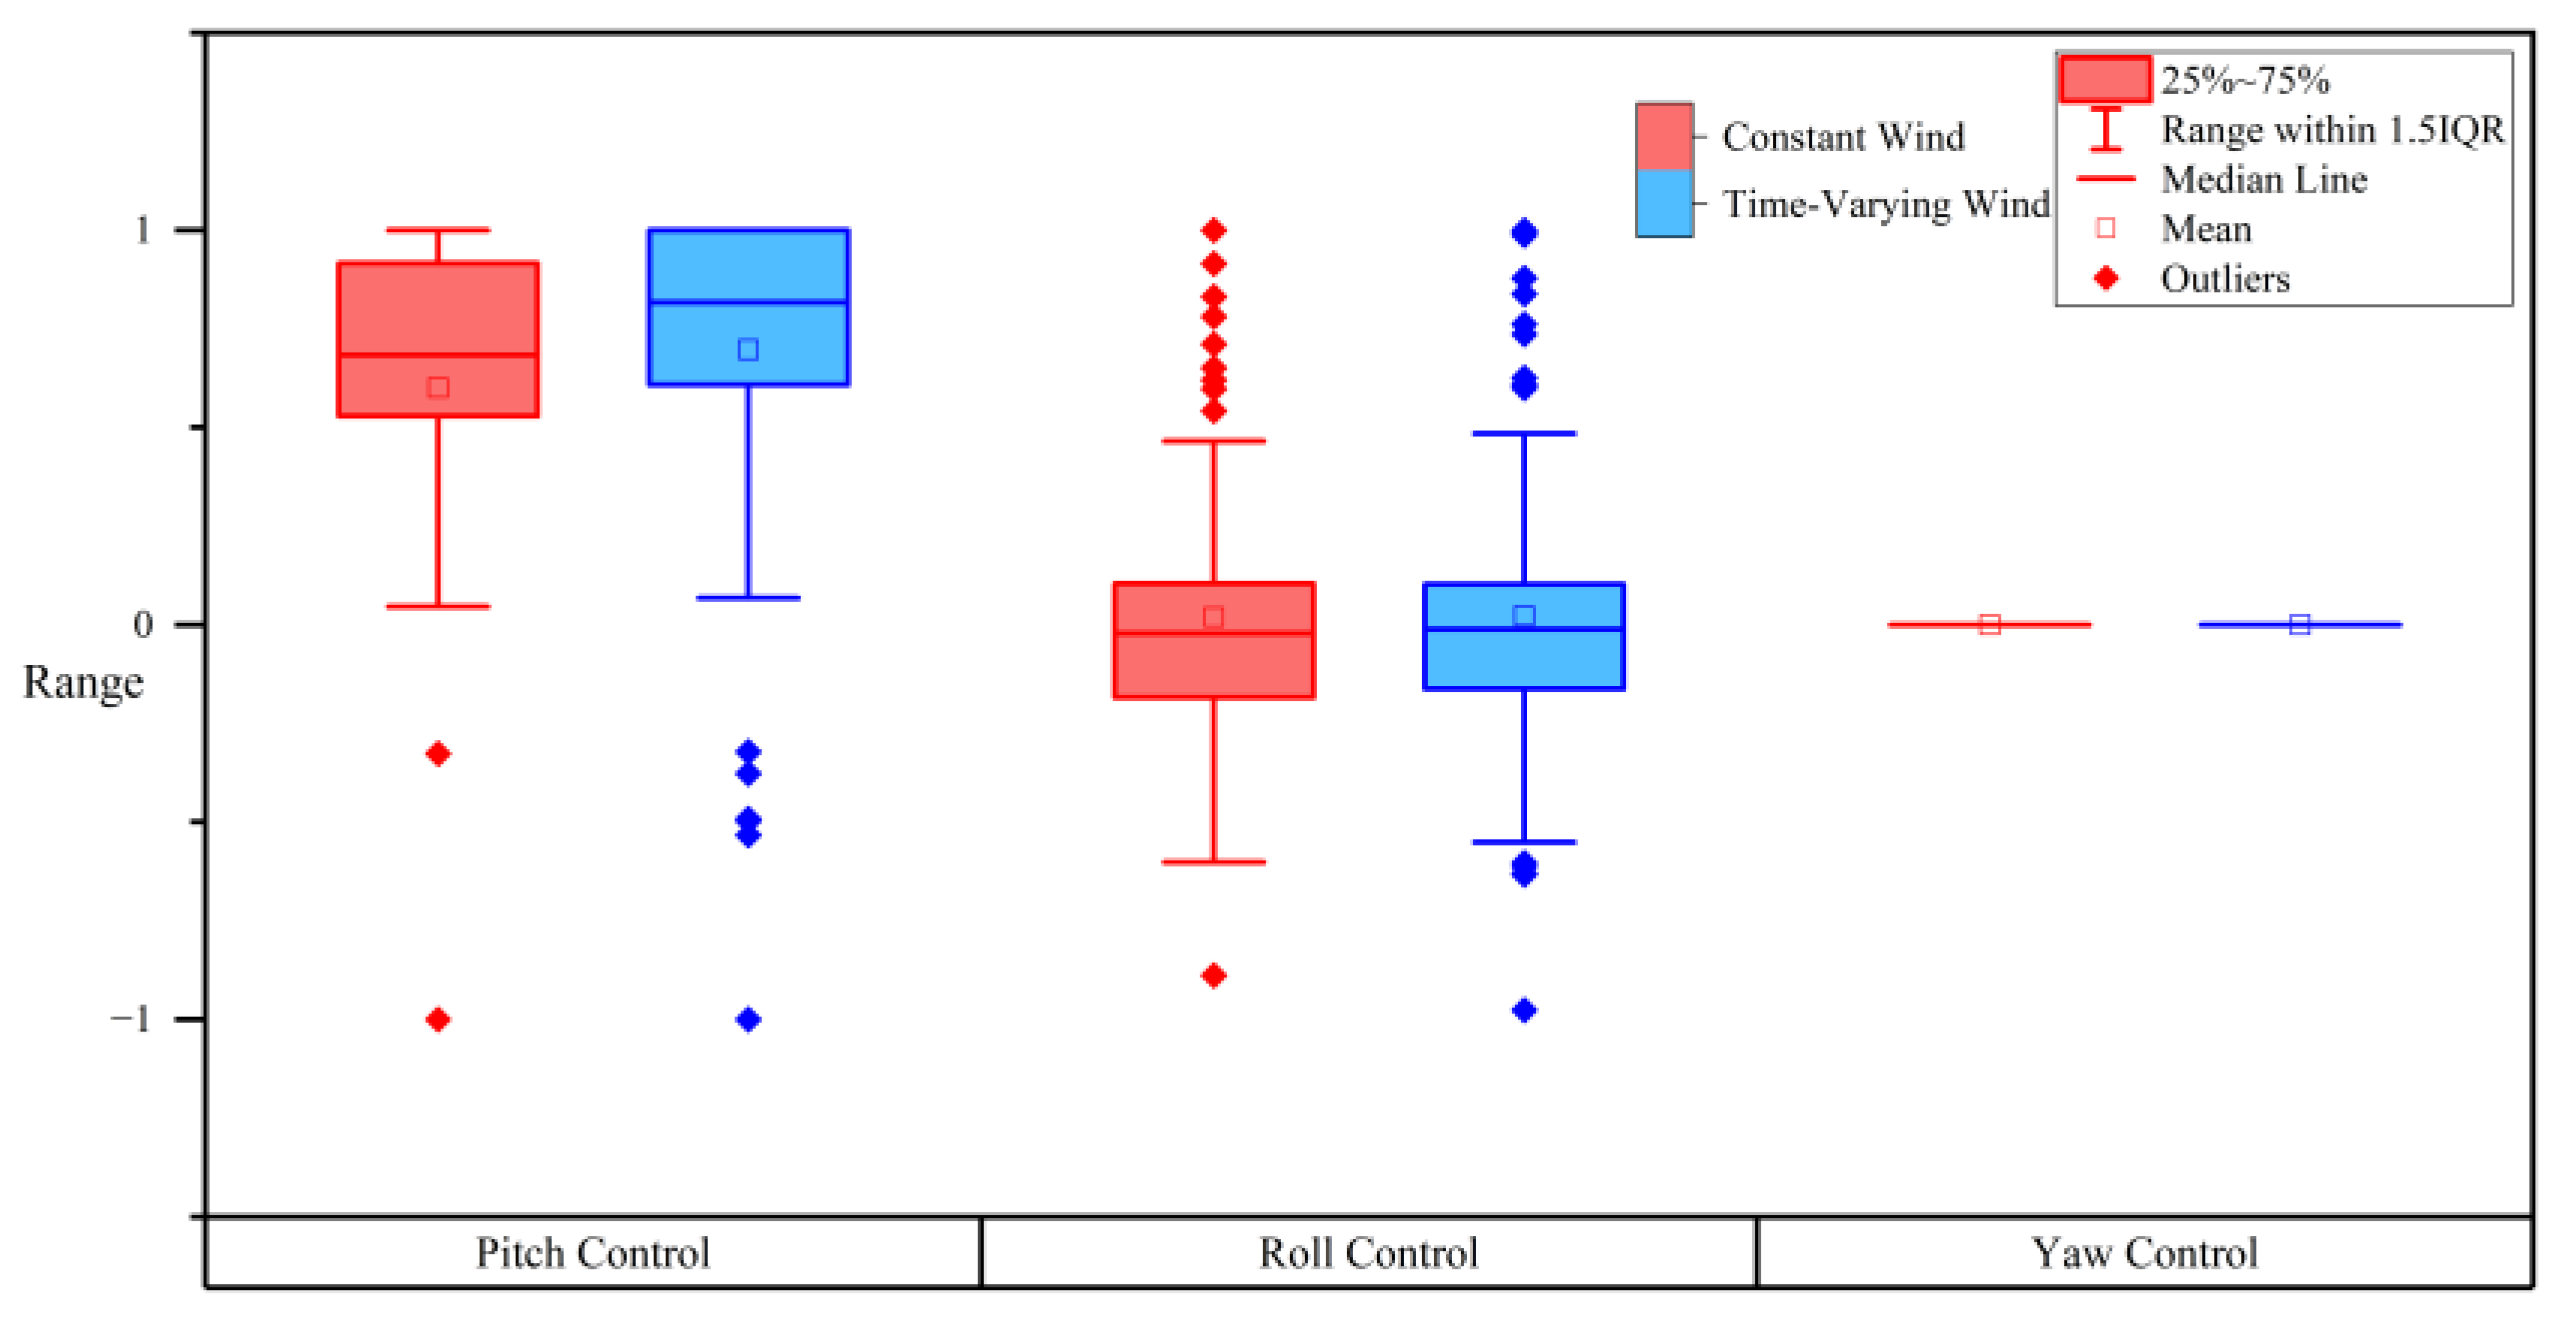
Figure 25.
The spread of forest fire at different times with water dropped for three times. The water dropping position is in the white symbol position, the red part indicates the burning area, and the black part indicates the burnt area.
Figure 25.
The spread of forest fire at different times with water dropped for three times. The water dropping position is in the white symbol position, the red part indicates the burning area, and the black part indicates the burnt area.
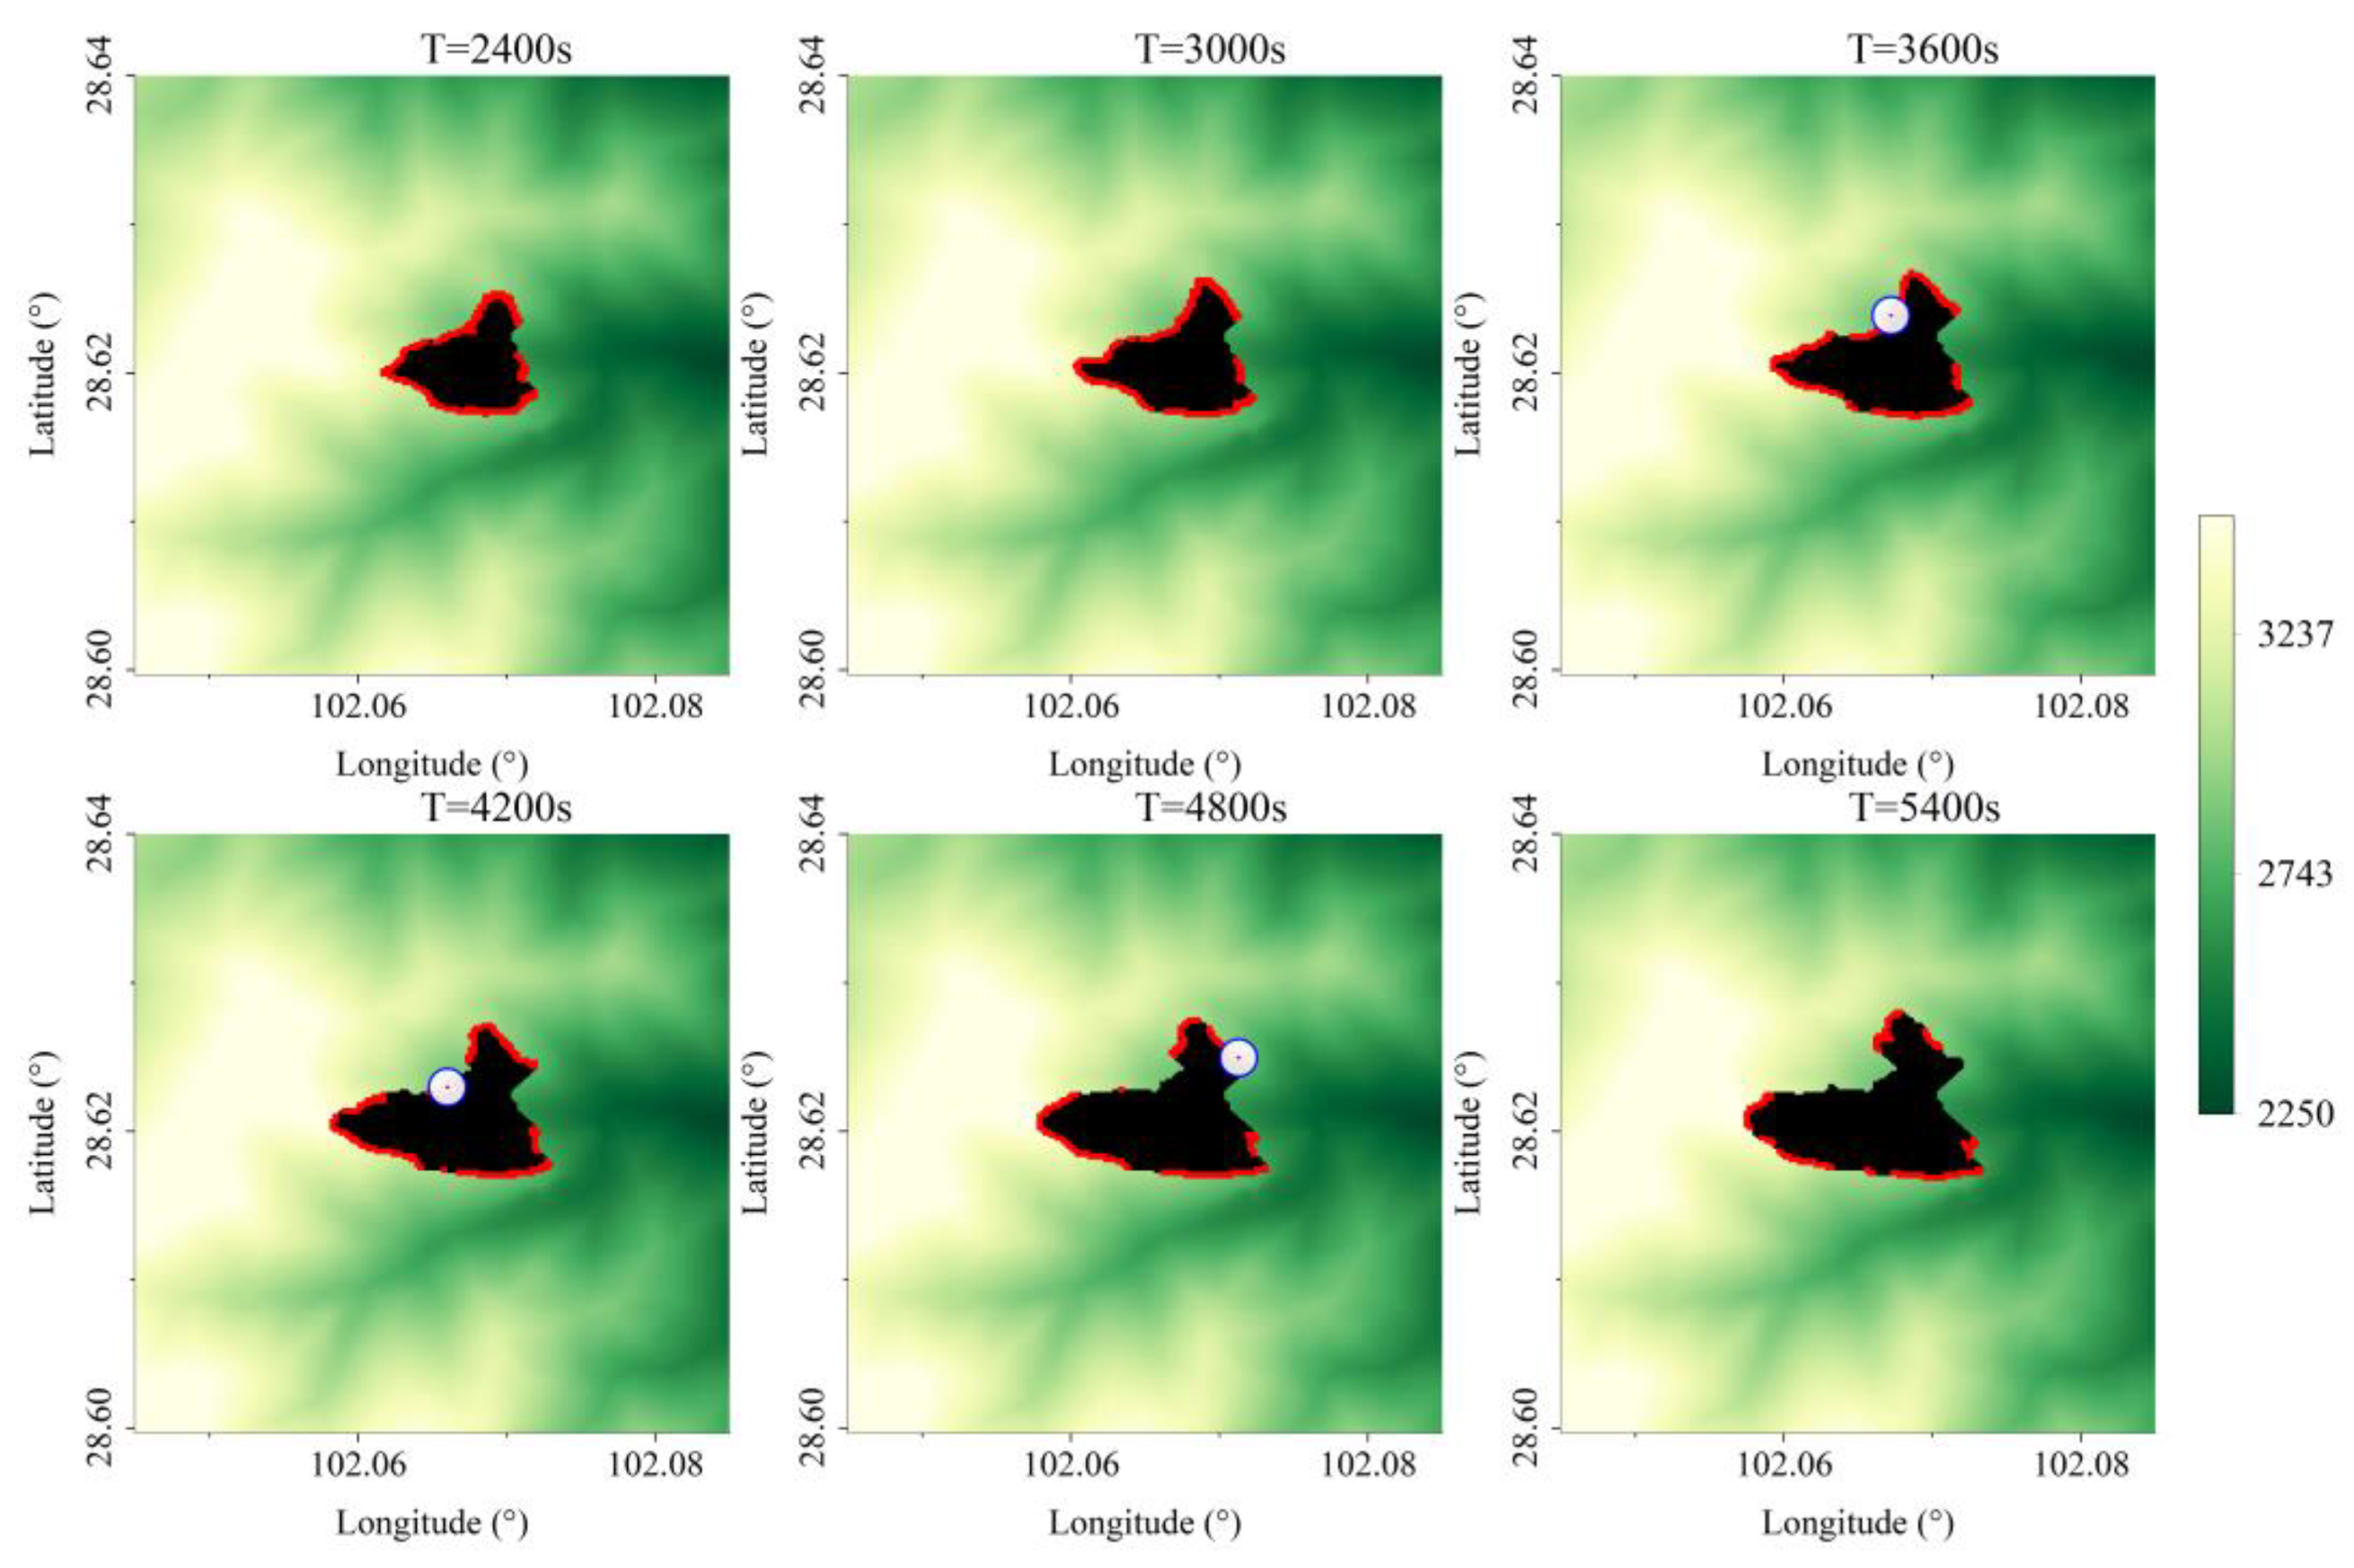
Figure 26.
The spread of forest fire at different times with no water dropped. The red part indicates the burning area, and the black part indicates the burnt area.
Figure 26.
The spread of forest fire at different times with no water dropped. The red part indicates the burning area, and the black part indicates the burnt area.

Figure 27.
Changes in the number of cells in the burning state.

Disclaimer/Publisher’s Note: The statements, opinions and data contained in all publications are solely those of the individual author(s) and contributor(s) and not of MDPI and/or the editor(s). MDPI and/or the editor(s) disclaim responsibility for any injury to people or property resulting from any ideas, methods, instructions or products referred to in the content. |
© 2024 by the authors. Licensee MDPI, Basel, Switzerland. This article is an open access article distributed under the terms and conditions of the Creative Commons Attribution (CC BY) license (https://creativecommons.org/licenses/by/4.0/).
Share and Cite
MDPI and ACS Style
Liu, H.; Liu, S.; Tian, Y. Flight Simulation of Fire-Fighting Aircraft Based on Multi-Factor Coupling Modeling of Forest Fire. Aerospace 2024, 11, 267. https://doi.org/10.3390/aerospace11040267
AMA Style
Liu H, Liu S, Tian Y. Flight Simulation of Fire-Fighting Aircraft Based on Multi-Factor Coupling Modeling of Forest Fire. Aerospace. 2024; 11(4):267. https://doi.org/10.3390/aerospace11040267
Chicago/Turabian StyleLiu, Hu, Siliang Liu, and Yongliang Tian. 2024. "Flight Simulation of Fire-Fighting Aircraft Based on Multi-Factor Coupling Modeling of Forest Fire" Aerospace 11, no. 4: 267. https://doi.org/10.3390/aerospace11040267
Note that from the first issue of 2016, this journal uses article numbers instead of page numbers. See further details here.