
Optimal Sequencing of Arrival Flights at Metroplex Airports: A Study on Shared Waypoints Based on Path Selection and Rolling Horizon Control

1
Flight Academy, Civil Aviation University of China, Tianjin 300300, China
2
College of Safety Science and Engineering, Civil Aviation University of China, Tianjin 300300, China
3
College of Air Traffic Management, Civil Aviation University of China, Tianjin 300300, China
*
Author to whom correspondence should be addressed.
Aerospace 2023, 10(10), 881; https://doi.org/10.3390/aerospace10100881
Submission received: 15 September 2023
/
Revised: 10 October 2023
/
Accepted: 11 October 2023
/
Published: 12 October 2023
(This article belongs to the Section Air Traffic and Transportation)
Abstract
:The civil aviation industry is experiencing significant growth in air traffic density within terminal areas, necessitating improved air traffic efficiency. In China’s pursuit of world-class airport clusters, operational complexities arise due to the co-location of these airports in the same terminal area airspace, resulting in lower operational efficiency. To mitigate congestion and flight delays, this study proposes an integrated model that considers multiple runways and route selections, accounting for actual route point restrictions. Utilizing actual operational data from Shanghai metroplex, the proposed model is validated. The study focuses on the airport metroplex system and presents a comprehensive mixed-integer programming (MIP) model for arrival sequencing, considering multiple airports, runways, and routes. The maximum landing efficiency is adopted as the objective function, optimizing arrival scheduling while considering time intervals, route selection, and landing constraints. The Multi-waypoint Rolling Horizon Control (MWRHC) algorithm is employed to tackle time-efficiency challenges, ensuring flight safety by continuous monitoring of flights in the terminal area. Comparative analysis reveals the algorithm’s superior optimization performance for single-runway airports compared to dual-runway airports. Overall, the proposed model and algorithm effectively improve the efficiency of multi-airport arrival scheduling in airport metroplex systems.
1. Introduction
1.1. Background
As the civil aviation industry continues to evolve steadily, the density of air traffic within terminal areas is rising markedly. With this increasing complexity in traffic flow, the quest for improved air traffic efficiency has become pivotal in enhancing the operational efficacy of terminal areas. China is vigorously advancing the construction of world-class airport clusters. However, the operation of these airport clusters, which are also known as “airport metroplex”, is coupled and complex, largely due to their co-location within the same terminal area airspace [1,2,3]. The mutual influence among these airports and their shared use of airspace resources inevitably lead to lower operational efficiency [4,5,6,7].
At airport metroplex, the close proximity of various airports often results in multiple flights having the same trajectory towards their respective destinations, essentially sharing the same waypoints. Currently, each airport tends to manage its flight schedules independently, leading to congestion at these shared waypoints. These shared waypoints are key nodes, which serve a crucial role in connecting inbound and outbound traffic. Research conducted by frontline units indicates that optimizing and coordinating traffic flow at these shared waypoints within a group of metroplex airports can significantly reduce operational congestion and flight delays.
1.2. Literature Review
In recent decades, several studies on the optimization problem of inbound flight sequencing have been conducted, with a primary focus on individual airports. In 2010, Mesgarpour et al. [8] developed a model that fulfills the requirements of air traffic controllers, airports, airlines, and governments by minimizing average delay, maximizing runway throughput, and reducing fuel costs as objectives, considering the constraints of wake vortex safety spacing, arrival time windows, and airline priority levels. In 2013, Hancerliogullari et al. [9] proposed a new mixed-integer programming model for flight scheduling, which aimed at minimizing total weighted delay time, and in addition to considering wake vortex spacing and arrival time window constraints, it also incorporated runway load balancing constraints. In 2014, Sölveling et al. [10] proposed a stochastic branch-and-bound-based algorithm to develop the optimal or near-optimal solution of stochastic airport runway scheduling problems. In the same year, Ma Yuanyuan et al. [11] established a collaborative scheduling model for approach flights in multi-airport terminal areas, taking into account such interval constraints as control handover, wake flow and multi-runway operation. Wang Lili et al. [12] used the double-coding genetic algorithm to establish a parallel runway approach and departure flight sequencing model including cargo flights, effectively reducing flight delays.
In order to schedule approach flights more efficiently, it is necessary to consider the route selection and the arrangement of restricted airspace resources within the airport metroplex. Sidiropoulos et al. [13] proposed a sorting optimization strategy for airport metroplex inbound and outbound flights in 2015. Firstly, inbound and outbound flights were clustered to obtain dynamic paths according to their temporal and spatial distribution; secondly, dynamic paths were prioritized; finally, dynamic path flight sorting based on optional waypoints was realized on the premise of ensuring flight intervals. In 2019, Zhang Zhaoning et al. employed a multi-objective planning approach to devise an airport group flow allocation strategy centered on capacity flow matching [14]. This strategy was formulated to address the challenges associated with airport group flight delays and air traffic congestion. In 2020, Yin et al. [15] proposed a runway allocation and ranking method focusing on the utilization of multiple airports and multiple runways in an airport group based on the impact of runway configurations of airports in an airport group on traffic flow management. Liu Jixin et al. [16] designed an elite retention genetic algorithm and a fast non-dominated sorting genetic algorithm with elite strategy, and established a collaborative approach flight sorting model based on air traffic density. In 2021, aiming at the common waypoints of multi-airport coupled operation, Wang Lili et al. [17] introduced a penalty factor and employed the minimum total delay time cost as the objective function to establish a flight optimization ranking model based on the sliding time window algorithm and particle swarm optimization algorithm. In 2022, Wei Ming et al. proposed an optimization model for flight entry and departure scheduling, considering aspects such as runway invasion and potential risk level, thereby broadening the scope of application scenarios for flight scheduling models [18,19].
Most of the established models prioritize minimizing total delay cost or minimizing delay time as their objective function, taking into account runway allocation models constrained by wake vortex safety intervals and arrival time windows. Models addressing route selection and specific route point restrictions are relatively scarce, and studies considering current route selection and specific route point restrictions often fail to fully reflect the reality of terminal areas. In terms of scheduling methods, the first come, first served (FCFS) principle is widely adopted; for runway assignment, proximity in the air is typically prioritized. While such methods are easy to operate, they can lead to wastage of airspace resources and imbalance in runway resource utilization when the airspace is crowded, causing flight delays.
1.3. Contribution of the Research
To address these issues, this paper proposes an integrated model that considers multiple runways and multiple route selections, and accounts for actual route point restrictions. As for model solution, a targeted rolling time domain control solution algorithm is put forward. For practical validation, actual operational data from multiple terminal areas of Shanghai metroplex are used.
2. Methodology
2.1. Problem Description
The difference between a metroplex and a single airport is mainly due to the coupling and complexity of its operation. The operation of each airport in a metropolitan region is highly correlated, and the allocation of time and space resources cannot be considered independently, but should be considered from the perspective of overall operation. The shared waypoint is the public resource of the metroplex airspace, which has a certain impact on the entire system of the metroplex, and is closely connected with the terminal area and other airspace. Improving the operation efficiency of the shared waypoint is the key to enhance the global resources of the metroplex system. Therefore, this paper studies the scheduling of flights through shared waypoints of airport groups. The planned crossing time of flights taking off from each airport is known, and the traffic flow of shared waypoints is effectively optimized and allocated to obtain a reasonable crossing order and crossing time.
2.2. Modeling
2.2.1. Parameters
2.2.2. Decision Variables
To make effective decisions in our model, certain decision variables are incorporated. Table 3 provides a comprehensive overview of these decision variables and their definitions.
2.2.3. Objective Function
To enhance efficiency while upholding safety standards, the objective function is formulated from the perspective of air traffic flow management. This function seeks to minimize the last landing flight time within the optimized time period, thereby maximizing the operational efficiency of each airport runway.
Objective:
2.2.4. Constraint Conditions
Assuming that flight i corresponds to its target airport a. The constraint conditions, which are integrally based on the parameters and decision variables delineated in Table 1, Table 2 and Table 3, are provided in Table 4.
Constraints (1)–(3): Each flight is assigned one unique route and lands on only one runway. This ensures that there are no conflicts in the landing sequence and that every flight has a clear and unique path to follow. This fundamental constraint is rooted in the premise of ensuring flight safety and operational efficiency, as discussed by Faye [20].
Constraint (4): The runway is always the last waypoint on a flight’s route. The time of arrival at this waypoint signifies the flight’s actual landing time. This constraint guarantees a seamless and logical progression of a flight’s path, ensuring that once a flight reaches its final waypoint, it is indeed on the ground, as derived from Pawelek et al. [21].
Constraint (5): This constraint ensures the uniqueness of the order between two aircrafts. Specifically, it dictates that if flight i precedes flight j, then flight i cannot subsequently be found trailing behind flight j.
Constraint (6): This represents time window constraints, ensuring flights pass through each waypoint within a specific timeframe. By enforcing this, the model ensures that flights adhere to their scheduled flight paths and timings, reducing the potential for air traffic congestion or conflicts. Time window constraints, particularly in dense airspaces, are essential to maintaining a steady flow of traffic [21,22].
Constraint (7): This constraint guarantees that the time duration for a flight to traverse between two consecutive waypoints is no less than the minimum flying duration established for that segment. Essentially, it ensures that flights do not pass through these waypoints faster than safety and operational guidelines permit.
Constraint (8): Flights arriving at the same waypoint (excluding runways) must meet the radar control safety interval. This constraint ensures that flights are adequately spaced out when they converge at common waypoints, reducing the risk of conflicts and ensuring smooth transitions from one waypoint to the next.
Constraint (9): This focuses on the actual landing times of two flights on the runways of the same airport. The time intervals between these landings must meet wake turbulence separation criteria. Wake turbulence from a leading aircraft can be hazardous for the trailing one, especially during landing phases. Adhering to these intervals, as derived from prior research [21], ensures safe landings by preventing potential wake turbulence incidents.
Constraints (10)–(12): These constraints enforce logical consistency regarding the order in which flights pass through waypoints. If two flights traverse a particular waypoint, their order must be unique, preventing ambiguity in sequencing and reducing the possibility of conflicts at these waypoints.
Constraints (13) and (14): These introduce the constrained position shifting (CPS) constraint, stating that a plane cannot shift by more than K positions from its original first come, first served (FCFS) position δaif. This constraint ensures that while optimizing flight sequences, the solution remains relatively close to the initial order to avoid drastic changes that might overwhelm air traffic controllers or lead to logistical challenges.
2.3. Algorithm
For the flight sequencing of multi-shared waypoints in a metropolitan region, this paper uses a Multi-waypoint Rolling Horizon Control (MWRHC) algorithm based on RHC [23], which is presented in Figure 1. The rolling horizon control (RHC) strategy divides the entire planning horizon into a series of overlapping windows. Each window spans a duration of 3T, and with each iteration, the window advances by a duration of T. As in the example shown in Figure 2, there are 5 enter points (EPs), the start waypoints of the route into the metropolitan region; 12 middle points (MPs), and 6 final point (FPs)
Initialization Phase: At the start (T0), the initial window covers the interval [T0, T0 + 3T]. During this phase, optimization is performed considering all flights expected to pass the enter points (EPs) within this window, as presented in Figure 2a.
Rolling Phase: As time progresses, the window slides forward by T. For instance, at time T0 + T, the window covers the interval [T0 + T, T0 + 4T]. The optimization process is repeated considering updated flight data and schedules.
Data Update: With each window slide, the flight optimization queue is updated. This involves removing flights that were already simulated as having landed in the previous window, and incorporating new flights expected to pass the EP in the current window, as illustrated in Figure 2b. Concurrently, the current waypoint of each flight and the estimated time of passing through the previous waypoint are updated to reflect real-time adjustments and deviations.
The pseudo-code of the above MWRHC algorithm is listed as Algorithm 1.
| Algorithm 1. Pseudo-code for MWRHC |
| Step 1: Initialize variables and data structures, h = 1 Step 2: Calculate the expected arrival time window for each flight to reach each waypoint on the available route selected while h < H: Step 3: Initialize the optimization queue and variable set for the optimization time domain h Create empty list F_h[h] Step 4: Add flights with expected passing EP time within [T0, T0 + NT] to the opti mization queue F_h for each flight_id, flight_data in F: if flight_data[‘starttime’] is in range(T0, T0 + NT): Append flight_id to F_h[h] Step 5: Solve the mixed-integer programming (MIP) model and update the selected routes and flight status subProblem = create_subProblem(F_h_dict, routes, airport_runway) subProblem.optimize() update_selected_routes(subProblem, selected_routes) update_flight_status(F_h_dict, selected_routes) Step 6: Check the flight status of the flights in F_h (landed or not) and if the flight has not landed before T0 + T, update the entry point and output the actual arrival time before the point update_waypoint_information(F_h_dict, selected_routes) Step 7: Update T0 and h T0 = T0 + T h = h + 1 Step 8: Calculate expected arrival time window for each waypoint Step 9: Update the optimization queue F_h Step 10: Merge the current F_h_dict with the previous F_h_dict |
3. Experimentation
3.1. Data Description
The Yangtze River Delta Airport Metroplex, which is also called Airport Cluster, is one of the four world-class airport clusters in China. The major airport identifier and corresponding names are listed in Table 5. The main waypoints and waypoint numbers of the arrival routes of the six airports in the airport metroplex are shown in Figure 3. To facilitate empirical research, this study presents a comprehensive compilation of optional arrival routes and landing runways, each assigned a unique numerical identifier. These encompass the entry waypoint within the metropolitan region, the waypoints of the arrival, and the landing runways, collectively referred to as “arrival routes”. For a detailed representation of the specific flight routes and the available routes for each airport based on real flight route information for 2019, please refer to Table 6 and Table 7.
This study utilized flight data from six prominent airports, NKG, SHA, PVG, WUX, HGH and NGB, in the Yangtze River Delta region. The dataset encompassed a two-hour period on a high-traffic day, specifically from 17:00:00 to 19:00:00, comprising a total of 165 flights. The model input data are the starting waypoint (EP) of all arrival flights into the airport metroplex area, and the corresponding entry time. All alternative arrival routes, segments and waypoints are known, along with the minimum flying duration for each segment.
3.2. Model Verification
In order to simplify the simulation model, since the routes of departing flights and arriving flights rarely overlap, only the sequencing of arrival flights is considered. In this experimental study, the optimization of the solution was conducted using Gurobi 10.0 solver and Python 3.9 interface programming, implemented on a 2.4 GHz i9-12900 CPU. The optimization process involved setting the MPS to five, considering the controller workload, and T0 to zero. Notably, when encountering a shared waypoint, with the runway being considered as a specialized waypoint, specific safety intervals were established: Tij was 60 s for radar-guided guidance, Sij was 108 s for landing on the same runway, and sij was 48 s for landing on adjacent runways, according to the research results on the safety interval of parallel runway [23]. The rolling time domain algorithm’s iterative process for the initial and final time domain datasets lacked the presence of data intervals both preceding and succeeding the time domain, which consequently resulted in disparities between the calculated outcomes and actual data. Therefore, for comparative purposes, our analysis was confined to data processing results within the second to penultimate time domains.
The solution results of actual, FCFS and the WMRHC model in this paper were compared, as shown in Table 8. Detailed insights into the chosen routes and landing sequences can be observed in Figure 4.
In Table 8, “Flight No.”, “Destination Airport”, “Passing time of EP” and “EP No.” are the inputs, “Scheduled landing time” is the landing time in flight schedule, “Actual landing time” is the landing time of actual time, “FCFS landing time” and “MWRC landing time” are simulated results according to the corresponding algorithm. “Landing Runway” and “Route No.” are the results obtained during the calculation of MWRHC, since the flight entering through an EP could have more than one route or runway to choose from.
To illustrate the data more effectively, we used the dataset from Nanjing Airport as a reference. Figure 5 offers a graphical representation comparing the FCFS-optimized landing times to those optimized using the MWRHC algorithm for flights at Nanjing Airport. The x-axis denotes the FCFS optimized landing durations in seconds, while the y-axis showcases the MWRHC optimized landing durations, also measured in seconds.
Unique markers indicate the actual landing times: square markers for FCFS and circular markers for MWRHC. Linear fits for each set of landing times are depicted—the red line for FCFS and the purple line for MWRHC.
The graph clearly reveals that MWRHC-optimized landing times frequently register below their FCFS counterparts. This suggests the superior efficiency of the MWRHC algorithm in trimming down overall landing durations when compared to the conventional FCFS approach.
Further, the curve for the MWRHC optimization consistently lies beneath the FCFS curve, emphasizing an improvement in average landing durations. The result reinforces the effectiveness of the MWRHC algorithm in both reducing landing times and refining the landing sequence of aircraft, in contrast to the prevailing real-world methods.
As the optimization algorithm fine-tunes the landing order of certain flights, a comparison of the optimization results solely based on the last landing flights within the time domain is inadequate. Consequently, to assess and compare the efficiency of the two algorithms, we introduced the concept of “saved flight time per flight”, which takes into account the overall time required for the optimization process. Actual landing time of flight i is represented by the symbol LTiactual, and the optimized landing time by FCFS or MWRHC algorithm are denoted as LTiFCFS and LTiMWRHC, respectively. The “saved flight time per flight” of airport a can be expressed as ca, which can be calculated by for airport a.
Figure 6 presents the optimization time cost rate, c, of the six airports within the airport group following the application of two algorithms. The unit of measurement for c is seconds. The depicted values represent the average optimization time across multiple trials for each airport. A direct correlation exists between the magnitude of c and the efficiency of the optimization algorithm: higher c values suggest superior performance. Notably, the optimization effect of the MWRHC algorithm proves to be more effective in single-runway airports (WUX, HGH, NGB, NKG and SHA) compared to a dual-runway airport like PVG. For a detailed breakdown of the data represented in Figure 5, please refer to Table 8.
4. Conclusions
This study focuses on the airport metroplex system and addresses the arrival sequencing problem involving multiple airports, multiple runways, and multiple routes within this system. To this end, a comprehensive MIP model is formulated, which integrates the various elements of the arrival optimization. By adopting the maximum landing efficiency as the objective function, the approach optimization control for multiple airports and runways is achieved while taking into account constraints such as crossing time intervals, route selection, and landing intervals.
The MWRHC algorithm is employed to tackle time-efficiency challenges in the multi-airport and multi-runway arrival flight scheduling model within an airport group. Notably, this algorithm incorporates a crucial safety feature by continuously monitoring the presence of flights within the terminal area, thus ensuring flight safety is maintained throughout the entire optimization process.
Utilizing actual flight data from a busy day in the Yangtze River Delta airport metroplex, the proposed model is employed to optimize the arrival flight sequencing. The optimization results demonstrate an improvement compared to the traditional FCFS algorithm, thus validating the effectiveness and efficacy of the proposed model algorithm.
The comparative analysis of the optimization outcomes for the six airports within the airport group indicates that the algorithm yields more favorable results in terms of optimization for single-runway airports compared to those with dual runways.
This research contributes to the upgrading of traditional decision support tools to provide a suggested sequence that accommodates the traffic condition in the airport metroplex area. In future work, the authors will extend this method to combined arrival and departure scheduling, multi-runway scheduling, and metroplex scenarios.
Author Contributions
Conceptualization, F.J. and Z.Z.; methodology, Z.Z.; data curation, F.J.; writing—original draft preparation, F.J.; writing—review and editing, F.J. and Z.Z. All authors have read and agreed to the published version of the manuscript.
Funding
This research was funded by the Key Projects of the Civil Aviation Joint Fund of the National Natural Science Foundation of China (Grant No. 2233209), as well as the Fundamental Research Funds for the Central Universities (Grant No. 3122022053).
Data Availability Statement
The data used to support the findings of this study are available from the corresponding author upon request.
Conflicts of Interest
The authors declare no conflict of interest.
References
- FAA. Metroplex. Available online: https://www.faa.gov/air_traffic/nas/metroplex (accessed on 1 September 2023).
- Donohue, G.; Hoffman, K.; Sherry, L.; Ferguson, J.; Qadar Kara, A. Optimizing Air Transportation Service to Metroplex Airports: Part 1 Analysis of Historical Data; NASA: Washington, DC, USA, 2010. [Google Scholar]
- Donohue, G.; Hoffman, K.; Sherry, L.; Ferguson, J.; Qadar Kara, A. Optimizing Air Transportation Service to Metroplex Airports: Part 2 Analysis Using the Airline Schedule Optimization Model (ASOM); NASA: Washington, DC, USA, 2010. [Google Scholar]
- Ramanujam, V.; Balakrishnan, H. Estimation of arrival-departure capacity tradeoffs in multi-airport systems. In Proceedings of the Joint 48th IEEE Conference on Decision and Control and 28th Chinese Control Conference, Shanghai, China, 16–18 December 2009. [Google Scholar]
- DeLaurentis, D.A.; Ayyalasomayajula, S. Analysis of Dependencies and Impacts of Metroplex Operations; NASA: Washington, DC, USA, 2010. [Google Scholar]
- Donaldson, A.; Hansman, R.J. Capacity Improvement Potential for the New York Metroplex System. In Proceedings of the 10th AIAA Aviation Technology, Integration, and Operations (ATIO) Conference, Worth, TX, USA, 13–15 September 2010. [Google Scholar]
- Jiang, F.; Zhang, Z.; Dai, X. Ground-Air Traffic Congestion Propagation Model Based on Hierarchical Control Interdependent Network. J. Adv. Transp. 2023, 2023, 4602148:1–4602148:22. [Google Scholar] [CrossRef]
- Mesgarpour, M.; Potts, C.N.; Bennell, J.A. Models for Aircraft Landing Optimization. In Proceedings of the 4th International Conference on Research in Air Transportation (ICRAT 2010), Budapest, Hungary, 1–4 June 2010. [Google Scholar]
- Hancerliogullari, G.; Rabadi, G.; Al-Salem, A.H.; Kharbeche, M. Greedy algorithms and metaheuristics for a multiple runway combined arrival-departure aircraft sequencing problem. J. Air Transp. Manag. 2013, 32, 39–48. [Google Scholar] [CrossRef]
- Sölveling, G.; Clarke, J.-P. Scheduling of airport runway operations using stochastic branch and bound methods. Transp. Res. Part C Emerg. Technol. 2014, 45, 119–137. [Google Scholar] [CrossRef]
- Ma, Y.; Hu, M.; Zhang, H.; Yin, J.N.; Wu, F. Optimized method for collaborative arrival sequencing and scheduling in metroplex terminal area. Acta Aeronaut. Astronaut. Sin. 2015, 36, 2279–2290. [Google Scholar]
- Wang, L.; Gu, Q. Arrival and Departing Aircraft-sequencing Optimization under the Special Circumstances. J. Transp. Systms Eng. Inf. Technol. 2013, 14, 102–107. [Google Scholar]
- Sidiropoulos, S.; Majumdar, A.; Han, K.; Schuster, W.; Ochieng, W.Y. A framework for the classification and prioritization of arrival and departure routes in Multi-Airport Systems Terminal Manoeuvring Areas. In Proceedings of the 15th AIAA Aviation Technology, Integration, and Operations Conference, Dallas, TX, USA, 22–26 June 2015. [Google Scholar]
- Zhang, Z.; Wang, D. Research on flow allocation strategy based on capacity matching for airport group. Mod. Electron. Tech. 2019, 42, 113–116+120. [Google Scholar]
- Yin, J.; Ma, Y.; Tian, W.; Chen, D.; Hu, Y.; Ochieng, W. Impact Analysis of Demand Management on Runway Configuration in Metroplex Airports. IEEE Access 2020, 8, 66189–66212. [Google Scholar] [CrossRef]
- Liu, J.; Jiang, H.; Dong, X.; Lan, S.; Wang, H. Dynamic collaborative sequencing method for arrival flights based on air traffic density. Acta Aeronaut. Astronaut. Sin. 2020, 41, 323717. [Google Scholar]
- Wang, L.; Lin, Y. Aircraft Sequencing Modeling and Algorithm for Shared Waypoints in Airport Group. J. Transp. Inf. Saf. 2021, 39, 93–99+136. [Google Scholar]
- Sun, B.; Wei, M. An Optimization Model for Inbound and Outbound Flight Scheduling with Consideration of Runway Incursions. Ind. Eng. Manag. 2022, 27, 16–21. [Google Scholar]
- Wei, M.; Wu, W.; Sun, B. An Optimization Model for Inbound and Outbound Flight Scheduling with Consideration of Potential Risk Levels and Priorities. Ind. Eng. Manag. 2022, 27, 40–45. [Google Scholar]
- Faye, A. Solving the Aircraft Landing Problem with time discretization approach. Eur. J. Oper. Res. 2015, 242, 1028–1038. [Google Scholar] [CrossRef]
- Pawełek, A.; Lichota, P.; Dalmau, R.; Prats, X. Fuel-Efficient Trajectories Traffic Synchronization. J. Aircr. 2019, 56, 481–492. [Google Scholar] [CrossRef]
- Pawełek, A.; Lichota, P. Arrival air traffic separations assessment using Maximum Likelihood Estimation and Fisher Information Matrix. In Proceedings of the 2019 20th International Carpathian Control Conference (ICCC), Kraków, Poland, 26–29 May 2019; pp. 1–6. [Google Scholar]
- Le, M.; Wu, X.; Hu, Y. Arrival Flights Optimal Sequencing Based on Path Selection and Rolling Horizon Control. J. Beijing Univ. Aeronaut. Astronaut. 2022, 2022, 1–11. [Google Scholar] [CrossRef]
Figure 1.
Window processing in rolling horizon framework when sliding window size is 3T and step size is T.
Figure 1.
Window processing in rolling horizon framework when sliding window size is 3T and step size is T.

Figure 2.
Schematic diagram of the 1st (a) and 2nd (b) horizons of MWRHC.

Figure 3.
Distribution of Major Waypoints (M01–M17) along Arrival Routes in the Yangtze River Delta Airport Metroplex Region (the area surrounded by dot lines).
Figure 3.
Distribution of Major Waypoints (M01–M17) along Arrival Routes in the Yangtze River Delta Airport Metroplex Region (the area surrounded by dot lines).

Figure 4.
Comparison of flight landing sequence and landing time.

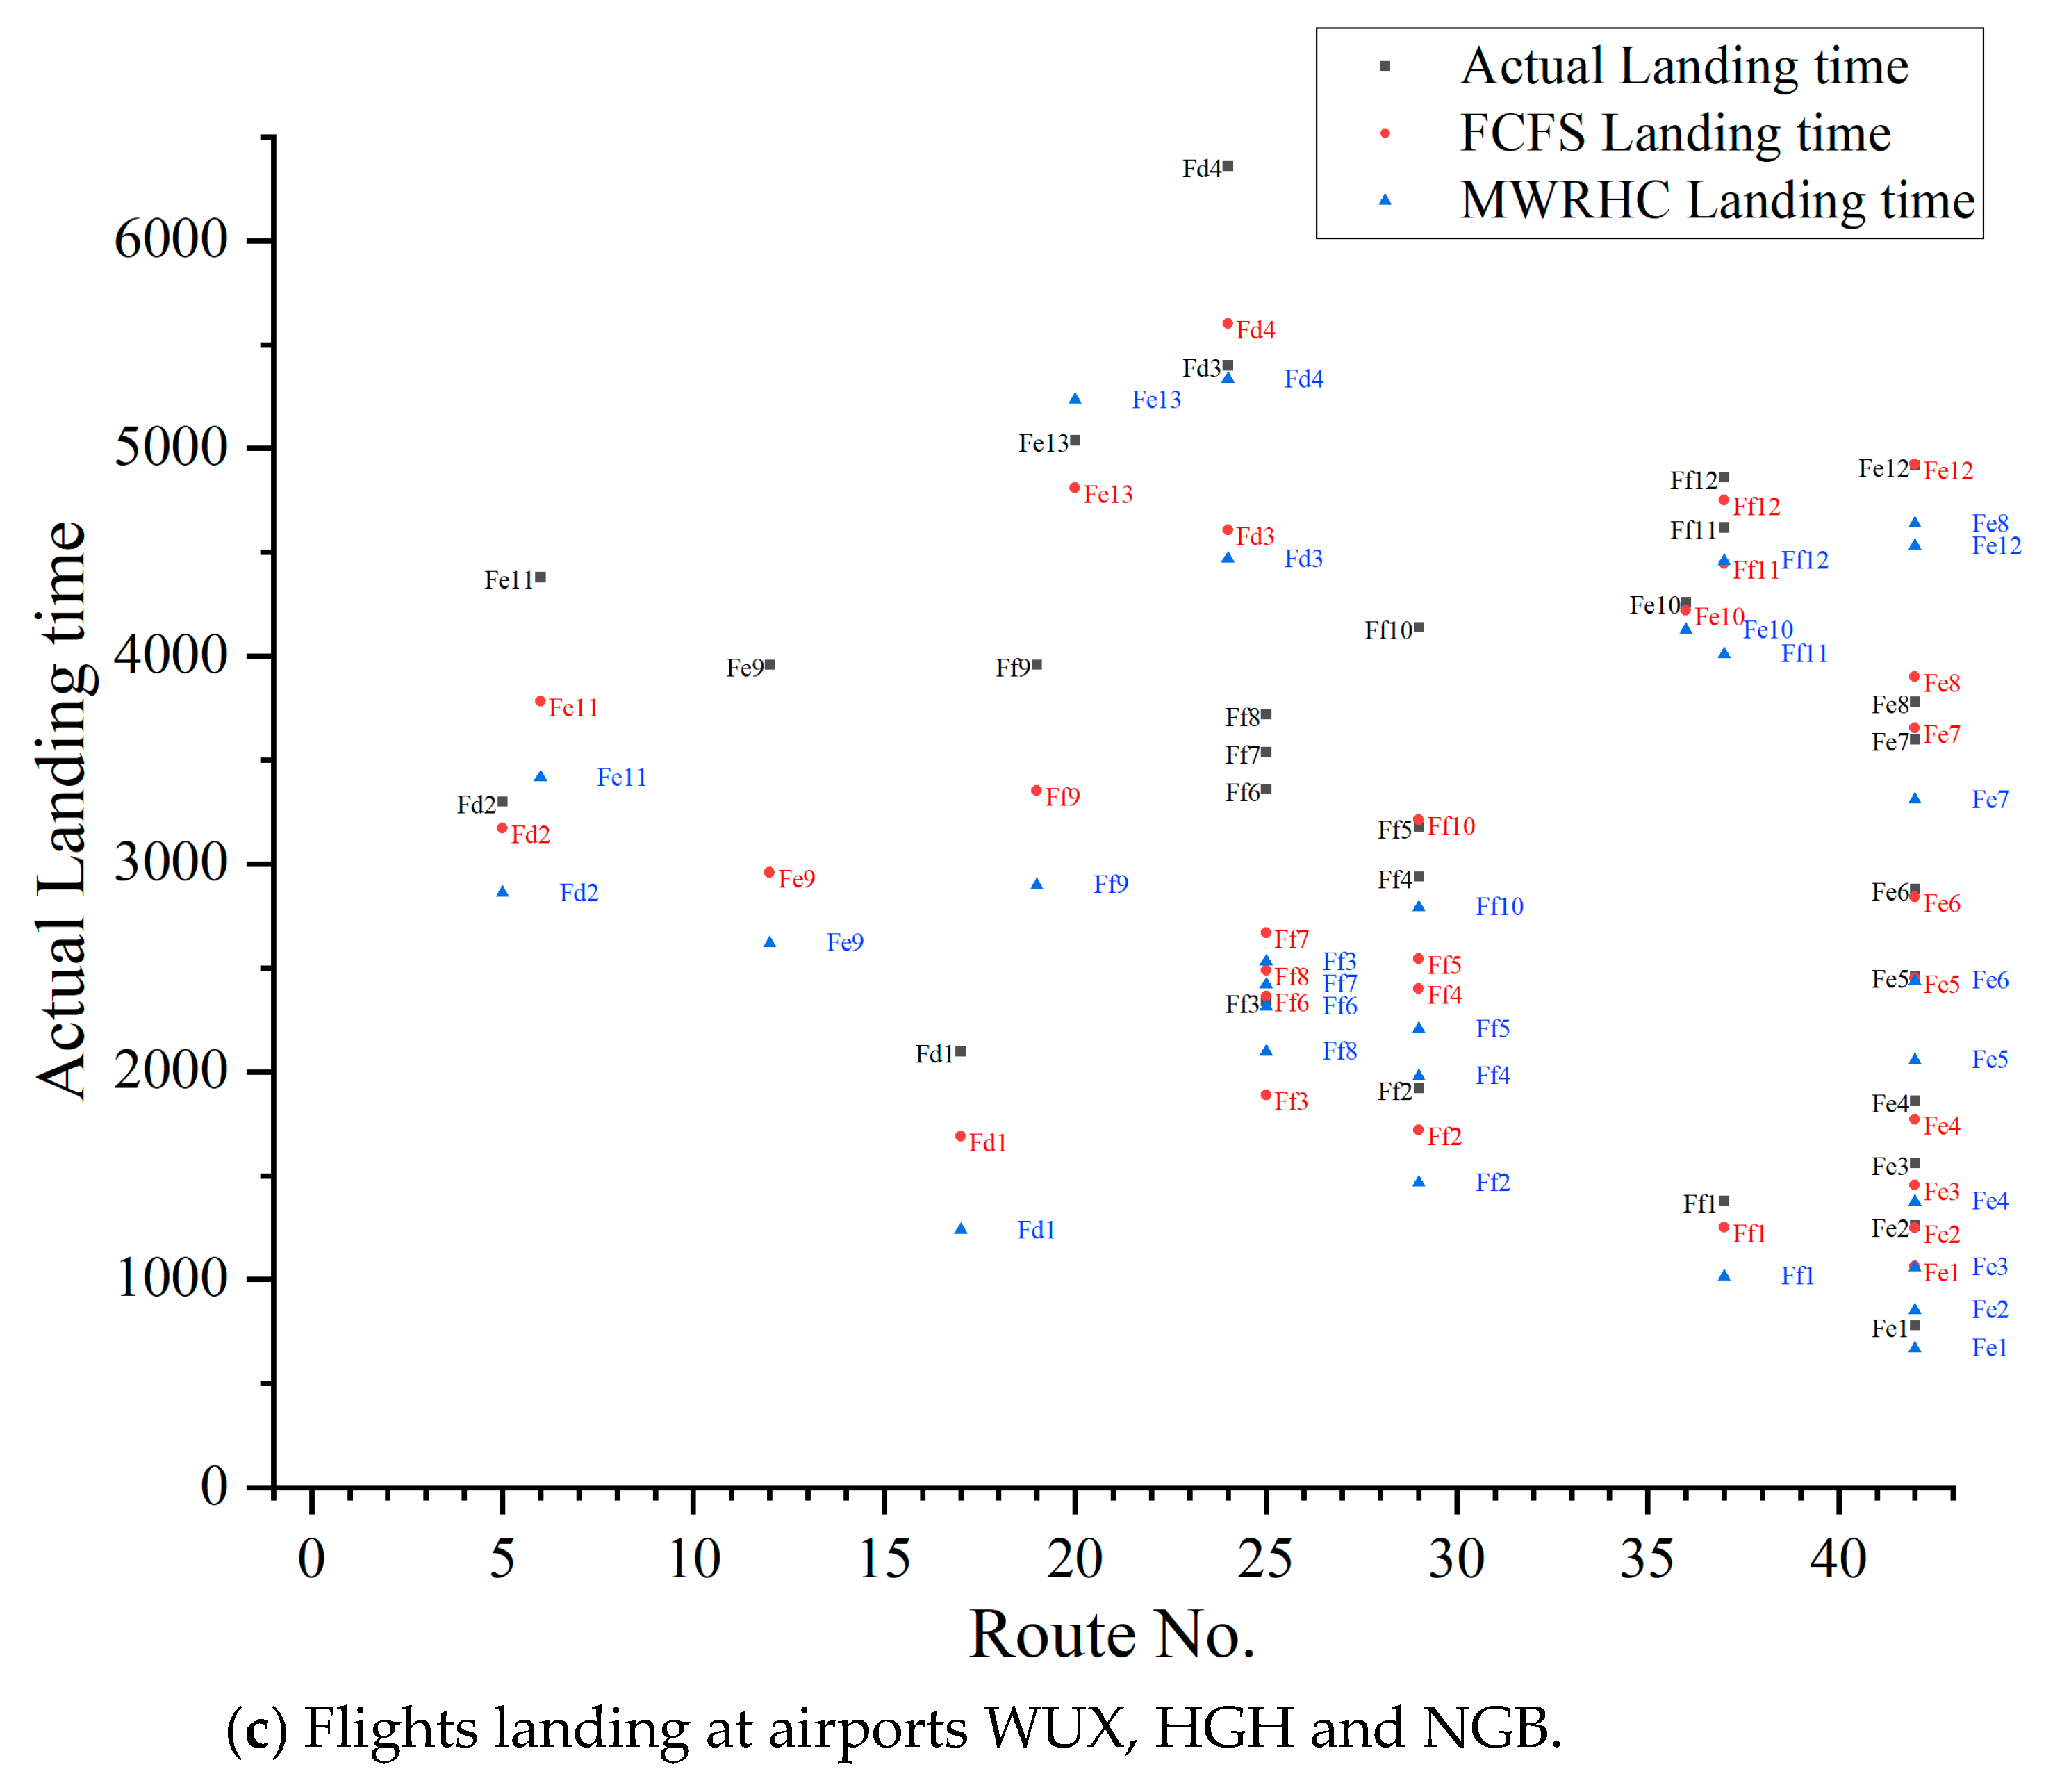
Figure 5.
Comparison of landing times after optimized at Airport NKG.

Figure 6.
Comparison of the optimization time cost rate of six airports.


Table 1.
Definitions for sets.
| Set Symbol | Definition | Index Symbol |
|---|---|---|
| A | set of airports in metroplex | a |
| F | set of arrival flights | i, j |
| Fa | set of flights landing at airport a | |
| R | set of routes available | r, s |
| Ri | set of routes available for flight i, i∈F, Ri⊂R | |
| D | set of segments that make up available routes | d |
| Dr | set of segments that make up route r | |
| P | set of waypoints in metroplex | p |
| Pr | set of waypoints in route r | |
| W | set of runways in metroplex airports, W⊂P | w |
| Wa | set of runway(s) available for airport a | |
| SA | set of scheduled arriving time of flights |
Table 2.
Definitions for parameters.
| Symbol | Definition |
|---|---|
| the minimum flying duration for segment d | |
| the start waypoint of segment d | |
| the end waypoint of segment d | |
| the earliest time for flight i arriving at waypoint p with choosing route r | |
| the latest time for flight i arriving at waypoint p with choosing route r | |
| the minimum time interval for wake turbulence purposes that must be satisfied when flight i and flight j are on the same runway of one airport | |
| the minimum time interval for wake turbulence purposes that must be satisfied when flight i and flight j are on different runways of one airport | |
| the minimum safe interval between flight i and flight j when operating under radar control | |
| K | maximum position shifting (MPS) value |
| M | a very large number |
| N | the total flight number |
| the number of flights landing at airport a | |
Table 3.
Definitions for decision variables.
| Symbol | Definition |
|---|---|
| the simulated time that flight i arriving through waypoint p | |
| the simulated landing time of flight i | |
Table 4.
Constraint Conditions.
| Constraints | No. |
|---|---|
| (1) | |
| (2) | |
| (3) | |
| (4) | |
| (5) | |
| (6) | |
| (7) | |
| (8) | |
| (9) | |
| (10) | |
| (11) | |
| (12) | |
| (13) | |
| (14) |
Table 5.
Major airports name of Yangtze River Delta Airport Metroplex.
| Airport Identifier | Airport Name |
|---|---|
| NKG | Nanjing Lukou |
| SHA | Shanghai Hongqiao |
| PVG | Shanghai Pudong |
| WUX | Wuxi Shuofang |
| HGH | Hangzhou Xiaoshan |
| NGB | Ningbo Lishe |
Table 6.
Available routes for arrival flights in Yangtze River delta metropolitan region.
| Start Point | Route no. | Waypoints |
|---|---|---|
| S1 | 01 | S1-NKGR |
| 02 | S1-M05-M06-M08-SHAR | |
| 03 | S1-M05-M06-M08-PVGR1 | |
| 04 | S1-M05-M06-M08-PVGR2 | |
| 05 | S1-M05-M06-WUXR | |
| 06 | S1-M05-M11-HGHR | |
| 07 | S1-M05-M06-M08-M09-M12-NGBR | |
| S2 | 08 | S2-M02-NKGR |
| 09 | S2-M01-M04-M08-SHAR | |
| 10 | S2-M01-M04-M08-PVGR1 | |
| 11 | S2-M01-M04-M08-PVGR2 | |
| 12 | S2-M02-M05-M11-HGHR | |
| S3 | 13 | S3-M01-M02-NKGR |
| 14 | S3-M01-M08-SHAR | |
| 15 | S3-M03-M08-PVGR1 | |
| 16 | S3-M03-M08-PVGR2 | |
| 17 | S3-M03-WUXR | |
| 18 | S3-M01-M02-M05-M11-HGHR | |
| 19 | S3-M03-M08-M09-M12-NGBR | |
| S4 | 20 | S4-M10-M12-M13-HGHR |
| S5 | 21 | S5-M17-SHAR |
| 22 | S5-PVGR1 | |
| 23 | S5-PVGR2 | |
| 24 | S5-M17-M09-WUXR | |
| 25 | S5-M10-M12-NGBR | |
| S6 | 26 | S6-M16-M12-SHAR |
| 27 | S6-M16-M12-PVGR1 | |
| 28 | S6-M16-M12-PVGR2 | |
| 29 | S6-M16-NGBR | |
| S7 | 30 | S7-M15-M13-M12-SHAR |
| 31 | S7-M15-M16-M12-SHAR | |
| 32 | S7-M15-M13-M12-PVGR1 | |
| 33 | S7-M15-M16-M12-PVGR2 | |
| 34 | S7-M15-M13-M12-PVGR1 | |
| 35 | S7-M15-M16-M12-PVGR2 | |
| 36 | S7-M14-HGHR | |
| 37 | S7-M15-M16-NGBR | |
| S8 | 38 | S8-M14-M11-NKGR |
| 39 | S8-M14-M07-NKGR | |
| 40 | S8-M14-M11-M06-WUXR | |
| 41 | S8-M14-M07-M06-WUXR | |
| 42 | S8-M14-HGHR | |
| S9 | 43 | S9-NKGR |
Table 7.
Optional arrivals route codes for each airport.
| Landing Airport | Route No. |
|---|---|
| NKG | 01, 08, 13, 38, 39, 43 |
| SHA | 02, 09, 14, 21, 26, 30, 31, |
| PVG | 03, 04, 10, 11, 15, 16, 22, 23, 27, 28, 32, 33, 34, 35 |
| WUX | 05, 17, 24, 40, 41 |
| HGH | 06, 12, 18, 20, 36, 42 |
| NGB | 07, 19, 25, 29, 37 |
Table 8.
(A) Comparison of model solution results for airport NKG. (B) Comparison of model solution results for airport SHA. (C) Comparison of model solution results for airport PVG. (D) Comparison of model solution results for airport WUX, HGH and NGB.
Table 8.
(A) Comparison of model solution results for airport NKG. (B) Comparison of model solution results for airport SHA. (C) Comparison of model solution results for airport PVG. (D) Comparison of model solution results for airport WUX, HGH and NGB.
| (A) | |||||||||
| Flight No. | Destination Airport | Landing Runway | Passing Time of EP | EP No. | Scheduled Landing Time | Actual Landing Time | FCFS Landing Time | MWRHC Landing Time | Route No. |
| Fa1 | NKG | NKGR | 125 | S9 | 2400 | 720 | 725 | 425 | 43 |
| Fa2 | NKG | NKGR | 655 | S9 | 3000 | 1320 | 1255 | 1625 | 43 |
| Fa3 | NKG | NKGR | 792 | S9 | 2400 | 1440 | 1392 | 1092 | 43 |
| Fa4 | NKG | NKGR | 103 | S1 | 3900 | 1680 | 1867 | 1200 | 01 |
| Fa5 | NKG | NKGR | 1217 | S9 | 1800 | 2040 | 1817 | 1517 | 43 |
| Fa6 | NKG | NKGR | 292 | S1 | 2700 | 2160 | 2056 | 1733 | 01 |
| Fa7 | NKG | NKGR | 124 | S1 | 3300 | 2340 | 2080 | 1346 | 01 |
| Fa8 | NKG | NKGR | 291 | S1 | 300 | 2460 | 2247 | 1841 | 01 |
| Fa9 | NKG | NKGR | 729 | S1 | 1800 | 2580 | 2493 | 2462 | 01 |
| Fa10 | NKG | NKGR | 1162 | S1 | 4800 | 2760 | 2926 | 2227 | 01 |
| Fa11 | NKG | NKGR | 993 | S3 | 5100 | 3060 | 2933 | 2570 | 13 |
| Fa12 | NKG | NKGR | 1465 | S1 | 3300 | 3180 | 3229 | 3177 | 01 |
| Fa13 | NKG | NKGR | 1146 | S3 | 3000 | 3300 | 3086 | 2354 | 13 |
| Fa14 | NKG | NKGR | 2640 | S9 | 3900 | 3480 | 3240 | 3393 | 43 |
| Fa15 | NKG | NKGR | 1924 | S8 | 5400 | 3600 | 3536 | 2705 | 39 |
| Fa16 | NKG | NKGR | 1756 | S8 | 5700 | 3720 | 3368 | 2960 | 39 |
| Fa17 | NKG | NKGR | 1673 | S2 | 4200 | 3900 | 3717 | 3068 | 08 |
| Fa18 | NKG | NKGR | 2985 | S9 | 3300 | 4020 | 3585 | 3285 | 43 |
| Fa19 | NKG | NKGR | 2284 | S1 | 2100 | 4200 | 4048 | 3825 | 01 |
| Fa20 | NKG | NKGR | 3391 | S9 | 5100 | 4320 | 3991 | 3717 | 43 |
| Fa21 | NKG | NKGR | 2679 | S1 | 4500 | 4440 | 4443 | 3933 | 01 |
| Fa22 | NKG | NKGR | 2832 | S3 | 5400 | 4740 | 4772 | 4663 | 13 |
| Fa23 | NKG | NKGR | 4111 | S9 | 6600 | 4860 | 4711 | 4411 | 43 |
| (B) | |||||||||
| Flight No. | Destination Airport | Landing Runway | Passing time of EP | EP No. | Scheduled landing time | Actual landing time | FCFS landing time | MWRHC landing time | Route No. |
| Fb1 | SHA | SHAR | 252 | S6 | 3000 | 2340 | 2312 | 2289 | 26 |
| Fb2 | SHA | SHAR | 321 | S2 | 3900 | 3060 | 3065 | 3121 | 09 |
| Fb3 | SHA | SHAR | 853 | S2 | 3600 | 3420 | 3397 | 3422 | 09 |
| Fb4 | SHA | SHAR | 1707 | S7 | 3300 | 3600 | 3587 | 3746 | 30 |
| Fb5 | SHA | SHAR | 1467 | S2 | 4500 | 4140 | 4111 | 3530 | 09 |
| Fb6 | SHA | SHAR | 2403 | S6 | 4200 | 4260 | 4263 | 4299 | 26 |
| Fb7 | SHA | SHAR | 1974 | S3 | 6600 | 4380 | 4382 | 3854 | 14 |
| Fb8 | SHA | SHAR | 1903 | S2 | 5400 | 4560 | 4447 | 4191 | 09 |
| Fb9 | SHA | SHAR | 2746 | S7 | 6300 | 4680 | 4626 | 4580 | 30 |
| Fb10 | SHA | SHAR | 2660 | S6 | 6000 | 4860 | 4820 | 4070 | 26 |
| Fb11 | SHA | SHAR | 3051 | S7 | 5400 | 4920 | 4931 | 5044 | 30 |
| Fb12 | SHA | SHAR | 2781 | S6 | 6000 | 5040 | 5041 | 4720 | 26 |
| (C) | |||||||||
| Flight No. | Destination Airport | Landing Runway | Passing time of EP | EP No. | Scheduled landing time | Actual landing time | FCFS landing time | MWRHC landing time | Route No. |
| Fc1 | PVG | PVGR1 | 6 | S5 | 3300 | 1080 | 1058 | 1599 | 22 |
| Fc2 | PVG | PVGR1 | 160 | S5 | 2400 | 1440 | 1312 | 1244 | 22 |
| Fc3 | PVG | PVGR1 | 603 | S5 | 2100 | 1680 | 1655 | 1136 | 22 |
| Fc4 | PVG | PVGR1 | 307 | S7 | 3300 | 2320 | 2291 | 1906 | 32 |
| Fc5 | PVG | PVGR1 | 1450 | S5 | 3900 | 2520 | 2502 | 2494 | 22 |
| Fc6 | PVG | PVGR1 | 794 | S6 | 3600 | 2880 | 2858 | 2926 | 27 |
| Fc7 | PVG | PVGR1 | 916 | S6 | 3000 | 3120 | 2980 | 2746 | 27 |
| Fc8 | PVG | PVGR1 | 1090 | S6 | 5100 | 3180 | 3154 | 2603 | 27 |
| Fc9 | PVG | PVGR1 | 415 | S1 | 2400 | 3420 | 2931 | 3082 | 03 |
| Fc10 | PVG | PVGR1 | 770 | S1 | 5400 | 3600 | 3286 | 3190 | 03 |
| Fc11 | PVG | PVGR1 | 2255 | S5 | 2100 | 3600 | 3407 | 3306 | 22 |
| Fc12 | PVG | PVGR1 | 2407 | S5 | 6900 | 3720 | 3559 | 3414 | 22 |
| Fc13 | PVG | PVGR1 | 1822 | S6 | 5400 | 3840 | 3886 | 3622 | 27 |
| Fc14 | PVG | PVGR1 | 2824 | S5 | 5700 | 3960 | 3976 | 3786 | 22 |
| Fc15 | PVG | PVGR1 | 2059 | S1 | 6000 | 4920 | 4383 | 3903 | 04 |
| Fc16 | PVG | PVGR1 | 2116 | S2 | 6600 | 5120 | 4220 | 4974 | 10 |
| Fc17 | PVG | PVGR1 | 4071 | S5 | 6900 | 5220 | 5223 | 4550 | 22 |
| Fc18 | PVG | PVGR1 | 2934 | S6 | 5700 | 5400 | 5198 | 4813 | 27 |
| Fc19 | PVG | PVGR1 | 3360 | S6 | 5400 | 5700 | 5624 | 4602 | 27 |
| Fc20 | PVG | PVGR2 | 728 | S5 | 4800 | 1800 | 1880 | 1760 | 23 |
| Fc21 | PVG | PVGR2 | 1593 | S5 | 3600 | 2700 | 2745 | 2794 | 23 |
| Fc22 | PVG | PVGR2 | 1786 | S5 | 6900 | 3000 | 2938 | 3130 | 23 |
| Fc23 | PVG | PVGR2 | 2026 | S5 | 3300 | 3300 | 3178 | 3238 | 23 |
| Fc24 | PVG | PVGR2 | 1215 | S6 | 4200 | 3480 | 2479 | 3354 | 28 |
| Fc25 | PVG | PVGR2 | 3015 | S5 | 5700 | 4140 | 4167 | 3592 | 23 |
| Fc26 | PVG | PVGR2 | 3297 | S5 | 6300 | 4440 | 4449 | 4356 | 23 |
| Fc27 | PVG | PVGR2 | 2282 | S6 | 4500 | 4560 | 3546 | 5068 | 28 |
| Fc28 | PVG | PVGR2 | 1693 | S1 | 6600 | 4740 | 4209 | 4108 | 04 |
| Fc29 | PVG | PVGR2 | 3585 | S5 | 4800 | 4740 | 4737 | 5128 | 23 |
| Fc30 | PVG | PVGR2 | 3767 | S5 | 7200 | 4920 | 4919 | 5240 | 23 |
| Fc31 | PVG | PVGR2 | 2525 | S6 | 6000 | 4980 | 4889 | 4832 | 28 |
| Fc32 | PVG | PVGR2 | 3076 | S6 | 5100 | 5400 | 5380 | 5348 | 28 |
| (D) | |||||||||
| Flight No. | Destination Airport | Landing Runway | Passing time of EP | EP No. | Scheduled landing time | Actual landing time | FCFS landing time | MWRHC landing time | Route No. |
| Fd1 | WUX | WUXR | 126 | S3 | 3000 | 2100 | 1690 | 1238 | 17 |
| Fd2 | WUX | WUXR | 541 | S1 | 5700 | 3300 | 3173 | 2860 | 05 |
| Fd3 | WUX | WUXR | 3452 | S5 | 7200 | 5400 | 4608 | 4468 | 24 |
| Fd4 | WUX | WUXR | 4445 | S5 | 9900 | 6360 | 5601 | 5334 | 24 |
| Fe1 | HGH | HGHR | 220 | S8 | 2100 | 780 | 1064 | 670 | 42 |
| Fe2 | HGH | HGHR | 404 | S8 | 2400 | 1260 | 1248 | 854 | 42 |
| Fe3 | HGH | HGHR | 610 | S8 | 3300 | 1560 | 1454 | 1060 | 42 |
| Fe4 | HGH | HGHR | 927 | S8 | 2400 | 1860 | 1771 | 1377 | 42 |
| Fe5 | HGH | HGHR | 1606 | S8 | 4200 | 2460 | 2450 | 2056 | 42 |
| Fe6 | HGH | HGHR | 1943 | S8 | 2700 | 2880 | 2843 | 2439 | 42 |
| Fe7 | HGH | HGHR | 2754 | S8 | 4500 | 3600 | 3654 | 3309 | 42 |
| Fe8 | HGH | HGHR | 3056 | S8 | 5400 | 3780 | 3900 | 4639 | 42 |
| Fe9 | HGH | HGHR | 1265 | S2 | 5400 | 3960 | 2961 | 2620 | 12 |
| Fe10 | HGH | HGHR | 3404 | S7 | 4500 | 4260 | 4220 | 4126 | 36 |
| Fe11 | HGH | HGHR | 1875 | S1 | 5100 | 4380 | 3783 | 3417 | 06 |
| Fe12 | HGH | HGHR | 4081 | S8 | 6000 | 4920 | 4925 | 4531 | 42 |
| Fe13 | HGH | HGHR | 2702 | S4 | 5700 | 5040 | 4810 | 5235 | 20 |
| Ff1 | NGB | NGBR | 15 | S7 | 3600 | 1380 | 1251 | 1016 | 37 |
| Ff2 | NGB | NGBR | 668 | S6 | 2700 | 1920 | 1720 | 1466 | 29 |
| Ff3 | NGB | NGBR | 481 | S5 | 2700 | 2340 | 1889 | 2530 | 25 |
| Ff4 | NGB | NGBR | 1347 | S6 | 3000 | 2940 | 2399 | 1979 | 29 |
| Ff5 | NGB | NGBR | 1491 | S6 | 3900 | 3180 | 2543 | 2206 | 29 |
| Ff6 | NGB | NGBR | 956 | S5 | 1500 | 3360 | 2364 | 2314 | 25 |
| Ff7 | NGB | NGBR | 1259 | S5 | 2700 | 3540 | 2667 | 2422 | 25 |
| Ff8 | NGB | NGBR | 1082 | S5 | 3300 | 3720 | 2490 | 2098 | 25 |
| Ff9 | NGB | NGBR | 494 | S3 | 4500 | 3960 | 3354 | 2900 | 19 |
| Ff10 | NGB | NGBR | 2160 | S6 | 5100 | 4140 | 3212 | 2792 | 29 |
| Ff11 | NGB | NGBR | 3210 | S7 | 5400 | 4620 | 4446 | 4011 | 37 |
| Ff12 | NGB | NGBR | 3516 | S7 | 6000 | 4860 | 4752 | 4459 | 37 |
Disclaimer/Publisher’s Note: The statements, opinions and data contained in all publications are solely those of the individual author(s) and contributor(s) and not of MDPI and/or the editor(s). MDPI and/or the editor(s) disclaim responsibility for any injury to people or property resulting from any ideas, methods, instructions or products referred to in the content. |
© 2023 by the authors. Licensee MDPI, Basel, Switzerland. This article is an open access article distributed under the terms and conditions of the Creative Commons Attribution (CC BY) license (https://creativecommons.org/licenses/by/4.0/).
Share and Cite
MDPI and ACS Style
Jiang, F.; Zhang, Z. Optimal Sequencing of Arrival Flights at Metroplex Airports: A Study on Shared Waypoints Based on Path Selection and Rolling Horizon Control. Aerospace 2023, 10, 881. https://doi.org/10.3390/aerospace10100881
AMA Style
Jiang F, Zhang Z. Optimal Sequencing of Arrival Flights at Metroplex Airports: A Study on Shared Waypoints Based on Path Selection and Rolling Horizon Control. Aerospace. 2023; 10(10):881. https://doi.org/10.3390/aerospace10100881
Chicago/Turabian StyleJiang, Furong, and Zhaoning Zhang. 2023. "Optimal Sequencing of Arrival Flights at Metroplex Airports: A Study on Shared Waypoints Based on Path Selection and Rolling Horizon Control" Aerospace 10, no. 10: 881. https://doi.org/10.3390/aerospace10100881
Note that from the first issue of 2016, this journal uses article numbers instead of page numbers. See further details here.