
Exploring Short-Term Climate Change Effects on Rangelands and Broad-Leaved Forests by Free Satellite Data in Aosta Valley (Northwest Italy)


1
Department of Agricultural, Forest and Food Sciences (DISAFA)—GEO4Agri DISAFA Lab—Unito Green Office Energy & Climate Change Groups, Università degli Studi di Torino, Largo Paolo Braccini 2, Grugliasco, TO 10095, Italy
2
Department of Agricultural, Forest and Food Sciences (DISAFA)—GEO4Agri DISAFA Lab, Università degli Studi di Torino Largo Paolo Braccini 2, Grugliasco, TO 10095, Italy
*
Author to whom correspondence should be addressed.
Climate 2021, 9(3), 47; https://doi.org/10.3390/cli9030047
Submission received: 26 January 2021
/
Revised: 26 February 2021
/
Accepted: 12 March 2021
/
Published: 15 March 2021
(This article belongs to the Special Issue The Interaction of Climate Change with Landscape and Environment)
Abstract
:Satellite remote sensing is a power tool for the long-term monitoring of vegetation. This work, with reference to a regional case study, investigates remote sensing potentialities for describing the annual phenology of rangelands and broad-leaved forests at the landscape level with the aim of detecting eventual effects of climate change in the Alpine region of the Aosta Valley (Northwest (NW) Italy). A first analysis was aimed at estimating phenological metrics (PMs) from satellite images time series and testing the presence of trends along time. A further investigation concerned evapotranspiration from vegetation (ET) and its variation along the years. Additionally, in both the cases the following meteorological patterns were considered: air temperature anomalies, precipitation trends and the timing of yearly seasonal snow melt. The analysis was based on the time series (TS) of different MODIS collections datasets together with Climate Hazards Group InfraRed Precipitation with Station data (CHIRPS) collection obtained through Google Earth Engine. Ground weather stations data from the Centro Funzionale VdA ranging from 2000 to 2019 were used. In particular, the MOD13Q1 v.6, MOD16A2 and MOD10A1 v.6 collections were used to derive PMs, ET and snow cover maps. The SRTM (shuttle radar topography mission) DTM (digital terrain model) was also used to describe local topography while the Coordination of Information on the Environment (CORINE) land cover map was adopted to investigate land use classes. Averagely in the area, rangelands and broad-leaved forests showed that the length of season is getting longer, with a general advance of the SOS (start of the season) and a delay in the EOS (end of the season). With reference to ET, significant increasing trends were generally observed. The water requirement from vegetation appeared to have averagely risen about 0.05 Kg·m−2 (about 0.5%) per year in the period 2000–2019, for a total increase of about 1 Kg·m−2 in 20 years (corresponding to a percentage difference in water requirement from vegetation of about 8%). This aspect can be particularly relevant in the bottom of the central valley, where the precipitations have shown a statistically significant decreasing trend in the period 2000–2019 (conversely, no significant variation was found in the whole territory). Additionally, the snowpack timing persistence showed a general reduction trend. PMs and ET and air temperature anomalies, as well as snow cover melting, proved to have significantly changed their values in the last 20 years, with a continuous progressive trend. The results encourage the adoption of remote sensing to monitor climate change effects on alpine vegetation, with particular focus on the relationship between phenology and other abiotic factors permitting an effective technological transfer.
1. Introduction
Satellite-based remote sensing has been proved to effectively support vegetation monitoring [1]. Nowadays, satellite data are widely used, at the global scale, for bio-climatologic and bio-meteorologic issues, often related to the global climate change.
An ecological and evolutionary dilemma is posed to a variety of organisms, in particular vegetation, nowadays because of the environmental modifications related to climate change: can they respond properly to these ongoing changes? Does their phenology remain synchronous with other mechanisms or species that they interact with? Can they adapt their responses consistently with regard to the timing of reproduction? These questions are difficult to be answered without long-term observations and experiments. Natural/semi-natural vegetation, such as rangelands and broad-leaved forests in mountain regions, can play an important role in exploring this topic. In fact, unmanaged vegetation, located in more extreme climatic situations (such as mountain rangelands and forests), is the first one that could be stressed, if a significant change affects local climatic conditions. Consequently, the long-term monitoring of rangelands behavior could drive one to better understand the dynamics of reaction/adaptation (resilience) of vegetation to climate change. In this context, remotely sensed data from EO (earth observation) missions operating over a long-time range could proficiently support this analysis. In the last few years, many works have been published in the literature presenting approaches, or case studies, about this topic with a significant improvement [2,3,4]. With special concern about mountain rangelands, their phenology at high altitudes is mainly related to snowpack that consequently, because of climate change, is drastically reducing [5]. Snowpack reduction depends on many factors related to the global, regional, and local climate. Global factors include changes of temperature and precipitation regimes—in alpine areas, the average temperature and rainfalls are increasing—moreover, rainfalls are tending to move from snowy to watery ones [6,7,8]. These environmental changes appear to have anticipated snowmelt, making spring begin earlier, as already observed in the Rocky Mountains (United States) [9] and in other mountain areas worldwide [10]. Moreover, phenological changes at high latitudes prove to be similar to the ones observed at high altitude [11]. The earlier beginning of the growing season, related to the anticipated snowmelt, can have multiple consequences: it could increase the length of the photosynthetic period, if the end of the season does not move or move to a later date. This impacts drought-related dynamics since an earlier snowmelt, and the consequent longer snow-free period, may increase the exposure of plants to this stress [12]. Additionally, an earlier snowmelt can significantly alter the dates on which species may come into bloom throughout the summer [13], because the ground and air will warm up earlier when snow disappears. For some species, a correlation was found between the timing of snowmelt and the abundance of flowering. In fact, one of the factors linking the dates of snowmelt to flowering abundance is frost [14]. If the probability of spring frost at a certain date remains the same and leaf or flower buds have anticipated, they become more vulnerable to frost: an increase in the frequency of frost-related damages is consequently expected for frost-sensitive species. Frost damage might also increase if the date of the last spring frost posticipates and if the rate of change in frost dates is slower than the one of snowmelt dates. Under these conditions, the knowledge of phenological trends at a wide scale within a certain area is crucial to adapt and plan pasture management under climate change. Land surface phenology (LSP) observations from remotely sensed data can provide key information related to seasonal dynamics [15] in the net ecosystem exchange of carbon [16] and surface energy and water balance [17] at regional-to-global scales [18]. LSP has also been shown to reflect the year-to-year variation of weather and is, therefore, a sensitive indicator of the ecosystem’s response to long-term changes in the climate [19]. Consistently with perturbations expected from climate change [20], long-term phenology studies have identified widespread trends towards earlier springs and a lengthening of the growing season [21,22,23]. In contrast, observed trends of leaf senescence delay by remote sensing appearing less pronounced and being spatially heterogeneous are also supported [24,25]. All of these changes are expected to have important implications for ecosystem productivity and function [26].
Higher air temperatures have resulted in greater fluxes of precipitation (P) and evapotranspiration (ET) between terrestrial and atmospheric systems, leading to the intensification of the water cycle [27,28]. The growing season length partially controls ET, which cycles up to 62% of terrestrial water to the atmosphere [29]. P and the atmospheric evaporative demand have increased due to warmer temperatures [30], leading to changes in annual water yields [31], with humid regions tending to become wetter while arid regions have tended to become drier [32]. A longer growing season has the potential to alter water cycle fluxes through increased plant water use and ET [33] in the terrestrial ecosystems. The intensification of the water cycle is theoretically consistent with the Clausius–Clapeyron relation [34], which states that warmer air holds more water (for example, greater maximum specific humidity) and that consequently, atmospheric water vapor tends to increase non-linearly with increases in the air temperature. A warmer climate can also enlarge the growing season and provide more energy for ET. Therefore, accurate information regarding the start and the end of the vegetation growing season is important for monitoring and modeling the impacts of climate change on ecosystem processes. Studies exploring growing season variations can be effectively supported by both field observations and satellite data. A large number of ground-based studies have explored the phenological response of vegetation to climate change at particular locations or for subsets of species [35]. Satellite-based monitoring of phenology, on the other hand, allows the regional-to-global analysis of ecosystem responses to climate change, but shows some limitations while modeling and analyzing vegetation at the species level. Early remote sensing-based studies of phenology used coarse spatial resolution imagery from the advanced very high-resolution radiometer (AVHHR). In recent years, however, most of the studies were carried out at a higher spatial resolution (250, 500 m) with reference to image time series derived from the NASA’s moderate resolution imaging spectroradiometer (MODIS) [36]. Most recently, a number of studies have begun to use 10–30 m resolution imagery, having similar spectral properties, available from Landsat and Sentinel 2 in order to improve phenological deductions at a higher spatial resolution [37,38,39,40,41,42,43,44].
A variety of different methods have been used to extract the so-called phenological transition dates, i.e., metrics defining the day of year associated with specific pheno-phase transitions [37], from time series of spectral vegetation indices such as the normalized difference vegetation index (NDVI) [39,40]. In particular, the start of season (SOS) and end of season (EOS) dates can be estimated from remotely sensed time series using a variety of methods to model observed temporal dynamics, including harmonic analysis [41], wavelet decomposition [42], splines [43], and curve fitting [45]. Curve fitting algorithms are the most commonly used, and among them, the asymmetric Gaussian, double logistic, and piecewise logistic functions are widely applied [46]. Regardless of the algorithm used, the overall methodology for extracting transition dates generally includes the following steps: satellite vegetation index time series generation; time series pre-process including gap filling, cloud screening, smoothing, the identification of valid phenological cycles, function fitting (usually splines or double logistic), and lastly, either parameter inversion or threshold date extraction [43,47].
Goals and Summary Description
Under these premises, this work was aimed at exploring short-term climate change effects, by remotely sensed data, on phenological metrics (PMs) and evapotranspiration (ET) of rangelands and broad-leaved forests in Aosta Valley, an alpine region located in north-western Italy. In order to analyze possible climate change effects in this region, particular attention was paid to natural and semi-natural vegetation classes: rangelands (R) and broad-leaved forests (B). The expectation was that climatic factors affecting vegetation phenology were snowpack time persistence (snow cover duration), precipitation and air temperature anomaly. Specifically referring to alpine rangelands and broad-leaved forests, only a few papers in the literature [10] try to relate the effects of climate change on vegetation PMs and ET with snowpack time duration, air temperature anomalies and precipitation. This is probably due to the fact that ground measures in mountain regions are difficult to be obtained with a proper spatial distribution. Moreover, only in recent years scientific community attention has been focused on mountains, thanks to their role of climate change sentinels. This work, based on freely accessible remotely sensed data, is intended to fill this gap with special concerns about the Alps.
It is worth remembering that rangelands have a considerable importance for both ecosystem and economic services of this region, since livestock is one of the main sources of economic income. Moreover, rangelands have a wide spatial distribution over the territory; therefore, monitoring their phenology and physiology can certainly support the comprehension of the local climate and territorial dynamics. Differently, broad-leaved forests are known to be particularly sensitive to climate change, being located in two very sensitive zones: the bottom of the valley (where precipitations and temperature are highly varying) and the higher altitude bands (for e.g., Alnus alnobetula (Ehrh.) K. Koch and Acer pseudoplatanus L.; Fraxinus excelsior L. etc.), where variations in snow cover time, persistence and temperature can deeply affect vegetation phenology.
Additionally, together with conifers (and in particular Larix decidua Mill.) they are greatly interesting for the National Inventory of Forests and Forest Carbon pools (INFC), and, at the regional level, for forestry planning adaptation to the climate change perspective.
With these premises and with reference to the CORINE land cover map (see forward on), the analysis was focused on pastures, natural grasslands, moors/heathlands and broad-leaved forests. To explore the altitude effects on trends, the analysis was achieved at different height class. PMs/ET investigations were based on TERRA MODIS image time series (MOD13Q1 and MOD16A2 products, see forward on) ranging from 2000 to 2019. With reference to the MOD13Q1 product, a NDVI image time series was generated and used to estimate the PMs: SOS (start of season), EOS (end of seasons), LOS (length of season), MAXVI (maximum vegetation index). In order to validate the results concerning PMs’ estimates as computed by the TIMESAT tool, the MCD12Q2 phenological collection was adopted.
Air temperature anomalies, snowpack timing and precipitation data were obtained from both EO datasets and ground stations.
With reference to the MOD16A2 product, the corresponding ET (computed as yearly cumulated eight days observation per year) image time series was generated and used to describe trends affecting rangelands and broad-leaved forests at different altitudes. The results showed that most of the above-mentioned metrics significantly changed in the last 20 years in this region, proving that this alpine area is very sensitive to climate change effects. The trends were finally modelled by first order polynomial relationships and some operational information was extracted and discussed, with the aim of providing a forecasting model useful for rangeland management under the climate change conditions.
2. Materials and Methods
2.1. Study Area
The study area corresponds to the entire Aosta Valley, an administrative region located in the north-western Alps in Italy, close to France and Switzerland. It is an alpine region (Figure 1) sizing about 3263 km2 with a population of about 126,000 people.
The altitude ranges between 340 m (bottom of the valley, Pont Saint Martin municipality) up to 4810 m above sea level (ASL). (Mont Blanc). The average altitude is about 2100 m; 60% of the territory is above 2000 m ASL. Aosta Valley is completely bordered by mountains, often exceeding 4000 m ASL: the Mont Blanc massif in the West, the Monte Rosa and Matterhorn (Cervino) massifs in the Northeast, the Gran Paradiso massif in the South and the Grand Combin (in Switzerland) in the North. Table 1 reports the altitude ranges and their spatial distribution, respectively.
Given its topographic features, mostly related to the local presence of the highest European mountains, it can be reasonably considered an open-cell laboratory or environmental and biological sciences.
The Aosta Valley climate is strongly influenced by topography, as well. Surrounding high mountains prevents the access of humid air masses from Mediterranean or Atlantic areas, making local climate characterized by: a high degree of aridity in the central area (rainfalls lower than 500 mm·y−1); an average rainfall (above 1400 mm·y−1) in the border areas and especially in its south-eastern and north-western valleys [48]. In winter, precipitations are mainly snowy. In summer, convective rainfalls are quite common, determining frequent thunderstorms; spring and autumn are characterized by stratified rainfalls, possibly lasting for several days, with a consequent increase in the flood risk. In force of its highly variegated climatic situation, Aosta Valley land cover is heterogenous.
2.2. Remote Sensing Data
MOD13Q1 v.6 [49] product from the NASA TERRA MODIS (moderate resolution imaging spectroradiometer) mission was used to map the normalized difference vegetation index (NDVI) over the area in the period from 18 February 2000 to 31 December 2019. Four hundred-fifty-two MOD13Q1 images were obtained for free by Google Earth Engine [50]. They were stacked into a NDVI time series (NTS) and filtered according to the pixel reliability layer, supplied together with the product, to map reliability of each scene pixel. Stacking and filtering (Savitzky–Golay, [51,52]) were operated by a self-developed IDL 8.1 routine [53]. The vegetation index from the MOD13Q1 v.6 product is a composite one, having a time step of 16 days and a spatial resolution of 250 m. The MOD13Q1 v.6 product provided a vegetation index (VI) value at a per pixel basis. It is referred to as a continuity index to the existing one from the National Oceanic and Atmospheric Administration advanced very high resolution radiometer (NOAA-AVHRR) data. A composition algorithm selected the best available pixel value from all the acquisitions within the considered 16-day period. The selection criteria are the following: no clouds, low viewing angle, and highest NDVI value, adopting the classic formula as follows: (Equation (1)).
where ρNIR and ρRED are the at-the-ground reflectance of the near-infrared (MODIS band 2) and red (MODIS band 1) bands, respectively.
ET (evapotranspiration) maps were retrieved from the MOD16A2 v.6 collection [54] by Google Earth Engine for the period from 1 January 2000 to 31 December 2019 for a total of 868 images.
The MOD16A2 v.6 Evapotranspiration/Latent Heat Flux product is an 8-day composite product with a geometric resolution of 500 m. The algorithm adopted for the MOD16A2 data product collection refers to the Penman–Monteith equation [55], which includes inputs of daily meteorological reanalysis data such as albedo, land cover, vegetation property dynamics and LST (land surface temperature) that in some studies were adopted to evaluate ET [56] or heat fluxes [57]. Pixel values for the net evapotranspiration (ET) is the sum of all 8 days within the composite period expressed in kg m−2 8d−1. The MOD16A2 v.6 ET layers were stacked into an ET time series (ETS); no filtering was applied. Stacking was operated by a self-developed IDL 8.1 routine.
The Shuttle Radar Topography Mission (SRTM) digital elevation model was used for this work [58,59]. The SRTM v3 product (SRTM Plus) was provided by NASA JPL with a grid size of 1 arc-second (approximately 30 m). Native SRTM was resampled at 30 m (SRTM30) to make pixel squared.
The MOD13Q1 v.6 and MOD16A2 v.6 layers were geometrically oversampled up to 30 m to refine the area zonation by applying the bicubic spline interpolation [60] method in order to have grids with the same spatial resolution. In the case of a lack of data, an interpolation was performed in R v.1.3.1093 by adopting the package “Impute TS” specializes on univariate time series imputation. It offers multiple state-of-the-art imputation algorithm implementations along with plotting functions for time series missing data statistics. The following functions were adopted in R Studio: ggplot_na_distribution is a function that visualizes the distribution of missing values within a time series. The time series is plotted and whenever a value is NA, the background is colored differently. This gives a nice overview as to where in the time series, most of the missing values occur.
ggplot_na_imputations is a function that plots the imputed values for a time series. Therefore, the imputed values (filled NA gaps) are shown in a different color than the other values [61].
To validate PMs estimates from the NDVI of MOD13Q1 v.6 collection, the MCD12Q2 v.6 Land Cover Dynamics product (informally named the MODIS Global Vegetation Phenology product) was adopted. It was obtained from Google Earth Engine with a 500 m spatial resolution covering the period from 1 January 2001 to 31 December 2018. Missing values were interpolated, or extrapolated, for a maximum of one year before or after the reference time period of the collection by adopting the functions ee.interpolate and ee.Model.fromAiPlatformPredictor available in Google Earth Engine libraries. The dataset provides estimates of the timing of vegetation phenology at global scales. Additionally, it provides information related to the range and summation of the enhanced vegetation index (EVI) computed from MODIS surface reflectance data at each pixel. It identifies the onset of greenness, green-up midpoint, maturity, peak greenness, senescence, green-down midpoint, dormancy, 2-band enhanced vegetation index (EVI2) minimum, EVI2 amplitude, integrated EVI2 over a vegetation cycle, as well as overall and phenology metric-specific quality information. The MCD12Q2 v.6 data product is derived from time series of the 2-band enhanced vegetation index (EVI2) calculated from the MODIS nadir bidirectional reflectance distribution function (BRDF)-adjusted reflectance (NBAR). Vegetation phenology metrics are identified for up to two detected growing cycles per year. For pixels with more than two valid vegetation cycles, the data represent the two cycles with the largest NBAR-EVI2 amplitudes [62].
All data were converted from native geographical reference systems WGS84 into the ED50 UTM 32N one.
CHIRPS (Climate Hazards Group InfraRed Precipitation with Station data) is a 30+ year quasi-global rainfall dataset. CHIRPS incorporates 0.05° (5550 m) resolution satellite imagery with in-situ station data to create gridded rainfall time series for trend analysis and seasonal drought monitoring [63]. A time series of precipitation estimates was obtained for the study area by Google Earth Engine. The annual rainfall of the whole Aosta Valley Region was considered along time. No spatial resampling was performed, and the native spatial resolution maintained.
NDSI Snow Cover: the MOD10A1 v.6 Snow Cover Daily Global 500 m product contains snow cover, snow albedo, fractional snow cover, and quality assessment (QA) layers. Snow cover data are based on snow mapping algorithm that employs a normalized difference snow index (NDSI) and other criteria tests [64].
2.3. Land Cover Data
To properly describe land cover at regional level, the CORINE land cover 2018 dataset (hereinafter referred to as CLC2018) was used; the CORINE (Coordination of Information on the Environment) land cover inventory was initiated in 1985 to standardize data collection on land in Europe to support environmental policy development. The project is coordinated by the European Environment Agency (EEA) in the frame of the EU Copernicus program and implemented by national teams. The number of participating countries has increased over time, currently including 33 member countries and six cooperating countries with a total area of over 5.8 million km2. CLC2018, specifically, is one of the available datasets produced within the general CORINE frame and refers to land cover/land use status in 2018. The reference year of the first CLC inventory was 1990 and the first update was achieved in 2000. The current update cycle is 6 years. Satellite imagery provides the geometrical and thematic basis of maps; it is integrated with in-situ data as essential ancillary information. The CLC Level 3 dataset considers 44 classes with a minimum mapping unit (MMU) of 25 hectares (100 m minimum mapping width). The CLC2018 Level 3 of Aosta Valley was obtained from the collection COPERNICUS/CORINE/V20/100 m by Google Earth Engine in grid format (100 m grid size) [65,66,67]. The CLC2018 Level 3 classes and corresponding statistics are reported, for the whole Aosta Valley, in Table 2.
Land cover classes were considered with reference to the considered 3 height classes (see forward on), in order to give a more comprehensive description on the ongoing processes affecting vegetation and the role of altitude in vegetation responses.
As indicated in Table 2 (green cells), this study focused on broad-leaved forests and rangelands, that ware assumed to correspond to the following CORINE land cover classes: pastures, broad-leaved forests, natural grasslands, moors and heathlands (Figure 2). B and R were chosen because they both are very sensitive to climate change and have huge importance in Aosta Valley in terms of the economic benefits and the great biodiversity hosted.
2.4. Ground Data (Weather Stations Data)
In order to analyze the possible relationship of PMs and ET with climate change, the air temperature and precipitation data were obtained for the explored period (2000–2019) from the Data Center of the Centro Funzionale della Valle d’Aosta (Functional Center of Aosta Valley). The dataset includes temperature values as collected by 100 weather stations distributed all around the Aosta Valley region [68]. For each station, the daily mean air temperature was considered. Stations were preliminarily assigned to the three altitude classes (namely H1, H2, H3 see forward on) that authors considered for this work. Only stations falling in rangelands and in proximity of broad-leaved forests or sufficiently close to them (distance < 3 km) were considered. Furtherly, they were reduced to guarantee that the same number of stations (finally, 15) were assigned to the three altitude classes for a total of 43.
3. Methodology
The analysis was aimed at testing if any significant climatic trend affected phenological metrics (PMs, see forward on) and ET (as measured by NTS and ETS, respectively) in the period from 2000–2019 and if the time series (TS) observed were related to rising temperature, precipitation trend and the timing of annual seasonal snowmelt. CLC2018 classes (231 = pastures, 311 = broad-leaved forests, 321 = natural grasslands, 322 = moors/heathlands) were considered and aggregated into a single macro-class, hereinafter named “H”.
Conversely, H was then disaggregated into three sub-classes (H1, H2, H3, Table 3). These were obtained by SRTM reclassification operated by the simple table method [69,70] available in the SAGA GIS v.7.00 tool [71] (Figure 3).
3.1. Testing PM and ET Trends from NTS and ETS
To investigate changes affecting the vegetation activity in consequence of climate change, some metrics were extracted from the above-mentioned time series (NTS and ETS). Phenological metrics (PMs) are numerical indices of vegetation activity, corresponding to some key points identified along its annual growing season. Climate change proved to condition such activity shifting and reshaping of past “ordinary” behavior of plants along the year. The following PMs were considered: the start of the growing season (SOS) representing the day of the year (DOY) when phenology is admitted to boost; the end of the season representing the day of the year (DOY) when phenology is admitted to stop; the length of the growing season (LOS) representing the time range (in number of days) separating EOS from SOS; the maximum of NDVI (MAXVI) representing the highest value reached by NDVI during the growing season and proved to be a good predictor of climate change effects on vegetation.
PMs were estimated by TIMESAT 3.3 with STL software [72,73,74,75] that was specifically developed to enable the monitoring of land surface processes by remotely sensed data. TIMESAT 3.3 with STL [76,77,78] iteratively fits and smooths by mathematical functions the yearly NDVI time series, finding the best smoothed approximation of the NDVI along the year at the pixel level. Once raw data have been approximated by the selected fitting function, PMs can be extracted in correspondence to singular points having a phenological meaning (e.g., EOS, SOS, LOS, MAXVI, etc.) along the local temporal profile. In this work, phenological metrics (SOS, EOS, LOS, MAXVI) were estimated at the pixel level by the TIMESAT 3.3 software tool processing the whole NTS. A seasonal trend decomposition by Loess (STL) was adopted to de-trend the NTS pixel profile and remove noise. The seasonal component was refined by Savitzky–Golay filtering to reduce, but not remove, the remaining local strong variations. The yearly growing season was recognized with the whole multi annual time series using the sinusoidal harmonics approach.
With reference to de-trended/filtered NTS profiles, PMs were extracted using the simple relative thresholding approach. The approach assumes that the SOS and EOS correspond to the date (DOY) when the NDVI value reaches a quote (0.5 for this work) of the range [0.2—MAXVI] during the starting and ending phenological phases, respectively. The LOS map was computed by grid differencing from EOS and SOS maps. The MAXVI was found looking for the highest NDVI value (yearly averaged) observed between the SOS and EOS. In order to test the quality of the PMs obtained, they were validated by comparing those obtained from the MODIS phenology product MCD12Q2, with an overall discrepancy between them being less than 5%.
With reference to ETS and separately for H1, H2, H3, the class yearly average ET value was computed and plotted along the years (2000–2019) at regional level, to look for trends.
The analysis was performed at the pixel and year level. Consequently, estimates of all PMs were represented as raster layers, mapping their spatial distribution at the considered year.
Considering both PMs and ET estimates, a first investigation was aimed at removing outliers from data. This was obtained by calibrating a first order polynomial model relating PMs/ET with the years and testing the residuals (model predicted–observed).
where M is the generic PM/ET yearly averaged metric and Y the considered year (in this case of study, the period between 2000–2019).
Data showing an absolute percent residual (ε, Equation (3)) > 100% were labelled as outliers and removed. A new model calibration was consequently run after removal.
Scatterplots are reported in Figure 4; model coefficients and coefficient of determination (R2) and p-values (calculated by PAST software [69]) are reported in Table 4A,B. In order to test the quality of the PMs calculated from the NDVI of MOD13Q1 v.6 collection, the MCD12Q2 v.6 Land Cover Dynamics product (informally known as the MODIS Global Vegetation Phenology product) was adopted to perform the validation.
3.2. Yearly Snowmelt–Snow Cover Timing
The timing of the annual seasonal snowmelt and any related potential change has broad ecological implications and can impact vegetation and human livelihoods, particularly in and around high latitude areas and mountainous systems. For this task, the code available in Google Earth Engine (https://code.earthengine.google.com/2db2624ad10daba32e1155e0dfc4e03a (accessed on 26 January 2021)) was used. It made it possible to produce annual maps reporting the first day within a year where a given pixel reaches zero percent of snow cover and the corresponding snow cover timing.
3.3. Meteorological Data Processing: Ground Stations and CHIRPS
Available daily long-term meteorological data from ground stations of the air temperature were preventively homogenized, to ensure that their variability was due to climatic factors, solely. HOMER and Splidhom methods were used [79,80] and the homogenized series were tested through a quality control process aimed at detecting anomalous records [81]. This process was performed in RStudio v.1.3.1093. Finally, the mean daily air temperature was averaged along the year separately for the three considered altitude classes. Additionally, the CHIRPS data were geometrically oversampled up to 30 m to refine area zonation by applying the bicubic spline interpolation [60] method in order to have grids with the same spatial resolution of the entire collection adopted. The CHIRPS were used only to observe how precipitations were temporally and spatially distributed in the whole territory over the time. For the specific analysis presented in this work, considering altitude bands and land cover (B and R), ground weather stations were adopted because they were spatially more suitable to the different dataset used and the kind of analysis performed.
4. Results
PMs were mapped over the area as raster layers and spatially averaged with respect to H1, H2 and H3 classes (Table 3) by ordinary zonal statistics.
Graphs of Figure 4a–c show that the average PMs values of H1, H2, and H3 significantly changed their values in the last 20 years, with a continuous progressive trend observable for all of them. First order polynomials used to model trends were calibrated after outlier removal. The coefficients are reported in Table 4, together with the corresponding coefficients of determination (R2) and p-value. To operationally synthesize information about strength of changes, in Table 5, yearly rates of increment/decrement of PMs/ET are reported together with total increment/decrement rate in the period from 2000–2019, as derived from the calibrated models.
According to Equation (3), the number of outliers was found to be lower than four (orange points in Figure 4) for all considered parameters (PMs and ET). After, the outlier removal of PMs and ET trends turned to be statistically significant.
The following interpretation of results can be given. In rangelands, the start of the growing season (SOS) significantly anticipated every year during the entire considered period (2000–2019). The yearly anticipation of SOS was estimated to be about 2–3 days per year depending on the altitude class (Table 5). Conversely, the end of the season (EOS), significantly delayed every year during the entire considered period (2000–2019). The yearly delay of EOS was estimated to be about 2.5–3 days per year depending on the altitude class (Table 5). Consequently, the length of the growing season (LOS) significantly increased every year during the entire considered period (2000–2019). The yearly enlargement of LOS was estimated to be about 5–6 days per year depending on the altitude class (Table 5). Similarly, MAXVI showed an increasing trend too, but the yearly difference value was found to be not significant (see Discussion section). In broad-leaved forests, it is possible to observe that the start of the growing season (SOS) significantly anticipated every year during the entire considered period (2000–2019). The annual beginning of the season (SOS) was estimated to be about 1 day per year considering all the altitude classes (Table 5). Conversely, the end of the vegetative season (EOS), significantly delayed every year during the entire considered period (2000–2019). The yearly delay of EOS was estimated to be about 2 days per year in all altitude classes (Table 5). Therefore, the length of the growing season (LOS) significantly increased every year during the entire considered period (2000–2019). The yearly enlargement of LOS was estimated to be about 3.5 days per year per each altitude class (Table 5). Similarly, MAXVI showed an increasing trend too.
The obtained results showed that all PMs and ET significantly changed in the reference period for both broad-leaved forests and rangelands in Aosta Valley. In particular, a progressive linear enlargement of rangelands and softwood growing season was observed for all the considered altitude classes (H1, H2, H3).
Evapotranspiration (ET) significantly increased every year during the entire considered period (2000–2019) for both rangelands and broad-lived forests. In rangelands, the yearly increase in ET was estimated as 0.06 Kg m−2 (H1), 0.04 Kg m−2 (H2) and 0.06 Kg m−2 (H3) per year, respectively (Table 5). While in broad-leaved forests, the annual increase in ET was estimated as 0.08 Kg m−2 (H1), 0.05 Kg m−2 (H2) and 0.06 Kg m−2 (H3) per year, respectively (Table 5). In Table 5, the cumulated differences computed for the whole reference period are also reported.
In order to better understand what factors had strongly influenced the phenology, not only temperature and evapotranspiration were considered. In particular, in this analysis, precipitation and the snowpack persistence were also considered by defining the timing of the annual seasonal snowmelt; that is to say, the yearly first day of no snow cover (Figure 5). By observing the precipitation (including rainfalls and snowfalls) trends in the whole Aosta Valley autonomous region, in the reference period of study, no significant variation or particular trend was observed with a stationary mean trend; nevertheless, a statistically significant decreasing trend was only observed in the H1 class. It is worth remembering that the principal central valley was affected in general by less precipitation than the lateral valleys. In fact, the water supply comes climatically and historically from the side valleys, where rainfall is greatest. These evidences find testimony in the numerous hydraulic works of derivation towards the main valley [82]. This evidence is particularly important in regard to the present and future adaptation of the perspective of vegetation management to climate change.
Finally, by analyzing snowpack persistence defined by the timing of the annual seasonal snowmelt that is calculated as the yearly first day of no snow cover (SC) in all the altitudes bands of the region, we observed a general anticipation trend in snowmelt. In all classes H1, H2, and H3, a linear regression was performed and all the trends were statistically significant, as shown by the p-value retrieved with the Mann–Kendall tests [83,84]. In particular, in H1 (in the bottom valley) the annual first day of no snow cover trend was particularly marked. A possible explanation can be found both in rising temperature anomalies and in the reduction in precipitation, as shown in the present study.
With respect to Aosta Valley, it was observed that between 2000 and 2019 the SOS was anticipated by almost 1–2 months in rangelands (R) and 20–25 days in broadleaved forests (B), the EOS was delayed by about 1.5 months for both B and R and the LOS stretched to about 3–4 months for all the considered altitude classes for both B and R. A cumulated significant increase was observed for both MAXVI and ET, as well. One of the possible factors that could be responsible for this important variation can be reasonably found in the increase in the air temperature that affected both snowpack duration (as described above) and vegetation phenology (whereas water is not a limiting factor). This was confirmed by the analysis of the annual anomaly of the average yearly air temperature in the period from 2000–2019. The air temperature values were obtained from the automatic weather stations and aggregated with respect to the considered altitude classes (H1, H2 and H3). The air temperature class anomalies showed an increasing and statistically significant trend, which increased with the altitude class (Figure 6). Finally, a validation of the PMs retrieved on TIMESAT was performed. To do this, the MODIS product MCD12Q2 in Google Earth Engine was used. It is worth remembering that the MODIS product PMs are obtained starting from the EVI (enhanced vegetation index) and from the product GreenUp, Senescence, EVI_Amplitude and others, to consider SOS, EOS and LOS, respectively. Here, the relative trends between SOS, EOS and LOS are reported (Figure 7).
5. Discussion
PMs and ET modeling and trend analysis based on EO data, with particular concern about multispectral passive remote sensing, proved to provide useful information at seasonal, inter-annual and annual time scales. This can be proficiently used to describe phenomena related to biosphere–atmosphere exchanges of carbon, energy, and water at both regional and global scales. Mountain environments are known to be very sensitive to climate change, in particular to temperature increases [24]. Similar to other alpine areas, Aosta Valley is suffering from an important increase in temperature as a result of climate change, that appears to determine significant changes in the growing season of rangelands. The air temperature increase depends on altitude. The results showed that, in the analyzed period, the average increase in the yearly average temperature was lower than 2 °C, lower than 2.5 °C and higher than 3 °C within altitude classes H1, H2 and H3, respectively. These evidences can be directly related to the described trends of the considered phenological metrics and evapotranspiration. High altitudes are, in fact, more sensitive to rising temperatures that determine a reduced persistence of snowpack (Figure 5) and a lengthening of the growing season, as pointed out in the analysis section. For this reason, they appear among the most severely and rapidly impacted ecosystems, being possibly impacted by any change in temperature and precipitation patterns at all scales [27]. Snow and ice are the main control parameters of the hydrological cycle, particularly of the seasonal runoff, and their variations can condition the entire geosystem (rocks, soils, vegetation, and river discharges). With climate change, water will probably become less available due to global warming and consequences will reach far beyond mountain regions [16]. Similarly, climate change is likely to increase exposure to either natural or economic hazards, all the more so because in many mountain areas, low incomes levels are higher than in lowland areas [7].
The results from this work demonstrate that phenological and evapotranspiration processes are significantly changing in the study area and that these effects are linked to rising temperatures and the timing of annual snowmelt. Changes can be modelled by linear trends, confirming what other similar works already found for different areas [12,13,14,15,16,17,18].
In particular, in Aosta Valley, PMs and ET and snow time were proved to have significantly changed their values in the last 20 years, with a continuous progressive trend observable for all of them.
As previously discussed in the analysis section, it is worth remembering that in terms of strength of changes, in rangelands, an average delay of the EOS was observed of about 2.6 days, while in broad-leaved forests of about 2.3 days, independent from the altitude class. Differently, the SOS in R appears to anticipate by about 2 d/y up to 2000 m ASL. (H1 and H2) and by about 3 d/y at higher altitudes (H3) while in B it appears to anticipate by about 1 d/y at all altitudes considered H1, H2, and H3. Consequently, in R, the LOS proved to enlarge by about 4.7 d/y at lower altitudes (H1 and H2) and by about 6.5 d/y at higher altitudes (H3) while in B proved to enlarge by about 3.8 d/y in all classes. According to Borgogno et al. [85], the potential accuracy of NDVI measurements is about ±0.02; consequently, the estimated yearly variations of MAXVI cannot be considered singularly significant. Nevertheless, the cumulated effects along the entire explored period (2000–2019) showed that MAXVI significantly changed, since the accuracy reference value of ±0.002 was largely overcome. MAXVI variations between 2000 and 2019 appear to be positively higher at lower altitudes (about +0.09) while almost stable as the altitude increases. This could be possibly explained with reference to the previously demonstrated increase in both biomass production (MAXVI) and enlargement of the growing season, that consequently make vegetation need more water yearly. This can be explained by admitting that at lower altitudes in Aosta Valley, grasslands and pastures are often irrigated [86,87]. Consequently, farmers can vary water release regimes to face climate change effects (higher temperatures, in particular) with the result of moving forage yields (that NDVI is a predictor of) to higher values. Differently, where more natural (not managed) systems are located (higher altitudes) the increase in yearly MAXVI can only be related to glacier melting that could compensate the increase in water requirement (as confirmed by the ET analysis) by vegetation: glaciers are, in fact, dramatically reducing in Aosta Valley and as shown here, snow cover time (annual snow melting) is also particularly evident and remarkable. Moreover, another compensating action could come from the surrounding forest areas that have been proved to tolerate summer heatwaves. These results find strong evidence in different studies in the literature [88,89,90,91,92,93,94,95,96,97,98,99]. Concerning on the variation between PMs in H1, H2 and H3 it can be said that in rangelands at different altitudes, the SOS had a more marked variation at high altitudes as can be seen from the gains (in Table 4A) as in the past the snow normally lasted longer, normally at the top rather than at the bottom of the valley. While in regard to EOS there is a more marked gain, as it is reasonable to expect at low altitudes than at high altitudes because of the lower temperatures, the frost and the strong temperature variations at altitude (and possible snowfalls) make the vegetative conditions less favorable. It should also be remembered that at low altitudes, the rangelands represent vegetation with a marked anthropic conditioning (such as the possibility of irrigation) which does not happen at high altitudes (except in H2 but in the height of summer) which makes vegetation a more exploitable resource, long given by the ease of access given to its topography and micro-climate (at the bottom of the valley). In regard to LOS, a more marked gain is observed at high altitudes due to the fact that the shorter duration of the snow and the increase in temperatures favor a more marked lengthening of the season at altitude than in the past (certainly due to the variation of the SOS and EOS). Finally, MAXVI has a more marked gain at low altitudes (H1), for the simple fact that the possibility of conditioning the vegetation with irrigation and agronomic practices significantly affects its productivity and relative vigor. In the case of broad-leaved forests in all classes, a similar gain can be observed in the SOS, EOS and LOS. This is due to the fact that trees are less sensitive and more adapted to environmental variation. Nevertheless, it is interesting to see that in H2 at middle altitude, the MAXVI gain is higher than in H1 and H3, probably because they found a more favorable ecological condition, but more studies can be carried out to find a good answer.
With reference to the ET graphs of Figure 4d,h, significant increasing trends were observed for all height classes. According to the values of Table 4, it can be noted that all height classes behave similarly; water requirement, in a period of 8 days, appears to averagely increase by about 0.05 Kg·m−2 (about 0.5%) every year, for a total increase of about 1 Kg·m−2 in 20 years (2000–2019), corresponding to a percentage difference in water requirement from vegetation of about 8%. This could possibly be explained by the increase in biomass production (well represented by MAXVI) and by the enlargement of the growing season.
The authors are conscious that this work just focuses on a semi-natural component, as rangelands and broad-leaved are. More investigations should be carried out with reference to other land cover classes and with more annual and interannual data at higher resolution. Nevertheless, preliminary results from this work could support breeders, foresters and policymakers to better address their alpine activities such as grazing and management of natural (water included) resources. A radical change is also expected by technicians and institutional subjects in their ordinary procedures, by adapting the scheduling of alpine activities according to this information. It is the authors’ opinion that the greatest limitation to the technology transfer of this type of approach is a lack of “georeferenced” data from ground activities needed to calibrate and validate EO data-based deductions. A great effort is therefore required from involved players to carefully consider the possibility of structuring proper networks for data acquisition and transfer and procedures where georeferencing of ground observation is mandatory. Georeferencing of ground data is, in fact, at the basis of an effective and reliable spatial-based approach such as the one here proposed with a time series, where EO data (especially if available over a long-time span) play a crucial role. Consequently, we expect that future approaches should more properly rely on spatially and temporally distributed data in place of spatially aggregated and temporally distributed ones, such as those adopted in this work.
6. Conclusions
Exploring short-term climate change effects on vegetation through pheno-meteorological modeling and relative trends such as ET and PMs, snowpack time persistence to the ground derived from satellites EO data with different time scales provide useful information about biosphere–atmosphere exchanges of carbon, energy, and water at both regional and global scale. This information is crucial to calibrate adaptive strategies to better face climate change effects in alpine ecosystems. It is worth remembering that mountains are among the most sensitive ecosystems to climate change, especially rising temperature, where effects observed more quickly than in other terrestrial habitats [99,100,101,102,103,104,105,106,107,108,109,110,111,112,113,114] and this study could be considered another one concerning the short-term climate change effect on rangelands’ and broad-lived forests’ phenology in Aosta Valley. In particular, EO data from public and free archives of ready-to-use products such as MOD13Q1 and MOD16A2, proved to support well this type of analysis in spite of their reduced geometric resolution. Specifically, they proved to be useful in analyzing PMs and ET and SC time trends that, if compared with the air temperature trends, could support breeders, foresters and in general policymakers, to better address the management of alpine rangelands and broad-leaved woods. In this work, we showed that in Aosta Valley, phenological and evapotranspiration-related processes and snowpack melting time have been dramatically changed in the last two decades, with generally statistically significant trends. PMs, ET and snow cover time melting from EO data proved to significantly change their values in the last 20 years, with continuous progressive trends. Averagely in the area of study, rangelands and broad-leaved forests, the length of season is getting longer, with a general advance in the SOS (start of the season) and a delay in the EOS (end of the season). With reference to ET, significant increasing trends were generally observed like other areas worldwide [114]. The water requirement from vegetation appeared to have averagely risen up by about 0.05 Kg·m−2 (about 0.5%) per year in the period from 2000–2019, for a total increase of about 1 Kg·m−2 in 20 years (corresponding to a percentage difference in water requirement from vegetation of about 8%). This aspect can be particularly relevant in the bottom of the central valley, where the precipitations have shown a statistically decreasing trend from 2000–2019 (while no significant variation has been observed in the whole territory). Additionally, the snowpack timing persistence to the soil shows a general reduction trend through the years investigated. This pattern, together with an increase in air temperature anomalies, could be one of the main reasons that explain the PMs trends observed with a general boosting on the phenological season. The results encourage the adoption of remote sensing to monitor climate change effects on alpine vegetation, with a particular focus on the relationship between phenology and other abiotic factors, such as snowpack timing and temperature, supporting the idea that, presently, an effective technology transfer is now possible to dynamically support the management of mountain vegetation.
Author Contributions
Conceptualization, T.O.; data curation, T.O.; formal analysis, T.O.; funding acquisition, T.O.; investigation, T.O.; methodology, T.O.; project administration, T.O. and E.B.M.; resources, T.O.; software, T.O.; supervision, E.B.M.; validation, T.O. and E.B.M.; visualization, T.O.; writing—original draft, T.O.; writing—review and editing, T.O. and E.B.M. All authors have read and agreed to the published version of the manuscript.
Funding
This research does not have received any kind of funding.
Data Availability Statement
All the data can be found at GEE https://earthengine.google.com/ (accessed on 26 January 2021) and https://cf.regione.vda.it/ (accessed on 26 January 2021).
Acknowledgments
This work would not have been possible without the huge help provided by Annalisa Viani and to the colleagues of the GEO4Agri DISAFA Lab, in particular: Samuele De Petris, Filippo Sarvia and Federica Ghilardi. A remarkable thanks also to the Unito Green Office Energy and Climate change and INVA VdA colleagues and a huge thanks to professor Claudio Cassardo. Last but not least, we would like to thank all the Google Earth Engine Community and all those who day after day make it possible to use satellite images for free (NASA, ESA e.t.c.) for scientific purposes in order to face climate change and in general challenges to better the world in a scientific perspective!
Conflicts of Interest
The authors declare no conflict of interest.
References
- Hay, S.; Snow, R.; Rogers, D. From Predicting Mosquito Habitat to Malaria Seasons Using Remotely Sensed Data: Practice, Problems and Perspectives. Parasitol. Today 1998, 14, 306–313. [Google Scholar] [CrossRef]
- Zeng, L.; Wardlow, B.D.; Xiang, D.; Hu, S.; Li, D. A review of vegetation phenological metrics extraction using time-series, multispectral satellite data. Remote Sens. Environ. 2020, 237, 111511. [Google Scholar] [CrossRef]
- Stanimirova, R.; Cai, Z.; Melaas, E.K.; Gray, J.M.; Eklundh, L.; Jönsson, P.; Friedl, M.A.; Gray, C. An Empirical Assessment of the MODIS Land Cover Dynamics and TIMESAT Land Surface Phenology Algorithms. Remote Sens. 2019, 11, 2201. [Google Scholar] [CrossRef] [Green Version]
- Liu, Q.; Piao, S.; Janssens, I.A.; Fu, Y.; Peng, S.; Lian, X.; Ciais, P.; Myneni, R.B.; Peñuelas, J.; Wang, T. Extension of the growing season increases vegetation exposure to frost. Nat. Commun. 2018, 9, 426. [Google Scholar] [CrossRef] [Green Version]
- Xie, J.; Jonas, T.; Rixen, C.; de Jong, R.; Garonna, I.; Notarnicola, C.; Asam, S.; Schaepman, M.E.; Kneubühler, M. Land surface phenology and greenness in Alpine grasslands driven by seasonal snow and meteorological factors. Sci. Total Environ. 2020, 725, 138380. [Google Scholar] [CrossRef]
- Inouye, D.W.; Wielgolaski, F.E. Phenology at High Altitudes. Phenology: An Integrative Environmental Science; Springer Science and Business Media LLC: Berlin/Heidelberg, Germany, 2013; pp. 249–272. [Google Scholar]
- Beniston, M.; Fox, D.G.; Adhikary, S.; Andressen, R.; Guisan, A.; Holten, J.I.; Innes, J.; Maitima, J.; Price, M.F.; Tessier, L.; et al. Impacts of climate change on mountain regions. Climate Change 1995: Impacts, Adaptations and Mitigation of Climate Change: Scientific-Technical Analyses; Cambridge University Press: Cambridge, UK, 1996; pp. 191–213. [Google Scholar]
- Palazzi, E.; Mortarini, L.; Terzago, S.; von Hardenberg, J. Impact of the model resolution on the simulation of elevation-dependent warming in the Tibetan Plateau-Himalayas, Greater Alpine Region, and Rocky Mountains. In Proceedings of the 19th EGU General Assembly, EGU2017, Vienna, Austria, 23–28 April 2017. [Google Scholar]
- Pasetto, D.; Arenas-Castro, S.; Bustamante, J.; Casagrandi, R.; Chrysoulakis, N.; Cord, A.F.; Dittrich, A.; Domingo-Marimon, C.; El Serafy, G.; Karnieli, A.; et al. Integration of satellite remote sensing data in ecosystem modelling at local scales: Practices and trends. Methods Ecol. Evol. 2018, 9, 1810–1821. [Google Scholar] [CrossRef] [Green Version]
- Cayan, D.R.; Dettinger, M.D.; Kammerdiener, S.A.; Caprio, J.M.; Peterson, D.H. Changes in the Onset of Spring in the Western United States. Bull. Am. Meteorol. Soc. 2001, 82, 399–415. [Google Scholar] [CrossRef] [Green Version]
- Keenan, T.F.; Gray, J.M.N.T.; Friedl, M.A.; Toomey, M.; Bohrer, G.; Hollinger, D.Y.; Munger, J.W.; O’Keefe, J.; Schmid, H.P.; Wing, I.S.; et al. Net carbon uptake has increased through warming-induced changes in temperate forest phenology. Nat. Clim. Chang. 2014, 4, 598–604. [Google Scholar] [CrossRef]
- Inouye, D.W.; Wielgolaski, F.E. High Altitude Climates. In Sabkha Ecosystems; Springer International Publishing: Berlin/Heidelberg, Germany, 2003; pp. 195–214. [Google Scholar]
- Giménez-Benavides, L.; Escudero, A.; Iriondo, J.M. Reproductive limits of a late-flowering high-mountain Mediterranean plant along an elevational climate gradient. New Phytol. 2006, 173, 367–382. [Google Scholar] [CrossRef] [Green Version]
- Saavedra, F.; Inouye, D.W.; Price, M.V.; Harte, J. Changes in flowering and abundance of Delphinium nuttallianum (Ranunculaceae) in response to a subalpine climate warming experiment. Glob. Chang. Biol. 2003, 9, 885–894. [Google Scholar] [CrossRef]
- Inouye, D.W.; Barr, B.; Armitage, K.B.; Inouye, B.D. Climate change is affecting altitudinal migrants and hibernating species. Proc. Natl. Acad. Sci. USA 2000, 97, 1630–1633. [Google Scholar] [CrossRef] [Green Version]
- Migliavacca, M.; Sonnentag, O.; Keenan, T.F.; Cescatti, A.; O’Keefe, J.; Richardson, A.D. On the Uncertainty of Phenological Responses to Climate Change, and Implications for a Terrestrial Biosphere Model. Biogeosciences 2012, 9, 2063–2083. [Google Scholar] [CrossRef] [Green Version]
- Baldocchi, D.D.; Xu, L.; Kiang, N. How Plant Functional-Type, Weather, Seasonal Drought, and Soil Physical Properties Alter Water and Energy Fluxes of an Oak–Grass Savanna and an Annual Grassland. Agric. For. Meteorol. 2004, 123, 13–39. [Google Scholar] [CrossRef] [Green Version]
- Richardson, A.D.; Keenan, T.F.; Migliavacca, M.; Ryu, Y.; Sonnentag, O.; Toomey, M. Climate Change, Phenology, and Phenological Control of Vegetation Feedbacks to the Climate System. Agric. For. Meteorol. 2013, 169, 156–173. [Google Scholar] [CrossRef]
- Hufkens, K.; Friedl, M.; Sonnentag, O.; Braswell, B.H.; Milliman, T.; Richardson, A.D. Linking Near-Surfaceand Satellite Remote Sensing Measurements of Deciduous Broadleaf Forest Phenology. Remote Sens. Environ. 2012, 117, 307–321. [Google Scholar] [CrossRef]
- Menzel, A.; Sparks, T.H.; Estrella, N.; Koch, E.; Aasa, A.; Ahas, R.; Alm-Kübler, K.; Bissolli, P.; Braslavská, O.; Briede, A.; et al. European phenological response to climate change matches the warming pattern. Glob. Chang. Biol. 2006, 12, 1969–1976. [Google Scholar] [CrossRef]
- Walther, G.-R.; Post, E.; Convey, P.; Menzel, A.; Parmesan, C.; Beebee, T.J.C.; Fromentin, J.-M.; Hoegh-Guldberg, O.; Bairlein, F. Ecological responses to recent climate change. Nat. Cell Biol. 2002, 416, 389–395. [Google Scholar] [CrossRef] [PubMed]
- Jin, H.; Jönsson, A.M.; Olsson, C.; Lindström, J.; Jönsson, P.; Eklundh, L. New Satellite-Based Estimates Show Significant Trends in Spring Phenology and Complex Sensitivities to Temperature and Precipitation at Northern European Latitudes. Int. J. Biometeorol. 2019, 63, 763–775. [Google Scholar] [CrossRef] [Green Version]
- Peñuelas, J.; Rutishauser, T.; Filella, I. Phenology Feedbacks on Climate Change. Science 2009, 324, 887–888. [Google Scholar] [CrossRef] [Green Version]
- Parmesan, C.; Yohe, G. A globally coherent fingerprint of climate change impacts across natural systems. Nat. Cell Biol. 2003, 421, 37–42. [Google Scholar] [CrossRef]
- Richardson, A.D.; Bailey, A.S.; Denny, E.G.; Martin, C.W.; O’Keefe, J. Phenology of a northern hardwood forest canopy. Glob. Chang. Biol. 2006, 12, 1174–1188. [Google Scholar] [CrossRef] [Green Version]
- Reed, B.C.; Brown, J.F.; Vanderzee, D.; Loveland, T.R.; Merchant, J.W.; Ohlen, D.O. Measuring phenological variability from satellite imagery. J. Veg. Sci. 1994, 5, 703–714. [Google Scholar] [CrossRef]
- Stöckli, R.; Vidale, P.L. European plant phenology and climate as seen in a 20-year AVHRR land-surface parameter dataset. Int. J. Remote Sens. 2004, 25, 3303–3330. [Google Scholar] [CrossRef]
- Pereira, H.M.; Leadley, P.W.; Proença, V.; Alkemade, R.; Scharlemann, J.P.W.; Fernandez-Manjarrés, J.F.; Araújo, M.B.; Balvanera, P.; Biggs, R.; Cheung, W.W.L.; et al. Scenarios for Global Biodiversity in the 21st Century. Science 2010, 330, 1496–1501. [Google Scholar] [CrossRef] [PubMed] [Green Version]
- Trenberth, K.E.; Jones, P.D.; Ambenje, P.; Bojariu, R.; Easterling, D.; Klein Tank, A.; Parker, D.; Rahimzadeh, F.; Rusticucci, M.; Soden, B.; et al. Observations: Surface and Atmospheric Climate Change. Chapter 3; IPCC: London, UK, 2007; Available online: http://www.ipcc.ch/pdf/assessment-report/ar4/wg1/ar4-wg1-chapter3.pdf (accessed on 26 January 2020).
- Dingman, S.L. Physical Hydrology, 3rd ed.; Waveland Press: Long Grove, IL, USA, 2015. [Google Scholar]
- Trenberth, K.E.; Smith, L.; Qian, T.; Dai, A.; Fasullo, J. Estimates of the Global Water Budget and Its Annual Cycle Using Observational and Model Data. J. Hydrometeorol. 2007, 8, 758–769. [Google Scholar] [CrossRef]
- Wang, D.; Hejazi, M. Quantifying the relative contribution of the climate and direct human impacts on mean annual streamflow in the contiguous United States. Water Resour. Res. 2011, 47. [Google Scholar] [CrossRef] [Green Version]
- Chou, C.; Neelin, J.D.; Chen, C.-A.; Tu, J.-Y. Evaluating the “Rich-Get-Richer” Mechanism in Tropical Precipitation Change under Global Warming. J. Clim. 2009, 22, 1982–2005. [Google Scholar] [CrossRef]
- Zhou, L.; Tian, Y.; Myneni, R.B.; Ciais, P.; Saatchi, S.; Liu, Y.Y.; Piao, S.; Chen, H.; Vermote, E.F.; Song, C.; et al. Widespread decline of Congo rainforest greenness in the past decade. Nat. Cell Biol. 2014, 509, 86–90. [Google Scholar] [CrossRef]
- Held, I.M.; Soden, B.J. Water vapor feedback and global warming. Annu. Rev. Energy Environ. 2000, 25, 441–475. [Google Scholar] [CrossRef] [Green Version]
- Jönsson, P.; Eklundh, L. Seasonality extraction by function fitting to time-series of satellite sensor data. IEEE Trans. Geosci. Remote Sens. 2002, 40, 1824–1832. [Google Scholar] [CrossRef]
- Zhang, X.; Friedl, M.A.; Schaaf, C.B.; Strahler, A.H.; Hodges, J.C.F.; Gao, F.; Reed, B.C.; Huete, A. Monitoring vegetation phenology using MODIS. Remote Sens. Environ. 2003, 84, 471–475. [Google Scholar] [CrossRef]
- Ganguly, S.; Friedl, M.A.; Tan, B.; Zhang, X.; Verma, M. Land Surface Phenology from MODIS: Characterization of the Collection 5 Global Land Cover Dynamics Product. Remote Sens. Environ. 2010, 114, 1805–1816. [Google Scholar] [CrossRef] [Green Version]
- Lessio, A.; Fissore, V.; Borgogno-Mondino, E. Preliminary Tests and Results Concerning Integration of Sentinel-2 and Landsat-8 OLI for Crop Monitoring. J. Imaging 2017, 3, 49. [Google Scholar] [CrossRef] [Green Version]
- Testa, S.; Borgogno-Mondino, E.; Pedroli, C. Correcting MODIS 16-day composite NDVI time-series with actual acquisition dates. Eur. J. Remote Sens. 2014, 47, 285–305. [Google Scholar] [CrossRef]
- Testa, S.; Boschetti, L.; Mondino, E.B. Modis EVI, NDVI, WDRVI, daily and composite: Looking for the best choice to estimate phenological parameters from deciduous forests. In Proceedings of the 2015 IEEE International Geoscience and Remote Sensing Symposium (IGARSS), Milan, Italy, 26–31 July 2015; pp. 4617–4620. [Google Scholar]
- Fisher, J.I.; Mustard, J.F.; Vadeboncoeur, M.A. Green leaf phenology at Landsat resolution: Scaling from the field to the satellite. Remote Sens. Environ. 2006, 100, 265–279. [Google Scholar] [CrossRef]
- Melaas, E.K.; Friedl, M.A.; Zhu, Z. Detecting interannual variation in deciduous broadleaf forest phenology using Landsat TM/ETM+ data. Remote Sens. Environ. 2013, 132, 176–185. [Google Scholar] [CrossRef]
- Melaas, E.K.; Sulla-Menashe, D.; Friedl, M.A. Multidecadal Changes and Interannual Variation in Springtime Phenology of North American Temperate and Boreal Deciduous Forests. Geophys. Res. Lett. 2018, 45, 2679–2687. [Google Scholar] [CrossRef]
- Jönsson, P.; Cai, Z.; Melaas, E.; Friedl, M.A.; Eklundh, L. A Method for Robust Estimation of Vegetation Seasonality from Landsat and Sentinel-2 Time Series Data. Remote Sens. 2018, 10, 635. [Google Scholar] [CrossRef] [Green Version]
- Jönsson, P.; Eklundh, L. TIMESAT—a program for analyzing time-series of satellite sensor data. Comput. Geosci. 2004, 30, 833–845. [Google Scholar] [CrossRef] [Green Version]
- Beck, P.S.; Atzberger, C.; Høgda, K.A.; Johansen, B.; Skidmore, A.K. Improved monitoring of vegetation dynamics at very high latitudes: A new method using MODIS NDVI. Remote Sens. Environ. 2006, 100, 321–334. [Google Scholar] [CrossRef]
- Rubel, F.; Brugger, K.; Haslinger, K.; Auer, I. The climate of the European Alps: Shift of very high resolution Köppen-Geiger climate zones 1800–2100. Meteorol. Z. 2017, 26, 115–125. [Google Scholar] [CrossRef]
- Didan, K. MOD13Q1 MODIS/Terra Vegetation Indices 16-Day L3 Global 250m SIN Grid V006, V006 ed.; NASA EOSDIS LP DAAC: Sioux Falls, SD, USA, 2015. [CrossRef]
- Gorelick, N.; Hancher, M.; Dixon, M.; Ilyushchenko, S.; Thau, D.; Moore, R. Google Earth Engine: Planetary-scale geospatial analysis for everyone. Remote Sens. Environ. 2017, 202, 18–27. [Google Scholar] [CrossRef]
- Schafer, R.W. What is a Savitzky-Golay filter? IEEE Signal Process. Mag. 2011, 28, 111–117. [Google Scholar] [CrossRef]
- Press, W.H.; Teukolsky, S.A. Savitzky-Golay Smoothing Filters. Comput. Phys. 1990, 4, 669. [Google Scholar] [CrossRef]
- O’Connor, A. ENVI Services Engine: Earth and planetary image processing for the cloud. American Geophysical Union, Poster IN21C-1490 (2012). Available online: https://www.l3harrisgeospatial.com/portals/0/pdfs/AGUPoster2012_asoconnor.pdf (accessed on 26 January 2020).
- Running, S.; Mu, Q.; Zhao, M. MOD16A2 MODIS/Terra Net Evapotranspiration 8-Day L4 Global 500m SIN Grid V006; NASA EOSDIS Land Processes DAAC: Sioux Falls, SD, USA. [CrossRef]
- Cai, J.; Liu, Y.; Lei, T.; Pereira, L.S. Estimating reference evapotranspiration with the FAO Penman–Monteith equation using daily weather forecast messages. Agric. For. Meteorol. 2007, 145, 22–35. [Google Scholar] [CrossRef]
- Leuning, R.; Zhang, Y.Q.; Rajaud, A.; Cleugh, H.; Tu, K. A simple surface conductance model to estimate regional evaporation using MODIS leaf area index and the Penman-Monteith equation. Water Resour. Res. 2008, 44. [Google Scholar] [CrossRef]
- Orusa, T.; Borgogno-Mondino, E. Landsat 8 thermal data to support urban management and planning in the climate change era: A case study in Torino area, NW Italy. In Remote Sensing Technologies and Applications in Urban Environments IV; SPIE-Intl Soc Optical Eng: Bellingham, WA, USA, 2019; Volume 11157, p. 111570O. [Google Scholar]
- Farr, T.G.; Rosen, P.A.; Caro, E.; Crippen, R.; Duren, R.; Hensley, S.; Kobrick, M.; Paller, M.; Rodriguez, E.; Roth, L.; et al. The Shuttle Radar Topography Mission. Rev. Geophys. 2007, 45. [Google Scholar] [CrossRef] [Green Version]
- Werner, M. Shuttle Radar Topography Mission (SRTM) Mission Overview. Freq. 2001, 55, 75–79. [Google Scholar] [CrossRef]
- Wang, Q.; Ward, R.K. A new orientation-adaptive interpolation method. IEEE Trans. Image Process. 2007, 16, 889–900. [Google Scholar] [CrossRef]
- Time Series Missing Value Imputation, Version 3.2; Available online: https://github.com/SteffenMoritz/imputeTS (accessed on 26 January 2020).
- Gray, J.; Sulla-Menashe, D.; Friedl, M. MCD12Q2 MODIS/Terra+Aqua Land Cover Dynamics Yearly L3 Global 500m SIN Grid V006; NASA EOSDIS Land Processes DAAC: Sioux Falls, SD, USA, 2019.
- Funk, C.; Peterson, P.; Landsfeld, M.; Pedreros, D.; Verdin, J.; Shukla, S.; Husak, G.; Rowland, J.; Harrison, L.; Hoell, A.; et al. The climate hazards infrared precipitation with stations—A new environmental record for monitoring extremes. Sci. Data 2015, 2, 150066. [Google Scholar] [CrossRef] [Green Version]
- Hall, D.K.; Salomonson, V.V.; Riggs, G.A. MODIS/Terra Snow Cover Daily L3 Global 500m Grid; Version 6; NASA National Snow and Ice Data Center Distributed Active Archive Center: Boulder, CO, USA, 2016. [CrossRef]
- Bossard, M.; Feranec, J.; Otahel, J. CORINE Land Cover Technical Guide: Addendum 2000; EEA: Copenhagen, Denmark, 2000. [Google Scholar]
- Büttner, G.; Feranec, J.; Jaffrain, G.; Mari, L.; Maucha, G.; Soukup, T. The CORINE land cover 2000 project. EARSeL eProc. 2004, 3, 331–346. [Google Scholar]
- Copernicus CORINE Land Rover. Available online: https://developers.google.com/earth-engine/datasets/catalog/COPERNICUS_CORINE_V20_100m (accessed on 26 January 2020).
- Dati osservati del Centro Funzionale RAVADA. Available online: http://presidi2.regione.vda.it/str_dataview (accessed on 26 January 2020).
- Hammer, Ø.; David, A.T.H.; Paul, D.R. PAST: Paleontological statistics software package for education and data analysis. Palaeontol. Electron. 2001, 4, 9. [Google Scholar]
- Team, QGIS Delopment. QGIS Geographic Information System. Open Source Geospatial Foundation Project (2016). Available online: https://www.qgis.org/en/site/ (accessed on 26 January 2020).
- Conrad, O.; Bechtel, B.; Bock, M.; Dietrich, H.; Fischer, E.; Gerlitz, L.; Wehberg, J.; Wichmann, V.; Böhner, J. System for Automated Geoscientific Analyses (SAGA) v. 2.1.4. Geosci. Model Dev. 2015, 8, 1991–2007. [Google Scholar] [CrossRef] [Green Version]
- Sarvia, F.; De Petris, S.; Borgogno-Mondino, E. Multi-scale remote sensing to support insurance policies in agriculture: From mid-term to instantaneous deductions. GIScience Remote Sens. 2020, 57, 770–784. [Google Scholar] [CrossRef]
- Jönsson, P.; Eklundh, L. TIMESAT 3.1 Software Manual; Lund University: Lund, Sweden, 2012; pp. 1–82. [Google Scholar]
- Jönsson, P.; Eklundh, L. TIMESAT—A Program for Analyzing Time-Series of Satellite Sensor Data. Users Guide for TIMESAT 2.3. Available online: https://muep.mau.se/handle/2043/4975 (accessed on 26 January 2020).
- Tan, B.; Morisette, J.T.; Wolfe, R.E.; Gao, F.; Ederer, G.A.; Nightingale, J.; Pedelty, J.A. An Enhanced TIMESAT Algorithm for Estimating Vegetation Phenology Metrics from MODIS Data. IEEE J. Sel. Top. Appl. Earth Obs. Remote Sens. 2011, 4, 361–371. [Google Scholar] [CrossRef]
- Eklundh, L.; Jönsson, P. A new spatio-temporal smoother for extracting vegetation seasonality with TIMESAT. In Proceedings of the 35th International Symposium on Remote Sensing of Environment, Stockholm, Sweden, 5 May 2013. [Google Scholar]
- Cleveland, R.B.; Cleveland, W.S.; McRae, J.E.; Terpenning, I. STL: A seasonal-trend decomposition. J. Off. Stat. 1990, 6, 3–73. [Google Scholar]
- Jia, K.; Liang, S.; Wei, X.; Yao, Y.; Su, Y.; Jiang, B.; Wang, X. Land Cover Classification of Landsat Data with Phenological Features Extracted from Time Series MODIS NDVI Data. Remote Sens. 2014, 6, 11518–11532. [Google Scholar] [CrossRef] [Green Version]
- Caussinus, H.; Mestre, O. Detection and correction of artificial shifts in climate series. J. R. Stat. Soc. Ser. C Appl. Stat. 2004, 53, 405–425. [Google Scholar] [CrossRef]
- Venema, V.K.C.; Mestre, O.; Aguilar, E.; Auer, I.; Guijarro, J.A.; Domonkos, P.; Vertacnik, G.; Szentimrey, T.; Stepanek, P.; Zahradnicek, P.; et al. Benchmarking homogenization algorithms for monthly data. Clim. Past 2012, 8, 89–115. [Google Scholar] [CrossRef] [Green Version]
- Haidu, I.; Magyari-Sáska, Z. Animated sequential trend signal detection in finite samples. In Proceedings of the ITI 2009 31st International Conference on Information Technology Interfaces, Cavtat, Croatia, 22–25 June 2009; pp. 249–254. [Google Scholar]
- Fratianni, S.; Acquaotta, F. The Climate of Italy. In Landscapes and Landforms of Norway; Springer International Publishing: Berlin/Heidelberg, Germany, 2017; pp. 29–38. [Google Scholar]
- Sheng, Y.; Wang, C.Y. The Mann-Kendall test modified by effective sample size to detect trend in serially correlated hydrological series. Water Resour. Manag. 2004, 18, 201–218. [Google Scholar]
- Orusa, T.; Orusa, R.; Viani, A.; Carella, E.; Mondino, E.B. Geomatics and EO Data to Support Wildlife Diseases Assessment at Landscape Level: A Pilot Experience to Map Infectious Keratoconjunctivitis in Chamois and Phenological Trends in Aosta Valley (NW Italy). Remote Sens. 2020, 12, 3542. [Google Scholar] [CrossRef]
- Borgogno-Mondino, E.; Lessio, A.; Gomarasca, M.A. A fast operative method for NDVI uncertainty estimation and its role in vegetation analysis. Eur. J. Remote Sens. 2016, 49, 137–156. [Google Scholar] [CrossRef]
- Biddoccu, M.; Zecca, O.; Audisio, C.; Godone, F.; Barmaz, A.; Cavallo, E. Assessment of Long-Term Soil Erosion in a Mountain Vineyard, Aosta Valley (NW Italy). Land Degrad. Dev. 2018, 29, 617–629. [Google Scholar] [CrossRef]
- Moreno, D.; d’Aosta, V. Italian Historical Rural Landscapes; Springer: Dordrecht, The Netherlands, 2013; pp. 167–173. [Google Scholar]
- Cremonese, E.; Filippa, G.; Galvagno, M.; Siniscalco, C.; Oddi, L.; di Cella, U.M.; Migliavacca, M. Heat wave hinders green wave: The impact of climate extreme on the phenology of a mountain grassland. Agric. For. Meteorol. 2017, 247, 320–330. [Google Scholar] [CrossRef]
- Migliavacca, M.; Galvagno, M.; Cremonese, E.; Rossini, M.; Meroni, M.; Sonnentag, O.; Cogliati, S.; Manca, G.; Diotri, F.; Busetto, L.; et al. Using digital repeat photography and eddy covariance data to model grassland phenology and photosynthetic CO2 uptake. Agric. For. Meteorol. 2011, 151, 1325–1337. [Google Scholar] [CrossRef]
- Julitta, T.; Cremonese, E.; Migliavacca, M.; Colombo, R.; Galvagno, M.; Siniscalco, C.; Rossini, M.; Fava, F.; Cogliati, S.; Di Cella, U.M.; et al. Using digital camera images to analyse snowmelt and phenology of a subalpine grassland. Agric. For. Meteorol. 2014, 198–199, 116–125. [Google Scholar] [CrossRef]
- Migliavacca, M.; Reichstein, M.; Richardson, A.D.; Mahecha, M.D.; Cremonese, E.; Delpierre, N.; Galvagno, M.; Law, B.E.; Wohlfahrt, G.; Black, T.A.; et al. Influence of physiological phenology on the seasonal pattern of ecosystem respiration in deciduous forests. Glob. Chang. Biol. 2015, 21, 363–376. [Google Scholar] [CrossRef]
- Di Cella, R.C.U.M. Phenological monitoring of grassland and larch in the Alps from Terra and Aqua MODIS images. Ital. J. Remote Sens. 2011, 83–96. [Google Scholar] [CrossRef]
- Colombo, R.; Busetto, L.; Migliavacca, M.; Cremonese, E.; Meroni, M.; Galvagno, M.; Rossini, M.; Siniscalco, C.; Di Cella, U.M. On the spatial and temporal variability of Larch phenological cycle in mountainous areas. Ital. J. Remote Sens. 2009, 41, 79–96. [Google Scholar] [CrossRef]
- Filippa, G.; Cremonese, E.; Galvagno, M.; Migliavacca, M.; Di Cella, U.M.; Petey, M.; Siniscalco, C. Five years of phenological monitoring in a mountain grassland: Inter-annual patterns and evaluation of the sampling protocol. Int. J. Biometeorol. 2015, 59, 1927–1937. [Google Scholar] [CrossRef]
- Diolaiuti, G.; Bocchiola, D.; Vagliasindi, M.; D’Agata, C.; Smiraglia, C. The 1975–2005 glacier changes in Aosta Valley (Italy) and the relations with climate evolution. Prog. Phys. Geogr. Earth Environ. 2012, 36, 764–785. [Google Scholar] [CrossRef]
- Haeberli, W.; Hoelzle, M.; Paul, F.; Zemp, M. Integrated monitoring of mountain glaciers as key indicators of global climate change: The European Alps. Ann. Glaciol. 2007, 46, 150–160. [Google Scholar] [CrossRef] [Green Version]
- Calanca, P.; Roesch, A.; Jasper, K.; Wild, M. Global Warming and the Summertime Evapotranspiration Regime of the Alpine Region. Clim. Chang. 2006, 79, 65–78. [Google Scholar] [CrossRef]
- Fissore, V.; Motta, R.; Palik, B.; Mondino, E.B. The role of spatial data and geomatic approaches in treeline mapping: A review of methods and limitations. Eur. J. Remote Sens. 2015, 48, 777–792. [Google Scholar] [CrossRef] [Green Version]
- Borgogno-Mondino, E.; De Palma, L.; Novello, V. Investigating Sentinel 2 Multispectral Imagery Efficiency in Describing Spectral Response of Vineyards Covered with Plastic Sheets. Agronomy 2020, 10, 1909. [Google Scholar] [CrossRef]
- Goulden, M.L.; Bales, R.C. Mountain runoff vulnerability to increased evapotranspiration with vegetation expansion. Proc. Natl. Acad. Sci. USA 2014, 111, 14071–14075. [Google Scholar] [CrossRef] [Green Version]
- Steffen, W.; Richardson, K.; Rockström, J.; Cornell, S.E.; Fetzer, I.; Bennett, E.M.; Biggs, R.; Carpenter, S.R.; De Vries, W.; De Wit, C.A.; et al. Planetary boundaries: Guiding human development on a changing planet. Science 2015, 347, 1259855. [Google Scholar] [CrossRef] [Green Version]
- Rockström, J.; Steffen, W.; Noone, K.; Persson, Å.; Chapin, F.S., III; Lambin, E.; Lenton, T.M.; Scheffer, M.; Folke, C.; Schellnhuber, H.J.; et al. Planetary Boundaries: Exploring the Safe Operating Space for Humanity. Ecol. Soc. 2009, 14. [Google Scholar] [CrossRef]
- O’Neill, D.W.; Fanning, A.L.; Lamb, W.F.; Steinberger, J.K. A good life for all within planetary boundaries. Nat. Sustain. 2018, 1, 88–95. [Google Scholar] [CrossRef] [Green Version]
- Colwell Robert, N. Manual of Remote Sensing; Springer: Berlin/Heidelberg, Germany, 1986. [Google Scholar]
- Cardinale, B.J.; Duffy, J.E.; Gonzalez, A.; Hooper, D.U.; Perrings, C.; Venail, P.; Narwani, A.; Mace, G.M.; Tilman, D.; Wardle, D.A.; et al. Biodiversity loss and its impact on humanity. Nat. Cell Biol. 2012, 486, 59–67. [Google Scholar] [CrossRef]
- Fort, M. Impact of climate change on mountain environment dynamics. An introduction. J. Alp. Res. 2015, 103, 45–46. [Google Scholar] [CrossRef] [Green Version]
- Terzago, S.; Andreoli, V.; Arduini, G.; Balsamo, G.; Campo, L.; Cassardo, C.; Cremonese, E.; Dolia, D.; Gabellani, S.; Von Hardenberg, J.; et al. Sensitivity of snow models to the accuracy of meteorological forcings in mountain environments. Hydrol. Earth Syst. Sci. 2020, 24, 4061–4090. [Google Scholar] [CrossRef]
- Cassardo, C.; Park, S.K.; Galli, M.; O, S. Climate change over the high-mountain versus plain areas: Effects on the land surface hydrologic budget in the Alpine area and northern Italy. Hydrol. Earth Syst. Sci. 2018, 22, 3331–3350. [Google Scholar] [CrossRef] [Green Version]
- Mountain Research Initiative EDW Working Group; Pepin, N.; Bradley, R.S.; Diaz, H.F.; Baraer, M.; Caceres, E.B.; Forsythe, N.; Fowler, H.J.; Greenwood, G.; Hashmi, M.Z.; et al. Elevation-dependent warming in mountain regions of the world. Nat. Clim. Chang. 2015, 5, 424–430. [Google Scholar] [CrossRef] [Green Version]
- Bravo, D.N.; Araújo, M.B.; Lasanta, T.; Moreno, J.I.L. Climate Change in Mediterranean Mountains during the 21st Century. Ambio 2008, 37, 280–285. [Google Scholar] [CrossRef]
- Cassardo, C.; Jones, J.A.A. Managing Water in a Changing World. Water 2011, 3, 618–628. [Google Scholar] [CrossRef] [Green Version]
- Sarvia, F.; Xausa, E.; De Petris, S.; Cantamessa, G.; Borgogno-Mondino, E. A Possible Role of Copernicus Sentinel-2 Data to Support Common Agricultural Policy Controls in Agriculture. Agronomy 2021, 11, 110. [Google Scholar] [CrossRef]
- Pauli, H.; Gottfried, M.; Grabherr, G. Effects of climate change on the alpine and nival vegetation of the Alps. J. Mt. Ecol. 2014, 7, 33. [Google Scholar]
- Valipour, M.; Bateni, S.M.; Sefidkouhi, M.A.G.; Raeini-Sarjaz, M.; Singh, V.P. Complexity of Forces Driving Trend of Reference Evapotranspiration and Signals of Climate Change. Atmosphere 2020, 11, 1081. [Google Scholar] [CrossRef]
Figure 1.
The study area corresponds to the whole Aosta Valley. It is located in the northwestern Alps of Italy, close to France and Switzerland. Source: Tommaso Orusa.
Figure 1.
The study area corresponds to the whole Aosta Valley. It is located in the northwestern Alps of Italy, close to France and Switzerland. Source: Tommaso Orusa.

Figure 2.
Map showing the spatial distribution of land cover classes (from the Coordination of Information on the Environment (CORINE) land cover map) that were considered for the study: pastures (code 231), broad-leaved forests (code 311), natural grasslands (code 321) and moors/heathland (code 322).
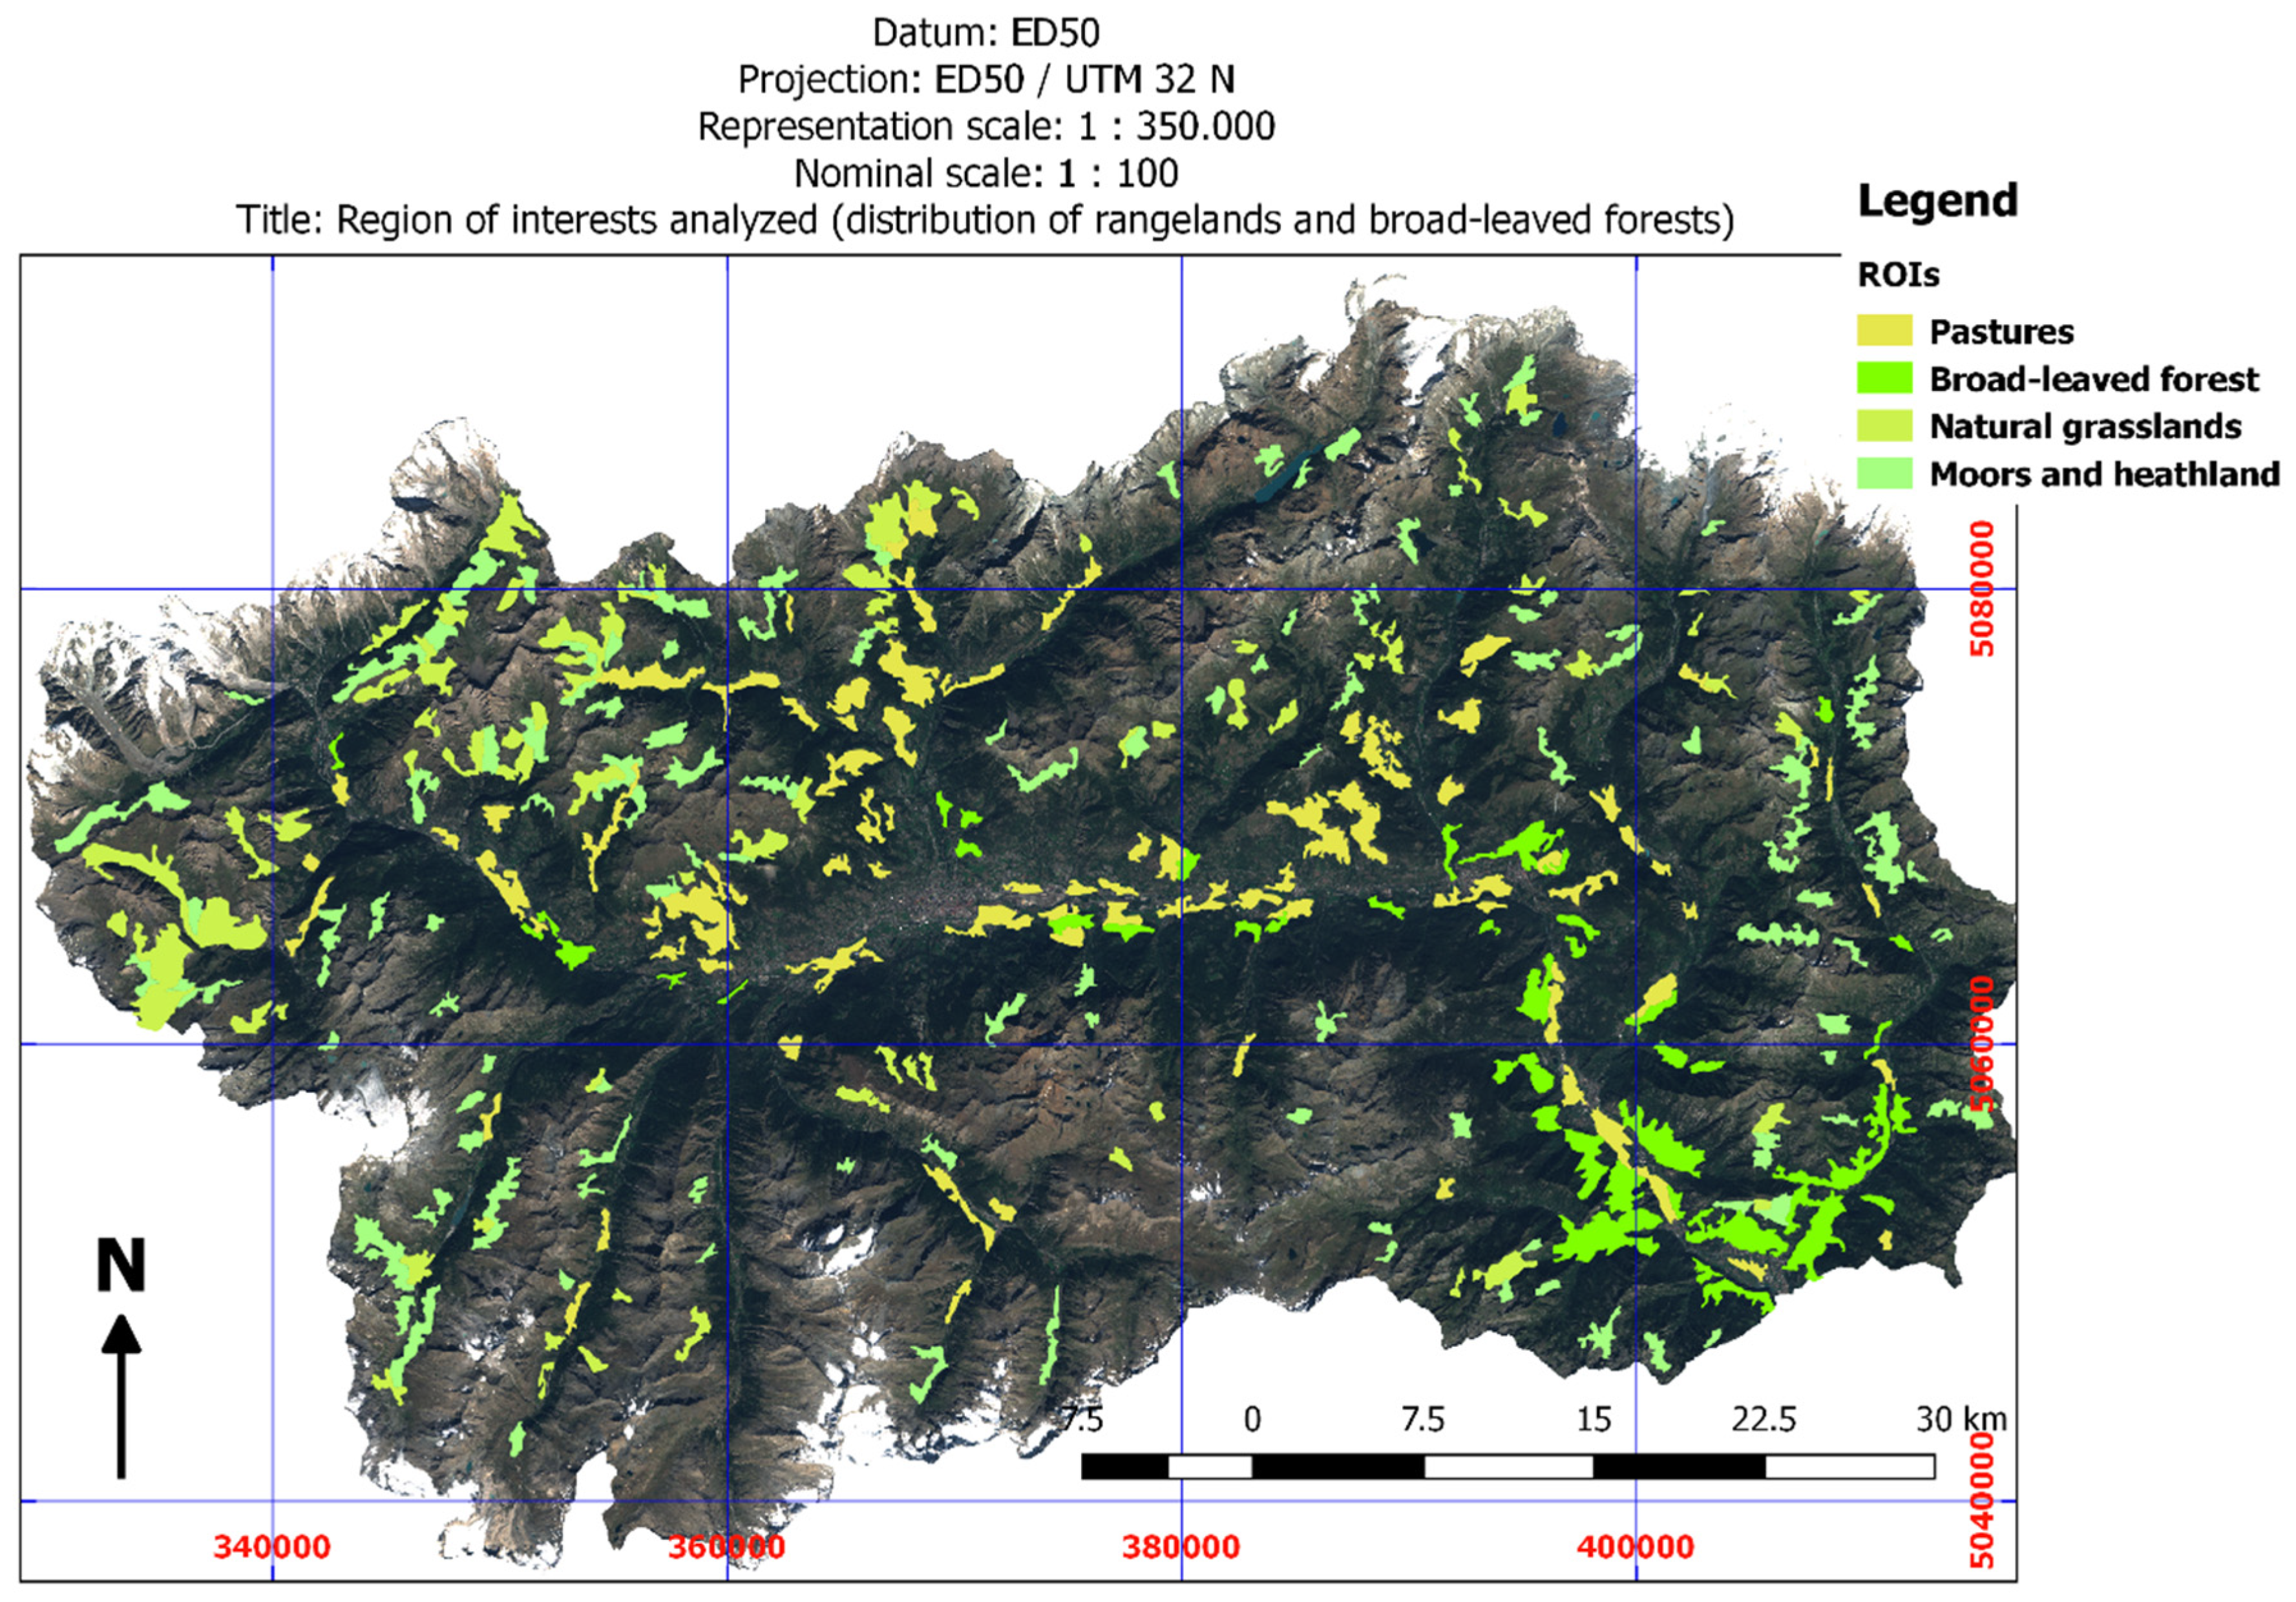
Figure 3.
Aosta Valley height classes: H1, H2, H3.
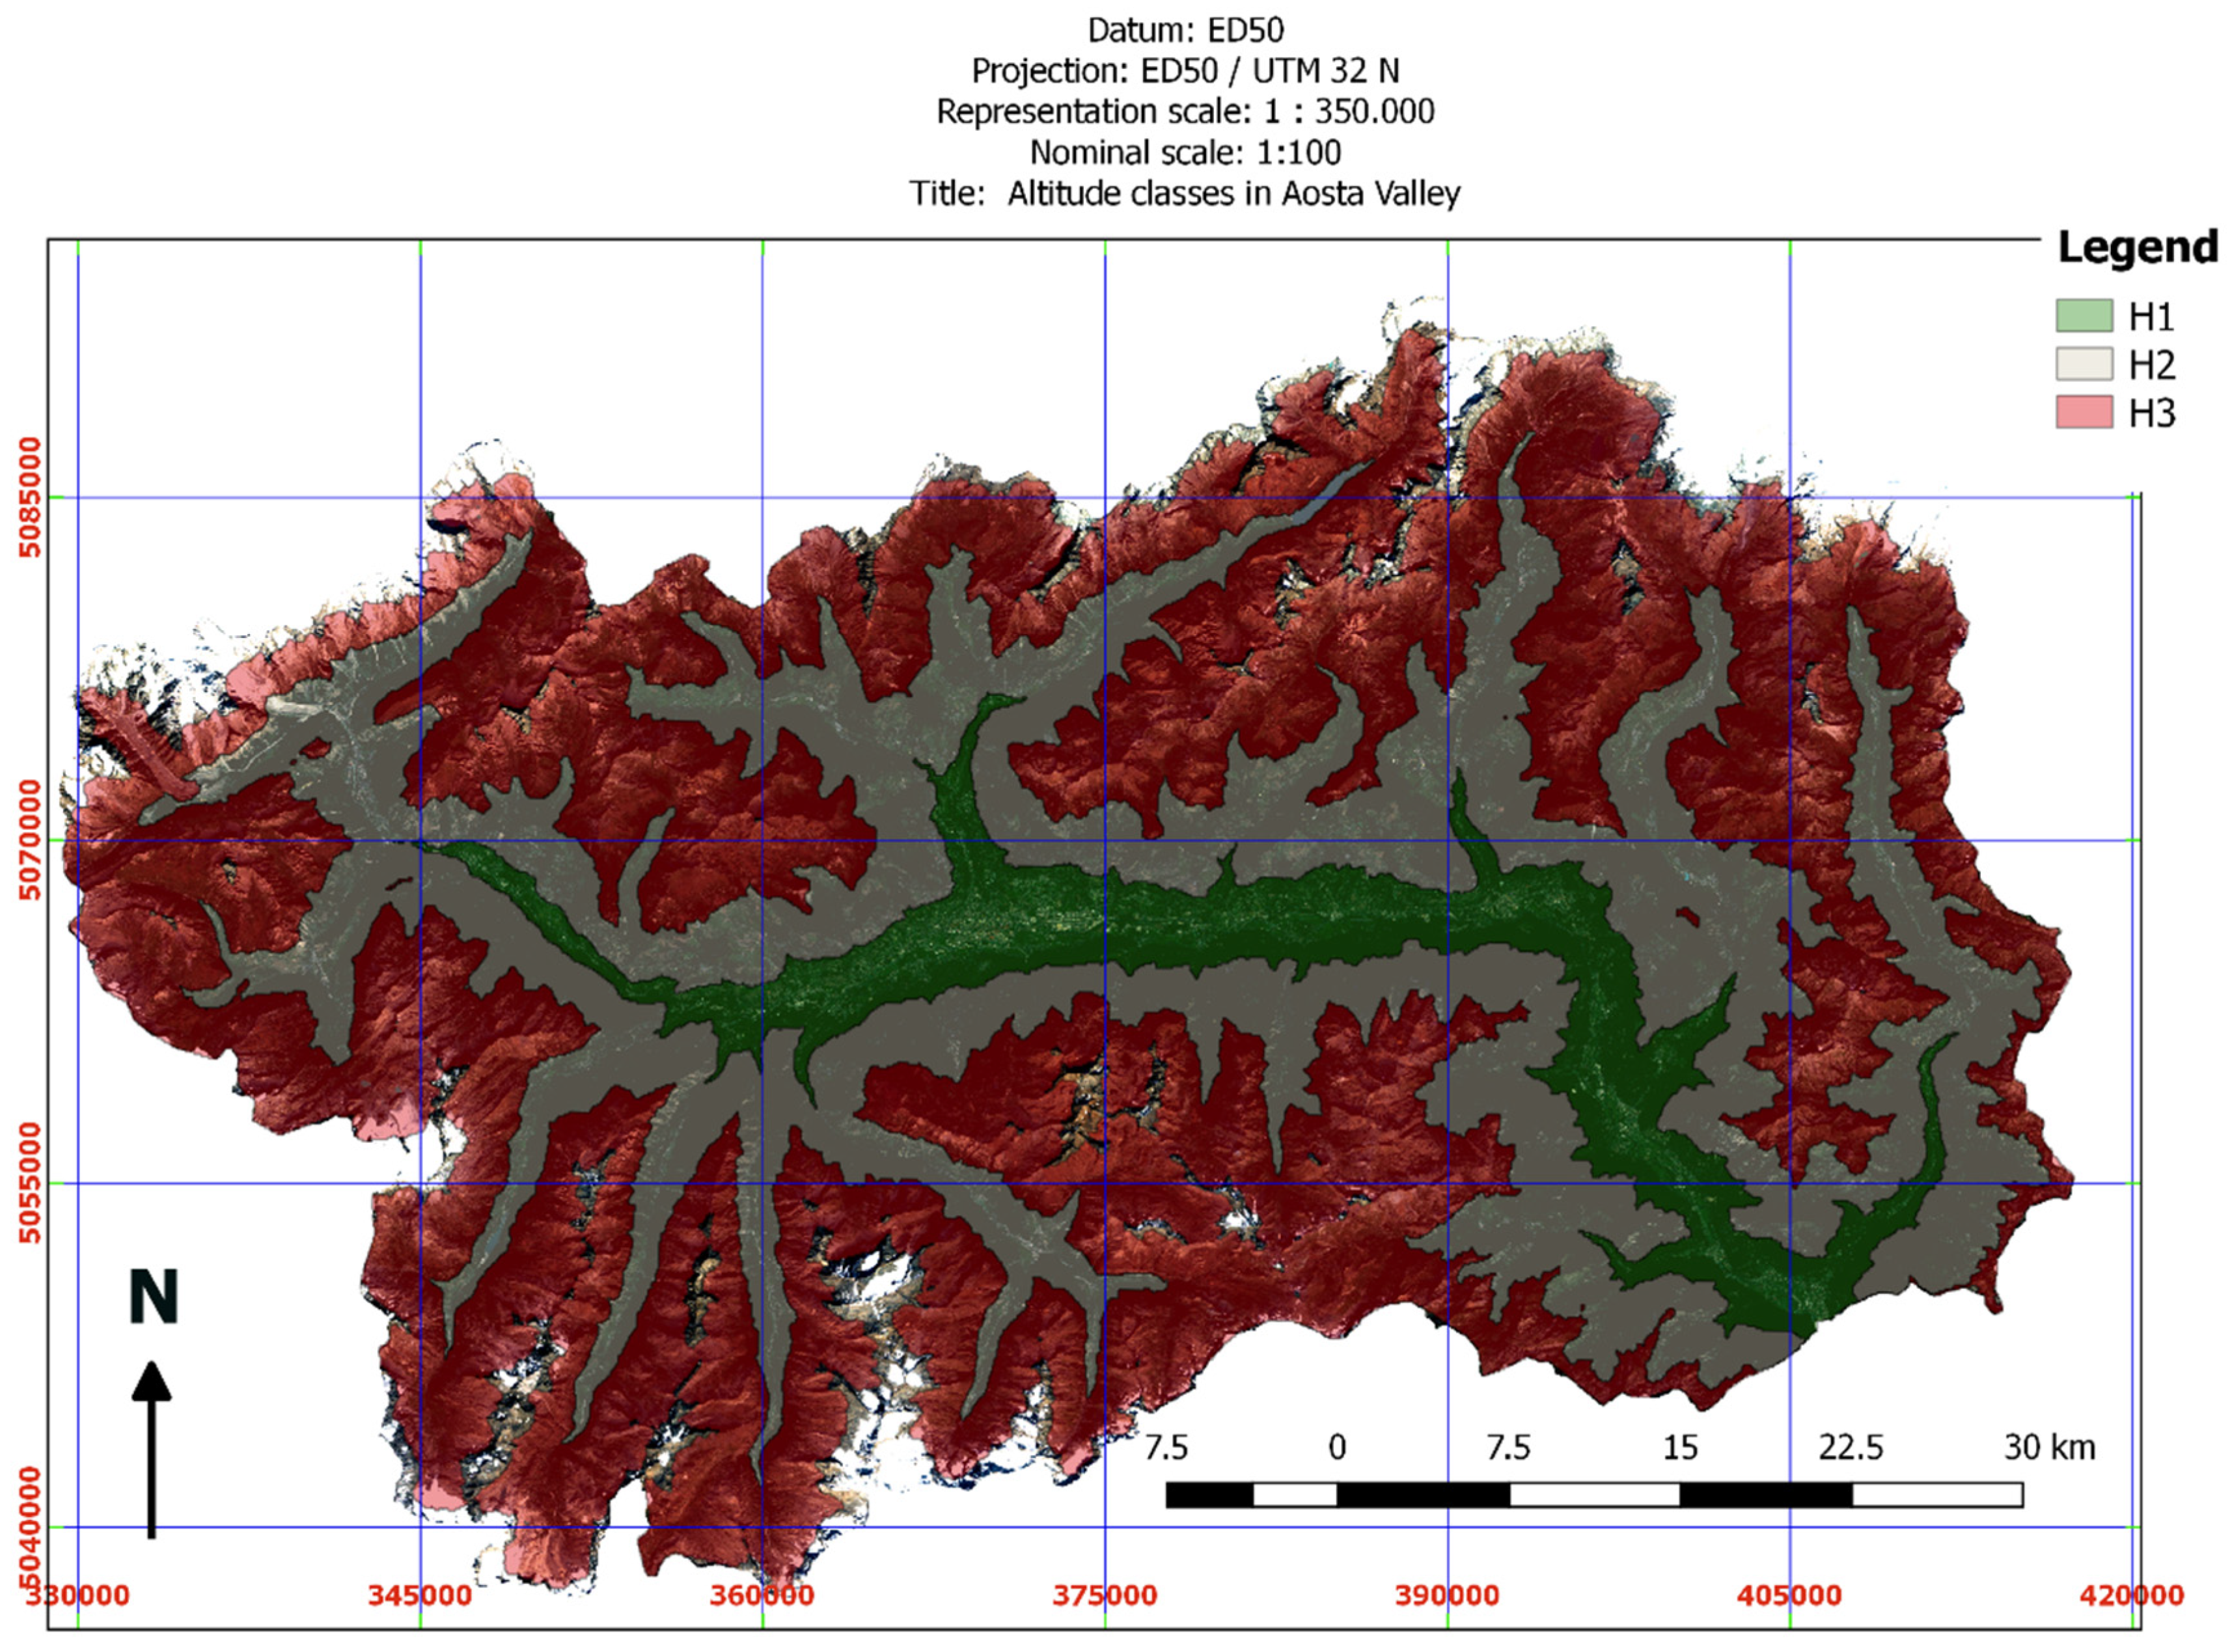
Figure 4.
Height classes (H1, H2, H3) mean values of PMs (SOS, EOS, LOS, MAXVI) as estimated by TIMESAT 3.3 with STL (a,b,c) refer to rangelands while (e,f,g) refer to broad-leaved forests. (d) and (h) refer to, respectively, rangelands and broad-leaved forests ET values. Height class (H1, H2, H3) yearly mean values of ET. Reported values correspond to the yearly mean value of the 8 days aggregated data from MOD16A2 product. In all the graphs orange points represent outliers (see Equation (2)). All the trends proved to be significant (see Table 4B). DOY: day of the year.


Figure 5.
Yearly trends, respectively, of (i,j,k) annual first day of no snow cover (snow cover time) in height class (H1, H2 and H3) and (l,m) precipitation (rainfalls including snowfalls) in the height class (H1, and in the whole territory of Aosta Valley) in the period from 2000–2019.
Figure 5.
Yearly trends, respectively, of (i,j,k) annual first day of no snow cover (snow cover time) in height class (H1, H2 and H3) and (l,m) precipitation (rainfalls including snowfalls) in the height class (H1, and in the whole territory of Aosta Valley) in the period from 2000–2019.

Figure 6.
Yearly anomaly of air temperature in the period from 2000–2019 (annual mean temperature).

Figure 7.
Yearly trends, respectively, of the SOS (n), EOS (o), and LOS (p) in Aosta Valley retrieved from TIMESAT starting from the collection MOD13Q1 v.6 (the ones that have to be validated) and the Phenological MODIS product MCD12Q2 (validated product used to test those obtained in TIMESAT).
Figure 7.
Yearly trends, respectively, of the SOS (n), EOS (o), and LOS (p) in Aosta Valley retrieved from TIMESAT starting from the collection MOD13Q1 v.6 (the ones that have to be validated) and the Phenological MODIS product MCD12Q2 (validated product used to test those obtained in TIMESAT).


Table 1.
Aosta Valley height ranges and size of the corresponding areas. ASL: above sea level.
| Height Ranges (m ASL.) | Area (km2) | Area (%) |
|---|---|---|
| 343–500 | 6.6 | 0.2 |
| 500–1000 | 236.4 | 7.2 |
| 1000–1500 | 372.7 | 11.4 |
| 1500–2000 | 669.9 | 20.5 |
| 2000–2500 | 994.6 | 30.5 |
| 2500–3000 | 768.3 | 23.6 |
| 3000–3500 | 176.6 | 5.4 |
| 3500–4810 | 35.5 | 1.1 |
Table 2.
CORINE land cover 2018 dataset (CLC2018) Level 3 classes and corresponding areas in Aosta Valley. In green, classes that were considered to represent rangelands and broad-leaved forests.
Table 2.
CORINE land cover 2018 dataset (CLC2018) Level 3 classes and corresponding areas in Aosta Valley. In green, classes that were considered to represent rangelands and broad-leaved forests.
| CLC2018 Class Code | Description | Area (km2) | Area (%) | CLC2018 Class Code | Description | Area (km2) | Area (%) |
|---|---|---|---|---|---|---|---|
| 111 | Continuous urban fabric | 1.56 | 0.05 | 311 | Broad-leaved forests | 58.12 | 1.78 |
| 112 | Discontinuous urban fabric | 35.27 | 1.08 | 312 | Coniferous forests | 577.98 | 17.71 |
| 121 | Industrial or commercial units | 8.72 | 0.27 | 313 | Mixed forests | 104.41 | 3.20 |
| 122 | Road and rail networks and associated land | 0.25 | 0.01 | 321 | Natural grasslands | 86.04 | 2.64 |
| 124 | Airports | 0.42 | 0.01 | 322 | Moors and heathlands | 106.29 | 3.26 |
| 131 | Mineral extraction sites | 0.66 | 0.02 | 324 | Transitional woodland-shrubs | 424.84 | 13.02 |
| 132 | Dump sites | 0.27 | 0.01 | 332 | Bare rocks | 652.61 | 20.00 |
| 212 | Permanently irrigated land | 0.27 | 0.01 | 333 | Sparsely vegetated areas | 804.78 | 24.67 |
| 221 | Vineyards | 3.57 | 0.11 | 335 | Glaciers and permanent snow | 129.56 | 3.97 |
| 222 | Fruit trees and berry plantations | 2.17 | 0.07 | 411 | Inland marshes | 0.54 | 0.02 |
| 231 | Pastures | 94.06 | 2.88 | 511 | Rivers | 0.17 | 0.01 |
| 242 | Complex cultivation patterns | 18.61 | 0.57 | 512 | Lakes | 3.24 | 0.10 |
| 243 | Land principally occupied by agriculture, with significant areas of natural vegetation | 148.42 | 4.55 |
Table 3.
Aosta Valley altitude ranges considered.
| Class Code | Altitude Range (m) |
|---|---|
| H1 | <1000 |
| H2 | 1000–2000 |
| H3 | 2000–3000 |
Table 4.
(A) 1st order polynomial coefficients and corresponding coefficients of determination (R2) of calibrated models relating PMs with years (2000–2019) for the considered height classes. (B) p-values of trends computed for analyzed height classes and parameters. SOS: start of season; EOS: end of season; LOS: length of season; MAXVI: maximum vegetation index; ET: evapotranspiration.
| (A) | |||||||||||||||
|---|---|---|---|---|---|---|---|---|---|---|---|---|---|---|---|
| RANGELANDS | |||||||||||||||
| Classes | SOS | EOS | LOS | MAXVI | ET | ||||||||||
| Gain | Offset | R2 | Gain | Offset | R2 | Gain | Offset | R2 | Gain | Offset | R2 | Gain | Offset | R2 | |
| H1 | −2.04 | 4170.0 | 0.75 * | 2.64 | −4974.4 | 0.71 * | 4.70 | −9199.5 | 0.89 * | 0.005 | −8.828 | 0.85 * | 0.06 | −107.3 | 0.67 * |
| H2 | −2.09 | 4302.3 | 0.70 * | 2.59 | −4889.2 | 0.60 * | 4.81 | −9440.6 | 0.79 * | 0.004 | −6.984 | 0.70 * | 0.04 | −104.2 | 0.74 * |
| H3 | −3.11 | 6390.5 | 0.79 * | 2.59 | −4890.8 | 0.44 * | 6.40 | −12,686.0 | 0.78 * | 0.003 | −6.044 | 0.50 * | 0.06 | −71.4 | 0.70 * |
| BROAD-LEAVED FORESTS | |||||||||||||||
| Gain | Offset | R2 | Gain | Offset | R2 | Gain | Offset | R2 | Gain | Offset | R2 | Gain | Offset | R2 | |
| H1 | −1.18 | 2441.8 | 0.77 * | 2.31 | −4338.2 | 0.88 * | 3.49 | −6780 | 0.92 * | 0.002 | −3.99 | 0.65 * | 0.08 | −136.3 | 0.62 * |
| H2 | −1.17 | 2455.8 | 0.76 * | 2.30 | −4349.2 | 0.87 * | 3.48 | −6805 | 0.93 * | 0.002 | −4.019 | 0.65 * | 0.05 | −80.3 | 0.77 * |
| H3 | −1.17 | 2472.8 | 0.78 * | 2.31 | −4366.2 | 0.88 * | 3.48 | −6839 | 0.92 * | 0.003 | −6.041 | 0.49 * | 0.06 | −104.7 | 0.77 * |
| (B) | |||||||||||||||
| Rangelands | |||||||||||||||
| Classes | SOS | EOS | LOS | MAXVI | ET | ||||||||||
| p-value | |||||||||||||||
| H1 | <0.005 | <0.03 | <0.003 | <0.04 | <0.005 | ||||||||||
| H2 | <0.004 | <0.02 | <0.001 | <0.06 | <0.005 | ||||||||||
| H3 | <0.005 | <0.003 | <0.05 | <0.08 | <0.05 | ||||||||||
| Broad-leaved forests | |||||||||||||||
| p-value | |||||||||||||||
| H1 | <0.005 | <0.01 | <0.008 | <0.05 | <0.005 | ||||||||||
| H2 | <0.005 | <0.05 | <0.004 | <0.06 | <0.005 | ||||||||||
| H3 | <0.005 | <0.05 | <0.05 | <0.05 | <0.005 | ||||||||||
Table 5.
Yearly average and cumulated (2000–2019) variations of PMs and ET along the years as estimated by 1st order polynomial regression (Figure 4). Positive values indicate a delay or lengthening of season, negative values an advance of season according to the observed trends reported in Figure 4. The first part of the table indicates the yearly gain, while the second part (cumulated) represent the overall changes in the observed period analyzed for each PMs from the starting in the year 2000 up to the end (2019). Standard deviations have been calculated to define the uncertainty margin on the basis of the estimated gain (indicated after the ±).
| RANGELANDS | |||||
|---|---|---|---|---|---|
| Yearly | SOS (n. of days) | EOS (n. of days) | LOS (n. of days) | MAXVI | ET (Kg·m−2·8d−1) |
| H1 | −2.04 ± 1.05 | 2.64 ± 1.00 | 4.70 ± 1.45 | 0.005 ± 0.001 | 0.06 ± 0.01 |
| H2 | −2.09 ± 1.15 | 2.59 ± 1.01 | 4.81 ± 1.65 | 0.004 ± 0.001 | 0.04 ± 0.02 |
| H3 | −3.11 ± 2.05 | 2.59 ± 1.20 | 6.40 ± 3.79 | 0.003 ± 0.001 | 0.06 ± 0.04 |
| Cumulated 2000–2019 | SOS (n. of days) | EOS (n. of days) | LOS (n. of days) | MAXVI | ET (Kg m−2) |
| H1 | −38.76 ± 19.95 | 50.16 ± 19.00 | 89.34 ± 27.55 | 0.089 ± 0.019 | 1.14 ± 0.19 |
| H2 | −39.77 ± 21.85 | 49.29 ± 19.19 | 91.41 ± 31.35 | 0.072 ± 0.019 | 0.78 ± 0.38 |
| H3 | −59.17 ± 38.95 | 49.26 ± 22.80 | 121.69 ± 72.01 | 0.057 ± 0.019 | 1.11 ± 0.76 |
| BROAD-LEAVED FORESTS | |||||
| Yearly | SOS (n. of days) | EOS (n. of days) | LOS (n. of days) | MAXVI | ET (Kg·m−2·8d−1) |
| H1 | −1.18 ± 1.11 | 2.31 ± 1.74 | 3.49 ± 1.97 | 0.002 ± 0.001 | 0.08 ± 0.01 |
| H2 | −1.17 ± 1.25 | 2.30 ± 1.33 | 3.48 ± 1.87 | 0.004 ± 0.001 | 0.05 ± 0.01 |
| H3 | −1.17 ± 1.13 | 2.31 ± 1.25 | 3.48 ± 3.79 | 0.003 ± 0.001 | 0.06 ± 0.04 |
| Cumulated 2000–2019 | SOS (n. of days) | EOS (n. of days) | LOS (n. of days) | MAXVI | ET (Kg m−2) |
| H1 | −22.42 ± 21.09 | 43.89 ± 33.06 | 66.31 ± 37.43 | 0.038 ± 0.019 | 1.52 ± 0.19 |
| H2 | −22.23 ± 23.75 | 43.70 ± 25.27 | 66.12 ± 35.53 | 0.076 ± 0.019 | 0.95 ± 0.19 |
| H3 | −22.23 ± 21.47 | 43.89 ± 23.75 | 66.12 ± 72.01 | 0.057 ± 0.019 | 1.14 ± 0.76 |
Publisher’s Note: MDPI stays neutral with regard to jurisdictional claims in published maps and institutional affiliations. |
© 2021 by the authors. Licensee MDPI, Basel, Switzerland. This article is an open access article distributed under the terms and conditions of the Creative Commons Attribution (CC BY) license (http://creativecommons.org/licenses/by/4.0/).
Share and Cite
MDPI and ACS Style
Orusa, T.; Borgogno Mondino, E. Exploring Short-Term Climate Change Effects on Rangelands and Broad-Leaved Forests by Free Satellite Data in Aosta Valley (Northwest Italy). Climate 2021, 9, 47. https://doi.org/10.3390/cli9030047
AMA Style
Orusa T, Borgogno Mondino E. Exploring Short-Term Climate Change Effects on Rangelands and Broad-Leaved Forests by Free Satellite Data in Aosta Valley (Northwest Italy). Climate. 2021; 9(3):47. https://doi.org/10.3390/cli9030047
Chicago/Turabian StyleOrusa, Tommaso, and Enrico Borgogno Mondino. 2021. "Exploring Short-Term Climate Change Effects on Rangelands and Broad-Leaved Forests by Free Satellite Data in Aosta Valley (Northwest Italy)" Climate 9, no. 3: 47. https://doi.org/10.3390/cli9030047
Note that from the first issue of 2016, this journal uses article numbers instead of page numbers. See further details here.