Investigation on the Use of Passive Microclimate Frames in View of the Climate Change Scenario


1
Department of Earth Sciences, Sapienza Università di Roma, P.le A. Moro 5, 00185 Rome, Italy
2
Department of Physics, Sapienza Università di Roma, P.le A. Moro 5, 00185 Rome, Italy
3
Department of Applied Physics, Centro de Investigación Acuicultura y Medio Ambiente ACUMA, Universitat Politècnica de València, 46022 Valencia, Spain
*
Author to whom correspondence should be addressed.
Climate 2019, 7(8), 98; https://doi.org/10.3390/cli7080098
Submission received: 28 June 2019
/
Revised: 2 August 2019
/
Accepted: 5 August 2019
/
Published: 9 August 2019
(This article belongs to the Special Issue World Heritage and Climate Change: Impacts and Adaptation)
Abstract
:Passive microclimate frames are exhibition enclosures able to modify their internal climate in order to comply with paintings’ conservation needs. Due to a growing concern about the effects of climate change, future policies in conservation must move towards affordable and sustainable preservation strategies. This study investigated the hygrothermal conditions monitored within a microclimate frame hosting a portrait on cardboard with the aim of discussing its use in view of the climate expected indoors in the period 2041–2070. Its effectiveness in terms of the ASHRAE classification and of the Lifetime Multiplier for chemical deterioration of paper was assessed comparing temperature and relative humidity values simultaneously measured inside the microclimate frame and in its surrounding environment, first in the Pio V Museum and later in a residential building, both located in the area of Valencia (Spain). Moreover, heat and moisture transfer functions were used to derive projections over the future indoor hygrothermal conditions in response to the ENSEMBLES-A1B outdoor scenario. The adoption of microclimate frames proved to be an effective preventive conservation action in current and future conditions but it may not be sufficient to fully avoid the chemical degradation risk without an additional control over temperature.
1. Introduction
The environment surrounding the objects is one the main driver of their deterioration. Long-term microclimate monitorings, through the identification of risk factors, play a key role in the implementation of preventive conservation actions [1]. Temperature and relative humidity are fundamental physical parameters, as materials adapt themselves to the continually changing hygrothermal conditions to reach a thermodynamic equilibrium. Strict microclimate targets for preservation [2,3] have fostered the use of expensive HVAC (Heating, Ventilation and Air-Conditioning) systems. However, these highly sophisticated systems may be risky in the case of a potential failure and hardly possible for all museums, which, with the increase of cultural tourism, might incur raised costs for the maintenance of adequate conditions for conservation [4]. Furthermore, due to a growing concern about the effects of the expected climate change, future policies in conservation must move towards affordable and sustainable preservation strategies [5]. Passive methods, based on the understanding of the material properties and of its interaction with the environment, might provide a reliable support in this direction.
Among preventive conservation tools, showcases aim at creating an internal micro-environment different from the external macro-environment [6]: this “box-in-box” configuration allows locally fine-tuning the control over various environmental parameters (temperature, relative humidity, pollutants and light), thus reducing the risk of physical and chemical damage to cultural heritage objects [7]. The employment and optimization of passive low-cost devices can be highly effective to provide relative humidity control in less than ideal environments, particularly in the case of mixed collections with different conservation needs. Since their response to temperature fluctuations is usually poor [6,8], panels of materials containing PCMs (Phase Change Materials) have been proposed to be placed inside showcases to keep the internal temperature stable [9].
Microclimate frames are showcases specifically designed for paintings and able to modify their internal conditions in order to comply with tolerability targets for specific typologies of materials. This kind of exhibition enclosures is considered among the safest systems for keeping relative humidity stable and is increasingly being used to protect paintings against indoor hazards [10]. Passive microclimate frames usually take advantage of the inclusion of a buffering agent in combination with the reduction of the air exchange rate [11,12,13]. A buffering agent is generally an extremely absorbent material which is able to smooth out abrupt changes by releasing moisture when relative humidity decreases and absorbing moisture if it increases. An economical microclimate frame can be produced in-house using the picture’s frame as the primary case [14]. As in showcases, every microclimate frame is characterized by a peculiar response to the environmental forcing [8]. Their effectiveness depends on the specific features and can be assessed as a function of the improvement of the surrounding microclimate in terms of the fulfilment of the artwork conservation needs.
The most recent standards in conservation avoid recommending ideal temperature and relative humidity intervals and have evolved towards the concepts of proofed fluctuations [15], i.e., the largest hygrothermal levels experienced by the objects in the past, and historic fluctuations [16], i.e., the environmental conditions to which artworks have acclimatized and adapted during their conservation history. Both these concepts imply methodological indications rather than prescriptive ones [3] and thus a more flexible approach, allowing for the short-term fluctuations and seasonal changes that can be considered safe for the collections. The ASHRAE (American Society of Heating, Air-Conditioning and Refrigerating Engineers) guidelines [17] suggest five classes of quality control, defined on the basis of seasonal and daily hygrothermal fluctuations. The possible risks for collections gradually increase from Class AA, associated with no risk to most objects, to Class D, that protects only from dampness. These guidelines have been effectively applied to quantify the damage potential of environments already actively controlled [18] and those of future climate scenarios [19]. Thanks to the enhanced knowledge of the properties of the materials and of the mechanisms of interaction with the surrounding environment, damage functions can be used to assess the possible risks for various typologies of materials [18]. For paper, one of the most alarming degradation processes is the chemical decay (e.g., yellowing of paper and fading of colors) [20]. The Lifetime Multiplier is an index extensively used to assess the time span in which varnishes and paper objects remain usable if compared to standard reference conditions [21,22].
To extend the microclimate assessment over the effects of the expected climate change, simplified heat and moisture transfer equations through the building envelope can be derived from monitored outdoor and indoor data and employed to simulate the future conditions indoors [23,24]. This methodology was developed within the European project Climate for Culture (2009–2014) [25,26], which focused its attention to the future conservation risks with the aim to suggest possible mitigation actions and inform stakeholders and policy makers.
Simultaneous measurements of temperature and relative humidity collected inside and outside a microclimate frame were used in this study to investigate the quality of its internal environment, making it possible to evaluate the buffering properties over time. The hygrothermal observations were recorded from May 2014 to February 2017, first in the Sorolla room of the Pio V Museum of Fine Art in Valencia (Spain) [27] and, later on, in a residential building in the same area. The effectiveness of the passive microclimate frame was expressed in terms of the ASHRAE classification and the Lifetime Multiplier index for chemical deterioration. Moreover, a methodology based on heat and moisture transfer functions through the building envelope was applied to derive projections over the future indoor hygrothermal conditions as a function of the ENSEMBLES-A1B outdoor scenario in the area of Valencia [28]. An increased awareness of the potential conservation risks in view of the expected climate change has given the possibility to suggest appropriate preventive conservation strategies.
2. Materials and Methods
2.1. The Microclimate Frame
A long-term hygrothermal monitoring was conducted inside a microclimate frame housing a portrait of the Valencian painter Joaquín Sorolla (1863–1924). The painting, titled “Portrait of a lady with a red flower in her hair” (Figure 1a), measures 64 cm × 49 cm and is enclosed in a hand-crafted microclimate frame (69 cm × 54 cm cm) made of an external aluminium case and a frontal glass. The specific layout of the components of the microclimate frame under study is shown in Figure 1b. A sheet of cardboard (i.e., the same material supporting the portrait) of the same size of the paintings was used as back plate for the frame and put in direct contact with the painting support in order to offset changes in external relative humidity acting as a buffer [14]. The cardboard was preconditioned to the relative humidity level of according to an extensive literature review on paper degradation [20] with the aim of reducing the impact of deterioration risk factors acting on the painting.
The painting by Sorolla was realized on cardboard in 1916 with the gouache technique and donated as a gift to the Traver family. Since then, it used to be conserved in the house of the owners being enclosed within an unbuffered frame. Conservation surveys performed by the Valencian Institute of Conservation and Restoration (IVACOR) detected the presence of dust deposits both on the front and on the back, craquelures and loss of material on the painting layer together with a massive fungal attack visible in the form of dark circular stains. The gum arabic, frequently used as binding media [29], is responsible for its sensitivity to hygrothermal variations as it is particularly vulnerable to mold growth and chemical degradation. In the final report of the surveys, the Institute warned that the deterioration could have been caused by adverse environmental conditions in conjunction with the vulnerability of the materials used [30]. The artwork underwent restoration from 2012 to 2014 in the IVACOR laboratories and at the end of the intervention was enclosed in a passive microclimate frame ad hoc designed and provided with internal temperature and relative humidity sensors.
2.2. The Monitoring Campaign
Temperature (T) and relative humidity (RH) data were monitored from May 2014 to February 2017. Over this period, the painting was exposed to different environments: first, the Sorolla room in the Pio V Museum of Fine Art in Valencia from May 2014 to February 2016 and, later on, a residential building located in a city near Valencia. Since the private owners do not want to reveal the new location of the painting for safety reasons, in this investigation were used the climate data of the area of Valencia. The Pio V Museum is housed in a historical building of the XVII century where an active HVAC system of temperature control was in operation, with a variable T set-point ranging from 20 C to 24 C and RH left uncontrolled [27]. In the residential building, where the painting continued to be monitored with the same T and RH probes, an intermittent heating system was active only in winter and temperatures exceeded 30 C during summer.
The microclimate monitoring system was developed by the Department of Applied Physics of the Polytechnic University of Valencia [31]. Two probes, each with coupled T and RH sensors, were assembled and installed within and outside the microclimate frame. Some of the technical features of the sensors are reported in Table 1: the temperature sensors (Maxim Integrated DS18B2) are in accordance with the instrumental metrological characteristics recommended in EN 15758:2010 [32], while the uncertainty of the RH sensors (Honeywell HIH 4030) is slightly higher than that recommended by EN 16242:2012 () [33]. When using multiple sensors for RH, they must be carefully calibrated in advance in order to have no significant difference in their accuracy. For this reason, the RH sensors were calibrated with aqueous solutions of two salts (lithium chloride and sodium chloride) in accordance with the ASTME 104-02 standard [34]. The time interval between consecutive observations was set to 1 h, following the results of a previous study [27] where the sampling frequency was found to be reliable in the application of recent standards and therefore can be considered a good compromise between the priority of disposing of detailed series of observations and the necessity of avoiding redundancy in museum surveys.
The mixing ratio (MR) was derived from simultaneous T and RH data using the formula in [33].
The outdoor hygrothermal data were obtained from the meteorological hourly dataset of the area of Valencia [35] distributed by the National Agency of Meteorology of the Spanish Government (AEMET) and available on the UPV website.
2.3. The Environmental Risk Assessment
The environmental risk assessment was based on the application of the ASHRAE guidelines and on the computation of the Lifetime Multiplier, an index used to quantify the risk of chemical degradation for paper.
In the ASHRAE guidelines [17], the classification in classes of quality of environmental control is based on the combination of the T and RH seasonal cycles and short-term fluctuations. The maximum and minimum seasonal shift is calculated by adding and subtracting to the annual mean the seasonal changes allowed for each class. The width of the final bands is finally determined shifting the curve of a 91-day central moving average by the short-term fluctuations indicated for the same class [18]. The ASHRAE classes of quality for conservation range from Class D, which prevents only from dampness, to Class AA, which is associated to no risk of mechanical damage to most artifacts and paintings. Class B is considered the reference for most of museums [2], since mechanical damage is proved to be avoided for RH values not exceeding the range of .
The Lifetime Multiplier (LM) considers the risk of chemical degradation taking into account the activation energy of the degradation processes involved in the deterioration of the organic materials (i.e., 70 kJ/mol for yellowing of varnishes and 100 kJ/mol for degradation of cellulose). This index is a multiplier of the time left to an object to remain usable when compared to standard conditions of T = 20 C and RH . Since the instantaneous values of LM exponentially depend on temperature (Equation (1)), the influence on chemical degradation of T variations is greater than that exerted by RH variations of the same magnitude [36]:
where is the instantaneous measured value of relative humidity at time i, is the instantaneous measured value of temperature (expressed in K) at time i, is the activation energy for the degradation of paper (100 kJ · mol) and R is the perfect gas constant (8.314 J · mol· K). The level of risk associated to the Lifetime Multiplier values can be defined as follows [18]: safe when LM > 1, medium risk when 0.75 < LM and high risk if LM .
2.4. The Hygrothermal Conditions Expected Indoors in the Period 2041–2070
As a consequence of the climate change scenario, the southern European regions will probably increase their need for summer cooling (while decreasing winter heating) in order to keep the environmental conditions suitable for artwork conservation [26]. To evaluate the effects of the climate change scenario in the residential building near Valencia and on the effectiveness of the microclimate frame, we followed the approach applied in [23,24] to forecast the expected indoor T and RH levels.
The principal steps of the methodology can be summarized as follows:
- monitoring of the simultaneous indoor (a) and outdoor (b) climate over at least one year;
- derivation of the outdoor/indoor heat and moisture transfer functions (TFs) through the building;
- extraction of the outdoor climate in the interested area from a simulated scenario;
- inverse modeling of the future indoor climate based on the derived TFs; and
- evaluation of the expected changes for artwork conservation by means of damage functions.
The annual hygrothermal data monitored in the residential building (Step 1a) and outdoor (Step 1b) were used to derive the seasonal cycles of temperature and mixing ratio of moist air. The observations collected in 2016 during the heating period were discarded in the analysis in order to consider only the environmental conditions not affected by the HVAC systems.
The annual cycles of temperature and mixing ratio were fitted as generic time-dependent sinusoidal equations as follows:
where x is the variable considered (i.e., T or MR), t is time (in days), is the annual average of x, is the angular frequency (i.e., where P is the period, equal to 365 days) and and are the amplitude and the phase shift of the best-fit sine function, respectively.
The measured indoor and outdoor data were used to fit the annual cycles (Equation (2)) that regulate heat and moisture exchanges across the building envelope on a seasonal basis, obtaining the indoor coefficients, and , and the outdoor ones, and . The combination of the two sinusoids, i.e., the outdoor T or MR cycles in abscissa and the indoor T or MR cycles in ordinate, gives the annual hysteresis cycle in the building [23]. During the annual cycle, the capability of the building to accumulate or release heat and moisture is an important factor that influences the transfer functions (TFs) and can be expressed in terms of the gain of the building (), defined as the ratio between and , and the phase shift (), defined as the difference between and (Step 2).
Temperature and relative humidity daily data in the area of Valencia for the 30-year time window from 2041 to 2070 (Step 3) were extracted from the ENSEMBLES dataset [28]. The ENSEMBLES simulation model was developed within the ENSEMBLES European project (2004–2009) [37] to produce regional dynamic projections. The high-resolution projections used in this study were generated by the Max Plank Institute for Meteorology using the IPCC emission Scenario A1B [35]. Scenario A1B was developed by the Intergovernmental Panel on Climate Change (IPCC) and was chosen as it is a moderate scenario that assumes higher CO emissions until 2050 and their decrease afterwards. The ENSEMBLES data were used to obtain the fitting coefficients and from the annual cycles (Equation (2)). To evaluate the effects of the outdoor climate scenario inside the residential building, the future hygrothermal conditions indoors were inversely simulated using derived T and MR transfer functions (Step 4) based on the same sinusoidal equations in Equation (2) with and the calculated using the gain and the phase shift of the residential building computed as described in Equations (3) and (4) and with indoor annual mean estimated as described in Equation (5):
where and are the gain and the phase shift of the building, respectively; , and are the mean, the amplitude and the phase shift of the best-fit sine function calculated from the ENSEMBLES dataset (2041–2070), respectively.
The indoor RH values were computed after the simulated indoor T and MR data by applying the formula in [33]. The T and RH conditions expected in the residential building were finally used to determine the possible changes in the future risk of chemical deterioration for paper in terms of the Lifetime Multiplier index (Step 5).
3. Results and Discussion
The internal response of the microclimate frame to the external forcing of the room was explored by taking into account annual time series of observations of T and RH values collected in two different sites: the first series was registered in the Pio V Museum from 1 June 2014 to 31 May 2015 (hereafter called Museum) and the second from 15 February 2016 to 14 February 2017 in a residential building near Valencia (hereafter called Private).
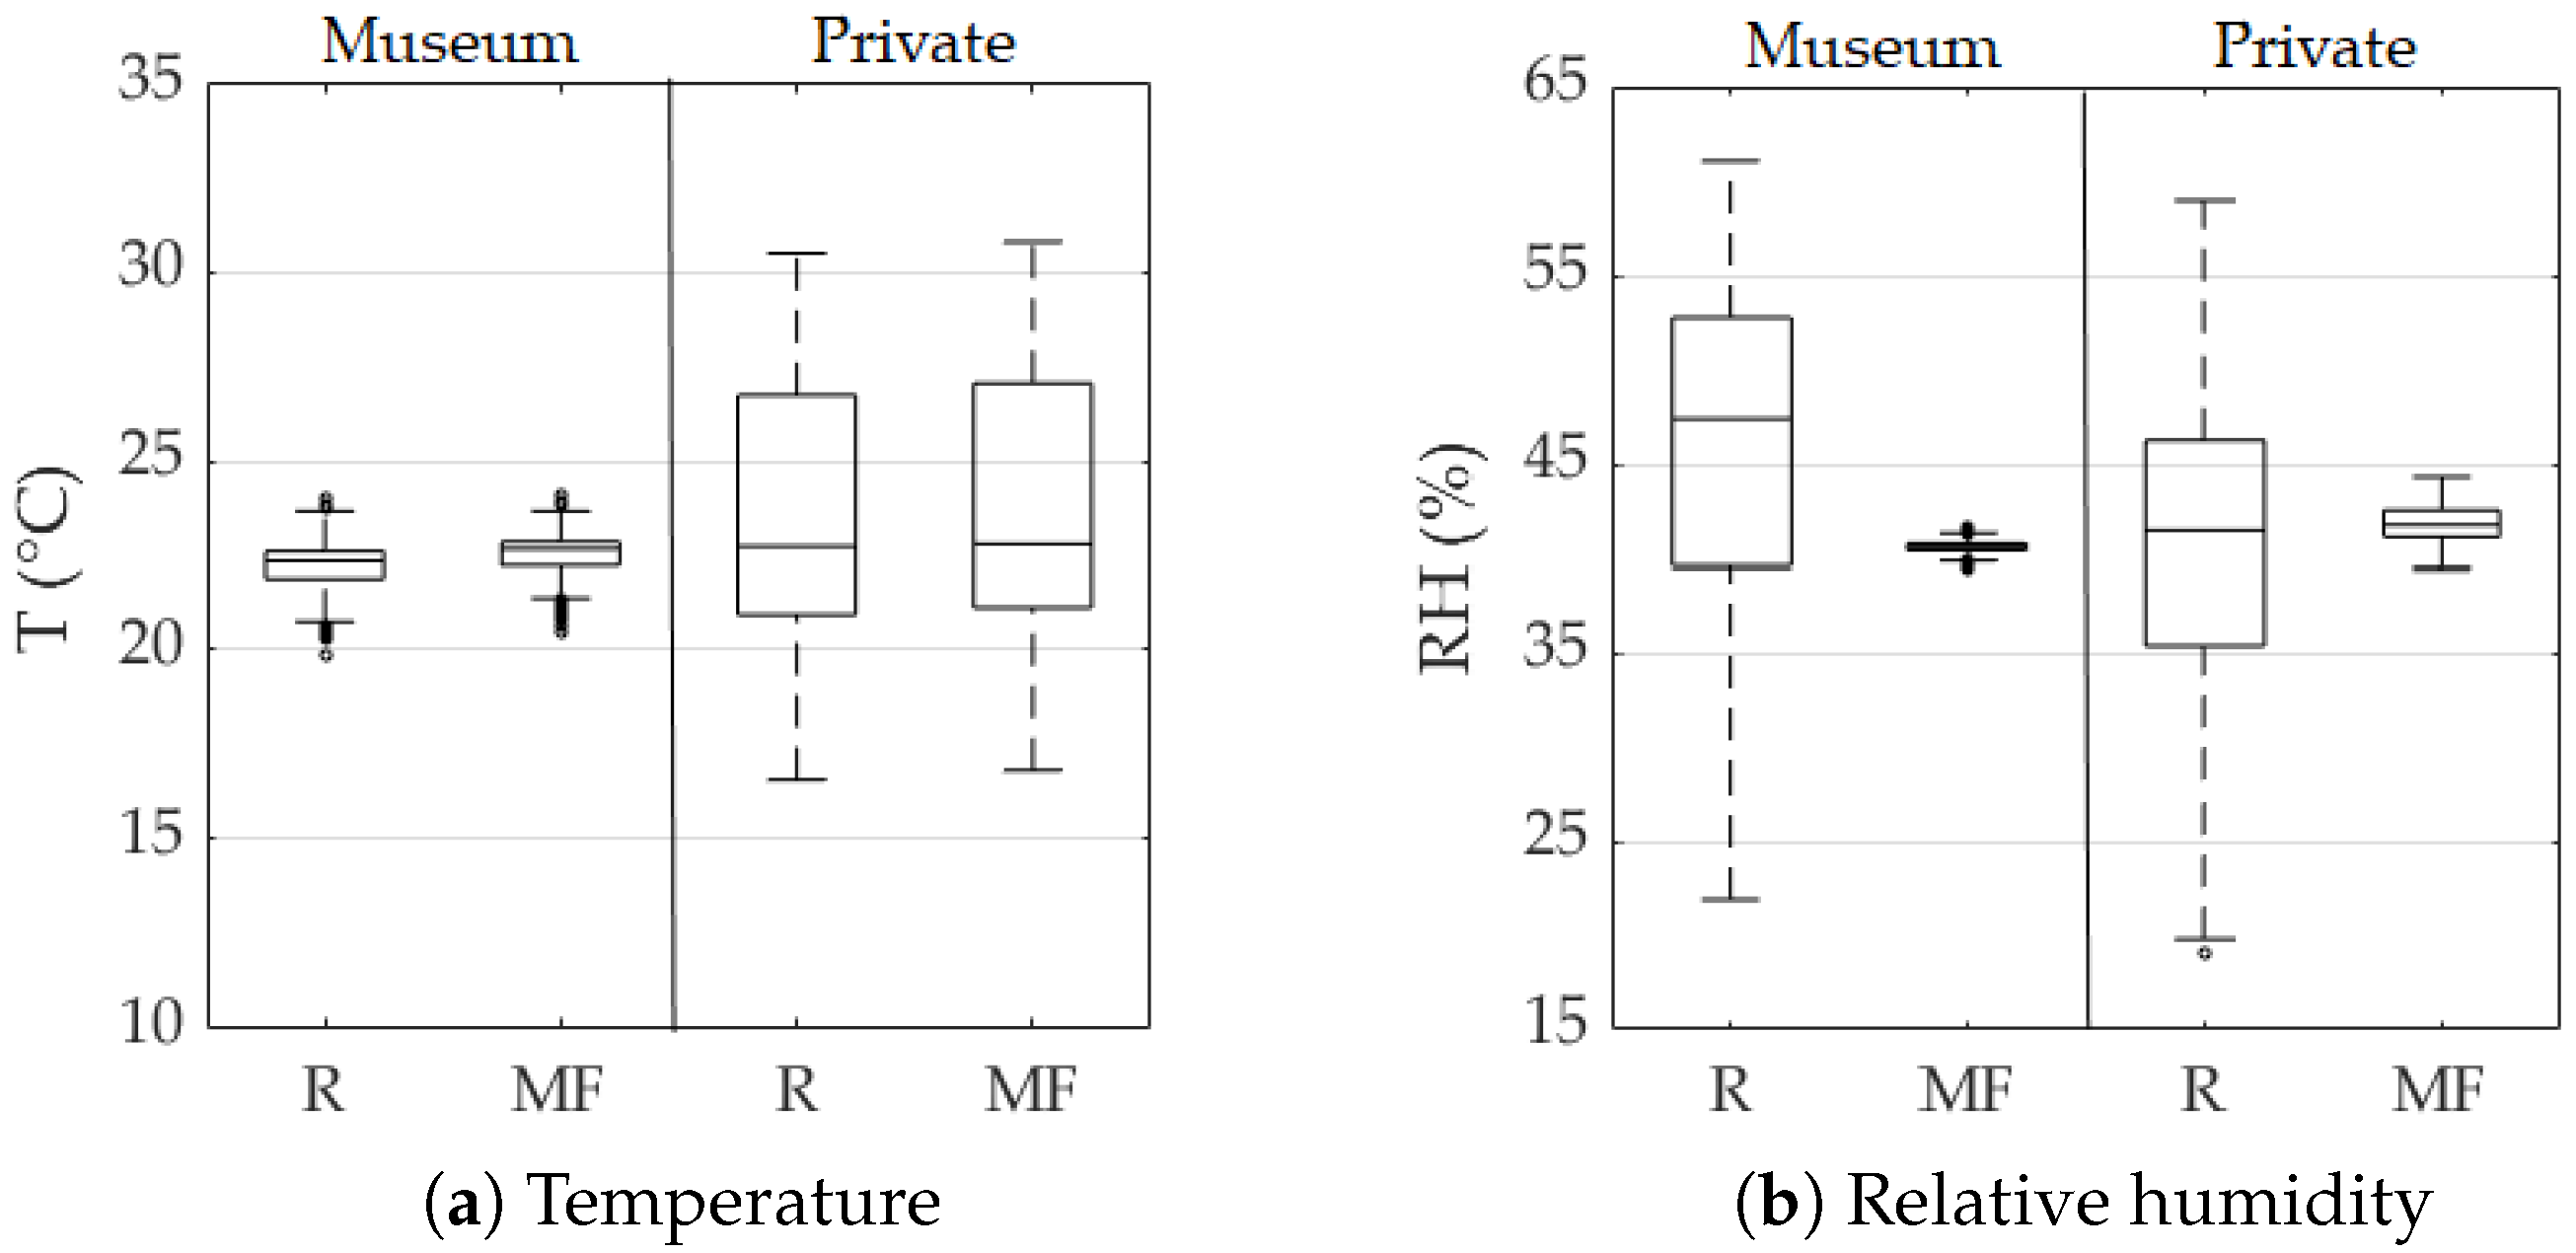
The box-and-whiskers plots of the T observations (Figure 2a) show that the values inside the microclimate frame fully overlap the room ones in both the sites. The Wilcoxon–Mann–Whitney test was performed for each pair of microclimate frame (MF) and room (R) temperature and relative humidity series, both in Museum and in Private. The test assumes the samples are not normally distributed and the significance level was set to . No significant difference was found between R and MF temperature series collected in the same site (p > 0.05); conversely, at both sites, the RH medians inside the microclimate frame significantly diverge from the room ones (p < 0.0001). The medians of the rooms are consistent and equal to 22.7 C in Museum and 22.8 C in Private; on the contrary, the variability associated to each dataset is significantly different, i.e less than ±2 C from the median in Museum and ranging from 16.5 C to 31.0 C in Private. While internal MF temperatures have the same variability as the external room, the internal RH levels are kept extremely stable throughout the year thanks to the buffering agent preconditioned to RH = before being enclosed within the microclimate frame. The box-and-whiskers plots of RH values (Figure 2b) show a significant difference between the external (R) and internal (MF) distributions of data: in the rooms the range of the RH values registered is roughly between and with RH medians equals to , while in both the sites the internal RH values are tightly kept around throughout the year. The few outliers found in the datasets (less than of the total) were not discarded in the following analysis.
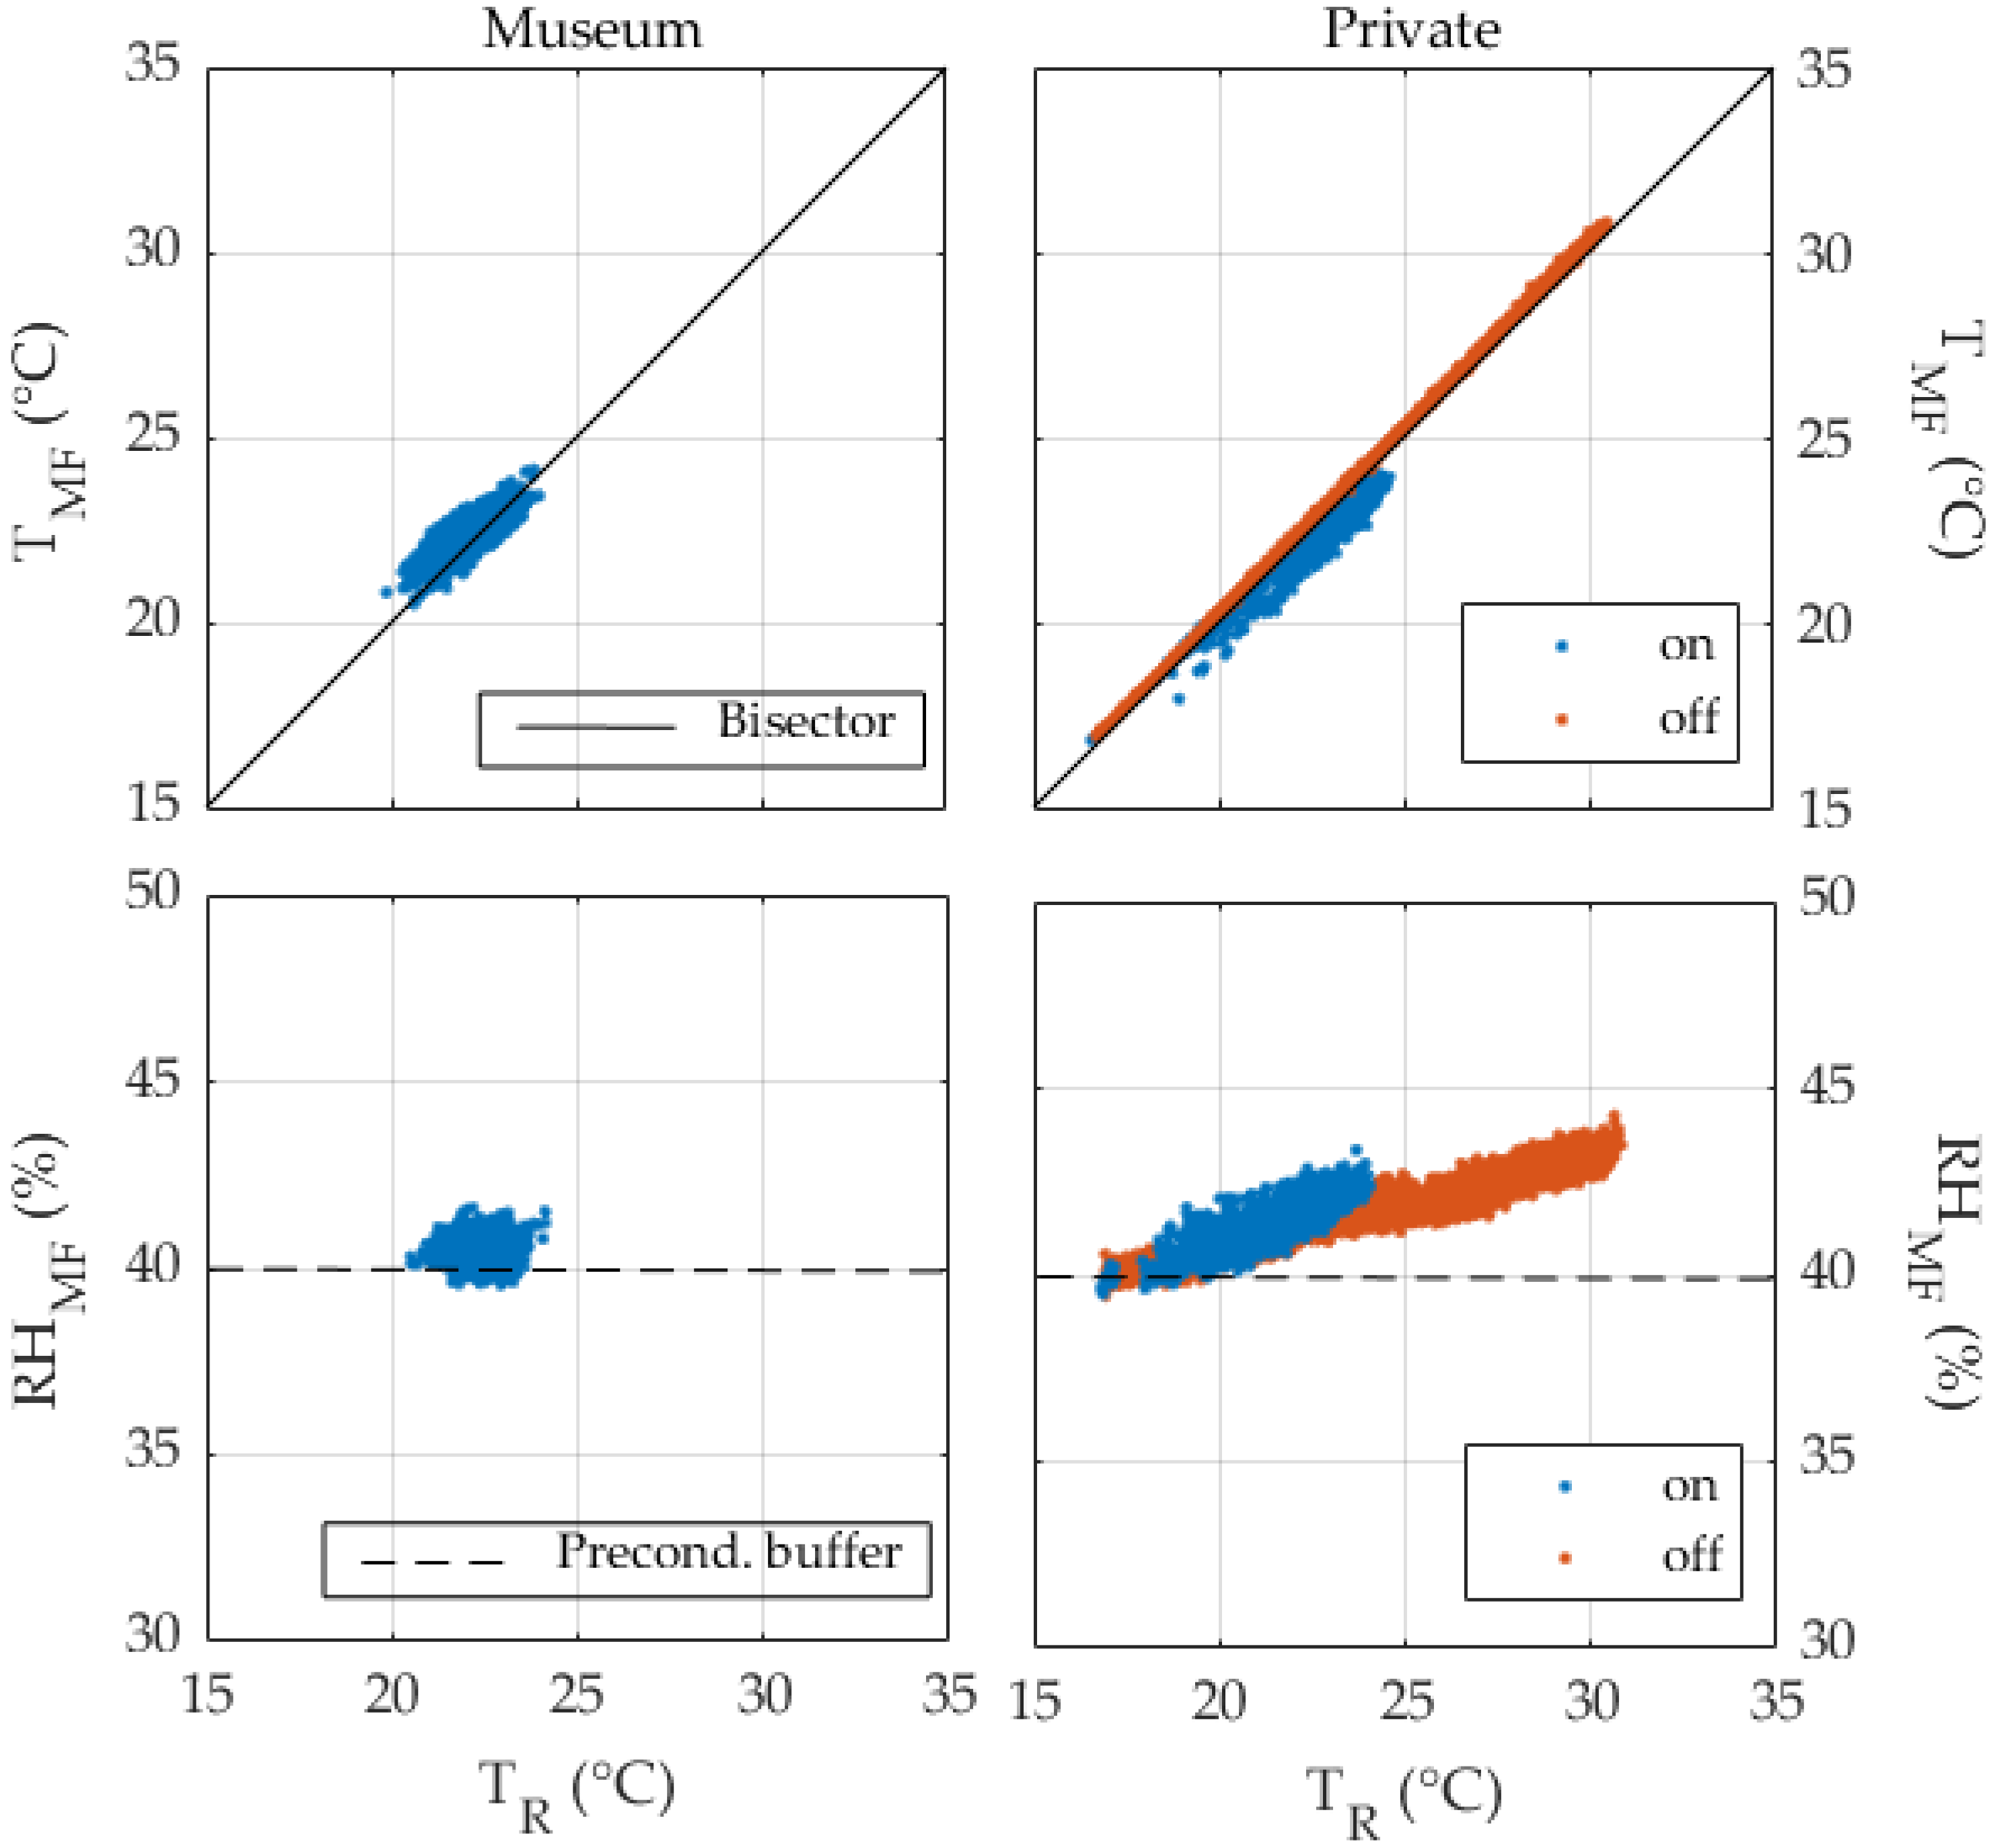
The hygrothermal response of the microclimate frame was further explored by comparing their internal conditions to the simultaneous room ones, as shown in the scatterplots in Figure 3. The two indoor environments are thermally controlled by active systems: in Museum, a HVAC system continuously controls temperature maintaining thermal stability with a minimal setpoint adjustment from winter to summer; in Private, an intermittent heating system is active only during the cold season, without any cooling in summer. Both in Museum and in Private, the internal MF temperatures closely follow the surrounding room conditions with a minor delay. In Private, when the heating system is switched off, the internal MF temperatures perfectly match those external, meaning that the thermal cycle is transferred unchanged inside the microclimate frame. The performance of the buffer is examined by relating the internal RH values to the external R temperatures: in Museum, where T is kept almost stable, the considerable RH variability of the room is tightly controlled inside the MF; in Private, as a consequence of the variability of the R temperatures, the internal RH values show a minor drift despite being below significance (Figure 3, lower panels).
Table 2 shows the results of the ASHRAE classification. Both Museum and Private rooms are associated to ASHRAE Class D, which protects only from mold growth with RH [17]. The employment of microclimate frame in Museum made it possible to reach Class AA, providing the best possible microclimate for the preventive conservation of the paintings (Table 2); in Private only Class B could be achieved, which however is considered the reference to prevent from mechanical damage [2] as it provides no risk for many artifacts and most books even if a moderate risk for high vulnerability artifacts and paintings remains. Analyzing the T and RH data collected in the Private, the amount of observations overcoming the tolerance bands of Class AA is significantly reduced, passing from of the R values fitting into the required specifications to of the MF ones.
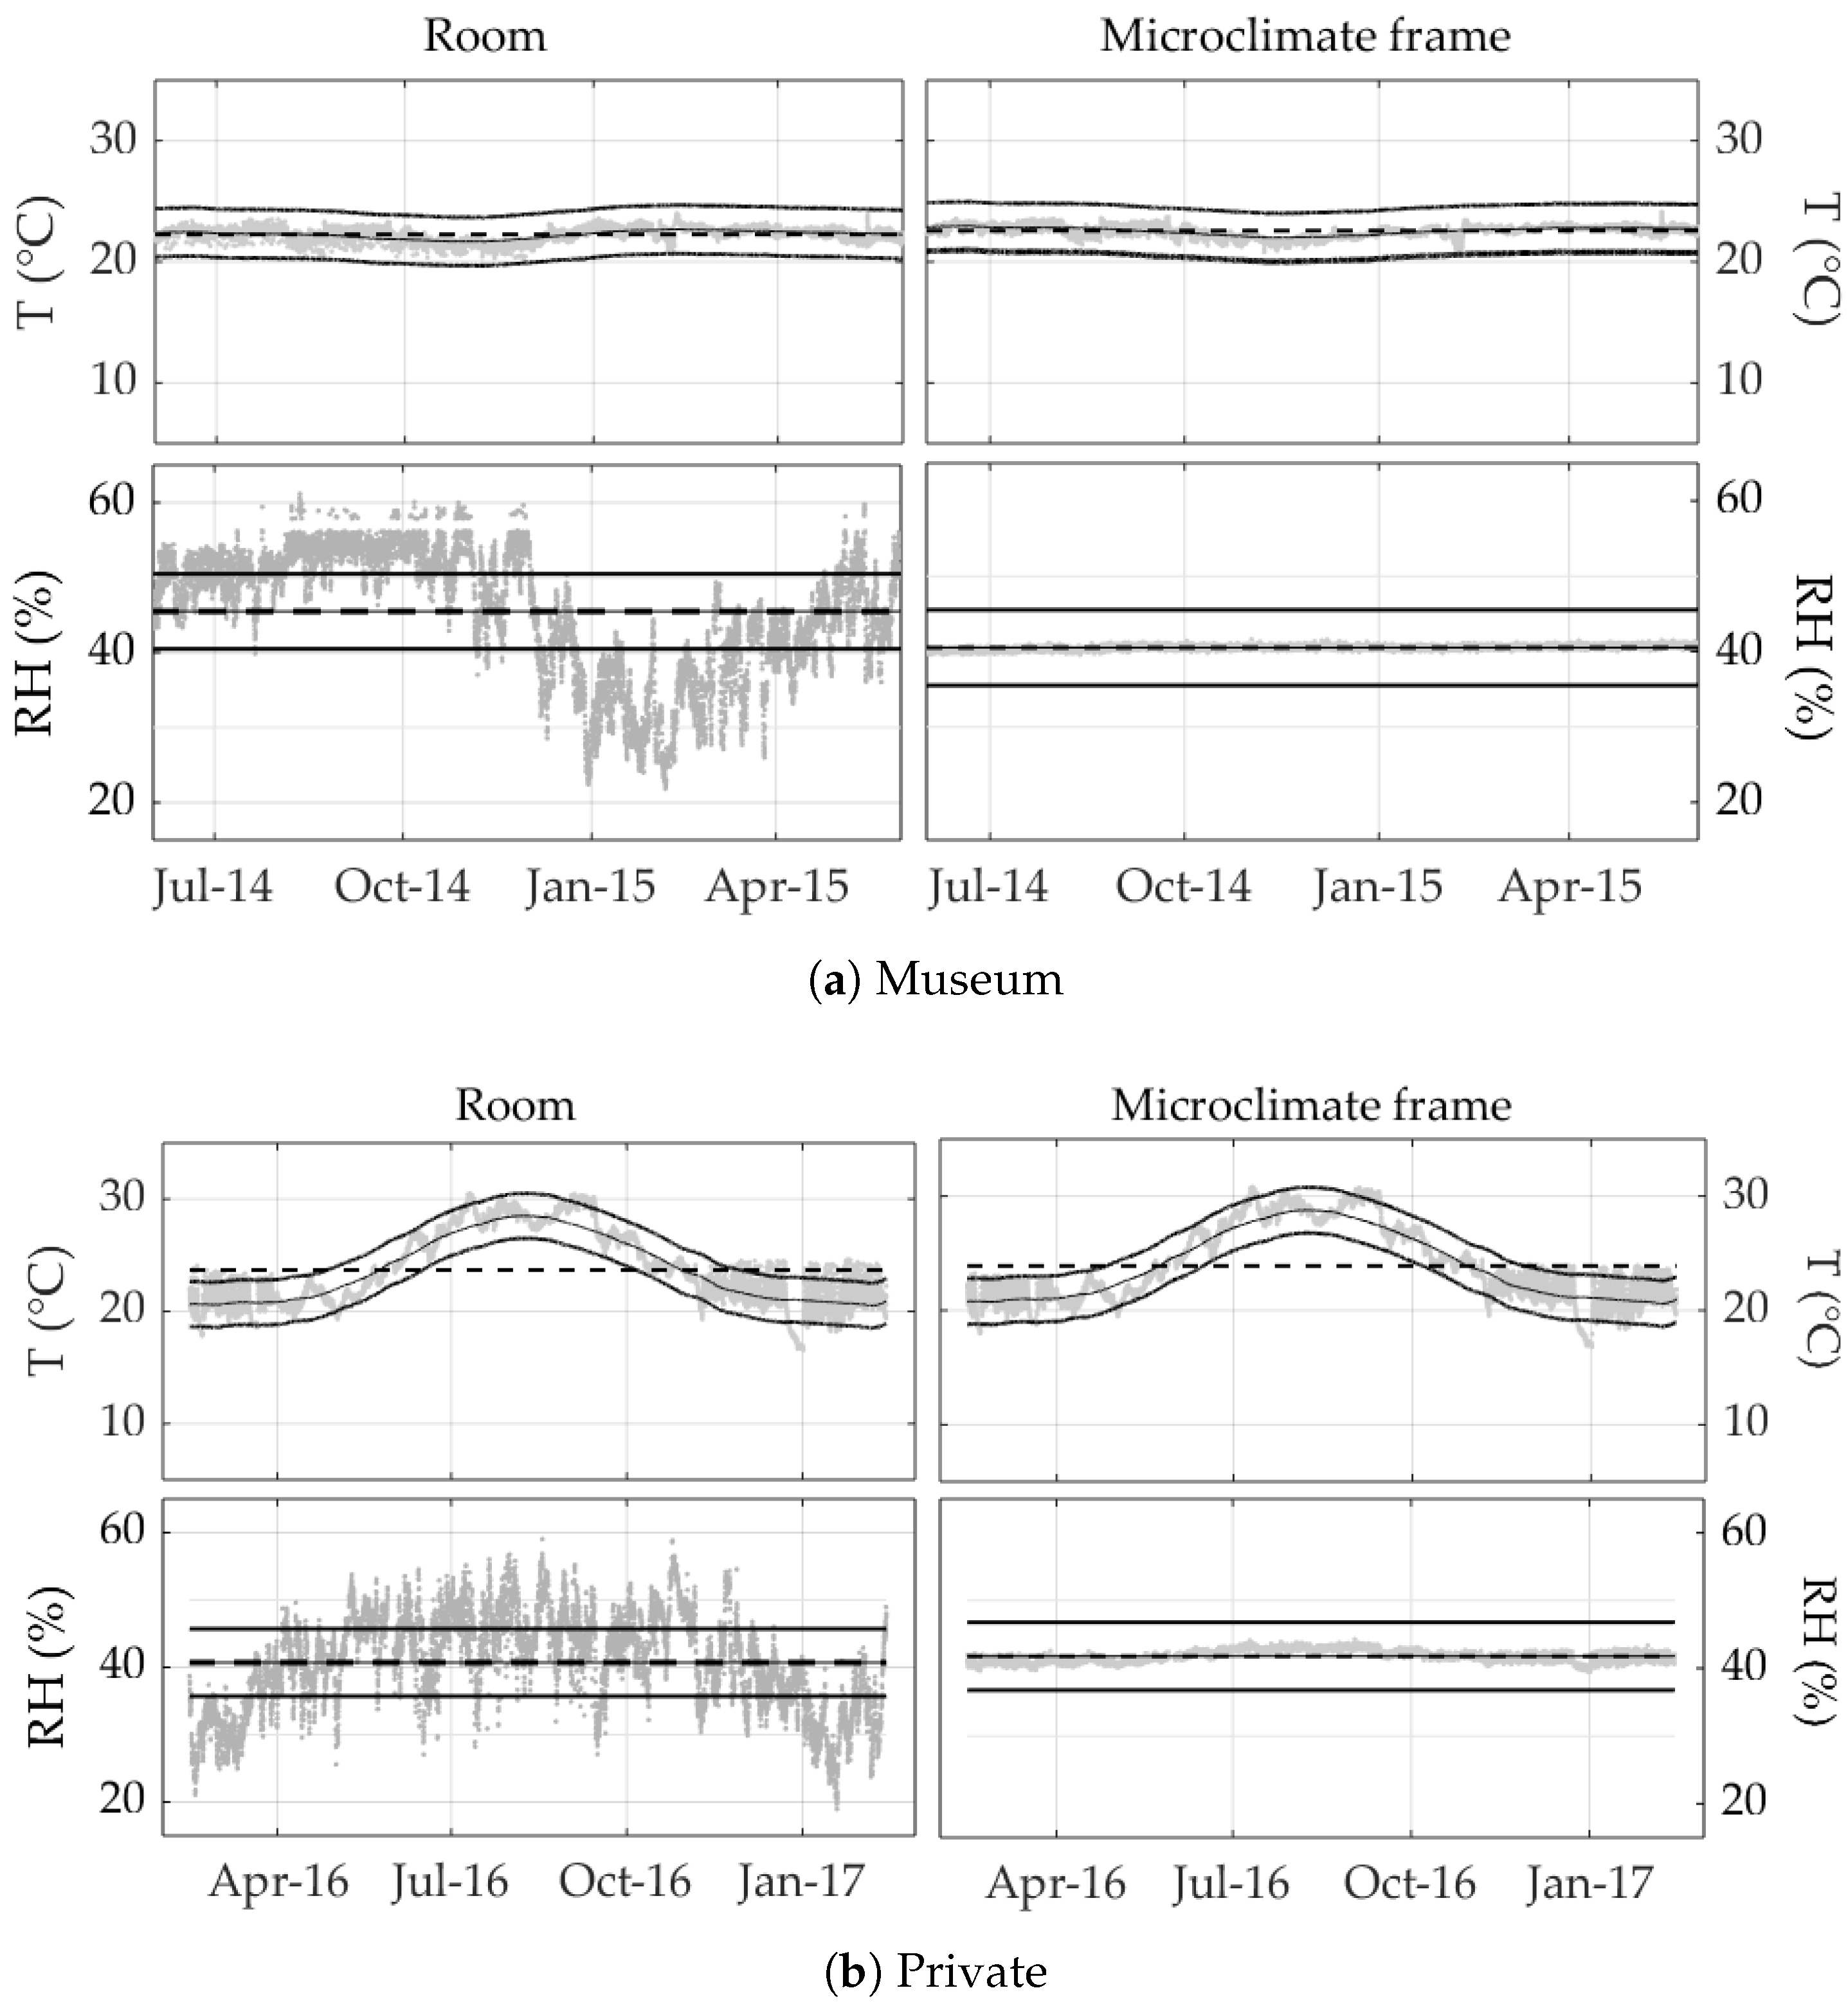
In Figure 4, the bands of tolerance for ASHRAE Class AA are plotted together with the measured hourly data, better explaining the conditions established inside the microclimate frame in comparison to the surrounding room. Class AA considers a seasonal adjustment of ±2 C respect to the annual mean with short-term fluctuations from the seasonal 91-day central moving average smaller than ±5 C for temperature and no seasonal adjustment respect to the annual mean of relative humidity with short-term fluctuations below . Both in Museum and in Private, in the room environments, the observed RH fluctuations reach up to ; however, simultaneous RH values inside the MF are kept reliably around . In Private (Figure 4b), temperatures exceed 30 C in summer and are occasionally below the lower tolerance band in winter. These values, being transferred inside the microclimate frame, are responsible for the impossibility to achieve ASHRAE Class AA as they are not compatible with conservation.
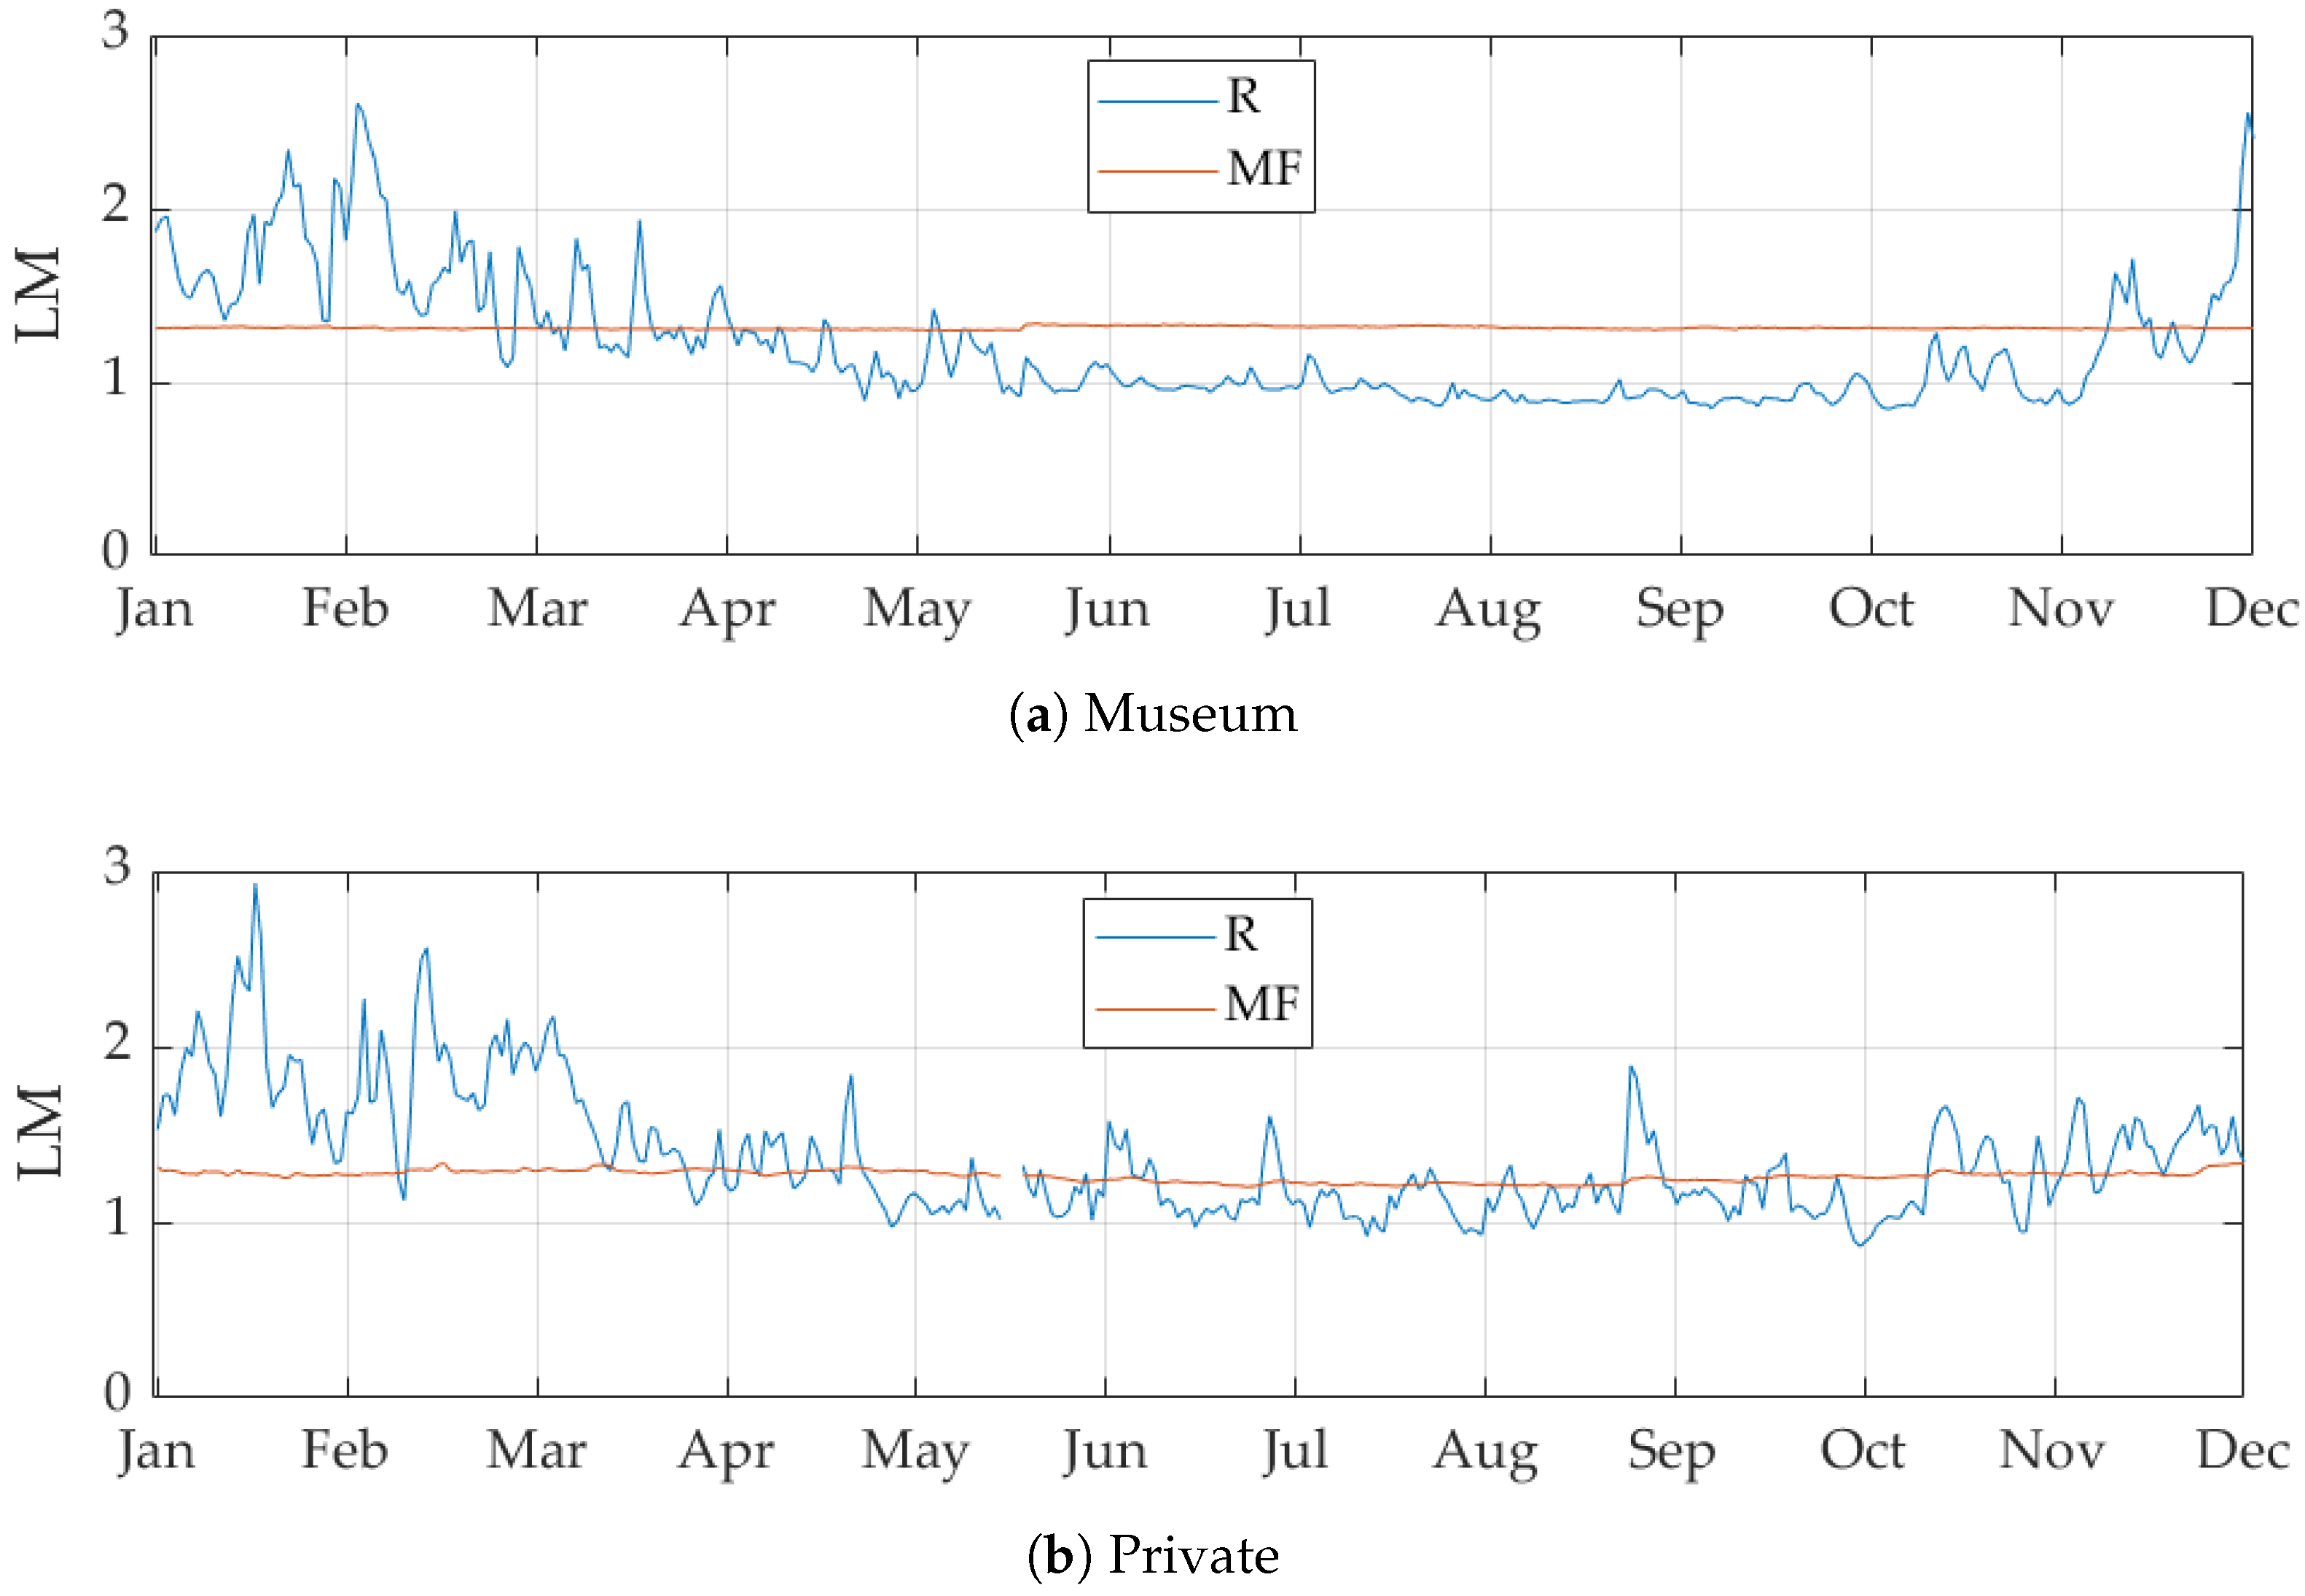
The risk of chemical deterioration in the two sites was assessed through the Lifetime Multiplier, as shown in Figure 5. During winter, the LM values associated to both the rooms are higher as a consequence of the considerable drop in RH. However, it has to be highlighted that RH values below may be dangerous for paper conservation (particularly when handling is foreseen) because at low moisture content the flexibility decreases while the brittleness increases [20]. In Museum, where temperature is controlled, an improvement in the duration expectancy of paper objects was observed inside the MF thanks to the buffering in RH values. In Private, the hot summer temperatures account for the almost unchanged average LM values obtained inside the devices. This result is justified by the the greater effect exerted by a drop in temperature on the increase in the life expectancy of an object with respect to the beneficial effect due to an equal drop in relative humidity [36].
The heat and moisture sinusoidal transfer functions in Private were determined as described in Section 2.4. The T and RH data monitored in the residential building were chosen as it is unconditioned for most of the year as well as being the conservation site when the study was conducted. The observations collected during the heating period were discarded in the following analysis. Two sinusoidal equations were fitted to the outdoor data in the area of Valencia [35] and the indoor values monitored in the room. Figure 6 shows the combination of the outdoor T and MR data (i.e., T and MR) in abscissa, with the indoor ones (i.e., T and MR) in ordinate. The coupled indoor and outdoor sinusoidal fits form the hysteresis cycle during the year. For temperature, it has the shape of an ellipse due to the thermal inertia of the building envelope and the building use and the T phase shift () is . For mixing ratio, the yearly cycle is a straight line, meaning that the indoor MR conditions reach a rapid equilibrium with the outdoor ones; indeed, the MR phase shift is , equal to a delay of about half a day for moisture transfer. It is worth noticing that the results could have been partially affected by the derivation of the transfer functions from the reduced dataset (i.e., including only the period not affected by the heating).
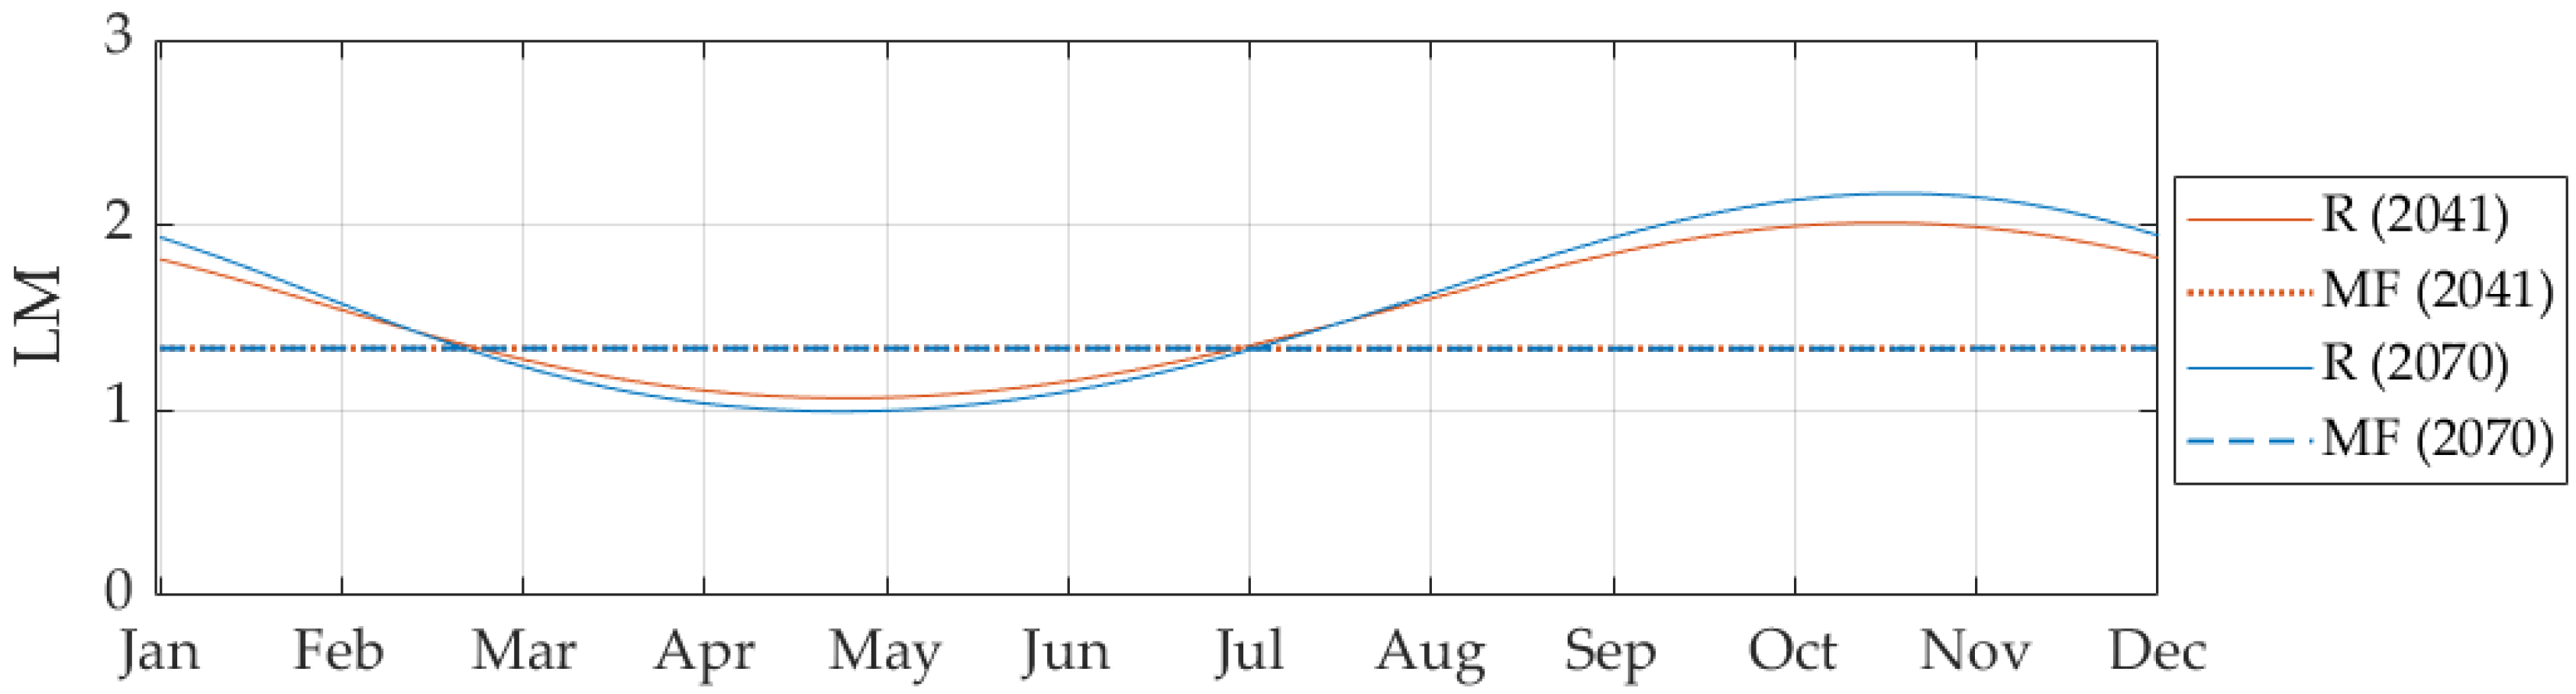
The ENSEMBLES scenario for the period 2041–2070 in the area of Valencia forecasts an increase in the outdoor temperature of about +3.5 C and an increase in the outdoor mixing ratio of about g/kg, resulting in an average decrease of in the outdoor RH. The heat and moisture transfer functions allowed simulating the indoor T and MR conditions inside the residential building: in the same 30-year window, the annual average levels are expected to be 27.5 C for temperature and for relative humidity. The potential chemical risk associated to these hygrothermal conditions was assessed through the Lifetime Multiplier values. As shown in Figure 7, the expected change in the indoor climate would lead to augmented chemical risk for cellulose during spring and to improved environmental quality of conservation in autumn. In the hypothesis of the maintenance of the use of the passive microclimate frame with a stable internal RH around , the expected thermal level within the MF would keep the risk of chemical deterioration constant at LM = 1.3, meaning an extended lifetime expectancy for the painting if compared to the standard conditions (T = 20 C, RH ).
4. Conclusions
The hygrothermal response of a passive microclimate frame hosting a portrait on cardboard by Sorolla was investigated by analyzing its internal T and RH conditions in response to the surrounding room environment. Its behavior was monitored in two different sites, i.e., the Pio V Museum of Valencia (Museum), with temperatures kept almost stable during the year, and a residential building (Private) in the same area, with a heating system active only in winter. The microclimate frame (MF) proved to be highly effective in controlling the internal RH levels but to be strongly influenced by the boundary thermal variability of the room. The ASHRAE classification of climate quality for conservation pointed out that the hygrothermal conditions in both Museum and Private would have prevented the painting only from the risk of dampness (Class D). On the contrary, within the microclimate frame, since the most dangerous seasonal RH cycles and short-term RH fluctuations were filtered out, the internal MF conditions were found to be compatible with ASHRAE Class B in Private and with ASHRAE Class AA in Museum, ensuring the best possible protection for the artifact. Moreover, the risk of chemical degradation for cellulose was assessed through the Lifetime Multiplier index, which confirmed that the microclimate frame is capable of better mitigating the risks in environments where temperature levels are adequate for conservation (Museum).
To extend our analysis to the application of the microclimate frame in the future, this study showed an example of how the indoor climate can be simulated in unconditioned buildings. In view of the climate ENSEMBLES-A1B scenario for the period 2041–2070 in the area of Valencia, this approach provided insight of the future hygrothermal conditions in Private. Even if the outdoor climate scenario is likely to be beneficial to the conservation of paper indoors in autumn, an increased risk of cellulose degradation would probably be observed during spring. The adoption of passive microclimate frames in the future expected conditions indoors would thus be an effective preventive conservation measure but it is yet important to be aware that these passive enclosures may not be sufficient to fully avoid the chemical degradation risk if an additional mitigation of the unsuitable temperatures is not provided. Considerable improvements on the current and future indoor climate might be provided by implementing some beneficial practices in the management of the environment. For example, the windows’ opening might be rescheduled in order to enhance natural ventilation and a cooling device might be helpful to reduce the summer temperature peaks. In addition, passive retrofit intervention on the building envelope may be considered in order to relieve the expected effects of the climate change scenario in a sustainable manner. Notwithstanding the fact that the microclimate frames do not affect the user experience in terms of their overall dimensions and appearance, the adoption of these devices should imply that the ordinary management is adjusted according to their specific features. Indeed, large temperature fluctuations in the surrounding space may cause the absorption/release of considerable amounts of moisture by the buffering agent, determining the possibility of moisture exchanges with the painting itself. This means that it is fundamental to be aware of the effect over moisture exchanges exerted by temperature, which is not controlled within these passive enclosures. Moreover, since buffers are susceptible to ageing and loss of their buffering properties, it is fundamental to recondition and/or replace them on a regular basis in order to preserve their effectiveness.
Author Contributions
All authors helped to develop the manuscript. Conceptualization, Formal analysis and Writing—original draft, E.V. and F.F.; Supervision, Writing—review and editing, A.M.S.; and Resources and Data curation F.-J.G.-D.
Funding
This project received funding from the European Union’s Horizon 2020 research and innovation programme under grant agreement No. 814624. This research was partially supported by the Plan Nacionalde I+D, Comisión Interministerial de Ciencia y Tecnología (FEDER-CICYT) under project HAR2013-47895-C2-1-P.
Acknowledgments
The authors thank CollectionCare for the funds for the publication, the Museum Pio V of Valencia, the staff of the IVACOR and the owners of the paintings. E.V. thanks Sapienza Università di Roma for the internship mobility grant.
Conflicts of Interest
The authors declare no conflict of interest. The funders had no role neither in the design of the study, in the collection, analyses, or interpretation of data, nor in the writing of the manuscript or in the decision to publish the results.
Abbreviations
The following abbreviations are used in this manuscript:
| AEMET | National Agency of Meteorology of the Spanish Government |
| ASHRAE | American Society of Heating, Air-Conditioning and Refrigerating Engineers |
| CO | Carbon dioxide |
| HVAC | Heating, Ventilation and Air-Conditioning |
| IPCC | Intergovernmental Panel on Climate Change |
| IVACOR | Valencian Institute of Conservation and Restoration |
| LM | Lifetime Multiplier |
| MF | Microclimate Frame |
| MR | Mixing ratio of humid air (g/kg) |
| RH | Relative humidity (%) |
| T | Temperature (C) |
| TF | Transfer Function |
| UPV | Polytechnic University of Valencia |
References
- Camuffo, D. Microclimate for Cultural Heritage. Conservation, Restoration, and Maintenance of Indoor and Outdoor Monuments, 2nd ed.; Elsevier: Amsterdam, The Netherlands, 2014; ISBN 9780444632968. [Google Scholar]
- Bratasz, Ł. Allowable microclimatic variations in museums and historic buildings: Reviewing the guidelines. In Climate for Collections: Standards and Uncertainties; Ashley-Smith, J., Burmester, A., Eibl, M., Eds.; Doerner Institut: Munich, Germany, 2013; pp. 11–19. [Google Scholar]
- Luciani, A. Evolution of thermo-hygrometric standards. In Indoor Environment and Preservation Climate Control in Museums and Historic Buildings; Nardini: Florence, Italy, 2011; ISBN 9788840443393. [Google Scholar]
- EN 15999-1:2014. Conservation of Cultural Heritage - Guidelines for Design of Showcases for Exhibition and Preservation of Objects—Part 1: General Requirements; European Committee for Standardization: Brussels, Belgium, 2014. [Google Scholar]
- Bickersteth, J. IIC and ICOM-CC 2014 declaration on environmental guidelines. Stud. Conserv. 2016, 61, 12–17. [Google Scholar] [CrossRef]
- Perino, M. Air tightness and RH control in museum showcases: Concepts and testing procedures. J. Cult. Herit. 2018, 34, 277–290. [Google Scholar] [CrossRef]
- Shiner, J. Trends in microclimate control of museum display cases. In Proceedings of the Museum Microclimates: Contributions to the Copenhagen Conference, Copenhagen, Denmark, 19–23 November 2007; pp. 19–23. [Google Scholar]
- Camuffo, D.; Sturaro, G.; Valentino, A. Showcases: A really effective mean for protecting artworks? Thermochim. Acta 2000, 365, 65–77. [Google Scholar] [CrossRef]
- Bernardi, A.; Becherini, F.; Romero-Sanchez, M.D.; Lopez-Buendia, A.; Vivarelli, A.; Pockelé, L.; De Grandi, S. Evaluation of the effect of phase change materials technology on the thermal stability of Cultural Heritage objects. J. Cult. Herit. 2014, 15, 470–478. [Google Scholar] [CrossRef]
- Dahalin, E. (Ed.) Improved Protection of Paintings during Exhibition, Storage and Transit. In PROPAINT-Final Activity Report; Norwegian Institute for Air Research: Kjeller, Norway, 2010. [Google Scholar]
- Richard, M. Further Studies on the Benefits of Adding Silica Gel to Microclimate Packages for Panel Paintings. In Facing the Challenges of Panel Painting Conservation: Trends, Treatments, and Training, Proceedings of the a Symposium at the Getty Centre, Phenix, Los Angeles, CA, USA, 17–18 May 2009; Getty Conservation: Los Angeles, CA, USA, 2011. [Google Scholar]
- Ferreira, C.; de Freitas, V.P.; Ramos, N.M.M. Influence of hygroscopic materials in the stabilization of relative humidity inside museum display cases. Energy Procedia 2015, 78, 1275–1280. [Google Scholar] [CrossRef]
- Thickett, D.; Fletcher, P.; Calver, A.; Lambarth, S. The effect of air tightness on RH buffering and control. In Proceedings of the Museum Microclimates: Contributions to the Copenhagen Conference, Copenhagen, Denmark, 19–23 November 2007; pp. 245–251. [Google Scholar]
- Sozzani, L. An economical design for a microclimate vitrine for paintings using the picture frame as the primary housing. J. Am. Inst. Conserv. 1997, 36, 95–107. [Google Scholar] [CrossRef]
- Michalski, S. The ideal climate, risk management, the ASHRAE chapter, proofed fluctuations, and towards a full risk analysis model. In Experts Roundtable on Sustainable Climate Management Strategies; Getty Conservation: Los Angeles, CA, USA, 2007; pp. 1–19. [Google Scholar]
- EN 15757:2010. Conservation of Cultural Property—Specifications for Temperature and Relative Humidity to Limit Climate-Induced Mechanical Damage in Organic Hygroscopic Materials; European Committee for Standardization: Brussels, Belgium, 2010. [Google Scholar]
- American Society of Heating, Refrigerating and Air-Conditioning Engineers (ASHRAE). ASHRAE Handbook—HVAC Applications: Chapter 24—Museums, Galleries, Archives and Libraries; ASHRAE: Atlanta, GA, USA, 2019. [Google Scholar]
- Martens, M. Climate Risk Assessment in Museums: Degradation Risks Determined from Temperature and Relative Humidity Data. Ph.D. Thesis, Eindhoven University of Technology, Eindhoven, The Netherlands, 2012. [Google Scholar]
- Huijbregts, Z.; Kramer, R.P.; Martens, M.H.J.; Van Schijndel, A.W.M.; Schellen, H.L. A proposed method to assess the damage risk of future climate change to museum objects in historic buildings. Build. Environ. 2012, 55, 43–56. [Google Scholar] [CrossRef]
- Menart, E.; De Bruin, G.; Strlič, M. Dose–response functions for historic paper. Polym. Degrad. Stab. 2011, 96, 2029–2039. [Google Scholar] [CrossRef]
- Kompatscher, K.; Kramer, R.P.; Ankersmit, B.; Schellen, H.L. Intermittent conditioning of library archives: Microclimate analysis and energy impact. Build. Environ. 2018, 147, 50–66. [Google Scholar] [CrossRef]
- Rajčić, V.; Skender, A.; Damjanović, D. An innovative methodology of assessing the climate change impact on cultural heritage. Int. J. Archit. Herit. 2018, 12, 21–35. [Google Scholar] [CrossRef]
- Bonazzi, A.; Merlo, C.; Campana, F.; Bertolin, C.; Camuffo, D. Past, present and future effects of climate change on a wooden inlay bookcase cabinet: A new methodology inspired by the novel European Standard EN 15757:2010. J. Cult. Herit. 2013, 15, 26–35. [Google Scholar] [CrossRef]
- Bertolin, C.; Camuffo, D.; Bighignoli, I. Past reconstruction and future forecast of domains of indoor relative humidity fluctuations calculated according to EN 15757: 2010. Energy Build. 2015, 102, 197–206. [Google Scholar] [CrossRef]
- CORDIS. CLIMATE FOR CULTURE—Damage Risk Assessment, Economic Impact and Mitigation Strategies for Sustainable Preservation of Cultural Heritage in the Times of Climate Change. Available online: https://cordis.europa.eu/project/rcn/92906/factsheet/en (accessed on 28 June 2019).
- Leissner, J.; Kilian, R.; Kotova, L.; Jacob, D.; Mikolajewicz, U.; Broström, T.; Ashley-Smith, J.; Schellen, H.L.; Martens, M.; van Schijndel, J.; et al. Climate for Culture: Assessing the impact of climate change on the future indoor climate in historic buildings using simulations. Herit. Sci. 2015, 3, 38. [Google Scholar] [CrossRef]
- García-Diego, F.J.; Verticchio, E.; Beltrán, P.; Siani, A.M. Assessment of the minimum sampling frequency to avoid measurement redundancy in microclimate field surveys in museum buildings. Sensors 2016, 16, 1291. [Google Scholar] [CrossRef] [PubMed]
- AEMET. Climate Projections for the XXI Century: Dynamic Regional Projections Based on the MPI-REMO Model Using the IPCC Emission Scenario A1B. Available online: http://www.aemet.es/es/serviciosclimaticos/cambio$_$climat/datos$_$diarios (accessed on 28 June 2019).
- Roldán, C.; Juanes, D.; Ferrazza, L.; Carballo, J. Characterization of Sorolla’s gouache pigments by means of spectroscopic techniques. Radiat. Phys. Chem. 2016, 119, 253–263. [Google Scholar] [CrossRef]
- IVACOR. Institut Valenciá de Conservació i Restauració de Béns. Dos dibujos de Joaquin Sorolla de la Familia Traver. 2014. Available online: http://www.ivcr.es/media/descargas/monografia-sorolla-familia-traver-w.pdf (accessed on 28 June 2019).
- Diego, F.J.; Esteban, B.; Merello, P. Design of a hybrid (wired/wireless) acquisition data system for monitoring of cultural heritage physical parameters in smart cities. Sensors 2015, 15, 7246–7266. [Google Scholar] [CrossRef] [PubMed]
- EN 15758:2010. Conservation of Cultural Property—Procedures and Instruments for Measuring Temperatures of the Air and the Surface of Objects; European Committee for Standardization: Brussels, Belgium, 2010. [Google Scholar]
- EN 16242:2012. Conservation of Cultural Property – Procedures and Instruments for Measuring Humidity in the Air and Moisture Exchanges Between Air and Cultural Property; European Committee for Standardization: Brussels, Belgium, 2012. [Google Scholar]
- ASTME 104-02. Standard Practice for Maintaining Constant Relative Humidity by Means of Aqueous Solutions; ASTM International: West Conshohocken, PA, USA, 2012. [Google Scholar]
- Universitat Politècnica de València (UPV). Historical weather observations in Valencia. Available online: http://dataupv.webs.upv.es/datos-historicos-de-la-observacion-meteorologica-en-valencia/ (accessed on 28 June 2019).
- Michalski, S. Double the life for each five-degree drop, more than double the life for each halving of relative humidity. In Proceedings of the Preprints of the ICOM-CC 13th Triennial Meeting, Rio de Janeiro, Brazil, 22–27 September 2002; James and James (Science Publishers) Ltd.: London, UK, 2002; pp. 66–72. [Google Scholar]
- CORDIS. ENSEMBLES-Based Predictions of Climate Changes and Their Impacts. Available online: https://cordis.europa.eu/project/rcn/74001/factsheet/en (accessed on 28 June 2019).
Figure 1.
Portrait on cardboard titled “Portrait of a lady with a red flower in her hair” by J. Sorolla (a); and schematic cross section of the microclimate frame used and layout of its components (b).
Figure 1.
Portrait on cardboard titled “Portrait of a lady with a red flower in her hair” by J. Sorolla (a); and schematic cross section of the microclimate frame used and layout of its components (b).

Figure 2.
Box-and-whisker plot of temperature (a) and relative humidity (b) inside the microclimate frame (MF) and in the surrounding room (R) throughout a solar year. Outliers are indicated as points.
Figure 2.
Box-and-whisker plot of temperature (a) and relative humidity (b) inside the microclimate frame (MF) and in the surrounding room (R) throughout a solar year. Outliers are indicated as points.

Figure 3.
Scatter diagram of simultaneous temperature (T) and relative humidity values (RH) in the rooms versus values inside the microclimate frame (T and RH) during a solar year. In Private, the data points are grouped based on whether the intermittent heating system is active (on) or not (off).
Figure 3.
Scatter diagram of simultaneous temperature (T) and relative humidity values (RH) in the rooms versus values inside the microclimate frame (T and RH) during a solar year. In Private, the data points are grouped based on whether the intermittent heating system is active (on) or not (off).

Figure 4.
Temperature and relative humidity the bands of tolerance for ASHRAE Class AA (thick lines) together with the values measured in Museum (a) and Private (b) during a year (grey points). The thin lines indicate the seasonal moving average, the dashed lines the annual mean of the measured values.

Figure 5.
Lifetime Multiplier values (LM) associated to the hygrothermal conditions over a solar year in Museum (a) and Private (b), in the room (R, blue) and inside the microclimate frame (MF, orange).
Figure 5.
Lifetime Multiplier values (LM) associated to the hygrothermal conditions over a solar year in Museum (a) and Private (b), in the room (R, blue) and inside the microclimate frame (MF, orange).

Figure 6.
Indoor versus outdoor temperature (left) and mixing ratio (right) daily data over the solar year monitored (grey dots). The best fit lines (in blue) describe the yearly cycle inside the building.
Figure 6.
Indoor versus outdoor temperature (left) and mixing ratio (right) daily data over the solar year monitored (grey dots). The best fit lines (in blue) describe the yearly cycle inside the building.

Figure 7.
Lifetime Multiplier (LM) associated to the expected climate in Private in 2041 (orange) and 2070 (blue) in the room (R, solid lines) and inside the microclimate frame (MF, dotted/dashed lines).
Figure 7.
Lifetime Multiplier (LM) associated to the expected climate in Private in 2041 (orange) and 2070 (blue) in the room (R, solid lines) and inside the microclimate frame (MF, dotted/dashed lines).


Table 1.
Technical features of the T and RH sensors used in the monitoring.
| T | RH | |
|---|---|---|
| Response time | 750 ms | 5 s |
| Uncertainty | ±0.5 C |
Table 2.
Attribution of the ASHRAE class of climate control in the four locations.
| ASHRAE Class | ||
|---|---|---|
| Position | Museum | Private |
| Room | D | D |
| Microclimate frame | AA | B |
© 2019 by the authors. Licensee MDPI, Basel, Switzerland. This article is an open access article distributed under the terms and conditions of the Creative Commons Attribution (CC BY) license (http://creativecommons.org/licenses/by/4.0/).
Share and Cite
MDPI and ACS Style
Verticchio, E.; Frasca, F.; Garcìa-Diego, F.-J.; Siani, A.M. Investigation on the Use of Passive Microclimate Frames in View of the Climate Change Scenario. Climate 2019, 7, 98. https://doi.org/10.3390/cli7080098
AMA Style
Verticchio E, Frasca F, Garcìa-Diego F-J, Siani AM. Investigation on the Use of Passive Microclimate Frames in View of the Climate Change Scenario. Climate. 2019; 7(8):98. https://doi.org/10.3390/cli7080098
Chicago/Turabian StyleVerticchio, Elena, Francesca Frasca, Fernando-Juan Garcìa-Diego, and Anna Maria Siani. 2019. "Investigation on the Use of Passive Microclimate Frames in View of the Climate Change Scenario" Climate 7, no. 8: 98. https://doi.org/10.3390/cli7080098
Note that from the first issue of 2016, this journal uses article numbers instead of page numbers. See further details here.