Article

Insurer Resilience in an Era of Climate Change and Extreme Weather: An Econometric Analysis

1
U.S. Department of Energy, Headquarters, Washington, DC 20585, USA
2
Nexus Group, Graduate School of Information Science and Technology, Hokkaido University, Sapporo 060-0817, Japan
*
Author to whom correspondence should be addressed.
Climate 2019, 7(4), 55; https://doi.org/10.3390/cli7040055
Submission received: 13 March 2019 / Revised: 27 March 2019 / Accepted: 4 April 2019 / Published: 8 April 2019
(This article belongs to the Special Issue Climate Change Resilience and Urban Sustainability)

Abstract

:
Having sustained, over the course of more than two decades, record-breaking natural catastrophe losses, American insurers and reinsurers are justifiably questioning the potential linkage between anthropogenic climate change and extreme weather. Here, we explore issues pertaining to this linkage, looking at both the likely short-term implications for the insurance industry, as well as potential longer-term impacts on financial performance and corporate resilience. We begin our discussion with an overview of the implications that climate change is likely to have on the industry, especially as it relates to how catastrophic risks are construed, assessed, and managed. We then present the rudiments of an econometric analysis that explores the financial resilience of the property/casualty (P/C) industry in the face of both natural and man-made catastrophes. In this analysis, we explore the profitability consequences of several illustrative scenarios involving large-scale losses from extreme weather—specifically, a sequence of storms like those striking the U.S. in 2004—and a scenario that explores the prospect of a Katrina-scale storm in combination with a mass terror attack on the scale of 9/11. At systemic levels of aggregation, our analysis suggests a high degree of macro-resilience for the P/C industry. Moreover, we find that insurer resilience is higher for larger impacts, considering both the speed of recovery, as well as the inverse of the area under the unaffected system profile. We conclude with a summary of our findings and a closing commentary that explores the potential implications of these results for P/C insurers moving forward.

Graphical Abstract

1. Introduction

1.1. Climate, Society, and Insurance Value

Even a cursory read of the day’s newspapers reveals that climatic change, broadly understood, is likely to impact society in ways that are, perhaps, only just beginning to be understood. For instance, Hurricanes Katrina (2005), Sandy (2012), and Harvey (2017), e.g., rank among the deadliest, most destructive tropical cyclones of the past half-century. As key instruments of loss mitigation and risk transfer, American insurers and reinsurers sit at the nexus of several crucial dimensions of the climate change problem, especially as it relates to the potential implications of climatic change for society and the global economy. Having, in the past decade-and-a-half, sustained record-breaking natural catastrophe losses, insurers and reinsurers are openly—and, indeed, justifiably—questioning the potential linkage between climate change and extreme weather, looking at both the likely short-term implications for the industry, as well as potential long-term impacts on financial performance and corporate sustainability. In truth, interest in this topic within the industry dates as far back as the late 1980s, with the appearance of Hurricane Gilbert in 1988. In addition to the insured losses arising from Hurricane Gilbert, interest in climate change was also spurred by signals from the scientific community that tropical cyclone activity in the North Atlantic was possibly being influenced by anthropogenic warming. In 1988, for example, the American Meteorological Society issued a policy statement postulating that greenhouse warming would, in the long run, lead to “a higher frequency and greater intensity of hurricanes” [1]. More recent efforts to explore this topic include [2,3].
Insurance in an age of global climate change is, in essence, a dual gamble. In the first instance, the gamble is one that sees insurers and reinsurers engaged in the process of making a series of (partially) informed bets on the potential frequency, severity, and consequences of natural catastrophe events—a task that is, in itself, fraught with complexity and uncertainty. In the second instance, global climate change also holds the potential to confound our current understanding of the causes and consequences of extreme weather events. If this portion of the dual gamble yields unfavorable outcomes for insurers, then it may signal the need for potentially drastic shifts in the way these risks are construed, assessed, and managed in the future.
It is well-understood that the global climate system is fundamentally chaotic in nature, which essentially precludes the possibility of reliable short- to medium-term extreme weather forecasts, as well as the precise estimation of key weather-related factors (e.g., humidity, precipitation, atmospheric and sea-surface temperatures, and wind activity). The chaotic microscale dynamics of climate results in “emergent self-similar” large-patterns [4,5] that are characterized by “bounded uncertainty” about the climate variables considered [6,7]. Climate forecasting technology continues to improve, though efforts to arrive at reliable predictions of long-term climate-related events at very small scales—such as rainfall, pressure, and temperature—are still characterized by high levels of “non-reducible” uncertainty, due mainly to the chaotic nature of such variables [8,9].

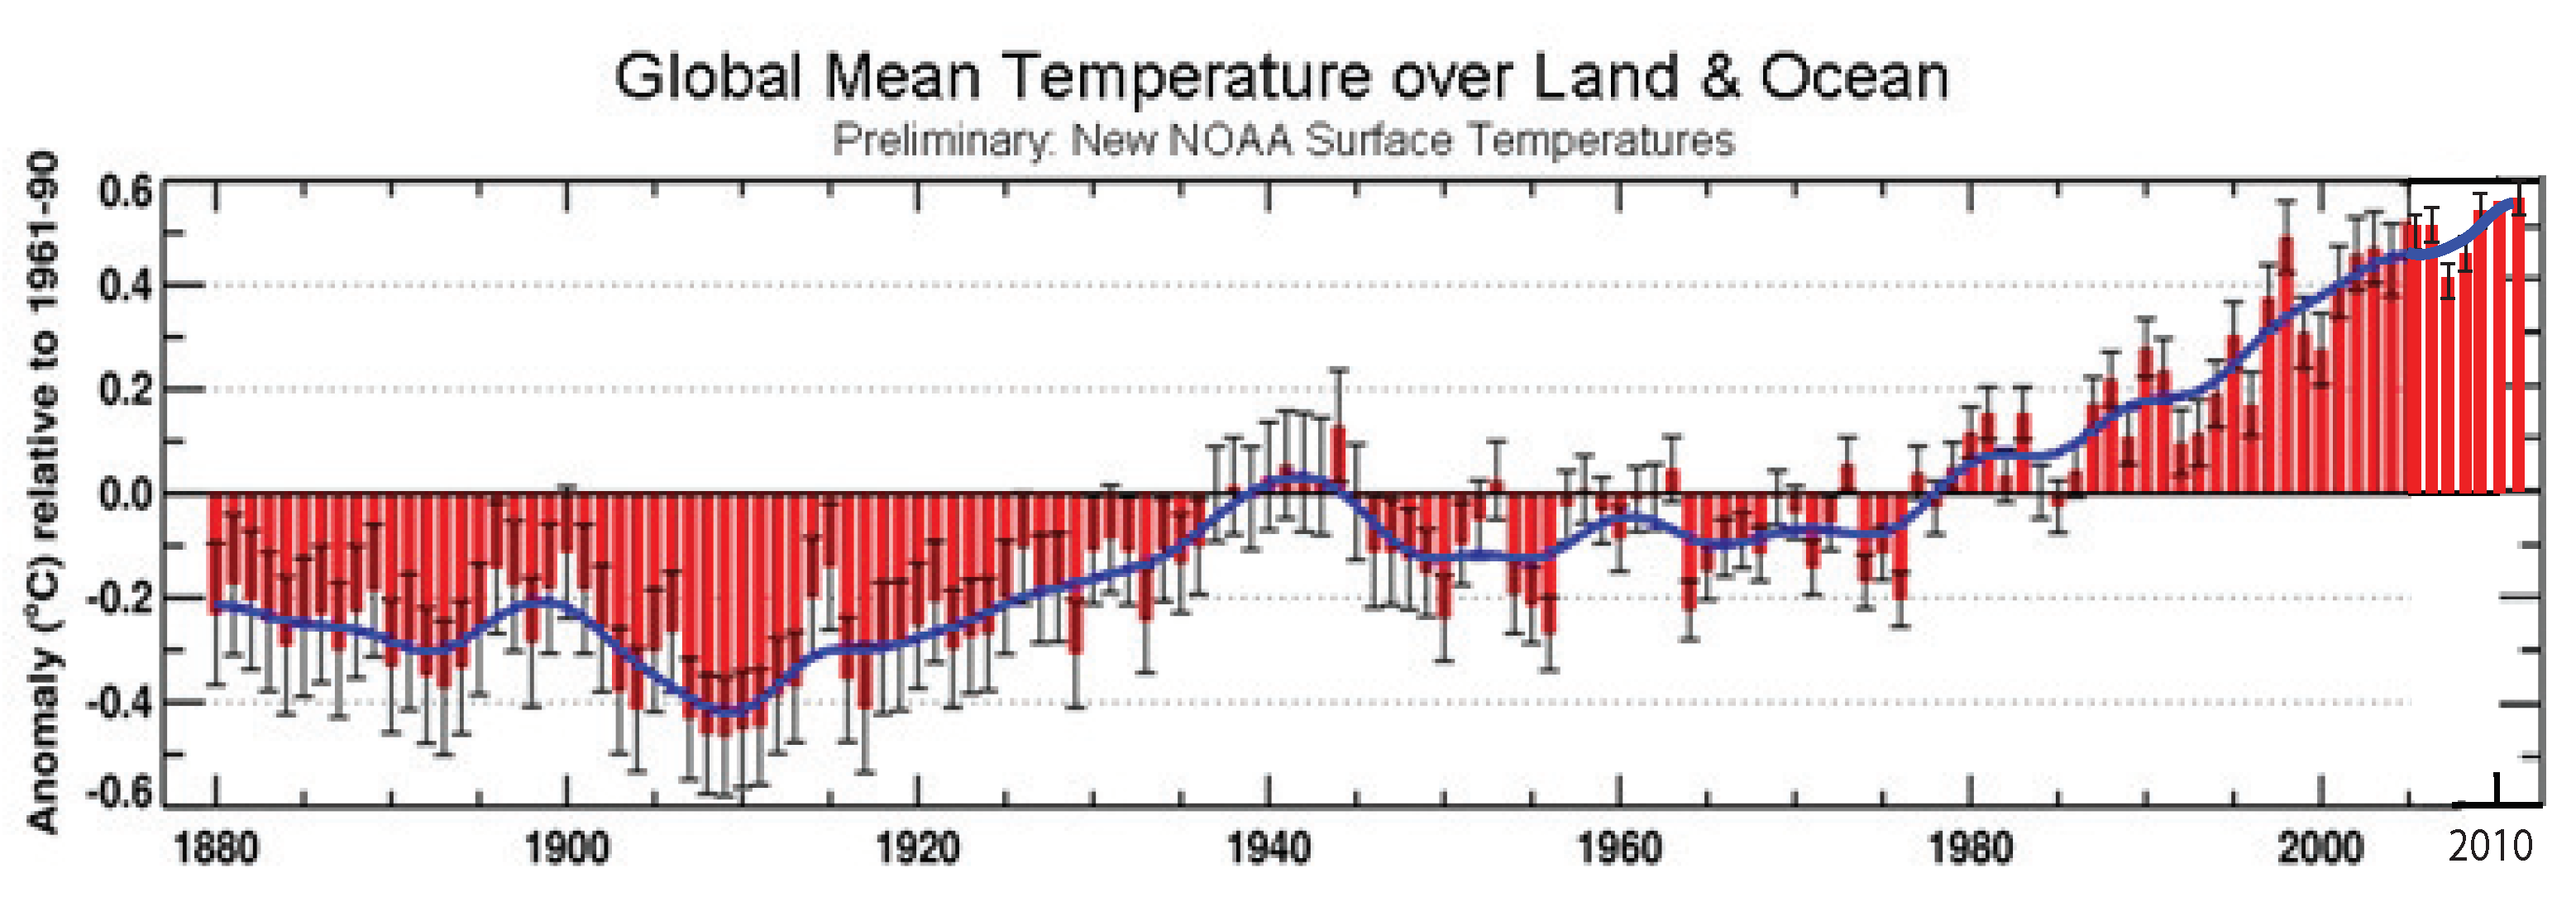
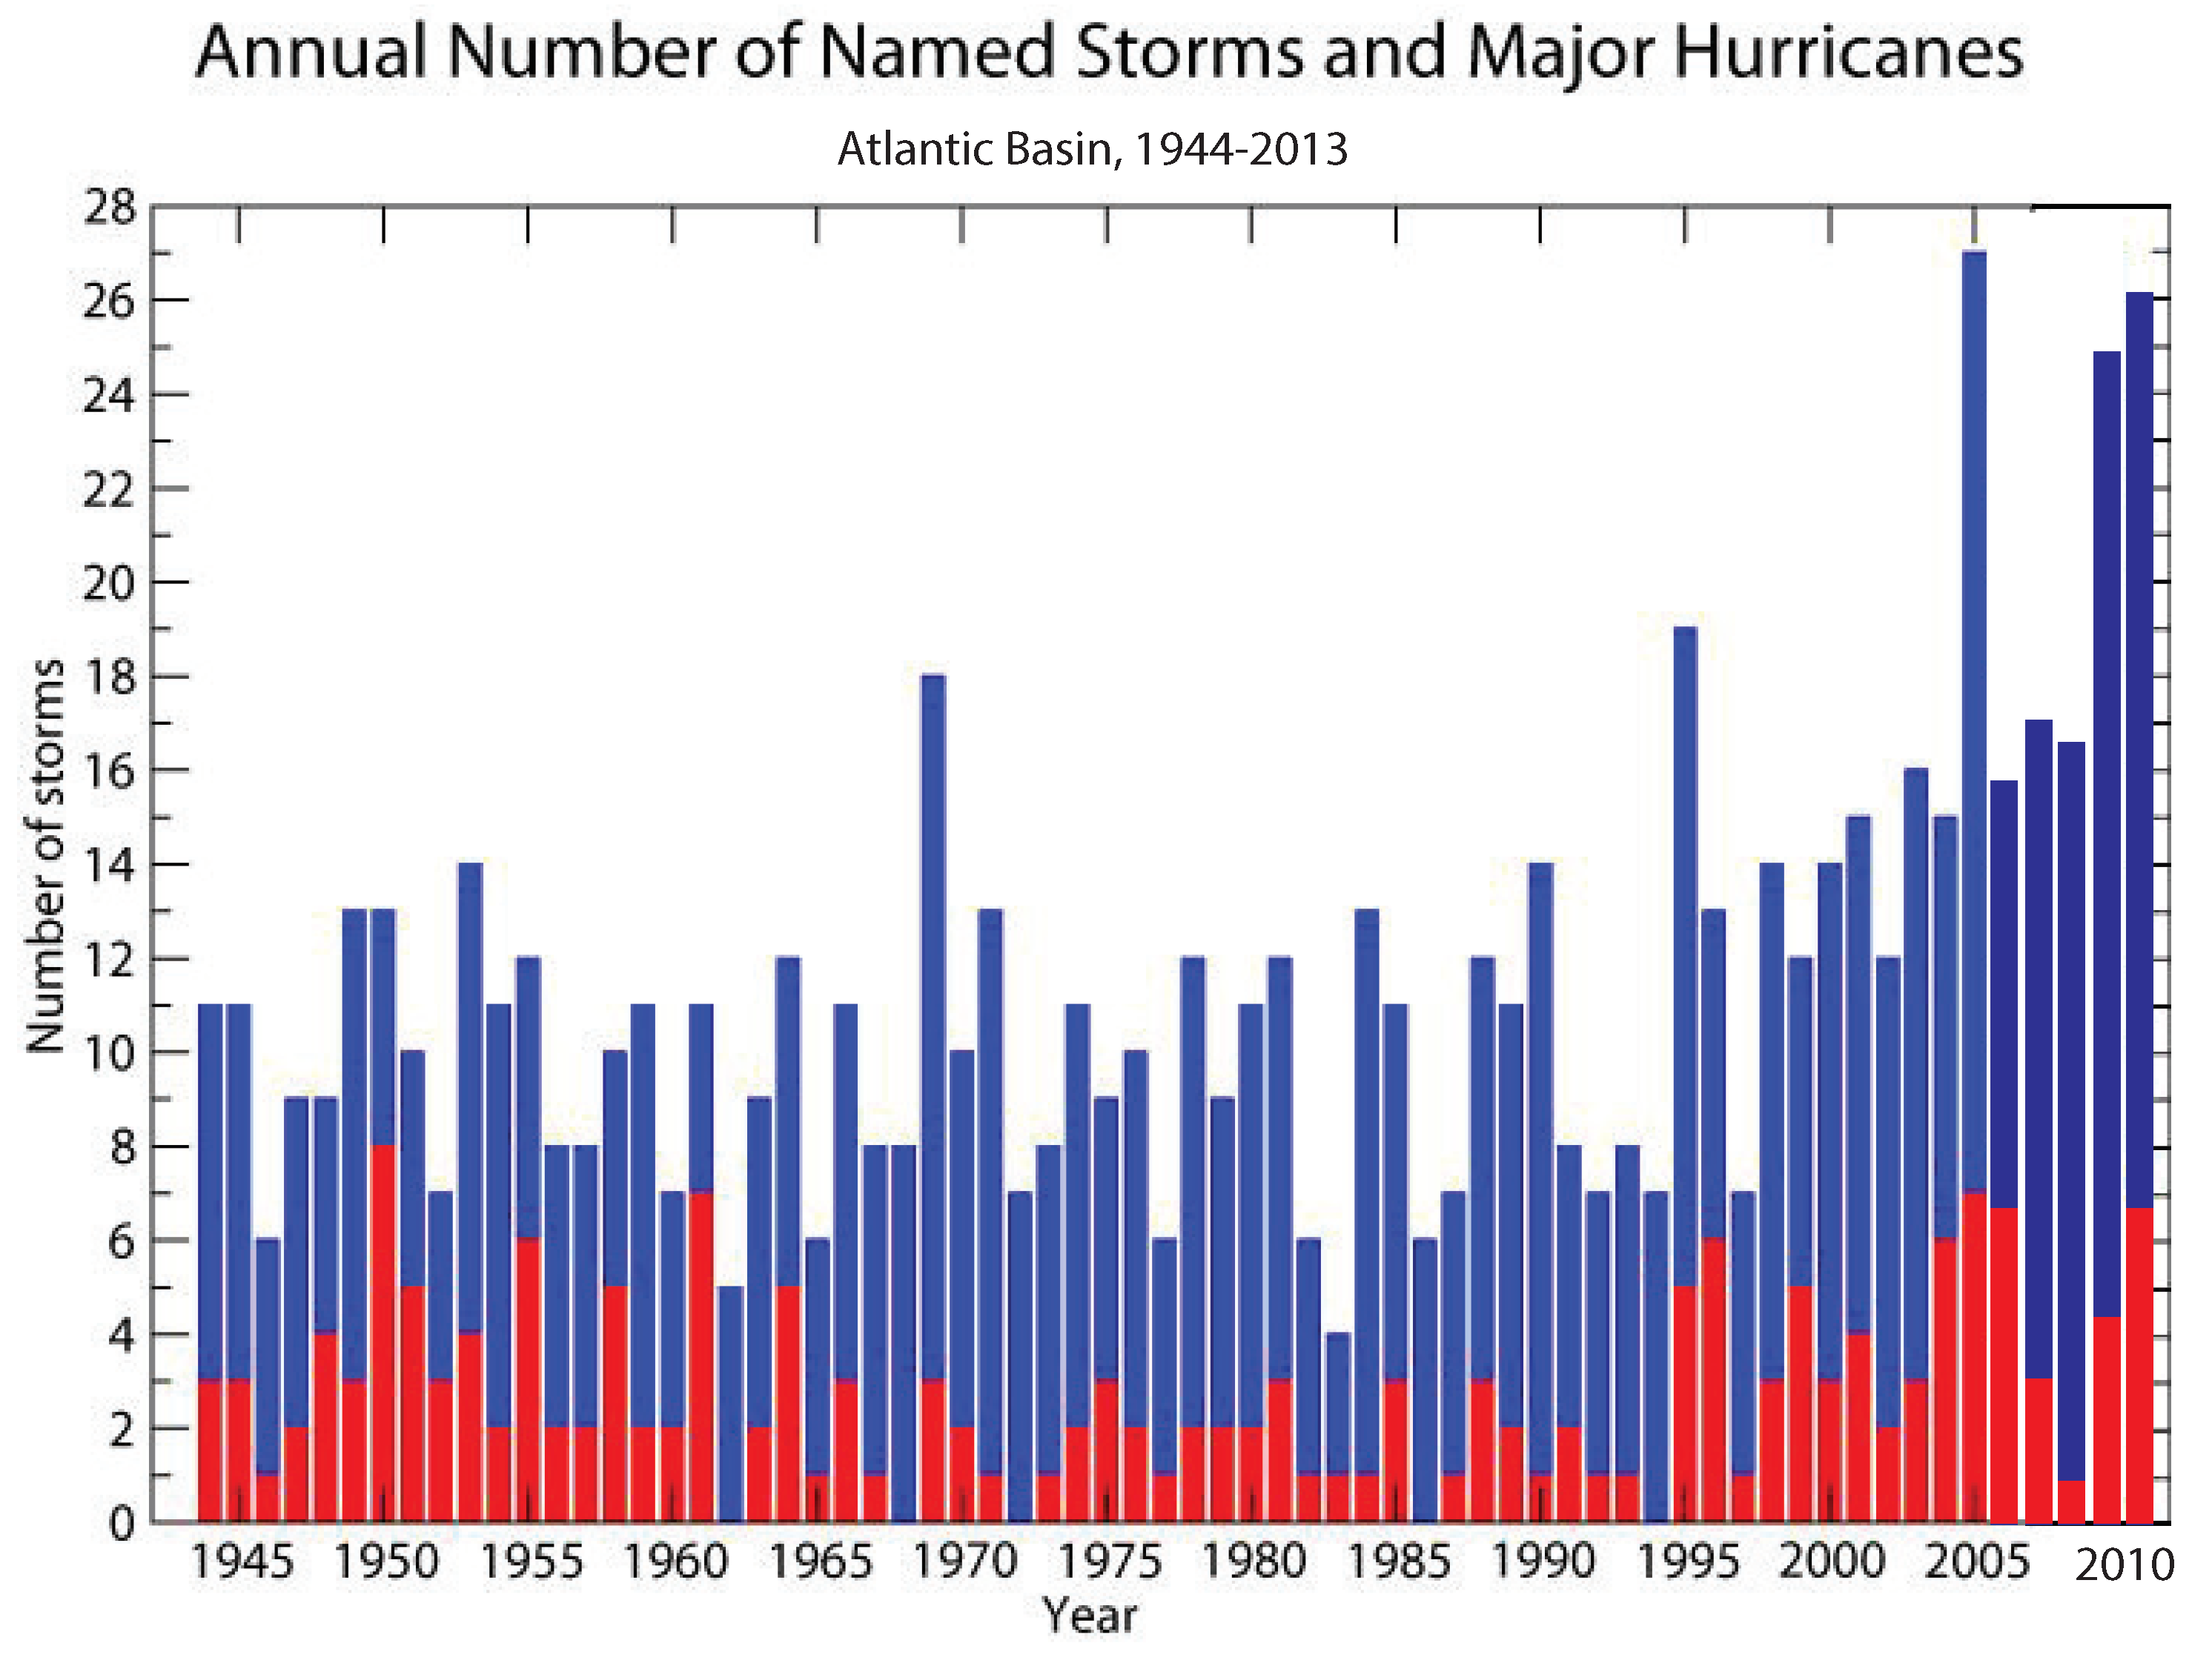
1.2. Is There a Connection between Climate Change and Hurricanes?

In the U.S., the destructive hurricane seasons of 2004 and 2005 left many within the insurance and reinsurance industries openly questioning whether the observed increases in the number of tropical storms and hurricanes in the North Atlantic might, in some way, be linked to anthropogenically induced climate change. In the intervening years, attention has focused on this question, from a plurality of vantage points [10,11,12]. In the realm of insurance, for example, Brown et al. [13] explores the potential use of insurance claims to predict damages and loss estimates; Siebert [14] explores the use of insurance in developing countries considering hydroclimatic risk information. It is also worth noting that the need for models and analyses that have a physical basis in how they model the complex causality and economics of natural catastrophes has given rise to a new discipline, “catastrophe finance” [15], which aims to quantify and optimize the insurance portfolios on the basis of detailed understanding of asset risks, as influenced by external stressors and subject to insurance industry dynamics. The prediction of cyclone intensity and frequency remains a key challenge, with recent evidence suggesting the confounding role that anthropogenic aerosols may play [16]. On the technology side, innovators are exploring ways to (at least partially) control cyclone trajectory on the basis of potential socio-economical payoffs [17]. Of course, Hurricane Sandy in 2012 was yet another reminder of the destructive force that hurricanes can bring to people and property, with record-breaking losses for insurers and reinsurers. More recently, in the summer of 2017, Hurricane Harvey was the costliest tropical cyclone on record, inflicting nearly USD 200 billion in damage—breaking the previous record set by Hurricane Katrina—primarily from widespread flooding in the Houston metropolitan area.
While insurers and reinsurers are well-accustomed to confronting situations that are characterized by risk, the issue of anthropogenic climate change carries with it enough ambiguity and uncertainty that it generates considerable anxiety for insurance industry stakeholders. In essence, the problem stems from the fact that while insurers and underwriters are often able to reach requisite levels of comfort in situations where the attendant risks can be reliably characterized and appraised, they are far less comfortable in situations where scientific uncertainty complicates a decision-making environment that is already fraught with uncertainty and layers of complexity. Of course, complicating matters further is the fact that all of this plays out in an environment where it is sometimes difficult to parse and disentangle the political rhetoric that inevitably becomes part of the dialogue on how the global commons should be managed. Catastrophe models [18] are used widely by insurance firms to assess natural catastrophe risks; however, these models are not well-suited for macro-scale analyses, considering historical patterns of financial insurance indicators and extreme weather uncertainty. Indeed, analytic frameworks such as that which we present here can be used to refine the hurricane-insurance response functions implemented in catastrophe models.

1.3. Problem Formulation and Insurance Response

For insurers and reinsurers, a key question is this: Will the frequency and/or the intensity of future tropical cyclone activity be measurably enhanced in a Greenhouse Gases (GHG)-warmed world? In answering this question, it is useful to distinguish between two types of risk: event risk and outcome risk. Assessments of event risk focus on characterizations of frequency or likelihood for particular hazards (e.g., hurricane activity in the North Atlantic). Assessments of outcome risk focus on the valuation of outcomes associated with specific hazards or events (e.g., pre-event estimates of expected insured loss). The dichotomy between event risk and outcome risk serves as a useful conceptual vehicle for exploring the balance of scientific evidence that exists as to the potential linkage between anthropogenic climate change and extreme weather.
This observation is important because observed variations in expected loss may not necessarily be attributable to climate change enhancement of extreme weather events, but rather to other factors, such as building practices, risk management policies, and the like. Untangling the variability of losses allows one to derive the signatures of natural extreme weather and climate change effects, bounded by a proper characterization and evaluation of all the relevant uncertainties. Event risk is sometimes easier to estimate than outcome risk, since the latter is also dependent on many other factors beyond the environmental dynamics linking climate and extreme weather. Such dependencies complicate efforts to assess how insurance responds to climate and extreme weather. Methodologically, outcome risk may be easier to estimate via pattern-oriented models—such as machine learning models—that are based only on robust feature functions of historical losses. A fundamental question for insurers, then, is whether the financial risks posed by global climate change are, in some way, structurally different than what has previously come to pass, thereby presenting insurers with new—and, some would argue, unprecedented—challenges, requiring a fundamental rethinking of the conceptual schemes and methods that are used to manage these risks. Indeed, it may very well be the case that traditional underwriting and risk management methods are not adequate for this task. In this regard, three issues are seen to be central:
  • To what degree can the scientific uncertainty underlying the climate change/extreme weather problem be reliably characterized and evaluated by insurers and reinsurers?
  • To what degree does the global climate system hold the potential for surprise to decision-makers?
  • How resilient is the system to these shocks, and what actions might insurers and reinsurers take to enhance resilience and minimize the effects of these shocks?
In what follows, we take up these questions in the context of the potential linkage that may exist between anthropogenic climate change and extreme weather, with particular emphasis on tropical cyclone activity in the North Atlantic basin. Our remarks are organized along the following lines. We begin, in the results section, with an exploration of the resilience of the property/casualty P/C industry to extreme weather events based on real data (see the Materials and Methods section). Natural disasters can cause loss of life or property damage, and they typically leave economic damage in their wake, the severity of which often depends on the affected population’s resilience, or ability to recover. Here, rather than considering the resilience of populations [19], we focus on the financial resilience of the P/C industry to extreme shocks—in particular, to tropical cyclones, which cause the most casualties worldwide (followed by earthquakes, tsunamis, floods, epidemics, landslides, droughts, volcanic eruptions and forest fires), and to terror events. Specifically, we focus on the profitability consequences of an illustrative (and exemplary) set of extreme events—a string of Quartet-scale storms striking the U.S. and a compound event that consists of a Katrina-scale storm combined with a mass terror attack on the scale of 9/11. Details of the model are in the Materials and Methods and Results sections. By design, these scenario constructs are extreme (in terms of severity and impact) and grounded in experience (we utilize P/C industry reported losses for the hurricane Quartet of 2004 and the World Trade Center (WTC) terror event of 2001). In this way, we look to explore the insurance industry’s response to diverse range of extreme shocks, arising from unusual back-to-back events. This kind of extreme scenario modeling is consistent with current approaches in the literature to conducting resilience analyses that look to go beyond myopic, single-event analyses [20,21,22]. Our analysis suggests a high degree of macro-resilience for the P/C industry. We conclude, in the Discussion and Conclusion sections, with a closing commentary on the long-term challenges the P/C industry is likely to face on matters pertaining to global climate change and extreme weather. In Appendix A, we review some of the ongoing efforts to estimate changes in hurricane frequency and intensity, together with changes in vulnerability and exposure

2. Materials and Methods
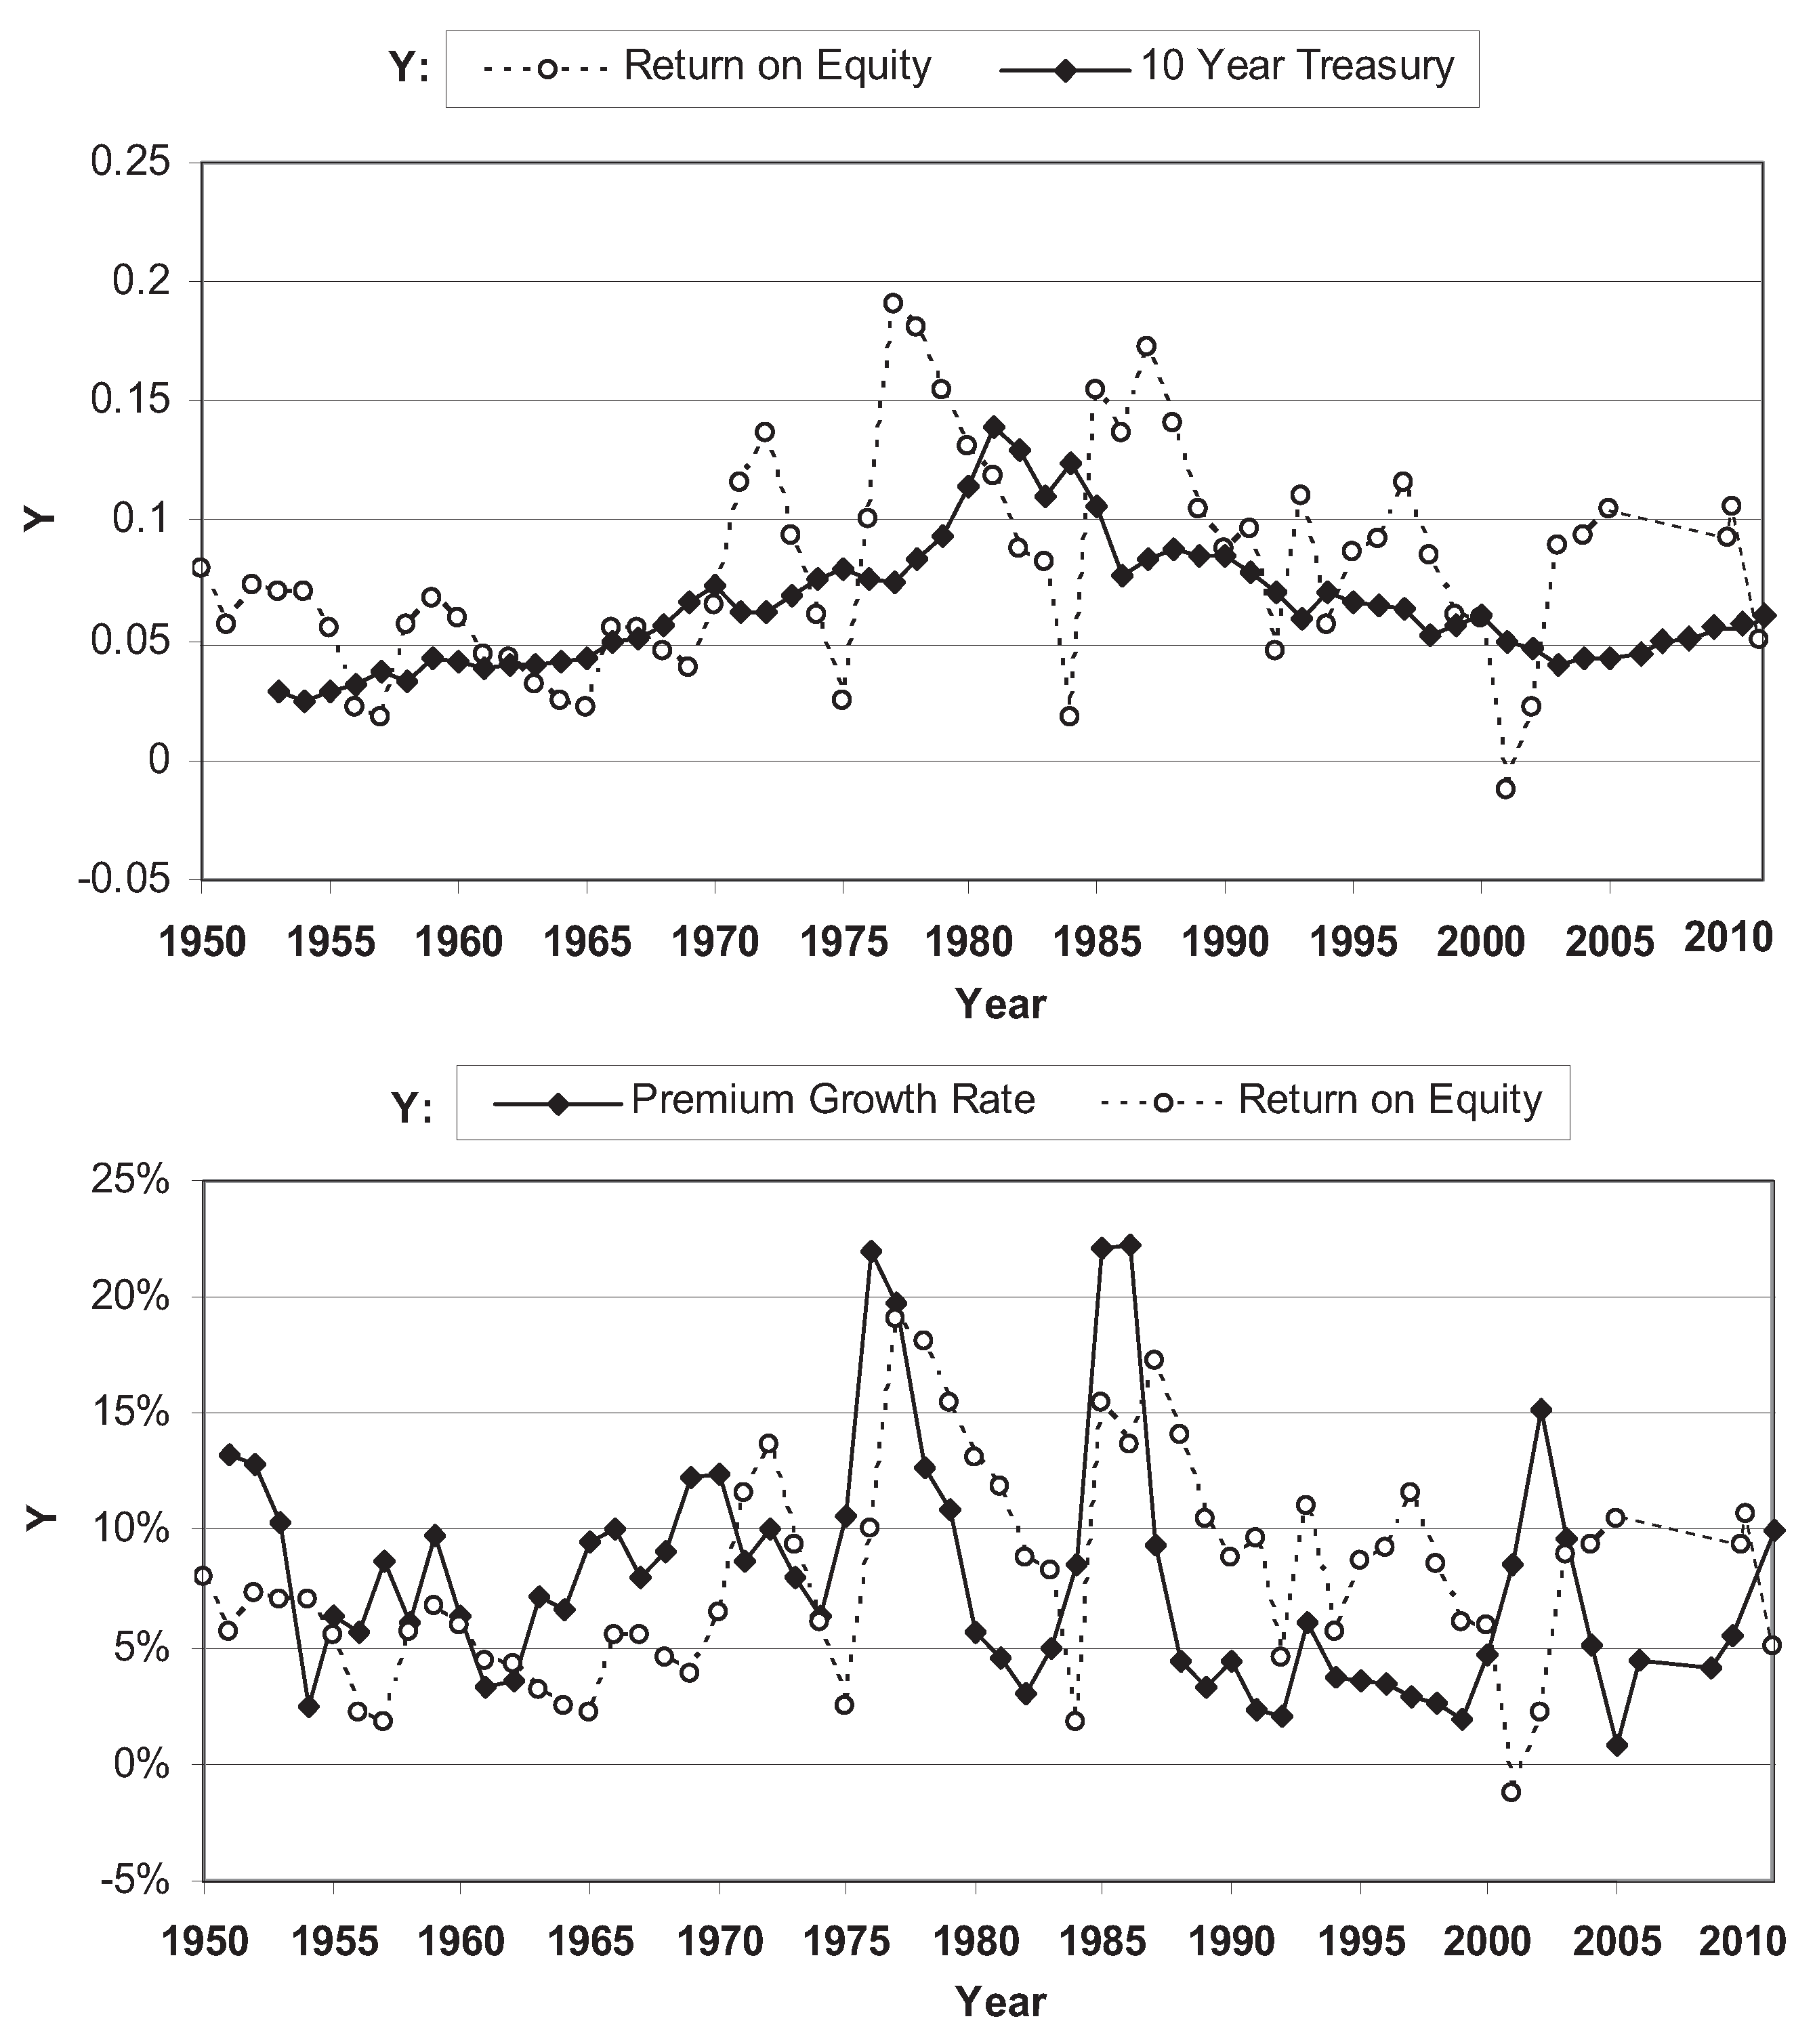
2.1. Data

The various event data sets used as part of our econometric analysis were obtained from the NOAA hurricane database (hurricane number and strength data, 1954–2013; see here [23] for a spatially explicit visualization and here [24]), the Economic Report of the President (U.S. Treasury bond rates; see here [25]), and the Insurance Information Institute (annual P/C rate of return data, 1950–2013; see here [26]). The index (Z) for hurricane intensity is the average category number for hurricanes based on the Saffir/Sampson scale. We note that some of the 1958–1994 hurricane data for the Atlantic basin are derived from scanned image information of printed reports.
These datasets were used to construct extreme scenarios involving combinations of events, so as to enable us to explore insurance industry responses to these extreme compound events. Specifically, we considered the Quartet of storms striking the U.S. in 2004, as well as a compound event that consists of a Katrina-scale storm combined with a mass terror attack on the scale of 9/11. Our rationale for focusing on the Quartet was that 2004 had the most major hurricanes since 1996 (a record which was finally surpassed in 2005 with Hurricane Katrina). In particular, the state of Florida was severely impacted by four hurricanes during this time period: Hurricane Charley (H4), Frances (H4), Ivan (H5), and Jeanne (H3), hitting the U.S. sequentially over the course of a single hurricane season. Finally, also included was Hurricane Sandy, the most destructive hurricane of the 2012 Atlantic hurricane season, and was the second deadliest hurricane after Katrina; insured catastrophe losses emerging from Sandy are estimated at $65 billion. The WTC 9/11 losses in 2001 were determined from insured catastrophe loss data.

2.2. Econometric Model for Estimating P/C Industry Financial Resilience

A number of single multilinear equation models exploring the link between the rate of return on P/C surplus and various measures of hurricane activity have been tested. The typology of these models is entirely consistent with those found in standard econometric estimation models; see, e.g., Hayashi [27]. Using lagged realizations of the dependent variable (ROE) as independent variable, we tested several different metamodels. These lagged models are essentially Dynamic Regression Models (see, e.g., Pankratz [28]), as they do not, a priori, imply any preferential lag τ , and they define the “causal” lag after numerical analysis. Thus, τ , is a purely predictive variable that provides potentially useful information concerning the temporal dependencies of the investigated processes. The most complex model was of the form:
r t i = β 0 + β 1 H t + β 2 Z t + β 3 r t 10 + β 4 r t τ i + β 5 D t 9 / 11 + β 6 P r e m G r o w t + ε t ,
where
r t i = return on equity for insurers in year t ; H t = number of hurricanes with billion dollar losses in year t ( 2013 dollars ) ; Z t = index of mean intensity of hurricanes in year t ; r t 10 = interest rate on ten year Treasury bonds ; r t τ i = return on equity for insurers in year t τ , where τ is the time lag ; D t 9 / 11 = binary variable for 9 / 11 terrorist attack ( 1 = 9 / 11 attack ) ; P r e m G r o w t = growth rate of net written premiums in year t ; ε t = standard normal i . i . d . error term .
In order to determine the relative importance of lagged realizations of ROE, we made a probabilistic analysis that evaluates the model multiple times, analyzing the predicted probability distribution function (pdf) with the the pdf of ROE from data. The computational steps used to obtain the profiles shown in Figure 1 and Figure 2 are the following:
  • Selection of the scenario to use in the model (no-Quartet, one/two/three Quartets, Katrina only, Katrina and 9/11, Sandy and 9/11);
  • Inclusion of the scenario-based values of H t , Z t , r t 1 i in the model;
  • Calculation of r t i and model parameters for any value of t in the time period considered;
  • Monte Carlo predictions of r t i considering sampling of pdfs of the model’s factors.

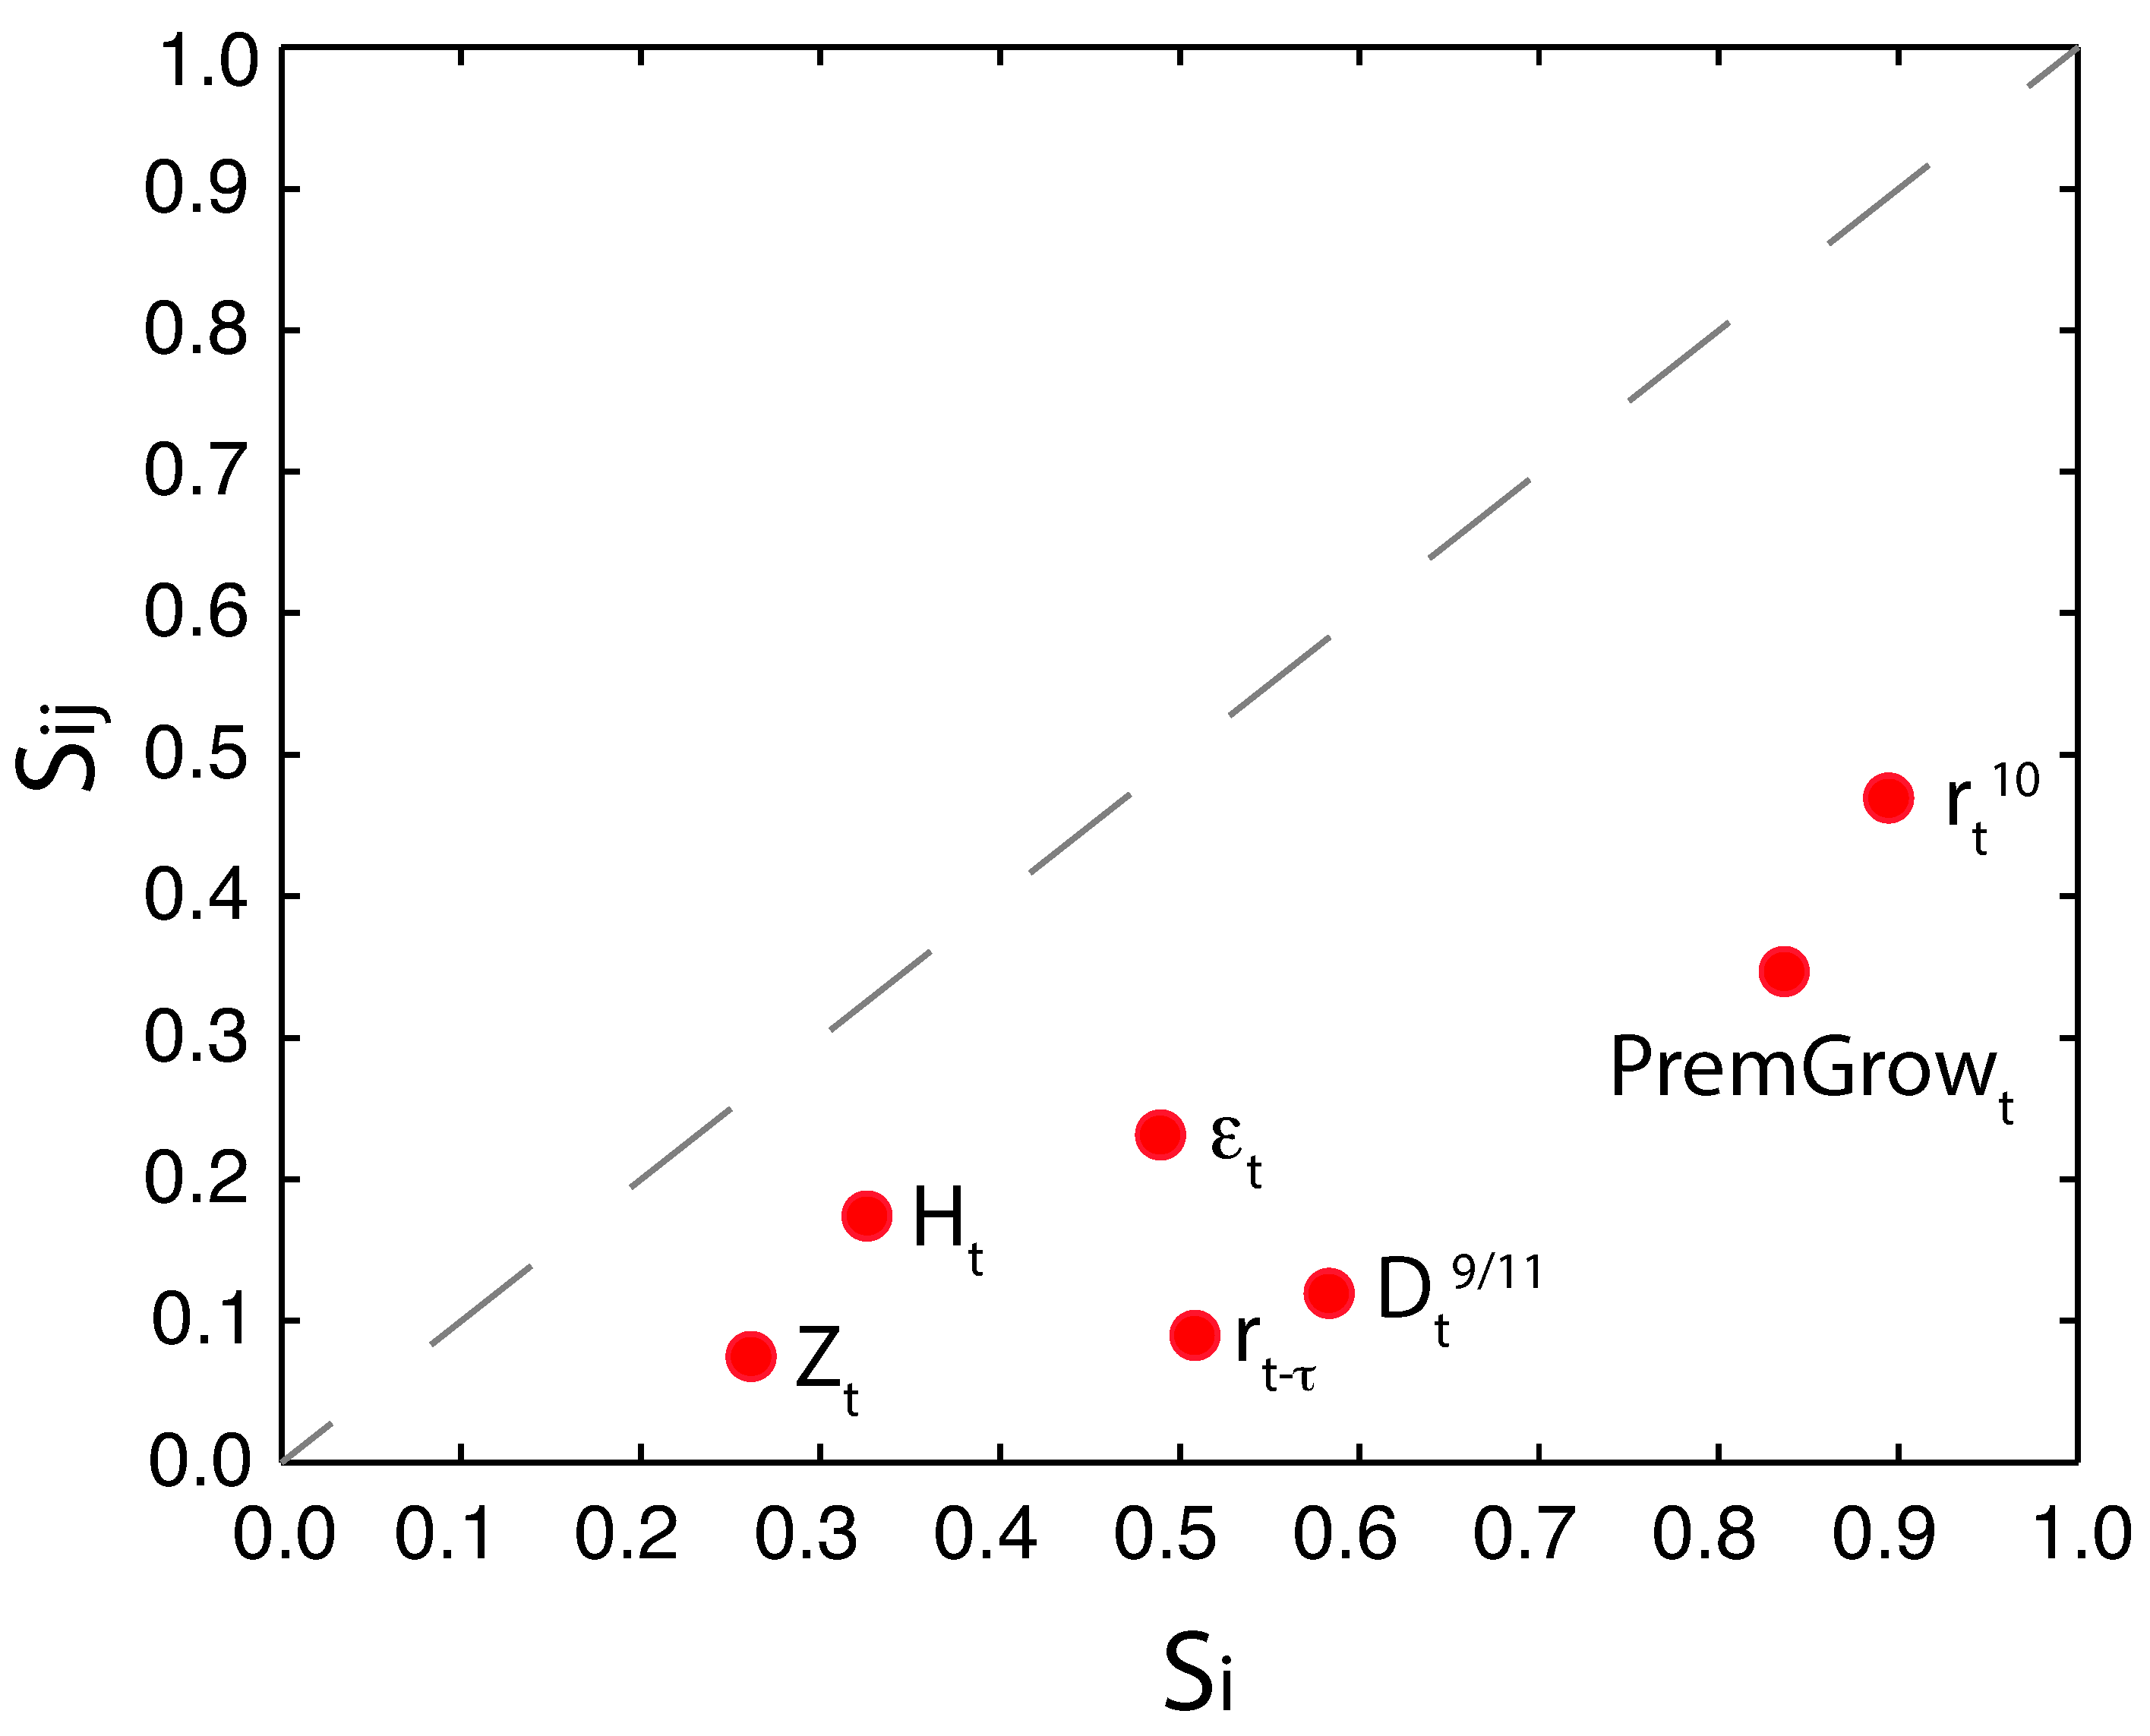
2.3. Model Choice and Global Sensitivity and Uncertainty Analysis

The Akaike Information Criterion (AIC) is calculated for any model, and this value can (with some caveats) be used to choose the lags for the ROE. The procedure should be repeated for all subsets of predictors to be considered, and the model with the lowest AIC value is selected. The closeness of model predictions to the actual data is determined by comparing the posterior predicted frequencies with the observed ones of the odd ratio calculated considering ROE and hurricane occurrence. Specifically, we computed the odds ratio as the fraction of the odds of a ROI change (at least 10% of change) in the year following a year with at least one hurricane, to the odds of a ROI change in the year following a year without a hurricane, i.e., O R = pdf ( r | H ) / pdf ( r ) . The model with the lowest AIC also has the highest similarity of the probability distribution of the odd ratio.
A global sensitivity and uncertainty analysis were conducted on the selected econometric model, using a probabilistic methodology called Global Sensitivity and Uncertainty Analysis (GSUA), as described by [29]. GSUA considers all probability distribution functions (pdfs) of variables and their entropy in order to determine their relative importance and interdependence in predicting the output of interest—in this case, ROE. This method allows us to simplify the models presented earlier by neglecting variables of second-order importance in the ROE prediction task. Variables of first-order importance and interdependence (or interaction) for reproducing the pdf of ROE are calculated via so-called mutual information indices (MII) [29]. These indices use the mutual information normalized by the entropy of the output variable considering one variable or pairs of variable, respectively: S i = M I ( X i ; Y ) H ( Y ) and S i j = M I ( X i ; X j | Y ) H ( Y ) , where X i is any covariate and Y is the ROE. The use of the transfer entropy instead of the mutual information can give further information about the directionality of the model-based causality between covariate and predictive outcome (in the predictive sense of the model) and the time-lag of such causality.

3. Results

Our inability to make predictively informative assertions about the connection between climate change and extreme weather complicates efforts to draw reliable inferences as to the potential consequences on the economics of financial resilience associated with a range of possible extreme weather futures. In this section, we use past information about the connection between insurance industry profitability and extreme weather events to arrive at an order-of-magnitude estimate of the impact that climatic change is likely to have on the bottom line of the P/C industry, under a wide range of extreme events. A more thorough analysis of the economic dimensions of climate change-related consequences would require a thorough review of the economic theory of climate change, including such factors as: a detailed assessment of analytical work on global public goods; game-theoretic aspects of climate policy in a world of nation states; public finance and macroeconomic aspects of pricing climate-change-based externalities; and investments made by national and international governmental and non-governmental entities in mitigation efforts.

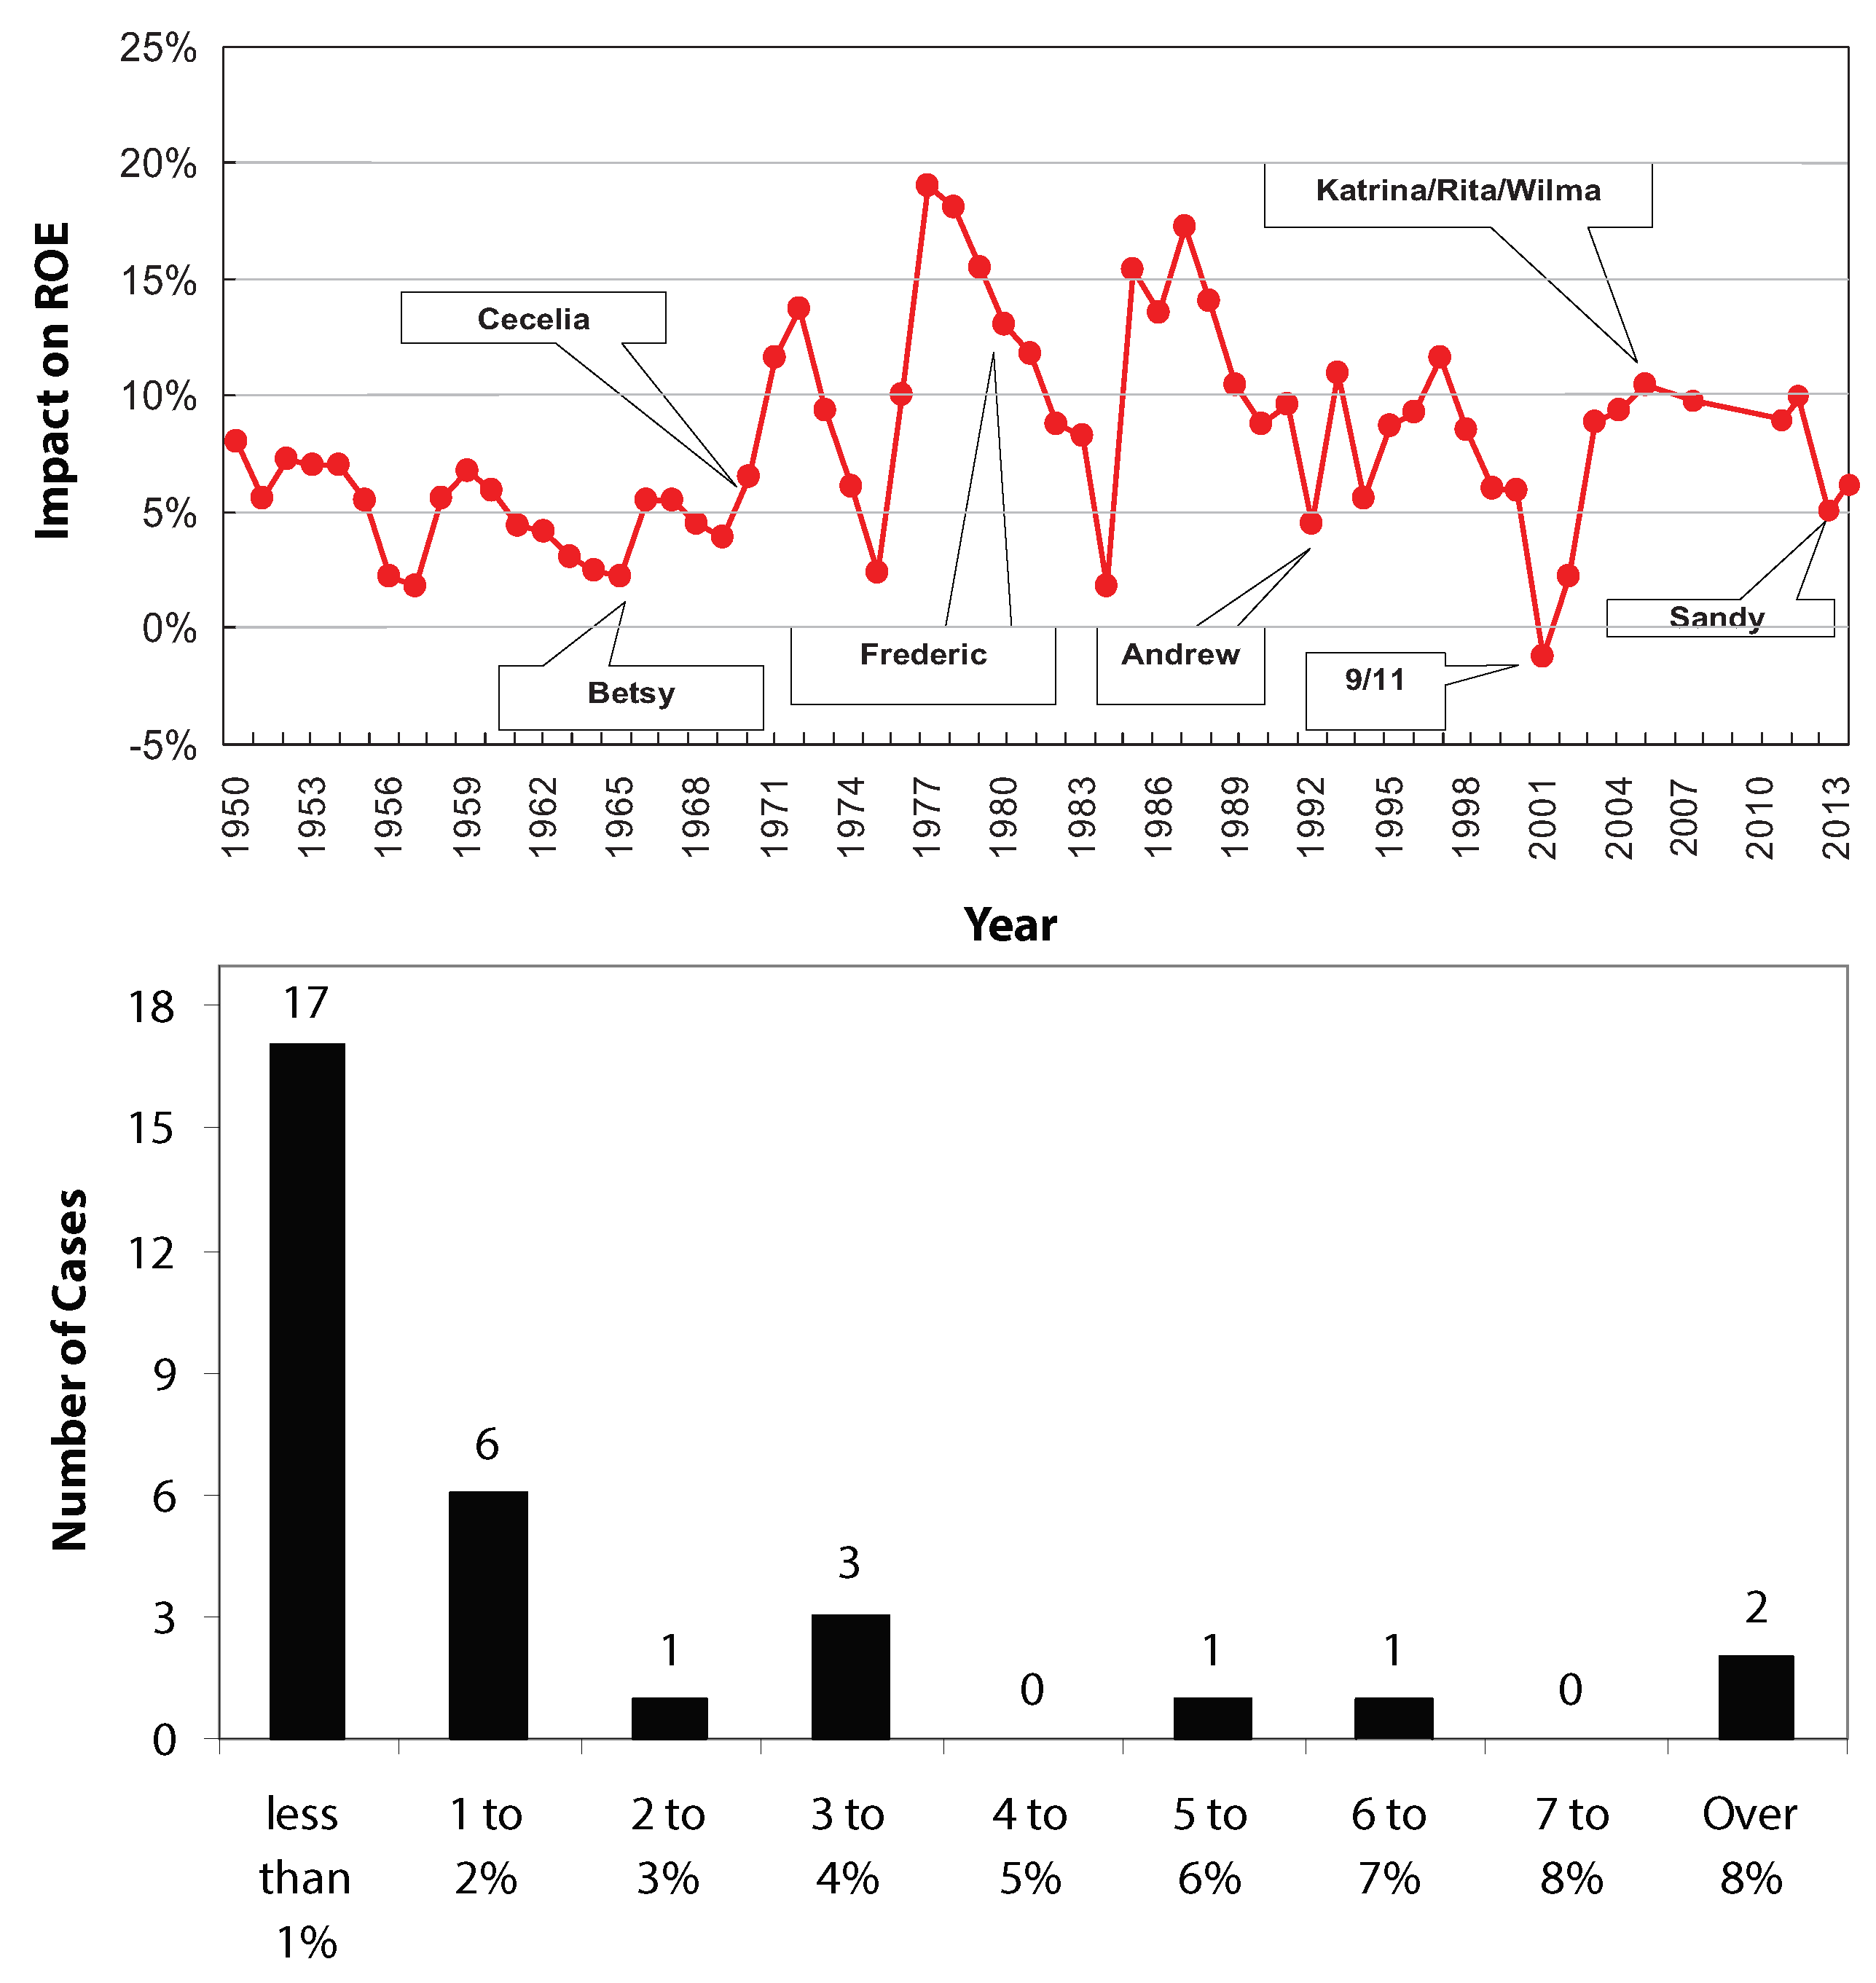
3.1. Data-Based Assessment of Impact of Hurricanes on Insurer Profitability

We begin with an empirical investigation into how extreme weather events impact insurer profitability. Specifically, we ask the following basic question: how have extreme weather events—in this case, hurricanes characterized by very large insured losses—affected the return on equity (ROE) earned by insurers in any given year? The return on equity (ROE) measures the rate of return on the ownership interest (shareholders’ equity) of the common stock owners; it measures a firm’s efficiency at generating profits from every unit of shareholders’ equity (also known as net assets). Thus, our ROE is what is commonly referred to adjusted ROE because it is considering the net assets in its formulation.
Figure 3 presents the return on equity for U.S. P/C insurers and reinsurers between 1950 and 2013, with select annotations for years with exceptionally large losses. The first thing to notice in this figure is that large hurricane losses have been experienced in years with excellent as well as poor industry performance. At first glance, it seems strange to think that large hurricane losses might not regularly lead to low returns for insurers, though a moment’s reflection suggests that well-run insurance companies will structure their portfolio of risks so that large losses in some lines of business are offset by strong performance in others, combined with reinsurance and skilled financial management of overall policyholders’ surplus. A perpetual concern for insurers and underwriters, though, is how sustainable sound financial performance is in the face of multiple high-loss hurricanes, perhaps over the course of a successive number of years. To explore this issue, we begin by looking, first, at the distribution of the ratio of hurricane losses to policyholder surplus.
The plot at the top of Figure 3 shows that, between 1950–2013, this ratio has been relatively small, with more than 30 years where the loss ratio was less than one tenth of one percent. In fact, there have only been eight years where hurricane loss ratios were 2% or more of policyholders’ surplus. Unfortunately, as the left-most portion of the distribution in Figure 3 (bottom plot) illustrates, the bulk of large losses have occurred in recent years (see Figure 1), beginning with Hurricane Hugo in 1989, through to the 2004 Quartet and the Katrina/Rita/Wilma triplet in 2005. For our purposes here, the insured catastrophe losses arising from the 2004 Quartet and Hurricane Katrina are used to predict P/C industry responses to extreme events of this magnitude (see Figure 1).
Figure 1 shows the evolution of the ratio of hurricane losses to policyholder surplus from 1950–2013. This figure may be somewhat alarming to the casual empiricist, as it vaguely suggests a hurricane loss ratio cycle of increasing amplitude, consistent with heightened fears about increasing hurricane activity. These escalating peaks can, however, be explained by many factors, including the spectacular long-term economic boom and population growth in the southeastern United States over the past forty years (with much acceleration since the mid-1980s) that has unfortunately placed more people and property in harm’s way, thereby increasing the likelihood of greater storm losses.
Collectively, then, Figure 1 and Figure 3 offer a somewhat ambiguous picture of the relationship between hurricane losses and insurer profits. On the one hand, the top of Figure 3 suggests that there is no consistent link between hurricanes and P/C industry profits; commensurate with this observation, the bottom plot suggests that hurricanes big enough to significantly damage policyholders’surplus are infrequent. In contrast, Figure 1 opens the door—however slight—to the prospect of increasingly severe losses, though these losses cannot be linked with certainty to climate change. N.B. A large number of studies confirm a clear relationship between hurricane activity and Atlantic Multi-decadal Oscillation (AMO) [30], which can, in turn, be linked to the variation of hurricane losses. Econometric analysis can lend some clarity to this muddled situation.

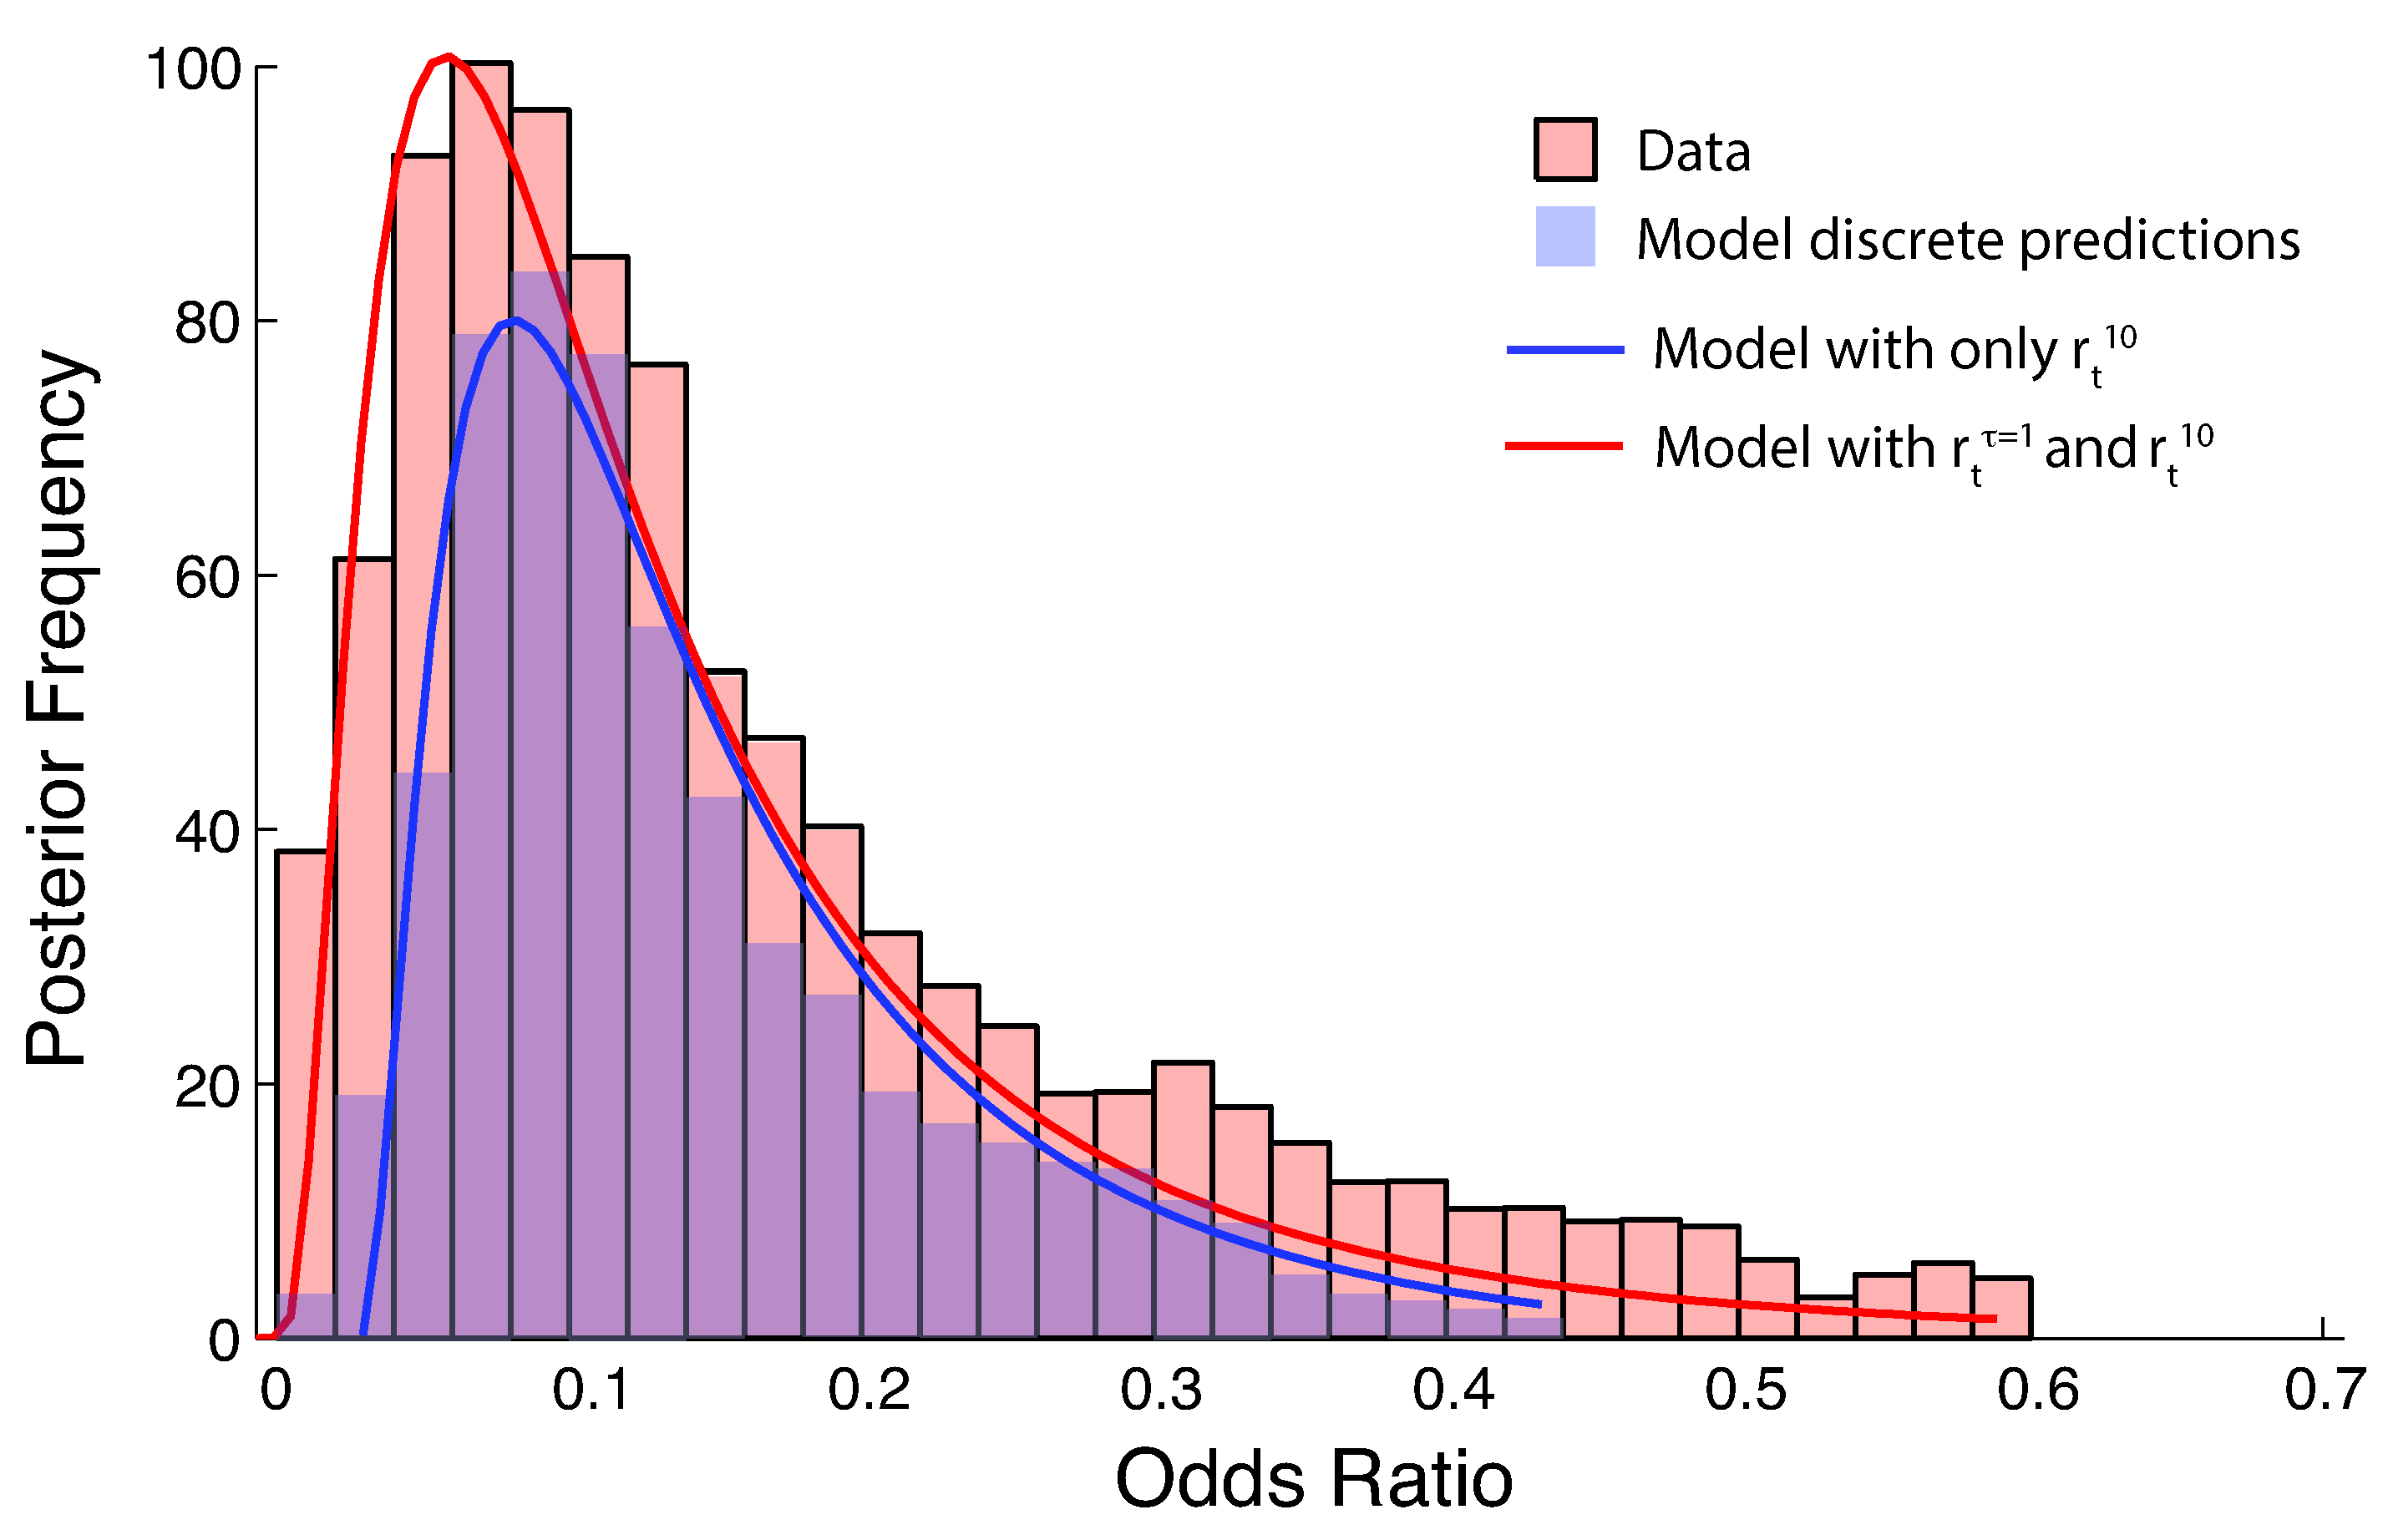
3.2. Model Selection: Predicting Extremes’ Effects on Insurance

Interestingly, as shown in Table 1, the full model explained in Materials and Methods consistently yields statistically insignificant estimates for the number and intensity of hurricanes ( H t and Z t , respectively) in any given year—both when lagged P/C returns were included (Column 1) and excluded (Column 2). Table 1 also contains the relevant information on coefficient values, corrected t-statistics (in parentheses), the standard error of the estimate (SEE), the value of the Durbin h-statistic (h), and the estimate of the first-order serial correlation coefficient for the Ordinary Least Squares (OLS) error ( ρ ) for various model specifications that were rejected. Other specifications included separate variable for hurricanes of different power—Categories 1–5—as both dummy variables and as cardinal measures of storm power. As before, none of these variables were statistically significant.
The final model was derived considering all possible combinations of factors (including r t at different lags τ ), and the preferred equation (on statistical grounds) is:
r t i = β 0 + β 3 r t 10 + β 4 r t 1 i + β 5 D t 9 / 11 + β 6 P r e m G r o w t + ε t ,
where H t and Z t are second- or third-order factors that are dropped from the equation, and the lag τ is selected as being equal to one year. For the period 1954–2013, the model is estimated as
r t i = 0.589 + 0.073 r t 10 + 0.681 r t 1 i 9.003 D t 9 / 11 + 0.297 P r e m G r o w t , ( 0.411 ) ( 0.185 ) ( 5.100 ) ( 2.980 ) ( 3.484 )
with SEE = 1.670 , ρ = 0.394 , and Durbin h = 6.201 . The correlation matrix associated with this equation is presented in Table 2. Considering the original model, we show how the posterior probability of r t is weakly dependent on the lag considered. Specifically, we find that r t i depends on the lagged realization r t τ i for τ = 1 , but not on the values in previous years. Additionally, the importance of r t 1 i is limited with respect to the other variables, which is indicative of “pseudo-memoryless” ROE dynamics.
Note that the lagged value of insurers’ return on equity is highly correlated with the current value of the 10-year Treasury bond rate, indicating a high degree of collinearity between these two variables, which accounts for the low value of the t-statistic on the Treasury bond rate variable. In addition, the Treasury bond rate has a moderate degree of correlation with net premium growth.
As for the validity of the adopted OLS estimation procedure, we observe that there are no evident outliers, not so many variables, no stringing nonlinearity, and the dependence among variables is small. We also observe that the error term ε t of the dependent variable is normally distributed. Additionally, considering our dataset, we do not observe heteroscedasticity, where the variability of a variable (i.e., ROE in this case) is unequal across the range of values of a second variable that predicts it. In this way, all of the assumptions that underlie our econometric approach to estimation and inference have been verified on data which support the reasonableness of these assumptions (normality of errors, homoscedasticity, and lag-independence). We comment, however, that the standard normality assumption on the error ε t is rarely (if ever) exactly true when one is working with real data. Still, there are good reasons to believe that, for the dataset used here, OLS efficiently reproduces the macroscopic relationship that exists between hurricanes and the financial resilience of the insurance industry. Indeed, this purpose defends the choice of a fixed-effects OLS model, in that if no repeated effect was found, then the fixed-effects OLS model was revealing its invalidity (for instance, because of some non-fixed effects; see, e.g., [31]). As for the stationarity assumption, our case is one where the non-stationary variables are “co-integrated”; if there exists a linear combination between the non-stationary predictand (i.e., ROE) and the predictors that is stationary, then the estimated coefficients are correct. On this point, see, e.g., [32]. In our case, the only variable that can alter the prediction is D t 9 / 11 , which is a “point-scale” function that is, at bottom, hard to predict, and the only factor in our model that can be considered non-stationary. For our purposes here, however, D t 9 / 11 should be considered as any disturbance function altering r t i . Thus, a macroscale response pattern of the insurance industry’s financial performance would not appear if D t 9 / 11 were strong enough to cause a major perturbation on the industry by itself. Therefore, in light of the above considerations, we believe that our model reproduces faithfully the macroscale dynamics between hurricanes and the financial performance of the insurance industry.
Our model predictions reveal strong statistical correlations between the return on equity earned by insurers and (i) the return on equity in the previous year; (ii) the return on 10-year U.S. government bonds in that year; and (iii) the growth rate of net premiums written over the year. Hurricanes are, by contrast, reduced to the status of random forces that drive the system in an unsystematic fashion. Figure 4 illustrates the movement of the 10-year Treasury bond rate and net premiums written relative to insurers’ profitability. We note that no matter what sort of hurricane measures were included in the model—e.g., the number of hurricanes in a year, the average strength of storms (as measured by the Saffir/Sampson scale) over a season, the effect of storms at varying levels of intensity, etc.—hurricanes did not have a statistically significant impact on insurers’ return on equity.
An important additional influence in the preferred specification for our econometric analysis is the impact of the destruction of the World Trade Center on the P/C rate of return in 2001. Indeed, the events of 9/11 had an outsized statistical impact on insurers’ rate of return—a fall of more than 8 percentage points—that was greater than the direct 5.02% fall in surplus associated with the event. This apparent discrepancy is easily reconciled when we recall that the economic impacts of 9/11 were so great that losses in many lines of business—including airlines, ports, and other modes of transportation—were triggered on 9/11. History and context are important here, in that also present in 2001 was the downward pull of the Enron collapse (and related accounting scandals), which clearly influenced the financial returns to policyholders’ surplus during this time period.

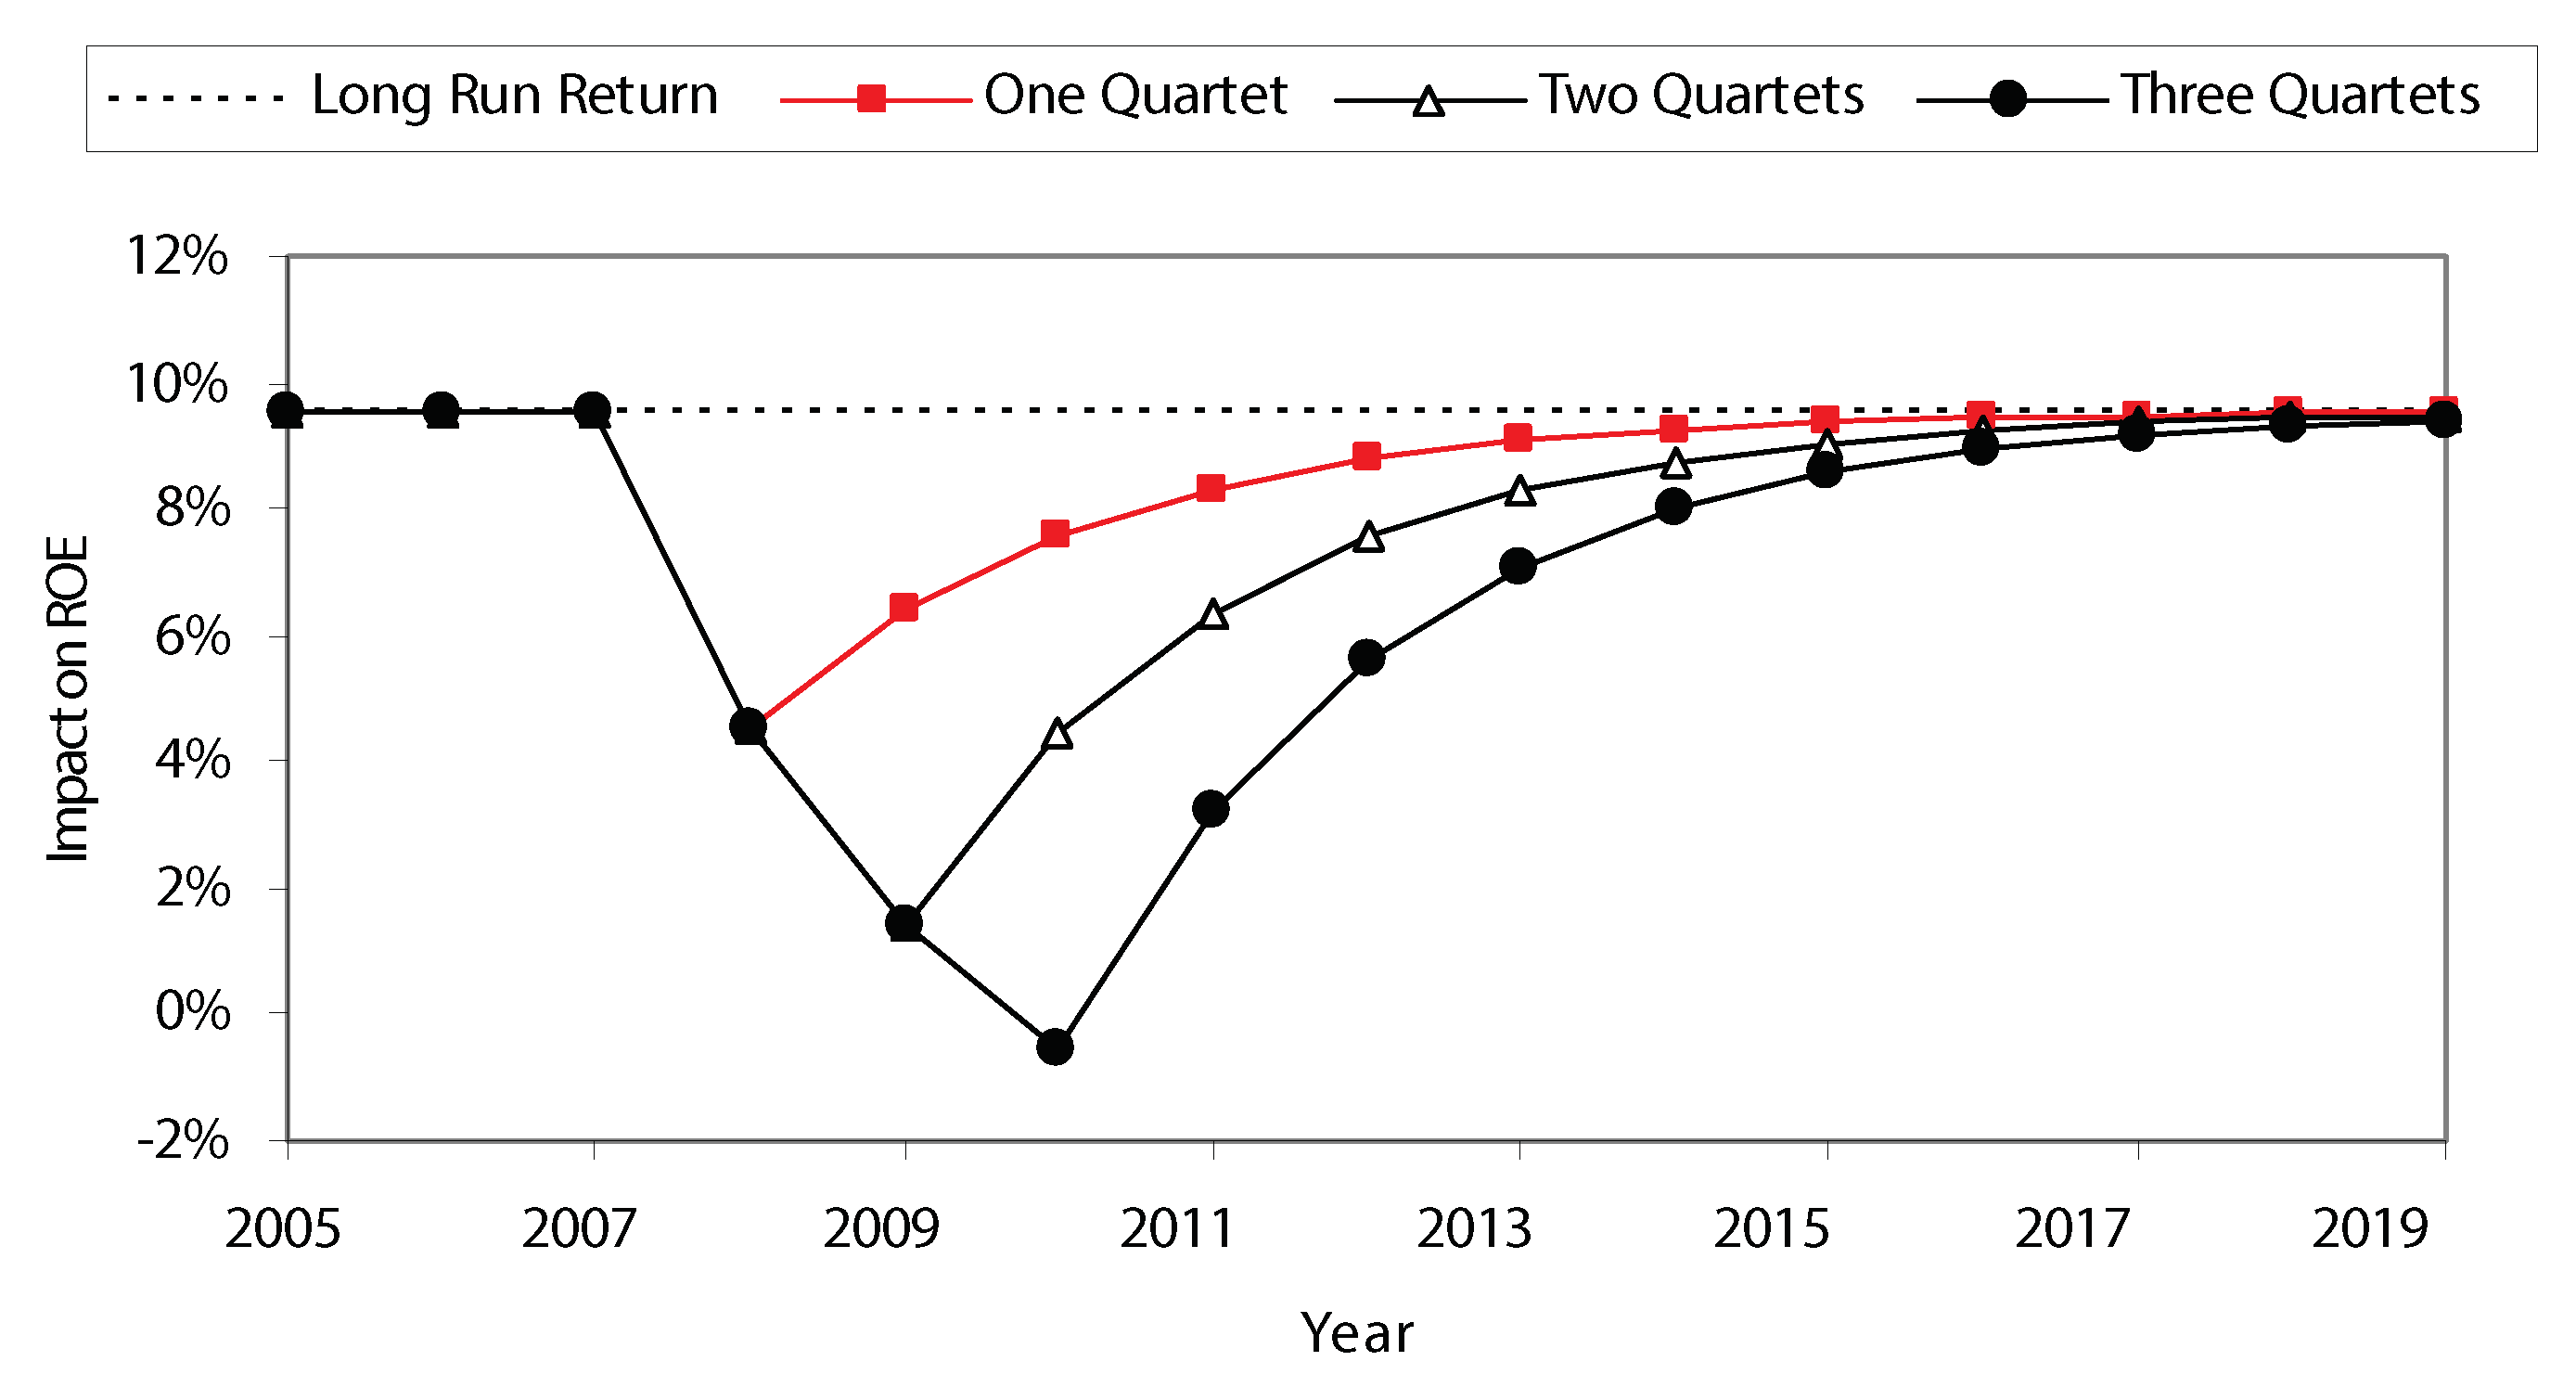
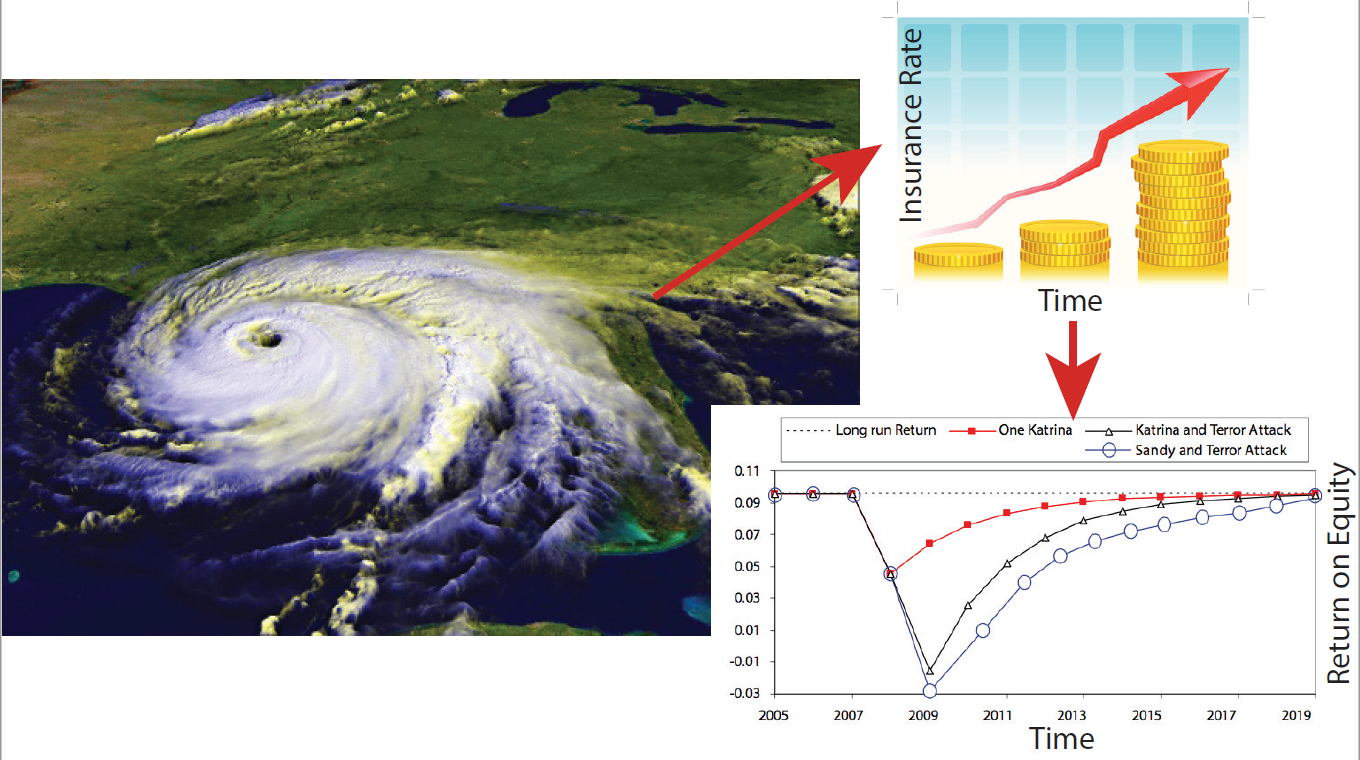
3.2.1. Stormy Weather Ahead? Hurricane Scenarios on Insurance

The current statistical exercise assumes that uncertainty about climate change permits insurers to look to the past to make informed guesses about how future increases in hurricane frequency and severity might affect overall industry profitability. If hurricanes are random negative influences on industry returns, as our model suggests, then it is nearly impossible to make reasonable guesses as to the long-term impact of a rise in the frequency and severity of hurricanes on profitability. However, our econometric framework can be used to arrive at an order-of-magnitude estimate of the separate effects of “ordinary” random events (including small-loss hurricanes) and large-loss hurricanes on industry returns. This macro-level analysis should be augmented by a detailed time series analysis of the connections between hurricanes, premiums and the profitability of specific lines—especially in homeowners’ insurance—in specific states. This sort of analysis would require theoretical and empirical modeling of markets under various regulatory constraints, which introduce complications in the dynamic and statistical properties of models that are well beyond the scope of our analysis here.
As discussed earlier, our analysis suggests that hurricane losses are random, negative shocks to insurers’ returns that push profitability down immediately, with swiftly declining effects on future earnings (the potential reasons for these smallish feedback effects are briefly explained in the Appendix A). Figure 1 presents four separate and distinct time-paths suggested by the estimated model, under four possible hurricane loss scenarios: (i) No Quartet-scale hurricane losses between 2006 and 2018; (ii) One Quartet-scale storm; (iii) Two Quartet-scale storms; and (iv) Three Quartet-scale storms. These four scenarios are created using catastrophe loss data from the 2004 Quartet. For these four scenarios, we make the following set of assumptions, each empirically verified by our data: (a) the average 10-year Treasury bond rate holds steady at 4.5% between 2006 and 2018; (b) the average rate of growth of net premiums is 8%; and (c) there is no other major catastrophic event during this period—like another terrorist attack on the scale of 9/11. The reasonableness of these assumptions supports our use of an OLS estimation procedure—as described in the Materials and Methods section—which, in its generalized form, requires stationarity between the predictand and predictors. In addition to the hurricane scenarios outlined above, we also consider, for purposes of testing the consequences of a particularly extreme form of bad luck, one mega-catastrophe scenario—a Katrina-scale loss followed by a 9/11-scale loss.
The scenarios consider Quartet-scale losses rather than Katrina-scale losses in the hope that the Great Flooding of New Orleans in 2005 was a unique disaster, unlikely to be repeated. Of course, we could have considered Hurricane Harvey in 2017, but that event is tied with Hurricane Katrina as the costliest tropical cyclone on record. Our primary motivation here is to explore scenarios that are both illustrative and possible. In this way, multiple Quartet-scale and 9/11-like scenarios are useful for understanding the likely magnitude of response of the insurance industry, much as other sciences construct models that yield predictions of extreme climate and human-induced dynamic trajectories.
It is important to remember that the current exercise does not assume away terrorism, but rather, distinguishes between the separate and distinct impacts of terrorism and large hurricanes on insurer profits. Recall that one result of our analysis is that the 9/11 attacks, combined with the downdraft of the accounting scandals of 2001, had a profoundly negative, though temporary, effect on insurers’ return on equity that exceeded the effect of Hurricane Katrina—in large part because the atrocities of that day generated further insured losses in other sectors of the economy due to the airline industry shutdown, business interruption in various locations, and others. For our econometric analysis, then, our strategy is to first consider the impact of hurricane-scale losses on their own, and to then interrogate the analysis to determine the effects an extreme compound scenario involving a series of Quartet-scale storms that are also accompanied by another 9/11-scale terrorist event.
Figure 1 is known as an impulse–response diagram, and its purpose is to illustrate the effect of an important economic shock on the evolution of variables of interest. Specifically, Figure 1 evaluates the impact of a series of Quartet-scale losses on the return on equity over time, relative to what would have transpired had the shock not occurred. The dashed line in the diagram is the long-run return of equity for insurers’ that would obtain for the indefinite future if the interest rate, premium growth, and terrorism loss assumptions noted above obtain. Each hurricane shock is represented by a different line in the diagram, permitting an evaluation of what the statistical model suggests will happen under each case.
Impulse–response diagrams such as those developed here are useful aids for decision-makers seeking insights on the effects of a series of major storms on insurers’ profitability. The long-run return or “no-Quartet” path is the reference path used to judge the impact of multiple Quartet-scale storms on insurer profits. The “no-Quartet” scenario is, of course, hypothetical, but necessary to explore the systemic response of the insurance industry as a whole. A single Quartet-scale storm, reflective of the actual 2014 situation, four years from the beginning of the simulation, reduces insurers’ return on equity by 5% in 2007, as shown by the sudden drop of the path indicated by squares. However, insurer return on equity recovers quite quickly thereafter—assuming no change in either premium growth or the 10-year Treasury bond rates—so that insurer returns associated with the one-Quartet path are close to the reference path by the year 2011, with no change in any other component of profitability. If the U.S. is struck by two Quartet-scale storms in 2007 and 2008, then return on equity is about 8.5% lower than the no-Quartet path by the end of year 2008, while three Quartets in years 2007 through 2009 results in returns that are slightly over 10% lower than in a world without major storm losses. Of course, a two or three storm sequence will push down industry returns for an extended period of time, though both the two- and three-Quartet paths display remarkable resilience.
Finally, the results depicted in Figure 1 contain a hopeful message that should provide some measure of consolation to insurers who dread the prospect of an extreme event sequence—such as the Quartet-scale scenarios explored here—over a number of years. The resilience of industry returns in the event of even a sequence of extreme weather events and the associated losses suggests that insurers’ current underwriting, pricing, and financial management policies will, in all likelihood, enable companies to deal with threats to profitability posed by the possibility of increased hurricane frequency and severity in the future. Note that the statistical analysis which grounds this simulation assumes that insurers’ continue to operate as they have in the past, even in the face of a sequence of large storms, with the consequence that the time-path of returns in the worse-case scenario converges to within 20% of the reference path four years after the last great storm. Of course, the negative effect of a series of high-loss hurricanes can also be offset by high interest rates, improved underwriting margins, or by other mechanisms for offsetting very large losses. Still, the most important message of this statistical exercise is that P/C insurers are currently well-positioned to withstand the financial consequences of a series of Quartet-scale storms based on their current operating and underwriting procedures.

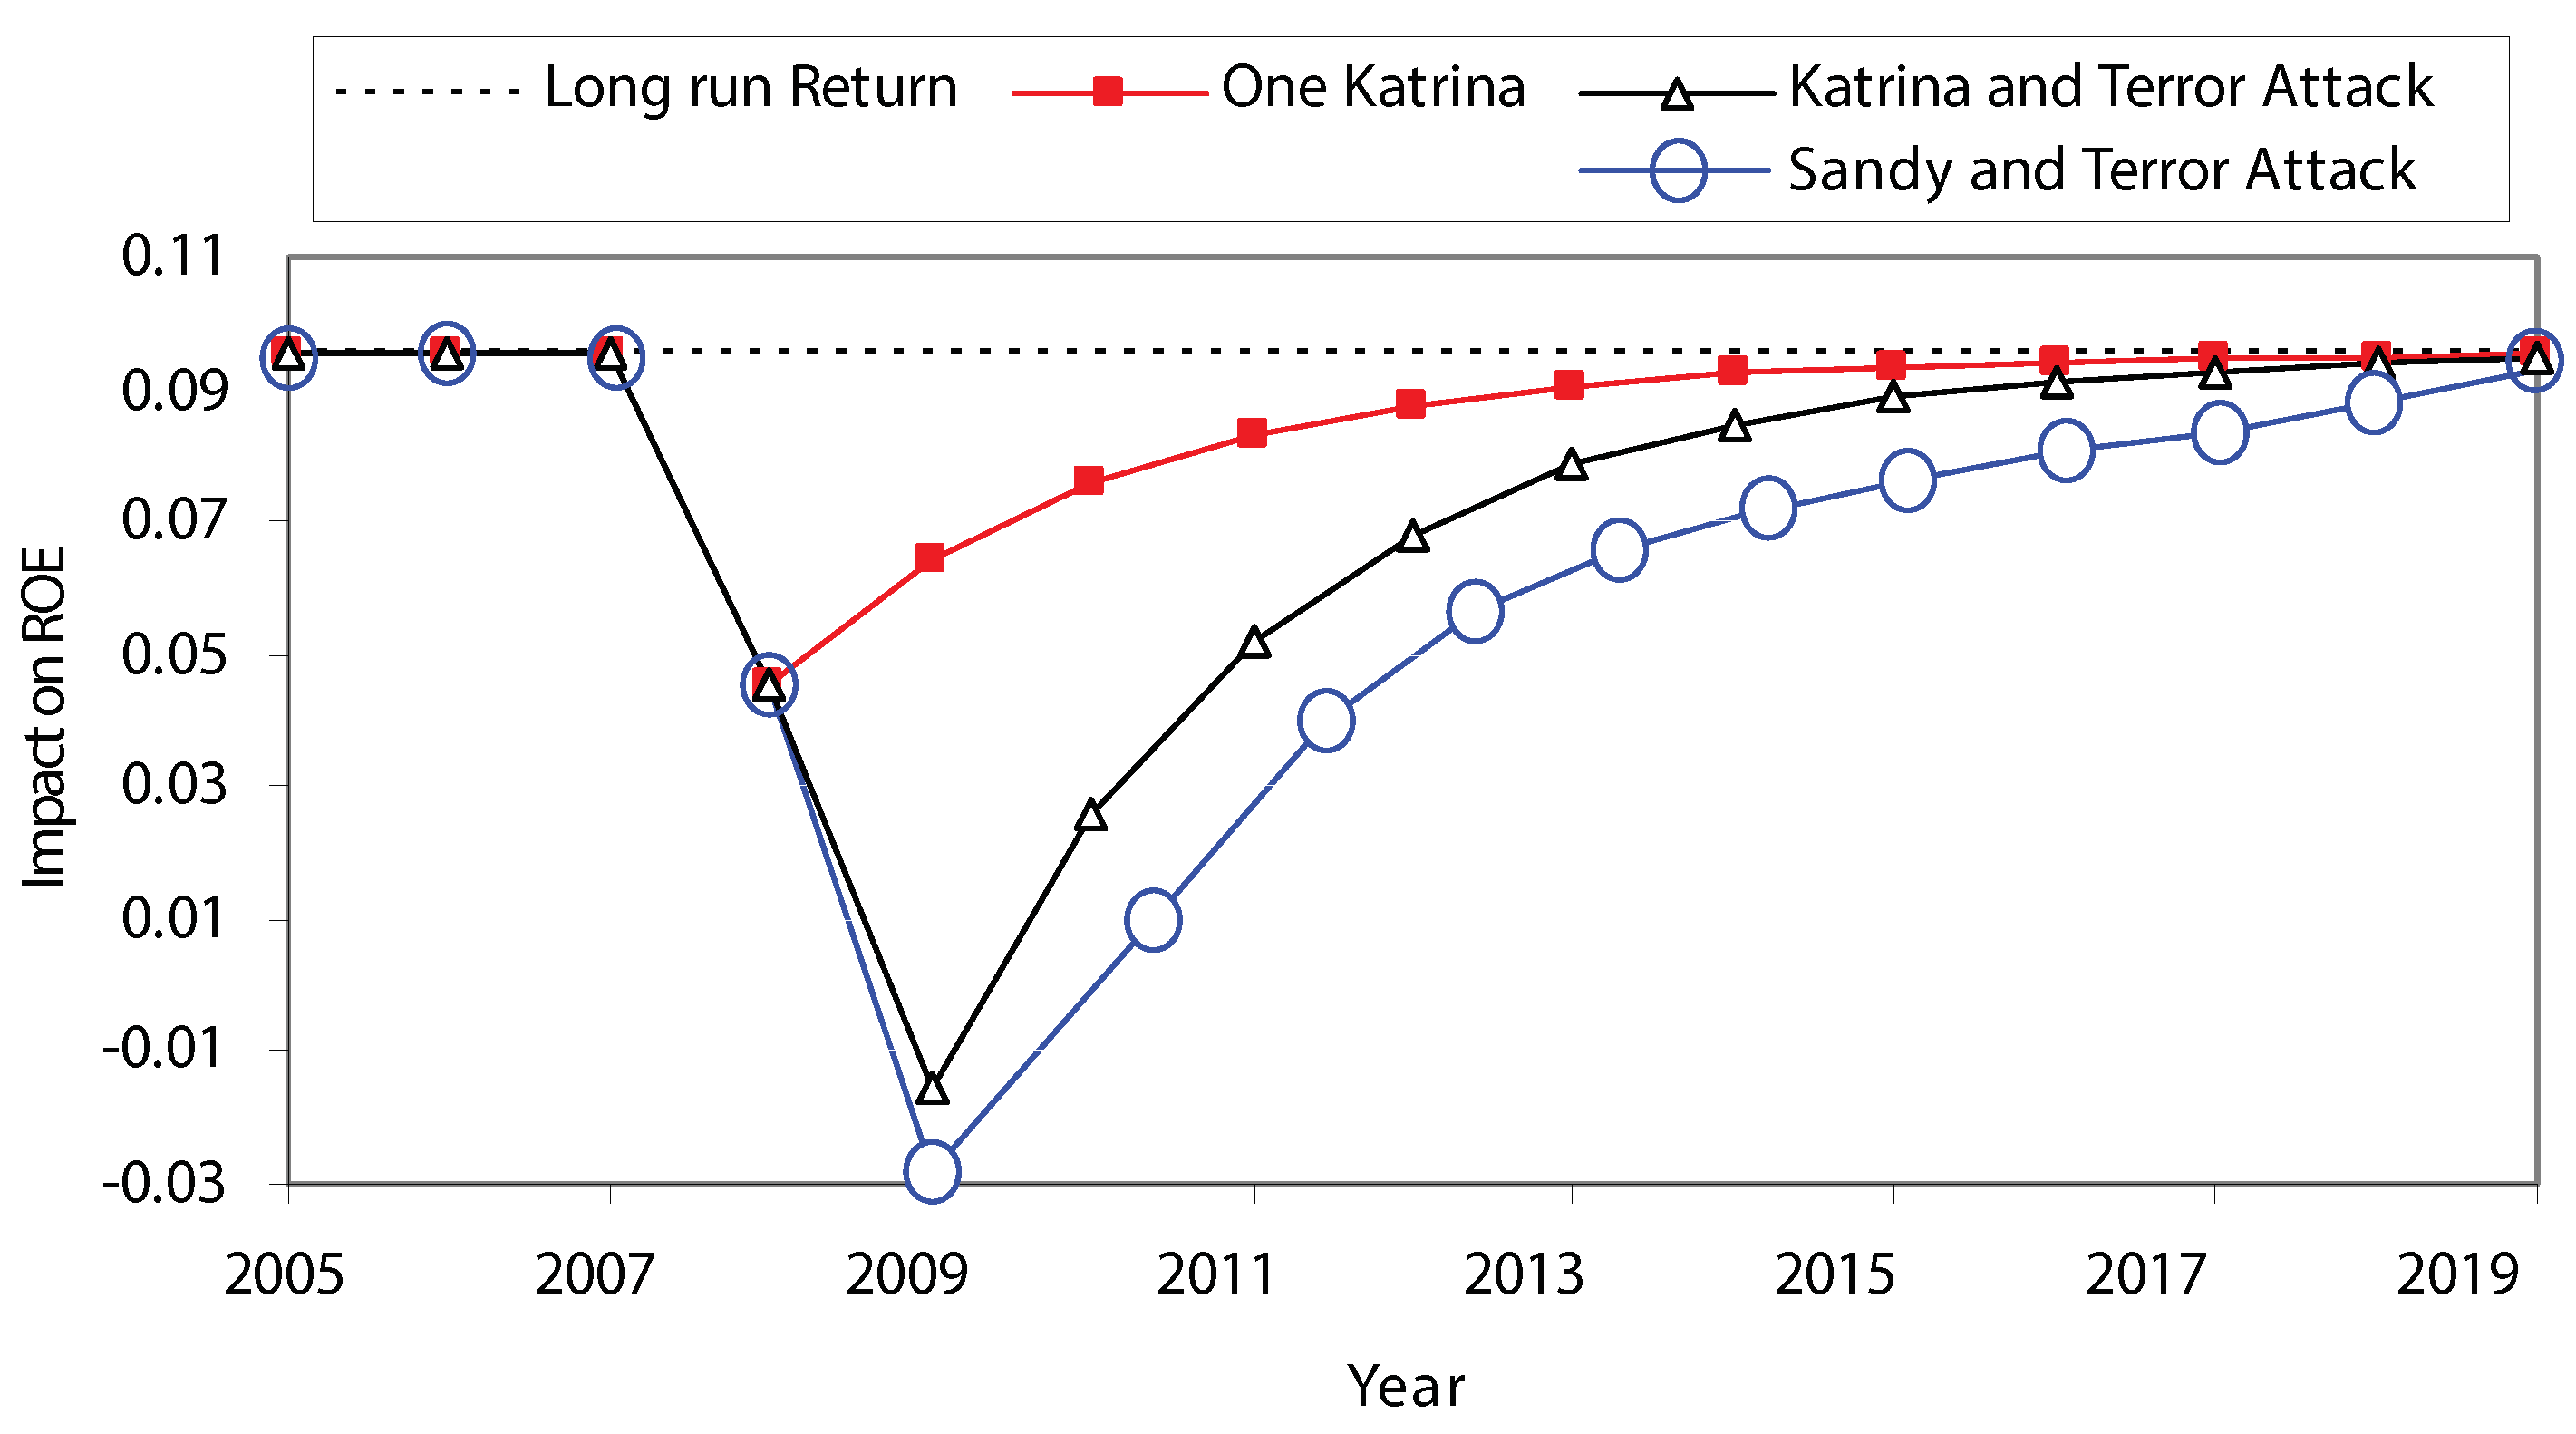
3.2.2. A Short Glimpse at a Mega-Catastrophe

We now briefly consider a hypothetical compound, mega-catastrophe scenario: a Katrina-scale hurricane loss that is followed by a 9//11 terrorist loss. Figure 2 illustrates the projected time-path for return on equity under this compound scenario that involves massive storm losses, followed by an even larger terrorism loss. The figure shows that insurers’ profitability is badly damaged under this scenario, but would, again, recover to within 75% of the “no-storms /no-9/11” within five years.
Our analysis and model predictions yields a number of insights, the most important of which are the following:
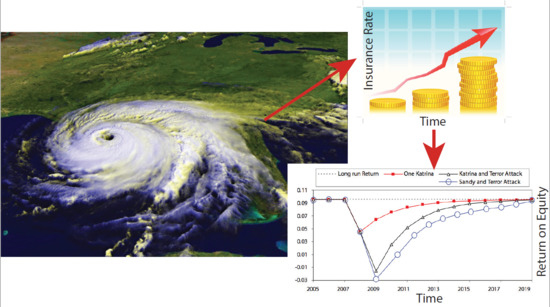
  • Hurricanes—even those associated with large losses—have no statistically detectable effect on the P/C industry’s return on equity;
  • The losses associated with the destruction of the World Trade Center—5.02% of total policyholder surplus, as noted in Table 3—are, according to our analysis, estimated to have cut the insurance industry’s return on equity by about 8.1%;
  • The WTC losses (relative to total policyholder surplus) are much less than those associated with Hurricane Katrina in 2005 (8.91%) and Hurricane Andrew in 1995 (10.41%), but are on par with those associated with the Hurricane Quartet in 2004 (5.66%).
  • The losses (relative to total policyholder surplus) for hurricane Sandy are the highest of all cases considered (11.60%). Sandy was responsible for the highest absolute losses ($60B). We speculate that this outcome is, in part, related to demographic differences that, for Sandy, entailed higher property values (and the like) than those that were impacted by Katrina.
These findings suggest that the financial impact of large-loss hurricanes (either singly or in combination) in a given year can be construed as random shocks to the industry—shocks that generate long-term responses because of the dynamic links between past and present rates of return on equity. This interpretation of our findings stands in stark contrast to what is, perhaps, the more “intuitive” expectation, namely, that such large-scale losses have a discernibly pronounced negative effect on industry profitability. Our analysis reveals that hurricanes do not have a consistent and statistically detectable effect on insurance industry returns.

3.2.3. Model Validation

The closeness of model predictions to the actual data is shown by the posterior probabilities in Figure 5. The posterior probability of a change in ROE considering also the ROE in the previous year (for any time lag) is slightly smaller than the change in ROE considering only r t 10 ; the range of values considering only r t 10 is narrower, and the maximum influence is smaller, than what the optimal model with r t 1 predicts. This makes intuitive sense, considering that the growth of ROE may be mitigated, in part, by previous realizations. We determine that the optimal lag for our model-based predictions of ROE is τ = 1 . A predicted higher ROE with r t 10 is only possible by representing a risk-taking scenario where no memory of previous events is considered. The frequencies used are based on the relative frequency of the odds ratio being between the various class intervals along the horizontal axis from 10 Monte Carlo samples. With only r t 10 , the median odds ratio is 0.15 and the mean is 0.20. With r t 1 and r t 10 , the median odds ratio is 0.097 and the mean is 0.19. The maximum likelihood estimate of the frequency distributions (data and model predictions) is a lognormal distribution, and the coefficient of determination is R = 0.88. The two distributions show that the presence of a hurricane is a second or third order factor on the ROE change; the inclusion of historical ROE, for time lags τ higher than one, does not make any difference in the change of ROE. For the dataset used here, the average change is on the order of 0.10–0.20%. The value of r t 1 i already contains all the information about historical variability.
Finally, to test the robustness of our model and analysis, we verify variable importance using a Global Sensitivity and Uncertainty Analyses (GSUA) technique (see Materials and Methods for an explanation of the method). Figure 6 shows that the number and average intensity of hurricanes are second-order factors in predicting ROE, thus they can be neglected by the model. This analysis, by itself, produces an interesting result because it suggests that the magnitude and number of hurricanes do not affect insurance industry profitability in a noticeable way, at least for the data used here to validate the model. The most important variables are the interest rate on ten year Treasury bonds and the premium growth rate; accordingly, these factors are climate-insensitive. In contrast, terror attacks can affect the ROE, since the corresponding variable in the model is the third most important factor explaining ROE variability. Overall, because model variable interdependence is low (small S i j ), the nonlinearity between extreme events and insurance industry is relatively small, at least in the context of the selected model.
We point out that H t , Z t , and r t τ i (for the temporal lag τ different than one) are, for the data set employed here, second- and third-order factors, respectively (as indicated by the GSUA plot shown in Figure 6) that can be dropped from the original model considering the prediction of r t . The r t 1 i term is representative of the historical dependence of ROE; r t 1 i is weakly dependent on any other factor as much as r t i , considering their small value of S i j . Therefore, the hurricane-insurance dynamics observed here are characterized by a small nonlinearity, and the simple chosen model is meaningful to predict ROE variability. It is important to note that these empirical findings should not be taken to imply that, in reality, the factors H t , Z t , and r t τ i ) are completely non-influencing for ROE variability; still, in terms of prediction of ROE, they do not have a major influence in its variability. Ultimately, every model and analysis of this kind is strongly dependent on (i) the outcome that is predicted (in this case, ROE), (ii) the scale and resolution at which the outcome is predicted (in this study, for the whole insurance industry and the year resolution), (iii) the dataset used, and finally (iv) the model used for making predictions. Here, we choose a simple, almost “assumption-free” model precisely to avoid any model-induced artifacts; of course, along the way, we show how our dataset is consistent with the underlying assumptions of our econometric estimation and inference procedure.

4. Discussion

4.1. Model Findings

From the outset, we note that the analysis set forth here—the details of which are presented in Materials and Methods—fails to detect any consistent connection between large hurricanes and insurer profits. In fact, our analysis suggests that hurricanes are just one more essentially unpredictable risk that insurers must consider when covering personal and commercial lines. One explanation for this somewhat counter-intuitive result is that private insurers do not cover flood losses; consequently, a substantial part of the financial wreckage associated with large storms is simply avoided by insurance markets. As we discuss below, the absence of a statistically meaningful link between big hurricanes and insurance returns strongly suggests that the industry can withstand the adverse financial impacts associated with intermittent high-loss hurricanes.
Of course, it should, perhaps, go without saying that not all companies will fare equally well in the event of big storms. Well-run companies will be able to ride out bad storms by earning good returns on other lines of business and through their portfolio management activities, while poorly run companies will fail because unsound actuarial analysis and financial management exposes them to too much risk. The econometric analysis conducted here suggests that occasional high-loss hurricanes are yet another “shock” that tests the actuarial and business acumen of insurers in a competitive market place. This process of economic selection rewards competence in underwriting, risk management, and financial management, and it punishes poorly run firms with weakened financial viability or, in extreme cases, extinction. While particular enterprises in specific regions may get themselves into trouble in the aftermath of high-loss hurricanes—leading, in many instances, to substantial changes in the affordability and availability of insurance going forward—there is no evidence that returns to the insurance industry, as a whole, are reduced by large hurricanes losses in any systematic fashion.
This interpretation may seem counter-intuitive at first, since there is little doubt that large hurricanes and other extreme weather events lead to substantial losses which reduce insurers’ return on equity. However, the lack of any statistically significant relationship between the insurance industry’s return on equity and the number or strength of hurricanes in a given year means that there is no predictable relationship between this form of extreme weather and industry profitability.
The absence of a statistically significant relationship between large hurricane losses and the insurance industry’s return on equity implies that there is no consistent return penalty imposed by hurricanes, with the result that we are unable to assess the “normal” costs of hurricanes in terms of the financial performance of the industry. We are not in a position to say that a year with a large number of storms will push profits down relative to a year with a small number of storms precisely because there is no systematic relationship between the number or size of storms, on the one hand, and industry ROE, on the other—we simply have no evidence on this point. While it is sensible to presume that industry returns would be higher in the absence of severe storms losses, such a statement is an arithmetic counterfactual that is true but of limited value, in the same way that the statement “insurers will experience higher returns if the number of auto accidents suddenly fell by a third” is true but trivial. In consequence, while it reasonable to say that insurers’ profits would have been higher had fewer bad losses been incurred, this has no bearing on the question of how, prospectively, a run of bad luck in matters of extreme weather can be expected to affect insurers’ profits.
Along these lines, the astute reader might be tempted to ask whether we can use the average decline in insurers’ return on equity as a measure of the burden of hurricanes on the insurance industry, or rely on the mean and variance of large hurricane losses relative to policyholders’ surplus to make educated guesses about the probability of large-scale financial distress associated with extreme hurricanes. Such a procedure implicitly assumes that (i) we possess a good deal of knowledge about the probability distribution of hurricane losses relative to policyholders’ surplus; and (ii) the parameters of this distribution—whatever they may be—are either stable or evolving in predictable ways, which essentially amounts to assuming away the problem of scientific uncertainty posed by climate change.
The overarching goal of this econometric exercise is to determine whether, and to what extent, hurricanes impose a predictable financial penalty on insurers so that we can then proceed with statistically informed speculation about how any increase in the frequency or severity of storms might affect the profits of insurers. Unfortunately, the results of our econometric exercise have not provided evidence that hurricanes reduce insurers’ ROE in a consistent fashion, thereby making it difficult to assess the price that climate change extracts in terms of insurer profits in the event more frequent and destructive storms.
One important implication of our analysis is that the lack of any statistically significant link between hurricanes and the rate of return to equity for insurers actually allows decision-makers to make informed guesses about the effects of a string of high-loss hurricanes on overall P/C industry losses over time. A conjecture of this sort is possible for two reasons. First, since hurricanes are not systematically linked to the rate of return on equity, a big loss in any one year might (or might not) pull down industry performance relative to trend, depending on the aggregate results of activity in other lines of business, risk management efforts and strategies, and financial market outcomes. A large, single storm associated with large losses can only have a substantial effect on the industry if other aspects of the business are weak as well. Of course, a tremendously destructive storm—the $100 billion mega-event that many within the industry fear—could be so far outside the range of losses experienced historically that it could strain many companies at once, thereby leading to potentially catastrophic results for the industry as a whole. This possibility is, however, offset by a second factor, namely, that the definition of a “large” hurricane loss is relative to the level of total industry policyholders’ surplus at any point in time. A $100 billion loss would surely be a severe blow to the industry in 2006, as total surplus is estimated to be $583B as of the end of 2012. This assumes that the random shocks affecting insurance returns include both hurricane and non-hurricane losses that are independent of each other, as well as unrelated to past values of P/C insurer returns, the 10-year Treasury bond rate, and WTC losses. This assumption implies that negative effect hurricane losses are generated by the same normal process that generates other, non-hurricane losses. If, however, hurricane losses are generated by a non-normal process—one with a negative mean and homoscedastic variance—then the error term for the regression equation is the sum of a normal and non-normal shock. This implies that all tests of the statistical significance of coefficients, and inferences therefrom, must be based on a mixed compound distribution. In any one year, a “large” hurricane loss is one that is substantial relative to the size of total industry surplus. Table 3 shows the current dollar value of the 10 largest hurricane losses, together with the level of industry surplus in the year that losses were incurred and the ratio of these losses to surplus.

4.2. Financial Resilience in a Larger Context

In order to place our findings in context, we must first remember that the resilience of the industry’s profitability in the face of a series of Quartet-scale storms is connected to the usual mechanisms of retrenchment by insurers in the face of large losses: higher premiums, higher deductibles, lower limits, and reduced insurance availability in high-risk areas [12,33]. The robust adjustment process of profitability to large shocks displayed above, though comforting and, in part, indicative of the considerable power of market mechanisms, still leads to the withdrawal of capital from regions and lines of business hit by large, concentrated losses in favor of more lucrative lines within insurance and the broader financial services sector. A more finely grained econometric analysis—based, perhaps, on a dynamic, stochastic general equilibrium model of pricing, availability and risk portfolio choice by the industry—would reveal the statistical anatomy of industry adaptation observed in practice and consistent with economic common sense: the restoration of insurers’ profitability in the wake of a run of bad hurricanes includes the reallocation of capital to more remunerative and safer activities.
The withdrawal of capital from high-risk areas hit by big storms will, of course, either lead to more expensive insurance in states where regulators allow market pricing to operate, or to an even more severe reduction in availability where government prevents the price mechanism from working. In this matter, as in many others areas of insurance, high storm losses will be followed by one of two possible price/quantity regimes: (i) a regime where prices are high enough to reflect the frequency and severity of losses in storm-battered regions, in a manner that compensates insurers’ for the risks they take on; or (ii) a regime of controlled prices where insurance is scarce because government policies are not responsive or adaptive to the fact that insurers cannot provide protection for people and property in high-risk places at low prices. These remarks should not be interpreted as either implicit or explicit support for a federal government role in providing reinsurance in cases of natural disasters. The considerations raised in Jaffee and Russell’s [34] excellent economic analysis of arguments for and against a natural catastrophe reinsurance scheme must still be explored in far more detail before a reasonable conclusion about the feasibility—to say nothing about the desirability—of a natural catastrophe fund is reached. Our purpose here in assessing the resilience of the insurance industry in the face of a series of large hurricane losses is to assess the financial consequences of extreme weather events. To the extent that our focus here is limited to the issue of financial resilience, we remain agnostic about whether—or how—a natural catastrophe reinsurance system would alter the protective or efficiency properties of insurance markets. A third option—the increased socialization of insurance by the creation and expansion of state sponsored insurance and re-insurance facilities in affected states—is a likely short-term response to the problem of the declining availability and affordability of insurance in the aftermath of large hurricane losses. However, these mechanisms are so freighted with well-known incentive and fiscal problems (and related uncertainties) that they cannot be long-term solutions to the problem of expensive insurance in regions where private insurers must cope with substantial exposures to large hurricane losses.
A review of the extant literature reveals econometric analyses with findings that are qualitatively similar to ours. For example, Ref. [35] finds that investors react positively (with significant, though short-lived, stock market returns) to hurricanes, thereby lending partial credence to the idea of insurer financial resilience in the face of extreme weather events; in the same paper, the authors show that different industries react differently to hurricanes, but they did not investigate universal response patterns across all industries. In a similar vein, Ref. [36] found that P/C insurers were, in terms of cumulative average abnormal returns from 10 days before to 10 days after hurricane landfall, insensitive to Hurricanes Katrina (2005) and Sandy (2012). These empirical findings are consistent with other studies of the impact—both immediate and subsequent—of Hurricane Katrina, highlighting that the short-term economic impact was small and perhaps suggesting that investors do not “overreact” to hurricanes. Future data from the Task Force on Climate-related Financial Disclosures [37] can make analyses more refined with respect to the proposed analyses.
Considering, then, both of the impulse–response diagrams presented here, it is evident that resilience is higher for larger impacts, considering both the the speed of recovery as well as the inverse of the area under the unaffected (ROE) profile. These dynamics seem to be a universal pattern that is independent of system’s details. The area under the unimpacted profile is proportional to the damage (the complementary of the area can be considered as the “learning” information volume), as is the slope of the response function as the speed of the system’s recovery. The larger the catastrophe, the higher the learning, as well as the speed of recovery. Practical examples of this behavior, in the context of hurricane disasters, are the ex post behavioral dynamics of events related to Hurricanes Katrina, Sandy, and Harvey.

5. Conclusions

In this paper, we have sought to explore the financial resilience of the insurance and reinsurance industries in the face of climate change and extreme weather. Contemporary climate science is an impressive intellectual endeavor that has revealed much about the complex dynamics of the Earth’s climate system, enough to put us on notice that climate change is a natural phenomenon, increasingly driven and amplified by human activity [38]. Indeed, while climate science has gradually confirmed man’s influence on the cyclical and millennial changes of the global climate system, it still only offers few hints as to how anthropogenic influences on the Earth’s climate might affect weather patterns in particular regions of the world, or the frequency or severity of extreme weather events like hurricanes, tornadoes, heat waves, torrential rains, and rising sea levels. Advances in climate science have shown us that the Earth’s weather systems are complex and mathematically chaotic, and unlikely to fully reveal their internal mechanisms to scientists for decades to come. For now, all we know for certain is that our planet’s climate is changing, that this change could lead to an increase in the frequency and severity of dangerous weather at some time in the future—perhaps over the course of the next century (or more)—and that institutions charged with the pricing, management, and mitigation of risk should pay close attention to evidence that is emerging.
Here, we have sought to explore the profitability consequences of massive losses from one form of extreme weather—a string of Quartet-scale storms striking the United States, as well as the prospect of a Katrina-scale storm combined with a mass terror attack on the scale of 9/11. The results of this econometric analysis that explores the relation between insurer profitability and extreme weather suggest a high level of macro-resilience for the insurance industry, in the sense that the system—with its current operating procedures—can withstand a series of extreme shocks. However, as our discussion above suggests, the industry’s recovery mechanism involves a series of price and quantity adjustments, along with regulatory and public policy developments, that will almost surely alter the long-term availability and affordability of insurance, along with insurers’ methods for managing claims in the face of disaster. A detailed, micro-economic analysis of the insurance industry’s response to the challenges posed by climate change involves a much more tightly focused consideration of the interaction of particular perils—tornadoes, flood, hurricanes, heat—in particular regions, with specific regulatory approaches in light of state and federal public policy constraints, as well as the financial conditions facing insurers. Of course, the issue of how insurers deal with gradual, as opposed to abrupt, climate change is, itself, a vast subject in its own right, not least because abrupt climate change threatens to make it difficult if not impossible for companies to use their accumulated knowledge about past risks and losses to predict what may be an utterly different weather future.
To be sure, insurers and reinsurers will face a number of practical challenges in applying climate science, economics, risk management, and (lest we forget) common sense to the problem of pricing, managing and mitigating catastrophic risk. For its part, climate change—and its potential linkages to extreme weather—remains an uncertain (and potentially game-changing) factor influencing the financial resilience of the industry.

Author Contributions

Conceptualization, L.J.V.J. and M.C.; methodology, L.J.V.J. and M.C.; software, L.J.V.J. and M.C.; validation, L.J.V.J. and M.C.; formal analysis, L.J.V.J. and M.C.; investigation, L.J.V.J. and M.C.; resources, L.J.V.J.; data curation, L.J.V.J. and M.C.; writing—original draft preparation, L.J.V.J. and M.C.; writing—review and editing, L.J.V.J. and M.C.; visualization, L.J.V.J. and M.C.; supervision, L.J.V.J.; project administration, L.J.V.J.; funding acquisition, NA. These authors contributed equally to this work.

Funding

This research received no external funding.

Acknowledgments

The authors are indebted to Marcellus Andrews of Bucknell University for his initial work [39] in developing the econometric model and analysis presented here, and to the late Gordon Stewart, past president of the Insurance Information Institute, who originally spearheaded this work in the wake of Hurricane Katrina. The views and opinions expressed herein do not necessarily state or reflect those of the United States Government, Japan Government, or any agency thereof.

Conflicts of Interest

The authors declare no conflict of interest.

Appendix A. Climate Change, Extreme Weather, and Risk

Here, we explore the issue of the potential linkage between anthropogenic climate change and extreme weather, with particular emphasis on tropical cyclone activity in the North Atlantic. We frame our discussion in terms of ongoing efforts to arrive at reliable estimates of future tropical cyclone activity—on both global and regional scales. We consider hurricane dynamic features such as frequency and intensity, and how these can be used to estimate hurricane risk exposure.

Appendix A.1. Estimating Hurricane Frequency

Variability is an endemic feature of the Earth’s climate. Understanding the natural climatic variability of the globe is therefore central to understanding the potential influence that anthropogenic factors might have on global climate change. Models and experiments that disentangle the natural and anthropogenic factors that drive climatic change are central to efforts directed at devising better predictive capabilities. Globally, the 1980s and 1990s were characterized by unusually warm weather. In fact, eight of the 10 warmest years in the past century occurred during this time period. As Figure A1 illustrates, an increase in global mean surface temperature change (of about 0.3 C–0.6 C) has occurred since about 1860. A cursory glance at this figure reveals both year-to-year and decade-to-decade variability in the historical record; and even though there is a distinct warming trend, the increase is nonuniform, with periods of both cooling and warming.
Figure A1. Changes in global mean surface temperature relative to 1961–2013 (source: NOAA).
Climate 07 00055 g0a1
Turning to the specific issue of hurricane activity in the North Atlantic, Figure A2 illustrates that the mid-1990s marked the beginning of a period of pronounced increases in the annual number of named tropical storms and major hurricanes in this region. In the Atlantic hurricane season of 2005, for example, there were a record-breaking 27 named storms, 14 of which were hurricanes. Of these 14 hurricanes, seven were classified as major hurricanes; three of these seven major hurricanes reached Category 5 status. Empirical evidence suggests that the frequency and intensity of tropical cyclones is increasing as surface ocean temperatures increase [40]. However, the same evidence points out that future climate scenarios feature fewer but more extreme cyclones on average.
Figure A2. Annual number of named tropical storms and major hurricanes: Atlantic, 1944–2013; named tropical storms are depicted in blue and major hurricanes are depicted in red (source: NOAA).
Climate 07 00055 g0a2
The observed variability in hurricane frequency in the past decade is not so extreme that it cannot be explained in terms of naturally occurring multi-decadal variability. The global historical record for tropical cyclones yields several important insights in this regard. First, it is important to note that globally, there has been no appreciable increase in tropical cyclone activity over the past several decades. Webster et al. [41], for example, note that over the past 30 years, there has been no trend towards either increases or decreases in the total number of storms seen in a given year. Indeed, from a global perspective, these results are not surprising, as the past half-decade or so has seen heightened levels of hurricane activity, whereas the 1970s, 1980s, and early 1990s were marked by diminished levels of hurricane activity. One has to look as far back as the 1940s, 1950s, and the early 1960s to find hurricane activity levels commensurate with present levels.
As for the spatial variability of tropical cyclones, a discrepancy in trends of intensity and frequency is observed for different basins other than the Atlantic cyclone basin [40]. This observed regional variability in the number, intensity, and frequency of tropical storms and hurricanes complicates efforts to arrive at a comprehensive and global understanding of the major influences of tropical cyclone frequency—be they anthropic in character or naturally occurring. Indeed, while storms in the North Atlantic have become more frequent since the 1990s, in other parts of the world—such as the Western and Eastern Pacific—tropical cyclone frequency has, in fact, declined since the early 1990s. As Webster et al. [41] describe, the current situation is one where “against a background of increasing sea surface temperature, no global trend has emerged in the number of tropical storms and hurricanes” (emphasis added). As we discuss below, our current inability to arrive at global insights has important ramifications for ongoing efforts to arrive at regional characterizations of the behavioral dynamics of tropical cyclones. In all of this, we are, of course, keenly interested in deriving reliable estimates of the frequency of future tropical cyclone activity. As described above, however, current efforts to utilize the available historical record to discern trends—which can, in turn, be used as the basis for deriving forward-looking projections of future tropical cyclone activity—have led to largely inconclusive results.
Given these limitations, climate scientists also pursue a number of global modeling efforts that seek to arrive at realistic representations of the global climate system; these representations are then used to produce model-derived projections of future tropical cyclone activity [15,33,40,42,43]. While progress has been made in developing increasingly sophisticated models of the global climate system, the climate change research that bears most directly on questions concerning potential future changes in hurricane frequency arising from greenhouse warming is, at best, ambiguous. The major modeling results published in recent years lack consistency in projecting increases or decreases in the total number of storms. See, e.g., Henderson-Sellars et al. [10], Royer et al. [44], and Sugi et al. [45]. One area where the empirical studies and the global modeling results are in agreement is in projecting that future changes in tropical cyclone frequency will be regionally dependent. If true, this situation will require modeling efforts that are capable of rendering informative regional forecasts and scenarios. At the present time, though, climate scientists’ understanding of tropical cyclogenisis is too incomplete to render reliable projections about future changes in tropical cyclone frequency. This observation notwithstanding, what the historical record illustrates with great clarity is that future changes in hurricane frequency are likely to exhibit considerable year-to-year and decade-to-decade variability.

Appendix A.2. Estimating Hurricane Intensity

The analytical task of discerning trends in tropical cyclone intensity is more complex than that of estimating tropical cyclone frequency. One reason for this is that there are, in fact, several plausible measures of storm intensity. Common measures of tropical cyclone intensity are: Maximum Potential Intensity, Average Intensity, Average Storm Lifetime, Average Wind Speed, Maximum Sustained Wind Speed, Maximum Wind Gust, Accumulated Cyclone Energy, Minimum Central Pressure, and Power Dissipation. As before, it is useful to begin our discussion by examining the historical record for indications of how tropical cyclone intensity has varied over time. The empirical record reveals that, over the past half-century, tropical and subtropical sea-surface temperatures have shown an overall increase of approximately 0.2 C. Although most global modeling studies predict increases in modeled storm intensities under greenhouse warming scenarios, the statistical evidence in favor of hypotheses that postulate systematic increases in potential storm intensities is weak. See, e.g., Free et al. [46]. Webster et al. [41], for example, note that globally, since 1970, the annual number of Category 1 hurricanes has declined, whereas the number of Category 2 and Category 3 hurricanes has fluctuated (though the global average has, nevertheless, remained fairly constant over the same time horizon). Over the same time period, the number of Category 4 and Category 5 hurricanes has increased.

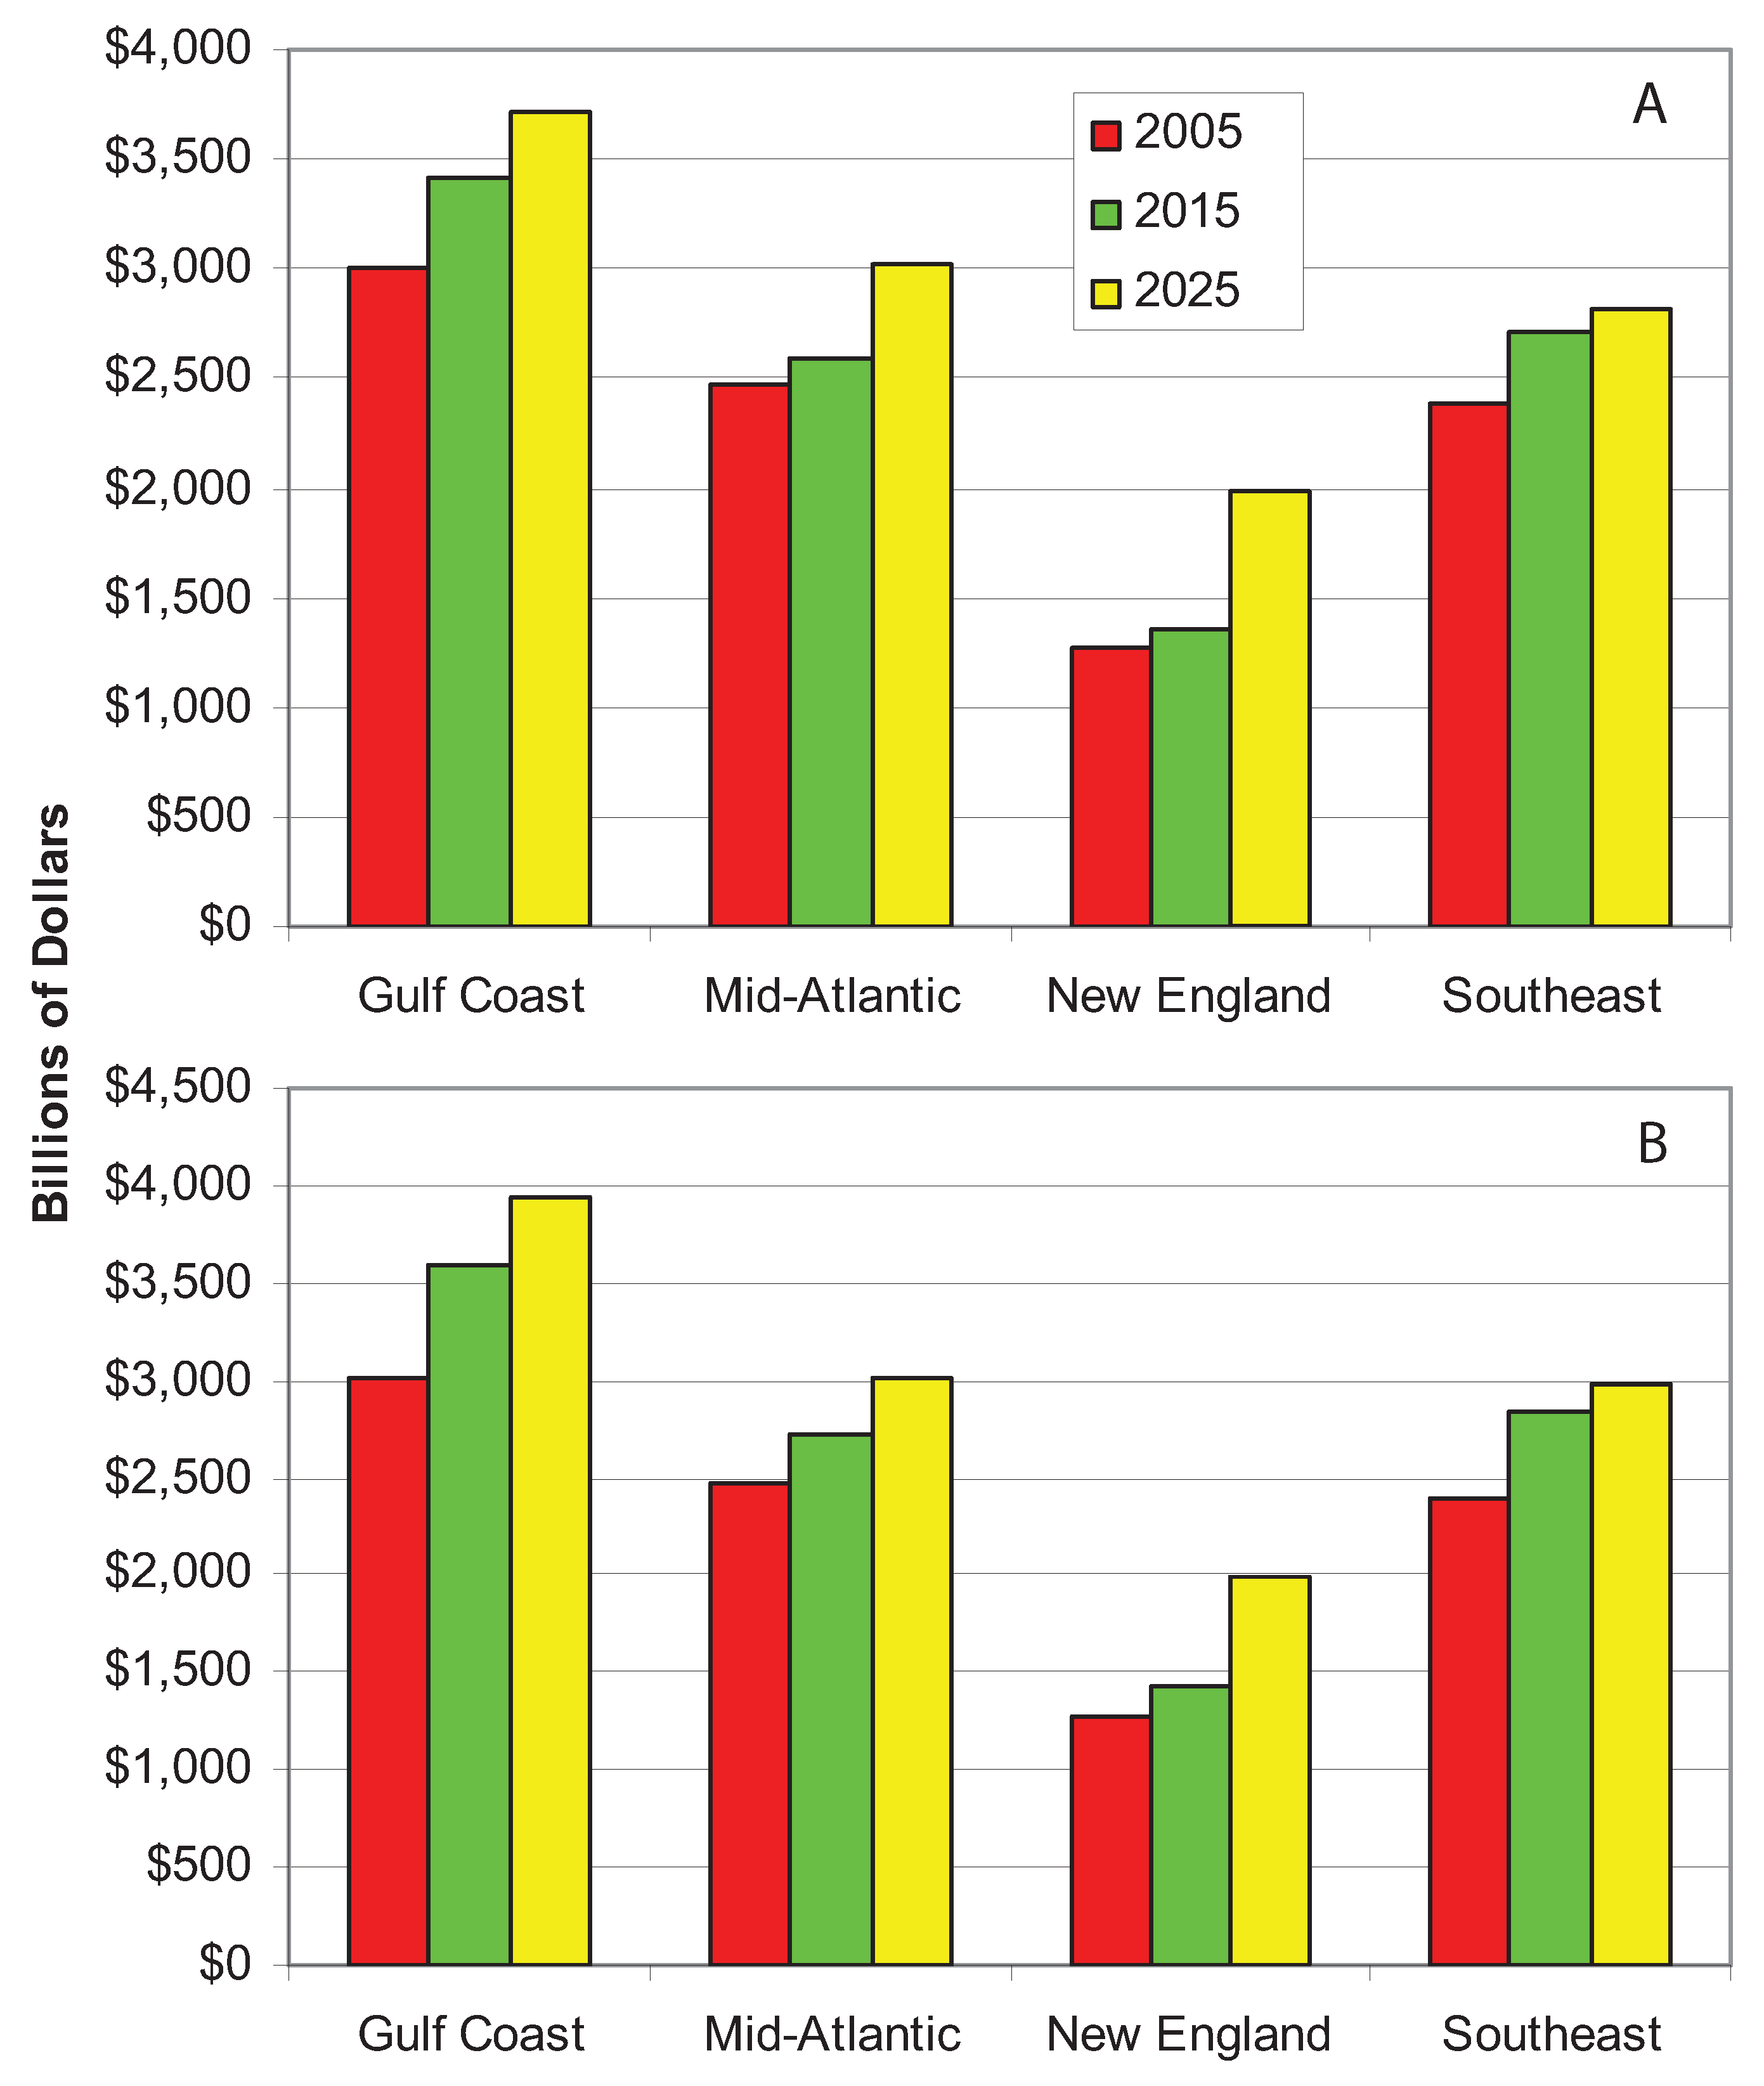
Appendix A.3. Estimating Hurricane Risk Exposure

Consideration of the vulnerability and exposure dimensions of hurricane risk is central to any reasoned approach to climate insurance [15]. At the bottom, the models that are used to explore these facets of hurricane risk focus on population-related variables, and they endeavor to characterize and evaluate the effects that hurricanes have on human welfare and physical assets. Arriving at reliable estimates of economic and insured loss requires an understanding of how vulnerable specific geographic regions or structures are to extreme weather events. In seeking quantified estimates of vulnerability to these events, modelers begin by characterizing the inventory of persons and properties at risk. Knowledge about inventory and vulnerability, combined with knowledge and information about the natural hazard itself, allows risk managers to quantify the expected impacts and outcomes associated with extreme weather events.
Most efforts to characterize the primary drivers of hurricane risk exposure focus on two factors: (i) how society develops in terms of changing demographics; and (ii) how society prepares itself for storms.
From a risk-based perspective, the vulnerability and exposure dimensions of the problem will almost surely dominate any influence that variations in storm frequency and intensity—be they caused by natural or man-made factors—will have on overall characterizations of risk for particular geographic regions of the country. This is certainly true at very small scales. Indeed, the major source of worry concerning hurricane risk exposure in the United States is the fact that the size of coastal populations will grow faster than the overall existing population, thereby radically increasing the number of persons, and both the amount and value of property, in the path of potentially destructive hurricanes [43].
As many commentators have noted in recent years, the best available projections of the country’s rapidly changing demographics paint an increasingly dire situation. These projections, when combined with conservative assumptions about the growth of property ownership per person in coastal areas, suggests that we will continue to see substantial increases in the value of coastal properties vulnerable to hurricanes. Figure A3A,B show the level of vulnerable coastal properties that existing in 2015 and 2025 assuming (i) a one-half of one percent annual increase in the inflation adjusted value of coastal property per person; and (ii) a one percent annual increase in coastal property holdings per person. Note that Florida is included in both the Southeast and Gulf Coast tallies. The rapid growth of the Gulf States will lead to an explosion in the value of vulnerable property, despite the modest per person property growth rates assumed, compared to the exposure of slower growing regions (such as the Mid-Atlantic and New England) or the Southeast.
Figure A3. Value of coastal property from data, 2005–2025. (A,B) represent 0.5% and 1% growth, respectively (source: U.S. Census Bureau).
Climate 07 00055 g0a3
Looking forward, the risk management challenges that arise from these problems are two-fold in nature. First, research efforts must continue to strive to develop meaningful regional forecasts of tropical cyclone activity. How uncertainty is characterized and evaluated in these forecasts is an issue very much at the forefront of current research [47]. Researchers and catastrophe modelers will, of course, continue to mine the available historical record for emerging patterns and trends, and, over time, these efforts will lend themselves to predictive exercises that yield insights that are useful to decision-makers. Second, in the absence of regional forecasts that engender confidence on the part of decision-makers and risk managers, efforts must focus on arriving at strategic risk mitigation options that are, to some measurable degree, flexible, robust, and capable of engendering resilience [19]. It is this last topic—the financial resilience of the insurance industry to extreme events—that is the focus of the analysis developed and presented here.
At present, there is only weak evidence suggesting the possibility of a systematic increase in the potential intensity of future tropical cyclone activity. Emanuel [42], for example, reports a discernable upward trend in power dissipation in the North Atlantic and the Western North Pacific. And while the observed trend is dramatic (a factor of two increase over the past half century), the underlying causal mechanisms are far from being well-understood. Power dissipation measures the total amount of energy released by a hurricane over its lifetime. Technically, Emanuel [42] defines the annual power dissipation index (PDI) as the integral of the third power of the maximum sustained wind speed over all 6-h observations at tropical storm intensity or higher and over all tropical cyclones during the year.
In the North Atlantic—consistent with our earlier remarks about storm frequency—recent increasing trends in Atlantic storm intensity can largely be explained by multi-decadal variations that are, in some respects, better understood than the physical theories that attempt to relate storm intensity to tropical climate change. Numerous statistical studies have mined the available empirical record for evidence of anthropogenically-induced trends; still, no significant anthropogenic trends have emerged from these studies. See, e.g., Landsea et al. [48] and Chan and Liu [11]. Some recent analysis have shown how intensity and frequency of tropical cyclones are correlated, where cyclone intensity is a power-law distributed variable [6]. Having explored the relevant empirical findings, let us return to the global modeling studies that we discussed earlier, this time exploring the model-based, theoretical insights that have emerged in recent years about the influence that anthropogenically-induced greenhouse warming might have on hurricane activity in the United States.
Early efforts along these lines gave many pause for concern. In 1987, for example, Emanuel [49] reported that a doubling of atmospheric CO 2 levels would give rise to increased sea-surface temperatures, eventually producing 40–50% increases in the maximum strength of hurricanes. As alarming as these predictions were, it is worth noting that, at around this same time, equally credible scientists were arguing the reverse, i.e., that greenhouse warming could, in fact, give rise to decreases in hurricane frequency and intensity. See, e.g., Idso [50] and Idso et al. [51]. The very latest global modeling studies have sought to explore the manner and degree to which anthropogenically-induced warming influences tropical cyclone intensity. Some studies suggest that the projected changes in tropical cyclone intensity are small. Emanuel, for example, reports a 10% increase in wind speed for a 2 C increase in tropical sea surface temperature. Two sets of published results suggest that Emanuel’s estimates may, in fact, overstate the true value of these projected increases. Researchers using the GFDL model, for example, report a 5% increase in hurricane wind speeds by 2080 [52,53]; more recently, Michaels et al. [54] report even smaller increases over comparable time horizons.
In interpreting these results for insurance-related risk management contexts, it is important to recognize that an endemic feature of the types of global simulation studies discussed above is that they lend little insight into questions concerning the timing of these projected increases. This is true, also, for recent detailed predictions [47], particularly for the timing of cyclones at very small scales. In many of these global modeling studies, modeled changes in tropical cyclone intensity unfold over very extended time horizons. As Knutson and Tuleya [53] note, “ CO 2 -induced tropical cyclone intensity changes are unlikely to be detectable in historical observations and will probably not be detectable for decades to come” [emphasis added]. Michaels et al. [54] echo this belief—and take it, perhaps, one step further—with their assertion that changes in “future hurricane intensities will be undetectable in the foreseeable future and, in fact, may never be manifest” [emphasis added].
As before, arriving at reliable assessments of regional climate change is, perhaps, the greatest challenge facing climate modelers today. The ability to link—conceptually and empirically—anthropogenic climate change to storm intensity in ways that lend themselves to modeling efforts that yield reliable regional forecasts is, unfortunately, some years away.

References

  1. AMSC. The Changing Atmosphere–Challenges and Opportunities. Bull. Am. Meteor. Soc. 1988, 69, 1434–1440. [Google Scholar] [CrossRef]
  2. Limited, C.R.M. Financial Risks of Climate Change; Technical Report; Association of British Insurers: London, UK, 2005. [Google Scholar]
  3. Mills, E.; Roth, R.; Lecomte, E. Availability and Affordability of Insurance Under Climate Change: A Growing Challenge for the United States; Technical Report; Lawrence Berkeley Lab, University of California at Berkeley: Berkeley, CA, USA, 2005. [Google Scholar]
  4. Schertzer, D.; Lovejoy, S. Non-Linear Variability in Geophysics: Scaling and Fractals; Springer: Berlin, Germany, 1991. [Google Scholar]
  5. Menabde, M.; Seed, A.; Harris, D.; Austin, G. Self-similar random fields and rainfall simulation. J. Geophys. Res. Atmos. 1997, 102, 13509–13515. [Google Scholar] [CrossRef]
  6. Corral, A.; Ossó, A.; Llebot, J.E. Scaling of tropical-cyclone dissipation. Nat. Phys. 2010, 6, 693–696. [Google Scholar] [CrossRef]
  7. Corral, A.; Turiel, A. Variability of North Atlantic Hurricanes: Seasonal Versus Individual-Event Features. In Extreme Events and Natural Hazards: The Complexity Perspective; American Geophysical Union: Washington, DC, USA, 2012; pp. 111–126. [Google Scholar]
  8. Fox, N.; Kaiser-Weiss, A.; Schmutz, W.; Thome, K.; Young, D.; Wielicki, B.; Winkler, R.; Woolliams, E. Accurate radiometry from space: An essential tool for climate studies. Philos. Trans. R. Soc. A Math. Phys. Eng. Sci. 2011, 369, 4028–4063. [Google Scholar] [CrossRef]
  9. Ranger, N.; Niehorster, F. Deep uncertainty in long-term hurricane risk: Scenario generation and implications for future climate experiments. Glob. Environ. Chang. 2012, 22, 703–712. [Google Scholar] [CrossRef]
  10. Henderson-Sellers, A.; Zhang, H.; Berz, G.; Emanuel, K.; Gray, W.; Landsea, C.; Holland, G.; Lighthill, J.; Shieh, S.L.; Webster, P.; et al. Tropical Cyclones and Global Climate Change: A Post-IPCC Assessment. Bull. Am. Meteorol. Soc. 1998, 79, 19–38. [Google Scholar] [CrossRef]
  11. Chan, J.C.L.; Liu, K.S. Global Warming and Western North Pacific Typhoon Activity from an Observational Perspective. J. Clim. 2004, 17, 4590–4602. [Google Scholar] [CrossRef]
  12. Hall, J. Policy: A changing climate for insurance. Nat. Clim. Chang. 2011, 1, 248–250. [Google Scholar] [CrossRef]
  13. Brown, T.M.; Pogorzelski, W.H.; Giammanco, I.M. Evaluating Hail Damage Using Property Insurance Claims Data. Weather Clim. Soc. 2015, 7, 197–210. [Google Scholar] [CrossRef]
  14. Siebert, A. Analysis of Index Insurance Potential for Adaptation to Hydroclimatic Risks in the West African Sahel. Weather Clim. Soc. 2016, 8, 265–283. [Google Scholar] [CrossRef]
  15. Elsner, J.B.; Burch, R.K.; Jagger, T.H. Catastrophe Finance: An Emerging Discipline. Eos Trans. Am. Geophys. Union 2009, 90, 281–282. [Google Scholar] [CrossRef]
  16. Dunstone, N.J.; Smith, D.M.; Booth, B.B.B.; Hermanson, L.; Eade, R. Anthropogenic aerosol forcing of Atlantic tropical storms. Nat. Geosci. 2013, 6, 534–539. [Google Scholar] [CrossRef]
  17. Klima, K.; Morgan, M.G.; Grossmann, I.; Emanuel, K. Does It Make Sense To Modify Tropical Cyclones? A Decision-Analytic Assessment. Environ. Sci. Technol. 2011, 45, 4242–4248. [Google Scholar] [CrossRef] [PubMed]
  18. Mitchell-Wallace, K.; Jones, M.; Hillier, J.; Foote, M. Natural Catastrophe Risk Management and Modelling: A Practitioner’s Guide; Wiley-Blackwell: Hoboken, NJ, USA, 2017. [Google Scholar]
  19. Aerts, J.C.J.H.; Botzen, W.J.W.; Emanuel, K.; Lin, N.; de Moel, H.; Michel-Kerjan, E.O. Evaluating Flood Resilience Strategies for Coastal Megacities. Science 2014, 344, 473–475. [Google Scholar] [CrossRef]
  20. Convertino, M.; Foran, C.; Keisler, J.; Scarlett, L.; LoSchiavo, A.; Kiker, G.; Linkov, I. Enhanced Adaptive Management: Integrating Decision Analysis, Scenario Analysis and Environmental Modeling for the Everglades. Sci. Rep. 2013, 3, 2922. [Google Scholar] [CrossRef] [PubMed]
  21. De Bruijn, K.; Buurman, J.; Mens, M.; Dahm, R.; Klijn, F. Resilience in practice: Five principles to enable societies to cope with extreme weather events. Environ. Sci. Policy 2017, 70, 21–30. [Google Scholar] [CrossRef]
  22. Panteli, M.; Pickering, C.; Wilkinson, S.; Dawson, R.; Mancarella, P. Power System Resilience to Extreme Weather: Fragility Modeling, Probabilistic Impact Assessment, and Adaptation Measures. IEEE Trans. Power Syst. 2017, 32, 3747–3757. [Google Scholar] [CrossRef]
  23. NOAA. Hurricane Database (Hurricane Number and Strength Data, 1954–2013); Technical Report; NOAA, 2019. Available online: https://coast.noaa.gov/hurricanes/ (accessed on 1 December 2018).
  24. Geospatial, N. Spatial Hurricane Database; Technical Report; NOAA, 2019. Available online: https://www.nhc.noaa.gov/data/ (accessed on 1 December 2018).
  25. of the President, T.E.R. U.S. Treasury Bond Rates. Technical Report; 2019. Available online: https://www.govinfo.gov/app/details/ERP-2017/ERP-2017-table25 (accessed on 1 December 2018).
  26. Institute, I.I. Annual P/C Rate of Return Data (1950–2013). Technical Report. 2019. Available online: https://www.iii.org/fact-statistic/facts-statistics-industry-overview (accessed on 1 December 2018).
  27. Hayashi, F. Econometrics; Princeton University Press: Princeton, NJ, USA, 2000. [Google Scholar]
  28. Pankratz, A. Forecasting with Dynamic Regression Models; John Wiley and Sons: New York, NY, USA, 1991. [Google Scholar]
  29. Lüdtke, N.; Panzeri, S.; Brown, M.; Broomhead, D.S.; Knowles, J.; Montemurro, M.A.; Kell, D.B. Information-theoretic sensitivity analysis: a general method for credit assignment in complex networks. J. R. Soc. Interface 2008, 5, 223–235. [Google Scholar] [CrossRef] [PubMed]
  30. Goldenberg, S.B.; Landsea, C.W.; Mestas-Nuñez, A.M.; Gray, W.M. The Recent Increase in Atlantic Hurricane Activity: Causes and Implications. Science 2001, 293, 474–479. [Google Scholar] [CrossRef] [PubMed]
  31. Miljkovic, T.; Miljkovic, D. Modeling Impact of Hurricane Damages on Income Distribution in the Coastal U.S. Int. J. Disaster Risk Sci. 2014, 5, 265–273. [Google Scholar] [CrossRef]
  32. Harris, R.; Sollis, R. Applied Time Series Modelling and Forecasting; John Wiley and Sons: Chichester, UK, 2003. [Google Scholar]
  33. Schwarze, R. Insurance Law and Economics Research for Natural Hazard Management in a Changing Climate. Geneva Pap. Risk Insur. Issues Pract. 2012, 37, 201–205. [Google Scholar] [CrossRef]
  34. Jaffee, D.; Russell, T. Markets Under Stress: The Case of Extreme Event Insurance. In Economics for an Imperfect World: Essays in Honor of Jospeh E. Stiglitz, R. Arnott et al.; MIT Press: Cambridge, MA, USA, 2003. [Google Scholar]
  35. Chatzivasileiadis, T.; Estrada, F.; Hofkes, M.W.; Tol, R.S.J. The Memory of Katrina and the Stock Market Response to Hurricane-Related News and Events; Technical Report 1417; Department of Economics, University of Sussex: Sussex, UK, 2017. [Google Scholar]
  36. Feria-Dominguez, J.M.; Paneque, P.; Gil-Hurtado, M. Risk Perceptions on Hurricanes: Evidence from the U.S. Stock Market. Int. J. Environ. Res. Public Health 2017, 14, 600. [Google Scholar] [CrossRef] [PubMed]
  37. TCFD. Recommendations of the Task Force on Climate related Financial Disclosures; Final Report; TCFD: Hong Kong, China, 2017. [Google Scholar]
  38. IPCC. Intergovernmental Panel on Climate Change; The Fifth Assessment Report (AR5); IPCC: Geneva, Switzerland, 2013. [Google Scholar]
  39. Valverde, J.; Andrews, M. Global Climate Change and Extreme Weather: An Exploration of Scientific Uncertainty and the Economics of Insurance; III Technical Report; Insurance Information Institute: New York, NY, USA, 2006. [Google Scholar]
  40. Elsner, J.B.; Kossin, J.P.; Jagger, T.H. The increasing intensity of the strongest tropical cyclones. Nature 2008, 455, 92–95. [Google Scholar] [CrossRef]
  41. Webster, P.J.; Holland, G.J.; Curry, J.A.; Chang, H.R. Changes in Tropical Cyclone Number, Duration, and Intensity in a Warming Environment. Science 2005, 309, 1844–1846. [Google Scholar] [CrossRef] [PubMed]
  42. Emanuel, K. Increasing destructiveness of tropical cyclones over the past 30 years. Nature 2005, 436, 686–688. [Google Scholar] [CrossRef]
  43. Lin, N.; Emanuel, K.; Oppenheimer, M.; Vanmarcke, E. Physically based assessment of hurricane surge threat under climate change. Nat. Clim. Chang. 2012, 2, 462–467. [Google Scholar] [CrossRef]
  44. Royer, J.F.; Chauvin, F.; Timbal, B.; Araspin, P.; Grimal, D. A Gcm Study of the Impact of Greenhouse Gas Increase on the Frequency of Occurrence of Tropical Cyclones. Clim. Chang. 1998, 38, 307–343. [Google Scholar] [CrossRef]
  45. Sugi, M.; Noda, A.; Sato, N. Influence of the global warming on tropical cyclone climatology: An experiment with the JMA global model. J. Meteor. Soc. Jpn. 2002, 80, 249–272. [Google Scholar] [CrossRef]
  46. Free, M.; Bister, M.; Emanuel, K. Potential Intensity of Tropical Cyclones: Comparison of Results from Radiosonde and Reanalysis Data. J. Clim. 2004, 17, 1722–1727. [Google Scholar] [CrossRef]
  47. Emanuel, K.A. Downscaling CMIP5 climate models shows increased tropical cyclone activity over the 21st century. Proc. Natl. Acad. Sci. USA 2013, 110, 12219–12224. [Google Scholar] [CrossRef]
  48. Landsea, C.W.; Pielke, R.A.; Mestas-Nuñez, A.M.; Knaff, J.A. Atlantic Basin Hurricanes: Indices of Climatic Changes. Clim. Chang. 1999, 42, 89–129. [Google Scholar] [CrossRef]
  49. Emanuel, K.A. The dependence of hurricane intensity on climate. Nature 1987, 326, 483–485. [Google Scholar] [CrossRef]
  50. Idso, S.; Mitchell, J. The search for CO2/trace gas greenhouse warming. Theoret. Appl. Climatol. 1989, 40, 101–102. [Google Scholar] [CrossRef]
  51. Idso, S.; Balling, R.; Cerveny, R.S. Carbon dioxide and hurricanes: Implications of Northern Hemisphere warming for Atlantic/Caribbean storms. Meteorol. Atmos. Phys. 1990, 42, 259–263. [Google Scholar] [CrossRef]
  52. Houghton, J.; Jenkis, G.; Ephraums, J. Climate Change: The IPCC Scientific Assessment; Cambridge University Press: New York, NY, USA, 1990; pp. 101–102. [Google Scholar]
  53. Knutson, T.R.; Tuleya, R.E. Impact of CO2-Induced Warming on Simulated Hurricane Intensity and Precipitation: Sensitivity to the Choice of Climate Model and Convective Parameterization. J. Clim. 2004, 17, 3477–3495. [Google Scholar] [CrossRef]
  54. Michaels, P.J.; Knappenberger, P.C.; Landsea, C. Comments on “Impacts of CO2-Induced Warming on Simulated Hurricane Intensity and Precipitation: Sensitivity to the Choice of Climate Model and Convective Scheme”. J. Clim. 2005, 18, 5179–5182. [Google Scholar] [CrossRef]
Figure 1. Response of Return on Equity to one (observed) and more Quartet-scale storm loss scenarios. The area under the un-impacted profile is proportional to the damage (the complement of the area can be construed as the “learning” information volume) and the slope of the response function as the speed of recovery of the system.
Climate 07 00055 g001
Figure 2. Response of return on equity to compound extreme event scenarios.
Climate 07 00055 g002
Figure 3. Top: Impact of selected large-loss hurricanes on return on equity for the insurance industry: 1950–2013. Bottom: The distribution of the ratio of hurricane losses to policyholder surplus (here noted as “Number of Cases”): 1950–2013 (source: Insurance Information Institute).
Climate 07 00055 g003
Figure 4. Top: P/C return on equity and the 10-year Treasury bond rate (GAAP ROEs, with the exception of the 2004/5 P/C figure, which is the return on average surplus; the 2005 value is the I.I.I. full-year estimate. Bottom: P/C return on equity and yearly premium growth rates; source: Economic Report of the President.
Climate 07 00055 g004
Figure 5. Data and Model predictions. The odds ratio is the ratio of the odds of a ROE change (at least 10 % of change) in the year following a year with at least one hurricane to the odds of a ROE change in the year following a year without a hurricane.
Climate 07 00055 g005
Figure 6. First and second order sensitivity index ( S i and S i j ) for the ROE model. The number ( H t ) and mean intensity ( Z t ) of hurricanes are second-order factors in predicting ROE, thus they can be neglected by the model.
Climate 07 00055 g006
Table 1. Various specifications of the P/C return on equity model. Each column represents a different model specification. ”–” means that the variable was not included into the model. The standard error of the estimate (SEE), the value of the Durbin h-statistic (h), and the estimate of the first-order serial correlation coefficient for the Ordinary Least Squares (OLS) error ( ρ ) for various models are reported at the bottom.
Model
Variable1234
Constant4.117.03.995.83
(1.73)(2.41)(2.04)(2.37)
H t 0.830.620.40
(1.10)(1.15)(1.26)
Z t −0.27−0.18−0.09
(−1.32)(−1.44)(0.03)
r t 10 0.320.370.330.21
(1.37)(1.42)(1.30)(0.88)
r t 1 0.310.270.28
(3.10)(3.05)(2.90)
D t −7.64−7.85−6.44−9.11
(−0.277)(−3.20)(−3.11)(−3.26)
P r e m G r o w t 0.210.150.270.26
(2.99)(2.14)(2.87)(3.14)
SEE2.0002.4461.9231.871
DW1.589
Durbin h7.1106.4018.114
ρ 0.0330.2940.317
Time Period1954–20131954–20131954–20131954–2013
Table 2. Correlation matrix for econometric analysis.
r t 1 i r t 10 D 9 / 11 t PremGrow t
r t 1 i 1---
r t 10 0.7181--
D 9 / 11 t −0.037−0.0431
P r e m G r o w t 0.0660.3940.0291
Table 3. Top ten insured losses in current dollars and as a fraction of policyholders surplus (source: ISO; I.I.I.). Losses and total surplus are in billions of current dollars. WTC is the World Trade Center attack, here considered as a stressor equivalent to hurricanes.
HurricaneYearLosses ($)Total Surplus ($)Ratio
Katrina200538.10427.208.91%
Andrew199220.88200.5410.41%
Charley20047.47402.261.85%
Ivan20047.11402.261.76%
Hugo19896.39166.443.83 %
Wilma20056.10427.201.42%
Rita20054.70427.201.10%
Frances20044.59402.261.14%
Jeanne20043.65402.260.91%
Georges19983.36423.400.83%
WTC200118.80374.365.02%
Sandy201268.00583.5011.60%

