How to Design a Park and Its Surrounding Urban Morphology to Optimize the Spreading of Cool Air?


1
CNRS, Lab-STICC Laboratory UMR 6285, 56000 Vannes, France
2
CNRS, Institut de Recherche en Sciences et Techniques de la Ville, FR 2488, École Centrale de Nantes, 44000 Nantes, France
3
Cerema Ouest, 44000 Nantes, France
4
UMR CNRS AAU CRENAU, Ecole Nationale Supérieure d’Architecture de Nantes, 44000 Nantes, France
*
Author to whom correspondence should be addressed.
†
These authors have all contributed equally to this work.
Climate 2018, 6(1), 10; https://doi.org/10.3390/cli6010010
Submission received: 30 December 2017
/
Revised: 25 January 2018
/
Accepted: 30 January 2018
/
Published: 6 February 2018
(This article belongs to the Special Issue Urban Overheating - Progress on Mitigation Science and Engineering Applications)
Abstract
:Green areas induce smaller increases in the air temperature than built-up areas. They can offer a solution to mitigating the urban heat island impacts during heat waves, since the cool air generated by a park is diffused into its immediate surroundings through forced or natural convection. The purpose of this study is to characterize the effect of several variables (park size, morphology of surrounding urban area, and wind speed) on the spreading of cool air. A parametric study is performed to run computational fluid dynamics simulations. The air temperature entering the computational domain was set at 35 °C, and the 2-m high surface included within the 34 °C isotherm was defined as an indicator of cool air spreading. The effects of park shape and orientation were negligible in comparison with size effects. The number of buildings was better correlated with the cooled surface area than the typical urban parameters identified in the literature (i.e., building density, aspect ratio, or mean building height). Since the number of buildings is obviously related to the number of streets, this result suggests that the greater the number of streets around a park, the wider the area that cool air spreads.
1. Introduction
According to the Intergovernmental Panel on Climate Change (IPCC) reports, heat wave intensity and frequency should increase in the coming decades [1], which may lead to situations of outdoor and indoor discomfort as well as major health impacts. During the summer of 2003, European countries recorded 70,000 excess deaths, attributing them to an unusually hot summer [2].
Urban areas are especially vulnerable when facing such problems, for two reasons. First, heat waves are exacerbated in cities when compared to their surroundings due to the urban heat island (UHI) phenomenon [3]. Second, urban areas concentrate most of the human population (i.e., 70% in European Union countries [4]).
In order to cool cities, several solutions have been investigated: evaporative techniques (fountains, water ponds, street watering), green techniques (grass, trees, green facades or green roofs, etc.), and material techniques (reflective, water retentive, etc.). All of these techniques have shown cooling potential, but further research is still needed to improve their performance [5]. This article focuses on the use of parks as cooling solutions.
Several studies have shown that parks may create cool air during the day [6], but also at night [7]. Moreover, this cool air may be transported to the neighborhoods surrounding parks [8,9]. The ability of a park to cool the air and spread this cooler air to its vicinity depends mainly on three factors: park characteristics, wind speed conditions, and urban morphology of the peripheral areas. The characteristics of a park (tree species and density, presence of water ponds, soil types, etc.) are key parameters in explaining its cooling potential [9]. The cool air produced within the park is transported into the surrounding areas by diffusion, advection, and convection. For the sake of simplification, the term “spreading” will be used in the following sections. The spreading of cool air varies in intensity depending on both wind conditions and the urban layout of the park surroundings. This article focuses solely on the aspect of cool air spreading (i.e., on the effect of wind speed and urban layout on the level of spreading).
In 1991, Jauregui [7] established that park cooling may be measured up to one park’s width away from its boundaries, which is consistent with several other studies [9,10,11,12]. However, the methodology used to assess this distance was not clearly stated, which makes the results difficult to replicate. To explain the relationship between air temperature drop and distance from the park, Shashua-Bar and Hoffman [12], Doick et al. [13] proposed an asymptotic nonlinear model, which was then used to define the Park Cool Island Distance (PCD) as the “distance [from the park] where 10% of the UHI is still present” [13]. Despite its interest, this method has been applied based on air temperature observations for a single park, hence the model is only valid for this specific park and cannot be used to draw general conclusions. We have previously seen that the production of cool air depends on park characteristics, whereas its spreading depends on both wind conditions and the layout of the urban surroundings.
The spreading of cool air is affected by wind speed value [14]. Under light winds, the temperature difference observed between the park and the streets is responsible for the advection phenomenon [15,16]. In the presence of high wind speeds, this phenomenon becomes negligible. Skoulika et al. [17] showed that for a wind speed above 5.5 m/s, the PCD decreases linearly as wind speed value increases, whereas Doick et al. [13], Upmanis et al. [15], Oke et al. [18] considered the PCD to be negligible whenever wind speed exceeds 2.3 m/s, 5 m/s, and 6 m/s, respectively. According to Doick et al. [13], this wind speed threshold is likely a function of street geometry, but they did not study this point in further detail.
Chandler [14] demonstrated that some urban structural parameters characterizing the surroundings of a park play a key role in the spreading of cool air. Chang and Li [8] analyzed the air temperature gradient around 60 parks relative to the urban canyon dimensions. Their results agreed with the previous literature regarding the average cooling distance from the park (i.e., approx. one park width). However, they were unable to establish any relationship between cool air spreading and the aspect ratio or building density. This shortcoming might be explained by the use of experimental data, which makes it difficult to differentiate the influence of street dimensions on both radiation trapping and the reduction of cool air flow originating from the park. Moreover, the performance of the shelter protecting the air temperature sensor from the sun was very sensitive to solar radiation conditions [19,20]. A temperature measurement conducted with a shelter located on a street exposed to direct solar radiation may be overestimated, thus complicating comparisons with a measurement performed on a shaded street.
The objective of this article is to better understand the phenomenon of cool air drainage from a park to its surroundings, particularly the effects of wind conditions and street dimensions on the spreading of air. Simulation rather than observation is used in order to better control the key variables, such as wind speed, urban layout, and both park and urban thermal characteristics. Simulation is also appropriate to facilitate the obtainment of a temperature field, thus avoiding having to deploy a large number of sensors, which could lead to numerous observation issues [21].
2. Methodology
2.1. Definition of Urban Form Parameters
A numerical approach is used herein to establish relationships between cool air spreading and both wind speed and urban form parameters. The urban form parameters are selected from a literature review, namely: building height, building density, and aspect ratio [8,13,22]. For the purposes of this analysis, a square park has been designed, and the street width (W), building footprint area (), and reference area () are all shown in Figure 1.
The aspect ratio () and building density () are calculated by means of Equations (1) and (2):
where H is the building height
Since this investigation concerns the effect of the urban form on air spreading, the scenario used as a reference is represented by a park on its own (the reference area contains a park but no building, and consists of the entire square surface area).
2.2. Model and Implementation
The park is assumed to produce cool air that will then be spread over the urban area. Depending on the morphology of the urban area, radiation trapping may vary in intensity and thus interfere with the cool air originating from the park. To focus solely on air spreading and simplify the simulation analysis, we assume herein that the urban surfaces do not exchange any energy with the air, whereas the park surface cools the air at a constant energy rate of 300 W/m. This initial assumption is a major one: during a summer, Rodriguez [23] measured in Nantes (city in western France) both the latent and sensible heat fluxes according to an eddy-covariance method. At noon, they observed an average sensible heat flux value of 250 W/m for a highly urban neighborhood (i.e., vegetation density less than 10% in a 200-m buffer circle around the station) versus just 100 W/m for a more highly vegetated area (76% vegetation). The second assumption is much closer to reality, at least for cities located in the Cfb (temperate without dry season warm summer) or Dfb (cold without dry season warm summer) climate zones [24]. The cooling flux of 300 W/m corresponds to the maximum latent heat flux measured around noon in the urban forested park of Chicago [25], and is consistent with observations recorded in the City of Nantes in a fairly green urban neighborhood (measurement performed using the eddy-covariance method with a vegetation density in the 200-m buffer circle around the station of 76%) [23]. The results of our study may not be replicable for any park type (differences in the proportion of grass, tree, concrete, etc.) or climate zone (differences in the amount of solar radiation, air humidity, air temperature, etc.), since the cooling intensity may be affected [5]. Several other latent heat flux values (100 and 200 W/m) have been tested, but the natural convection effect was harder to observe. We thus decided to apply the method for the most sensible case (300 W/m). The air temperature was also set very high (35 °C) to reflect the peak temperature that Europe has had to face during its most recent heat waves.
To assess the spreading phenomenon of the cooled air generated by a park, the computational fluid dynamics (CFD) tool Code_Saturne was used in the environment of SOLENE-microclimat (Morille et al. [26], Musy et al. [27])—a numerical tool dedicated to urban climate modeling. Thanks to Code_Saturne, the airflow was computed by resolving Navier–Stokes equations (momentum, mass continuity, energy, species transport) using a turbulence model. The tool configuration was similar to that described in Malys [28], except that the buoyancy forces were modeled in order to obtain realistic airflow when natural convection is predominant (i.e., under low wind speed and high temperature differences). These forces were modeled using the Boussinesq approximation, which considers air density to be a function of air temperature.
where
- is the reference air temperature (=300 K)
- T the air temperature
- the air density at temperature (=1.18 kg·m)
- the air density
- the coefficient of thermal expansion (=)
The computational domain represents a 100-ha square area discretized using 270,000 tetrahedral meshes (Figure 2). The mesh size varied within the domain. The minimum size of 1.5 m for the tetrahedron side was set in the region of interest (the park and its close surroundings under 2 m high). The mesh size then increased linearly up to the limits of the domain (10 m at surface level, and 50 m at the top of the domain).
A sensitivity analysis was performed in order to evaluate the effect of mesh size on air temperature and wind speed values calculated at a height of 2 m. Several meshing scenarios with different mesh sizes were tested. For each case, air temperature and wind speed were calculated according to the following procedure:
- An interpolation is performed to calculate the air temperature of the vertex from the air temperature in the tetrahedron
- A 2-m-high horizontal plane on the ground is generated and intersects the tetrahedron vertex
- The air temperature at these points is the result of a linear interpolation between the segment ends.
Results of this analysis revealed that between the chosen scenario (270,000 tetrahedrons) and the most accurate one (507,000 tetrahedrons), the temperature error never exceeded 0.5 °C inside the park and 0.02 °C outside the park.
For each time step, the calculation stopped under a convergence criterion that needed to be set. This threshold was chosen based on several simulations, where both park size and wind speed varied, but not wind direction. For each simulation, 2000 iterations were performed, and the temperature convergence parameter always stabilized above . This threshold was thus chosen as the convergence criterion.
2.3. Indicators of Air Spreading Efficiency
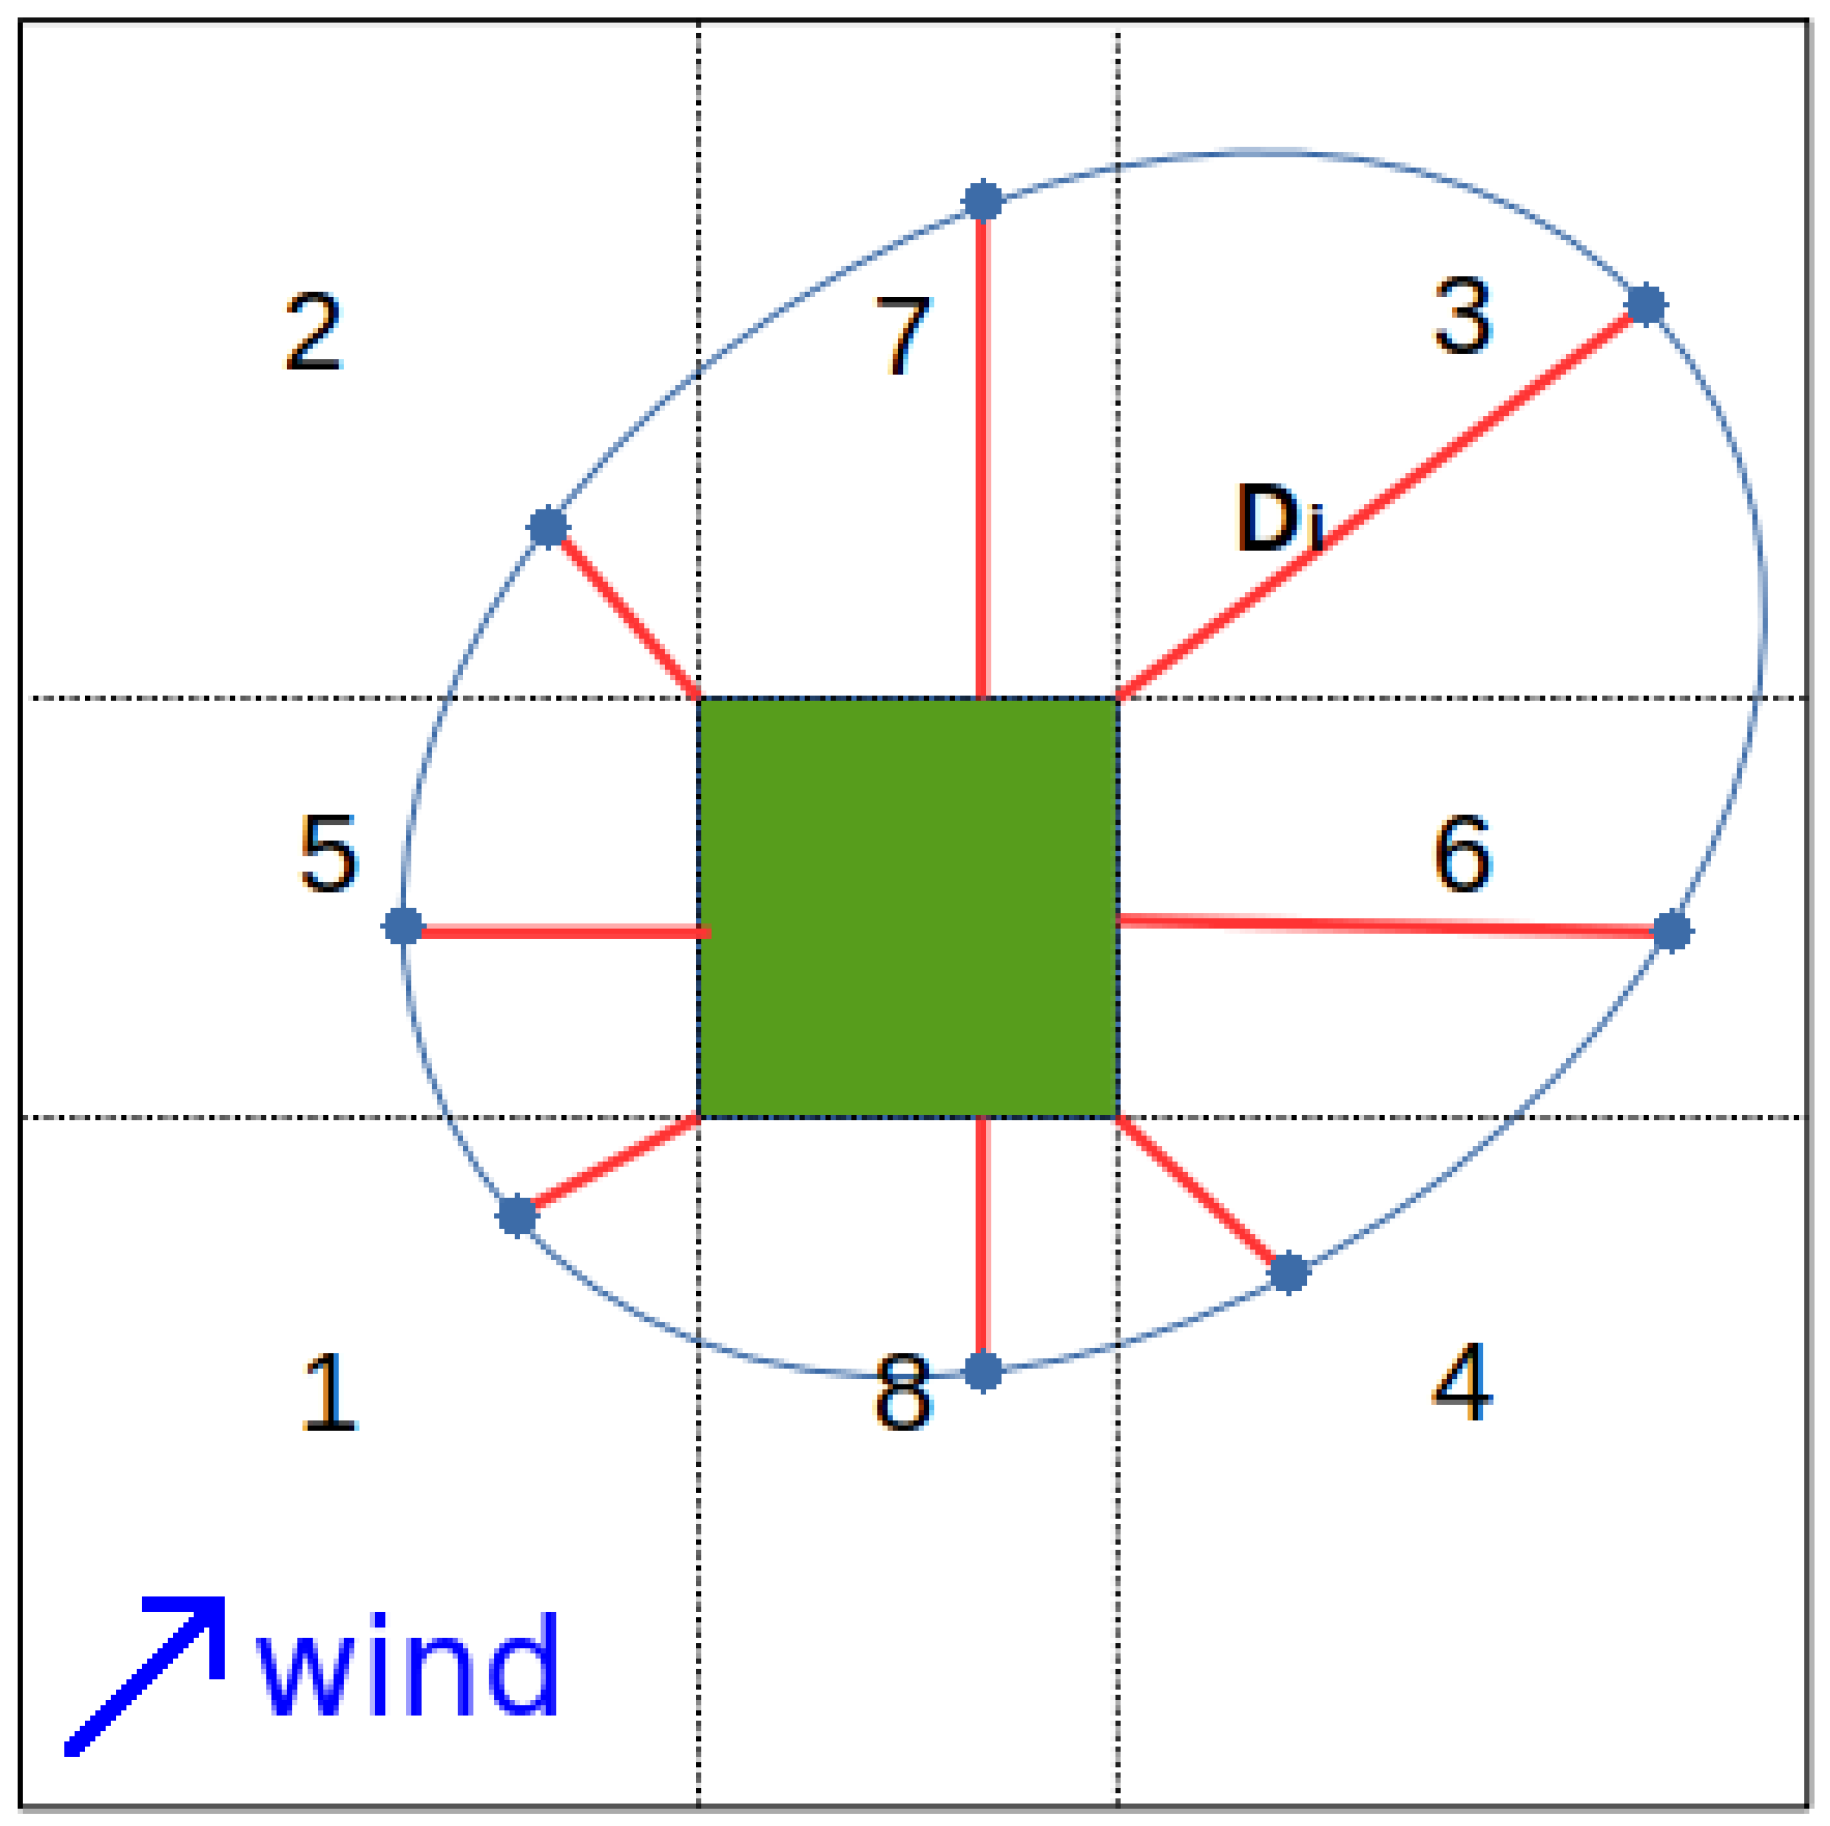
To evaluate how spreading efficiency varies according to wind speed and urban form, performance indicators prove to be necessary. Several studies employed the concept of PCD, which is defined as the distance where the cooling induced by the park is still noticeable. In this study, the cooling effect of a park was considered to end where the 2-m-high temperature drops below 1 °C from the initial temperature. The PCD was then defined as the mean distance between the park boundary and the 34 °C isoline at a height of 2 m above ground. The distance between each point of the isoline and the park was calculated differently depending on the specific location (Figure 3). Concerning zones 1, 2, 3, and 4, it was defined as the distance between the point and the closest corner of the park. As for zones 5, 6, 7, and 8, it was defined as the minimum distance between the point and a side of the park.
However, the PCD is a 1-dimensional indicator: in the case of a long but narrow isotherm shape, the average distance of the 34 °C isotherm can be high, whereas the surface benefiting from the cooled air may be small. The surface of the area included in the 34 °C isoline is then also calculated in order to overcome the shortcomings of the PCD. However, these results show that both indicators exhibit similar behavior for all of the following analyses. For the sake of simplification, only the results obtained with the cooled surface area will be presented and analyzed.
2.4. Parametric Study
The cooling surface is impacted by several kinds of parameters. Three of them will be investigated herein: park size (with the shape remaining square), the urban form of its surrounding areas, and wind conditions.
The park width was set at 50, 100, and 200 m. One simulation was run for each park width without any adjacent buildings.
Several urban form (UF) scenarios were adopted to investigate the effect of urban parameters on the spreading of cool air. Each scenario was established to define a building height, building size, and street width in order to obtain a building density and aspect ratio values (Table 1). Values were chosen so as to highlight the separate effect of , , and H on the cool air spreading, but also to optimize the number of simulations to be carried out. Seven urban forms are proposed (Table 2). First, the building density influence was investigated by changing either the building size (UF 1 to 3—method 1) or the street width (UF 2 to 4—method 2). Three density levels were obtained and defined as low, medium, and high. Next, the aspect ratio influence was investigated by adopting either a low density (UF 1 and 4) or high density (UF 3 and 5). Lastly, the height was varied while the building density remained constant at a low value (UF 1 and 6) or high value (UF 3 and 7). For each scenario, the resulting number of buildings is also given in the Table.
The influence of wind speed was investigated for each of these scenarios: values were selected every 0.5 m/s, from 0.5 m/s to 5 m/s. The scenario combinations derived from urban form and wind speed led to a total of 70 simulations. For all simulations, wind crossed the park along its diagonal (Figure 3). The effect of wind direction and park shape have been investigated, but only the conclusions will be briefly presented in the following section.
3. Results
3.1. Influence of Park Size
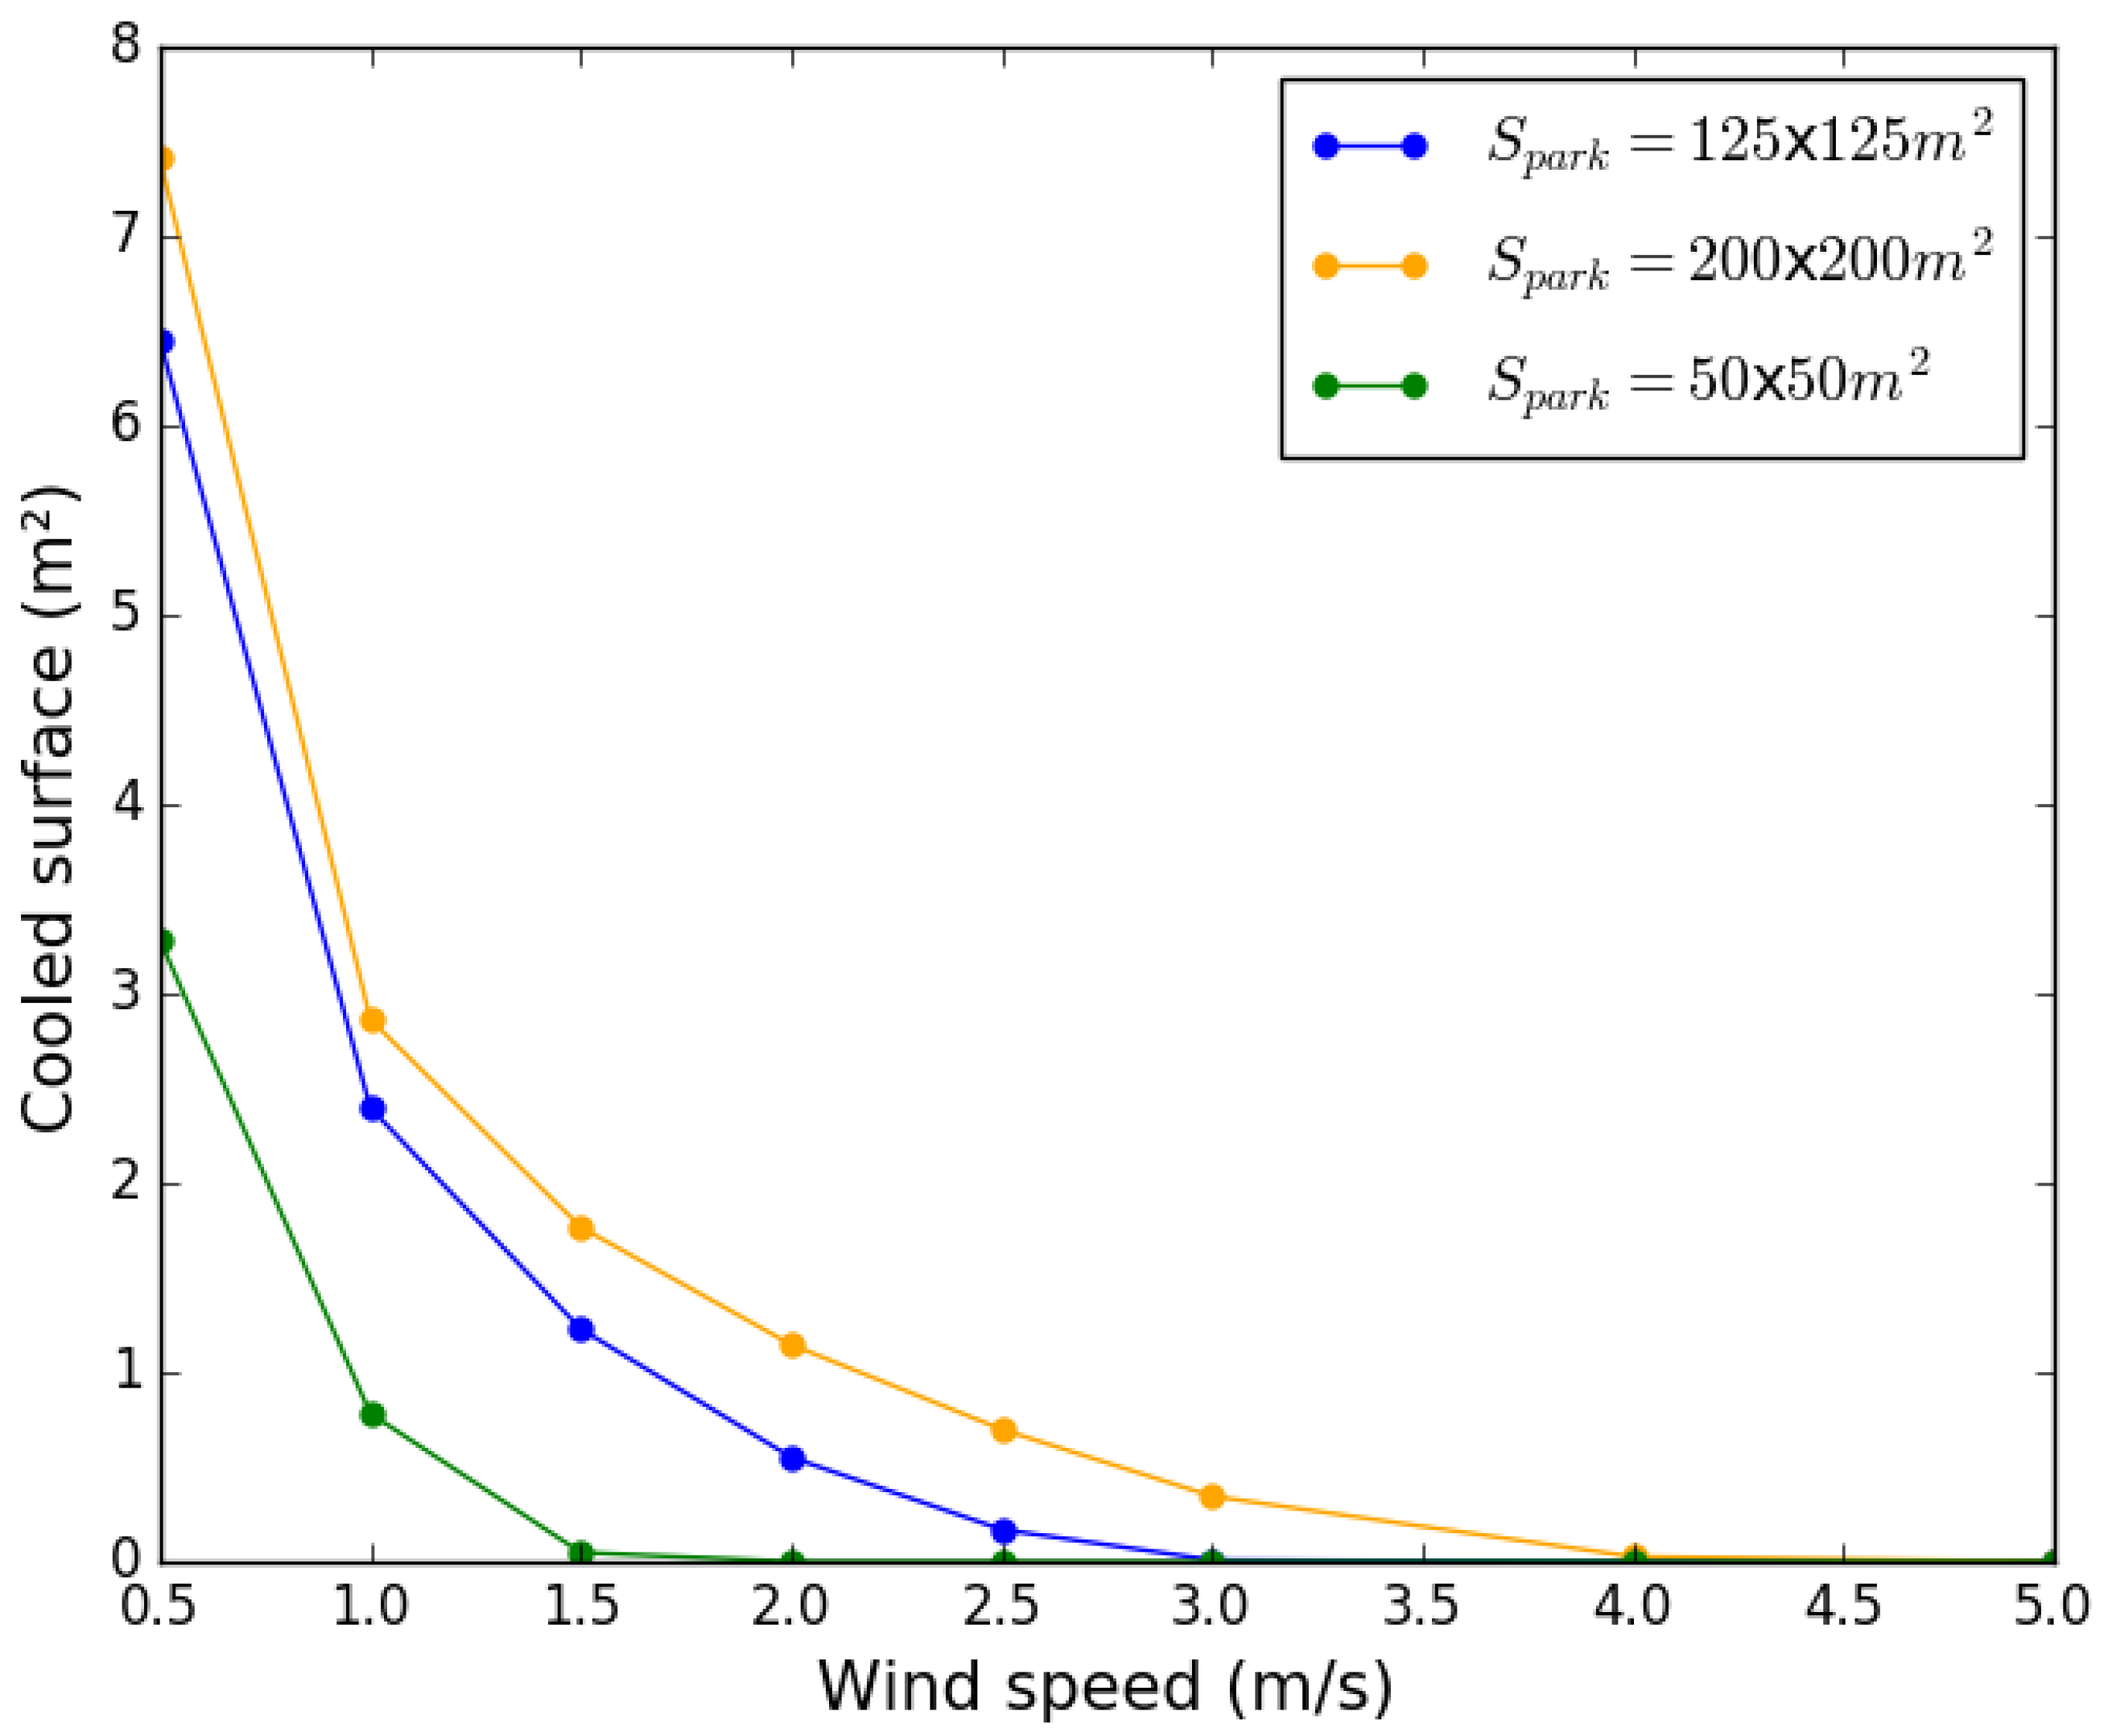
For each park size (50, 125, and 200 m wide), the variation in the cooled surface area (i.e., where temperature is lower than 34 °C) was evaluated for various wind speeds. It is obvious that a larger park will cool a larger area. The cooled surface was then divided by the park area in order to obtain a cooling efficiency (Ce) indicator. This value may be interpreted as an equivalent surface cooled by each square meter of park.
The simulations show that Ce increased with park size or as wind speed decreased (Figure 4).
The first observation implies that one square meter of a large park is more efficient than one square meter of a small park. The second observation may be attributed to the assumption made for the simulation: the cooling rate of the air located in the park is constant regardless of its air temperature or wind speed. One result of this assumption is that the longer the air stays in the park, the cooler it leaves the park. Thus, when wind speed was very low (0.5 m/s), the air temperature difference between the park and its surroundings was high (8 C). In this case, the air temperature of 34 °C was easily reached, and natural convection dominated: the cool air flow was emitted in all directions, including the opposite direction of the incoming wind, and the 34 C isotherm was quite large (Figure 5a). For higher wind speeds (2 m/s), the air temperature difference between the park and its surroundings was lower (2 C), in which case the air temperature barely reached 34 C and spreading was mainly driven by the wind. As a result, the flow was channeled in a single direction and the 34 °C isotherm was small (Figure 5b). Overall, upon analysis of the temperature distribution around a park, we can conclude that the lower the wind speed, the further the spreading of cooled air in the direction opposite the incoming air flow.
The shape and orientation of the park (with respect to wind speed) have been investigated. For a given surface area, they both exerted a very limited influence compared to park size (which is why the results are not shown in this study).
Overall, two main observations can be drawn:
- The larger the park, the greater the cooling intensity;
- The higher the wind speed, the smaller the cooled surface area.
In conclusion, the longer the air stays in the park, the cooler it is and the larger the size of the 34 °C isotherm.
3.2. Influence of the Neighboring District
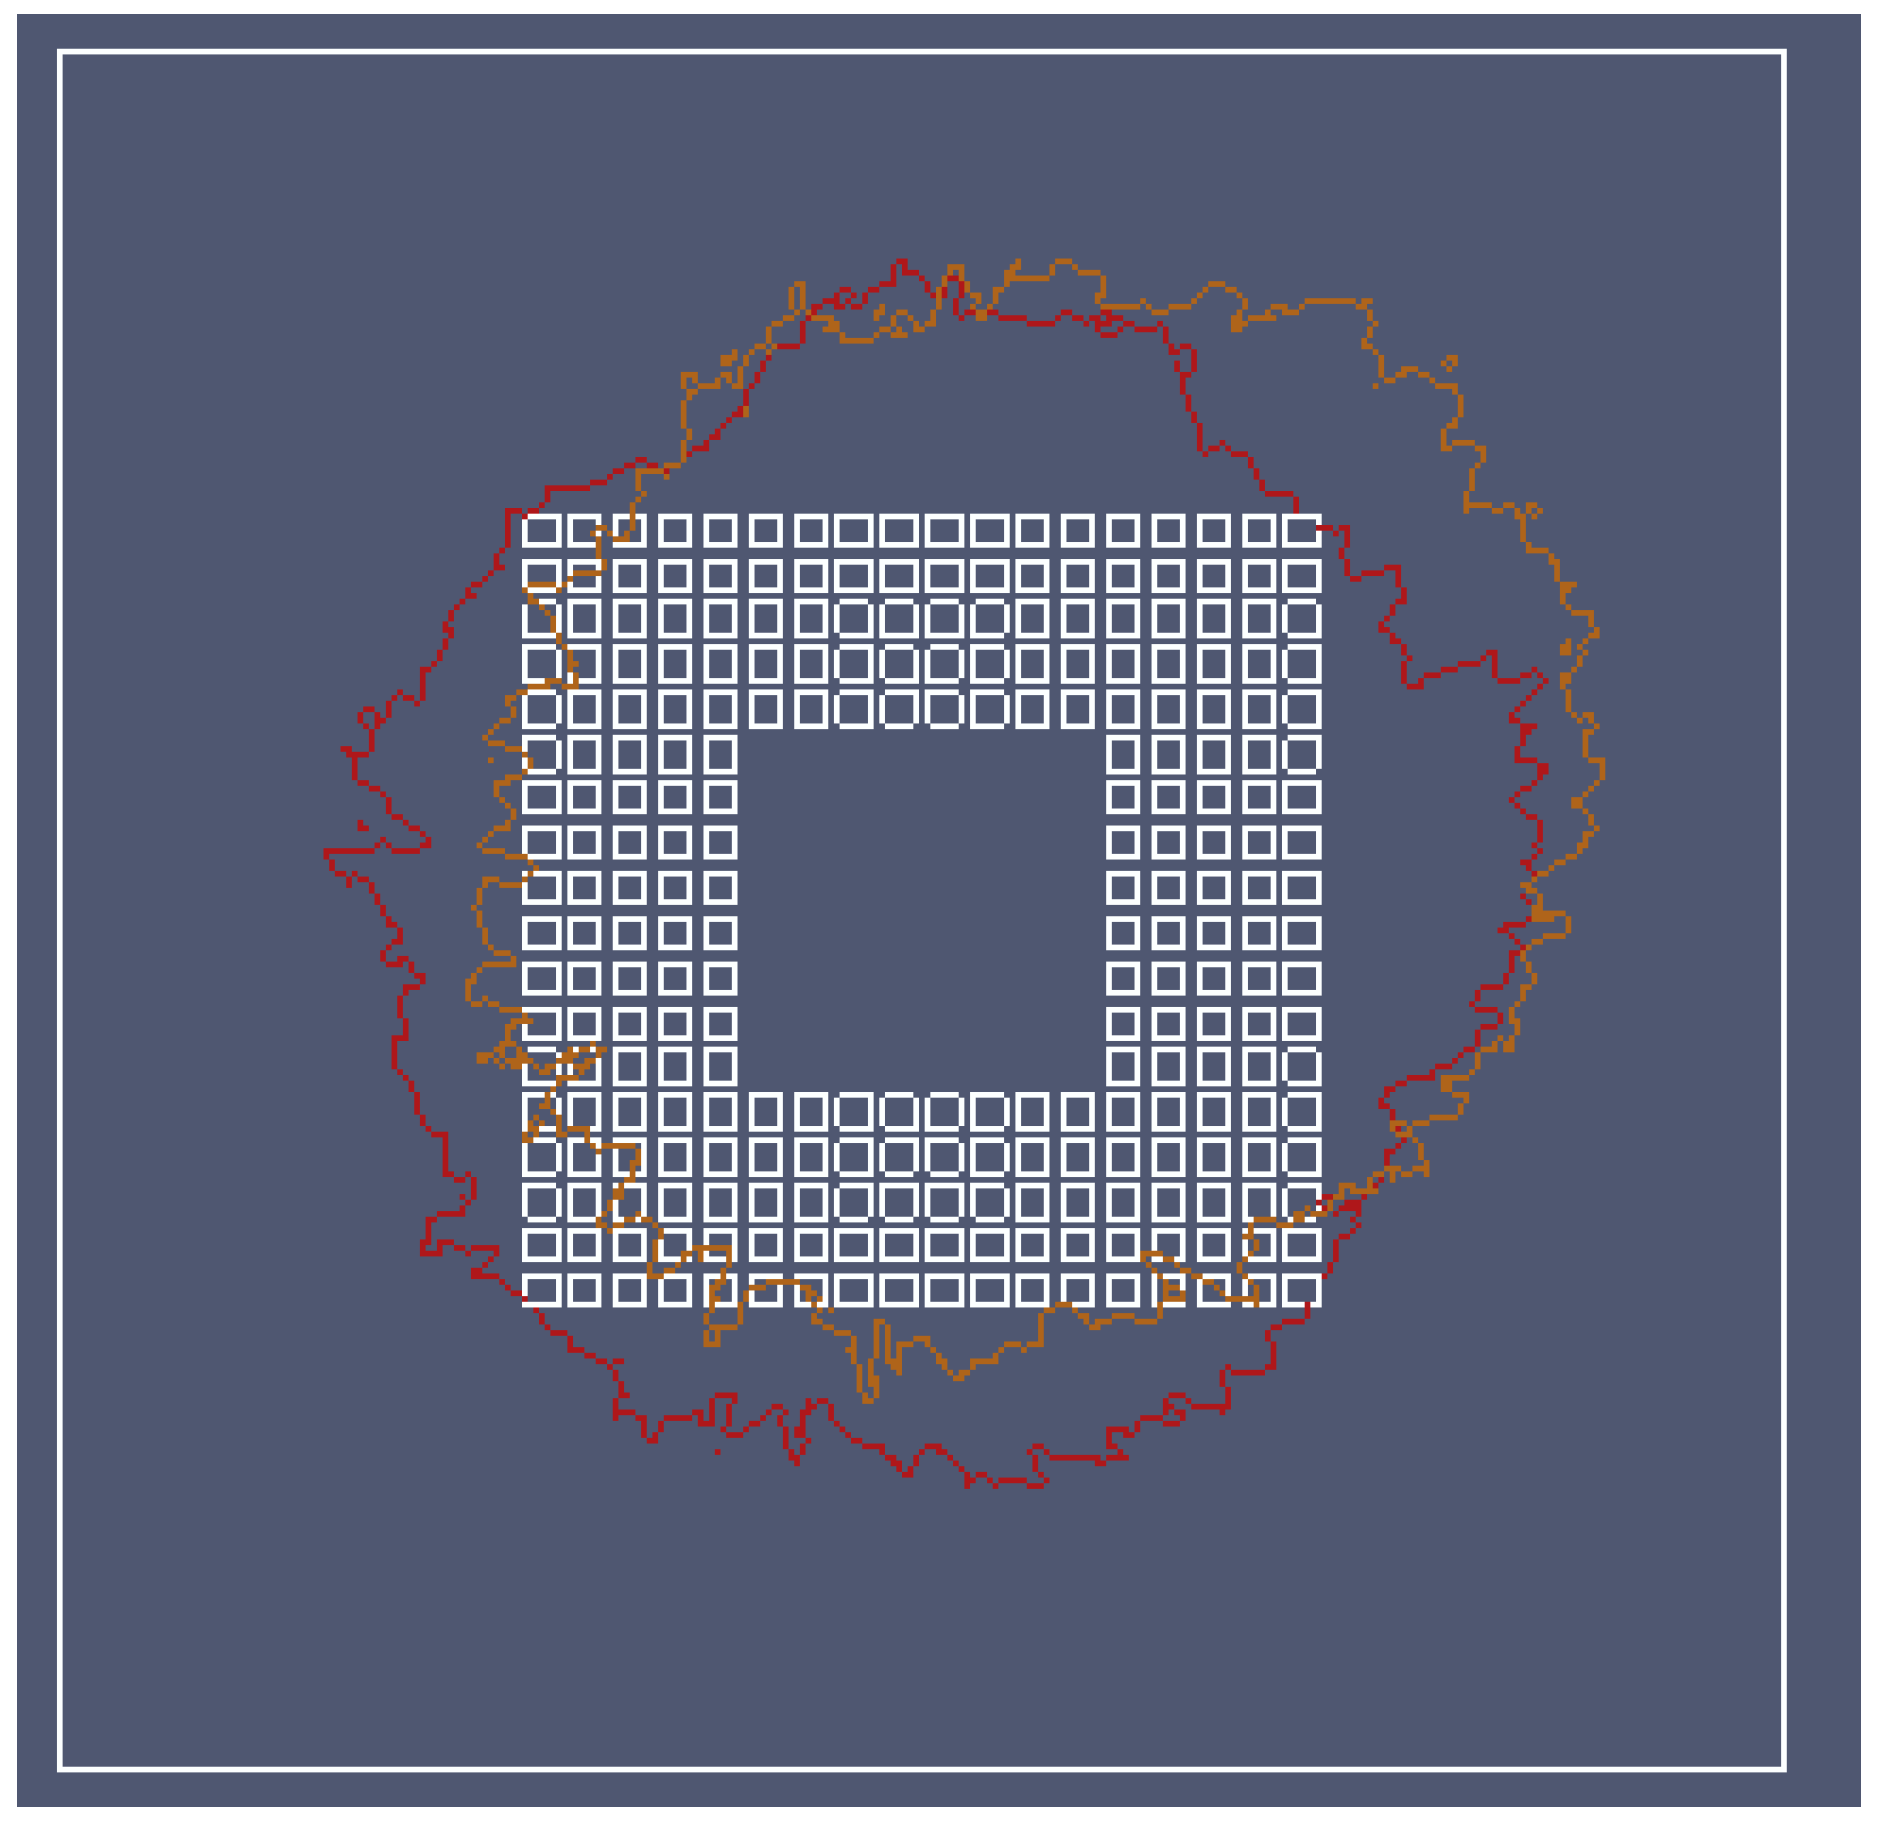
Adding buildings around the park has a direct impact on the cooled surface shape. To investigate the influence of the neighboring district on cool air spreading, the larger park was used (200 m wide). The surface generated by the 34 °C isotherm had nearly the same size for both the reference urban form (without any buildings) and UF 1 (with buildings). However, the former was located further downstream than the latter (Figure 6). The buildings can be seen as contributing to slowing the wind speed. In agreement with the previous analysis, this finding leads to increasing the natural convection influence, diffusing the air further toward the incoming airflow direction.
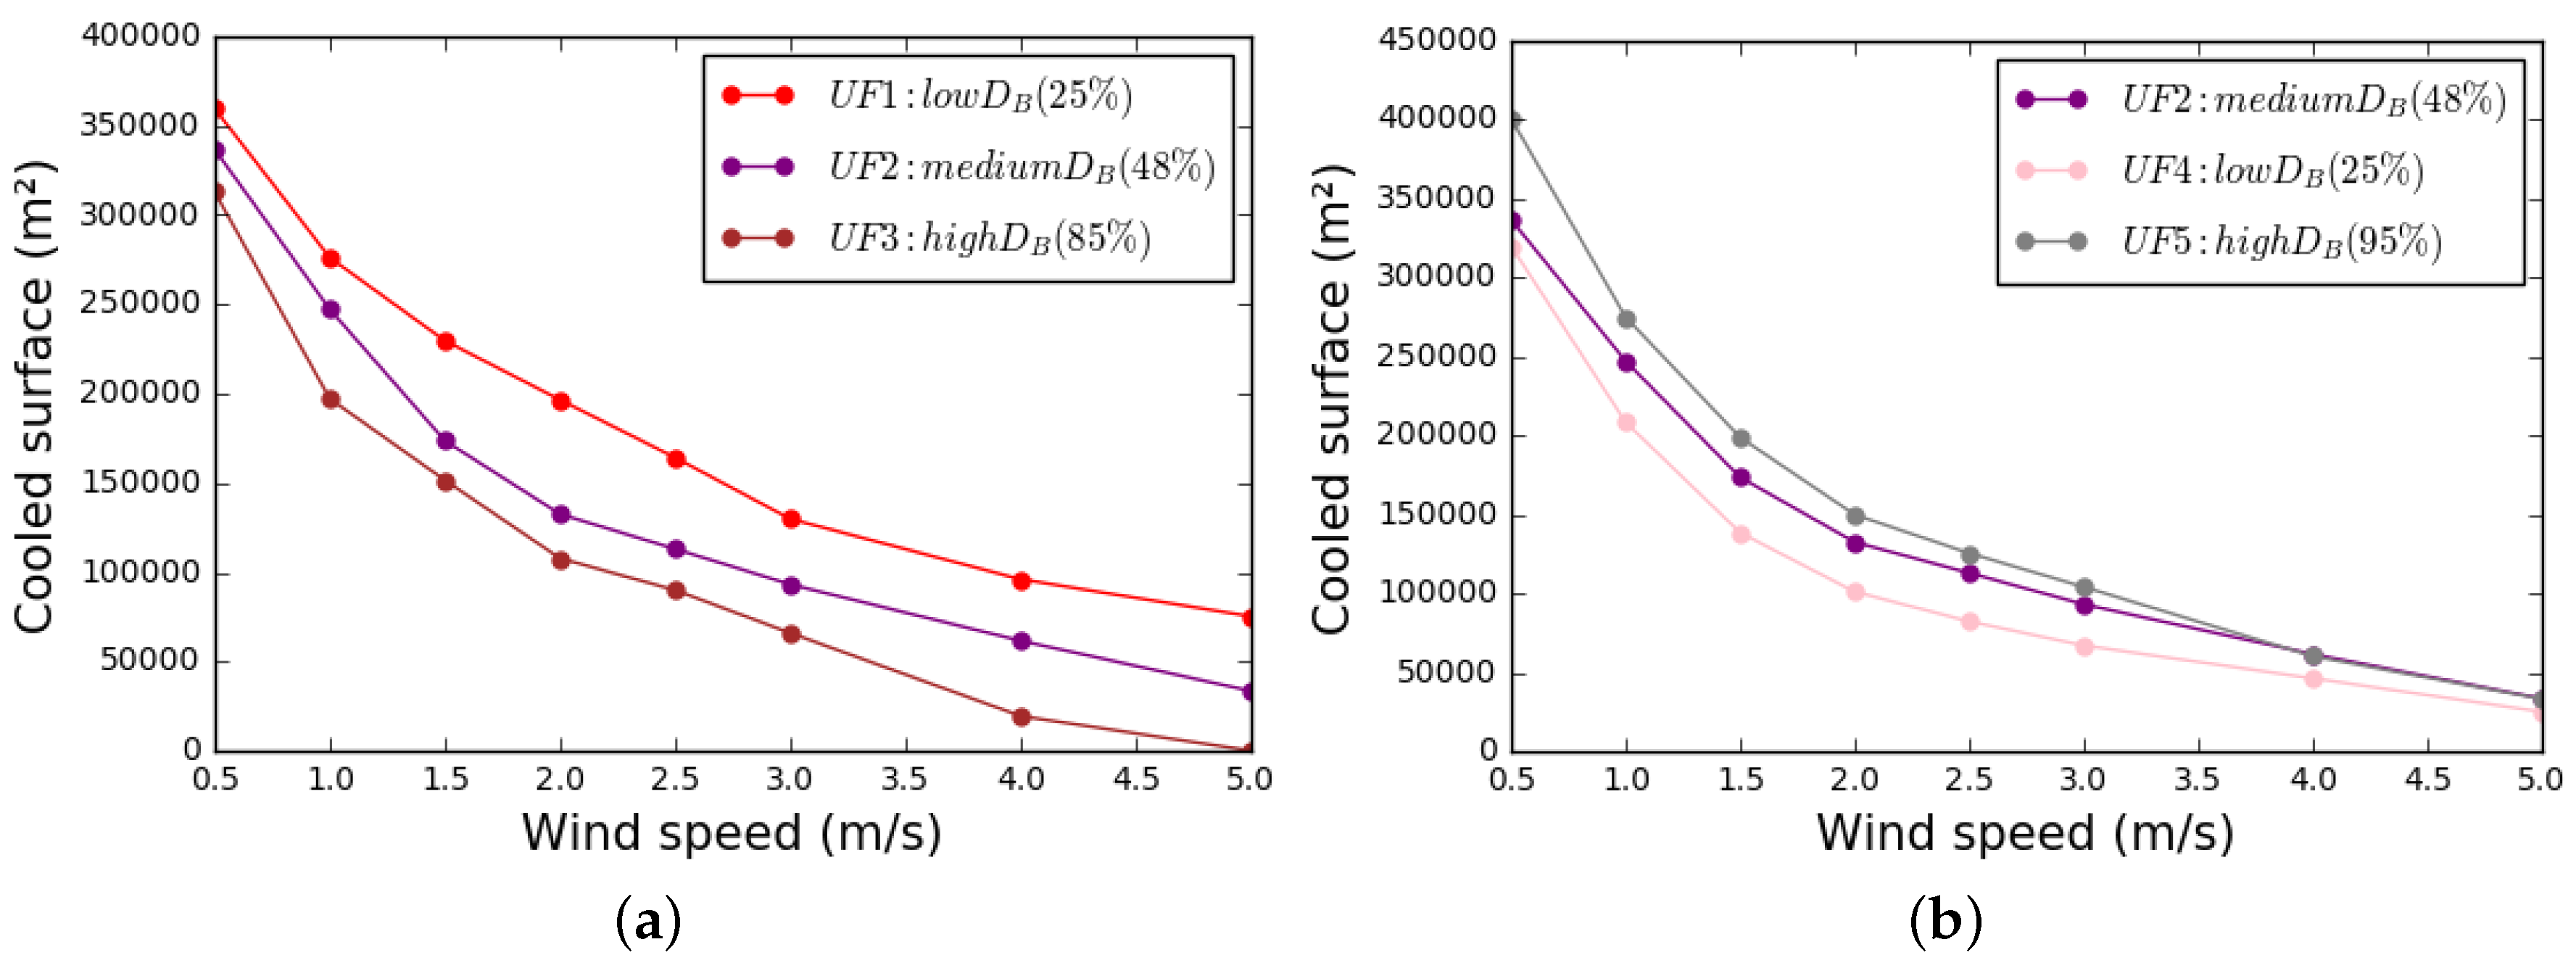
The influence of the urban form of the district surrounding the park is now investigated. Three parameters were considered: building density, aspect ratio, and building height. As described in the Methodology section, the building density was increased using two distinct methods (either the building size was modified—method 1—or the street width was modified—method 2). These two methods are considered separately and results are shown on separate plots. As previously observed, the cooled surface decreased as wind speed increased under all scenarios (Figure 7). For a given wind speed, when building density was increased by increasing the building size, the cooled surface area decreased (Figure 7a). In contrast, when building density was increased by increasing street width, the cooled surface area expanded (Figure 7b).
Building density cannot therefore be used as the lone parameter explaining the influence of the built environment on the cooled surface of a park.
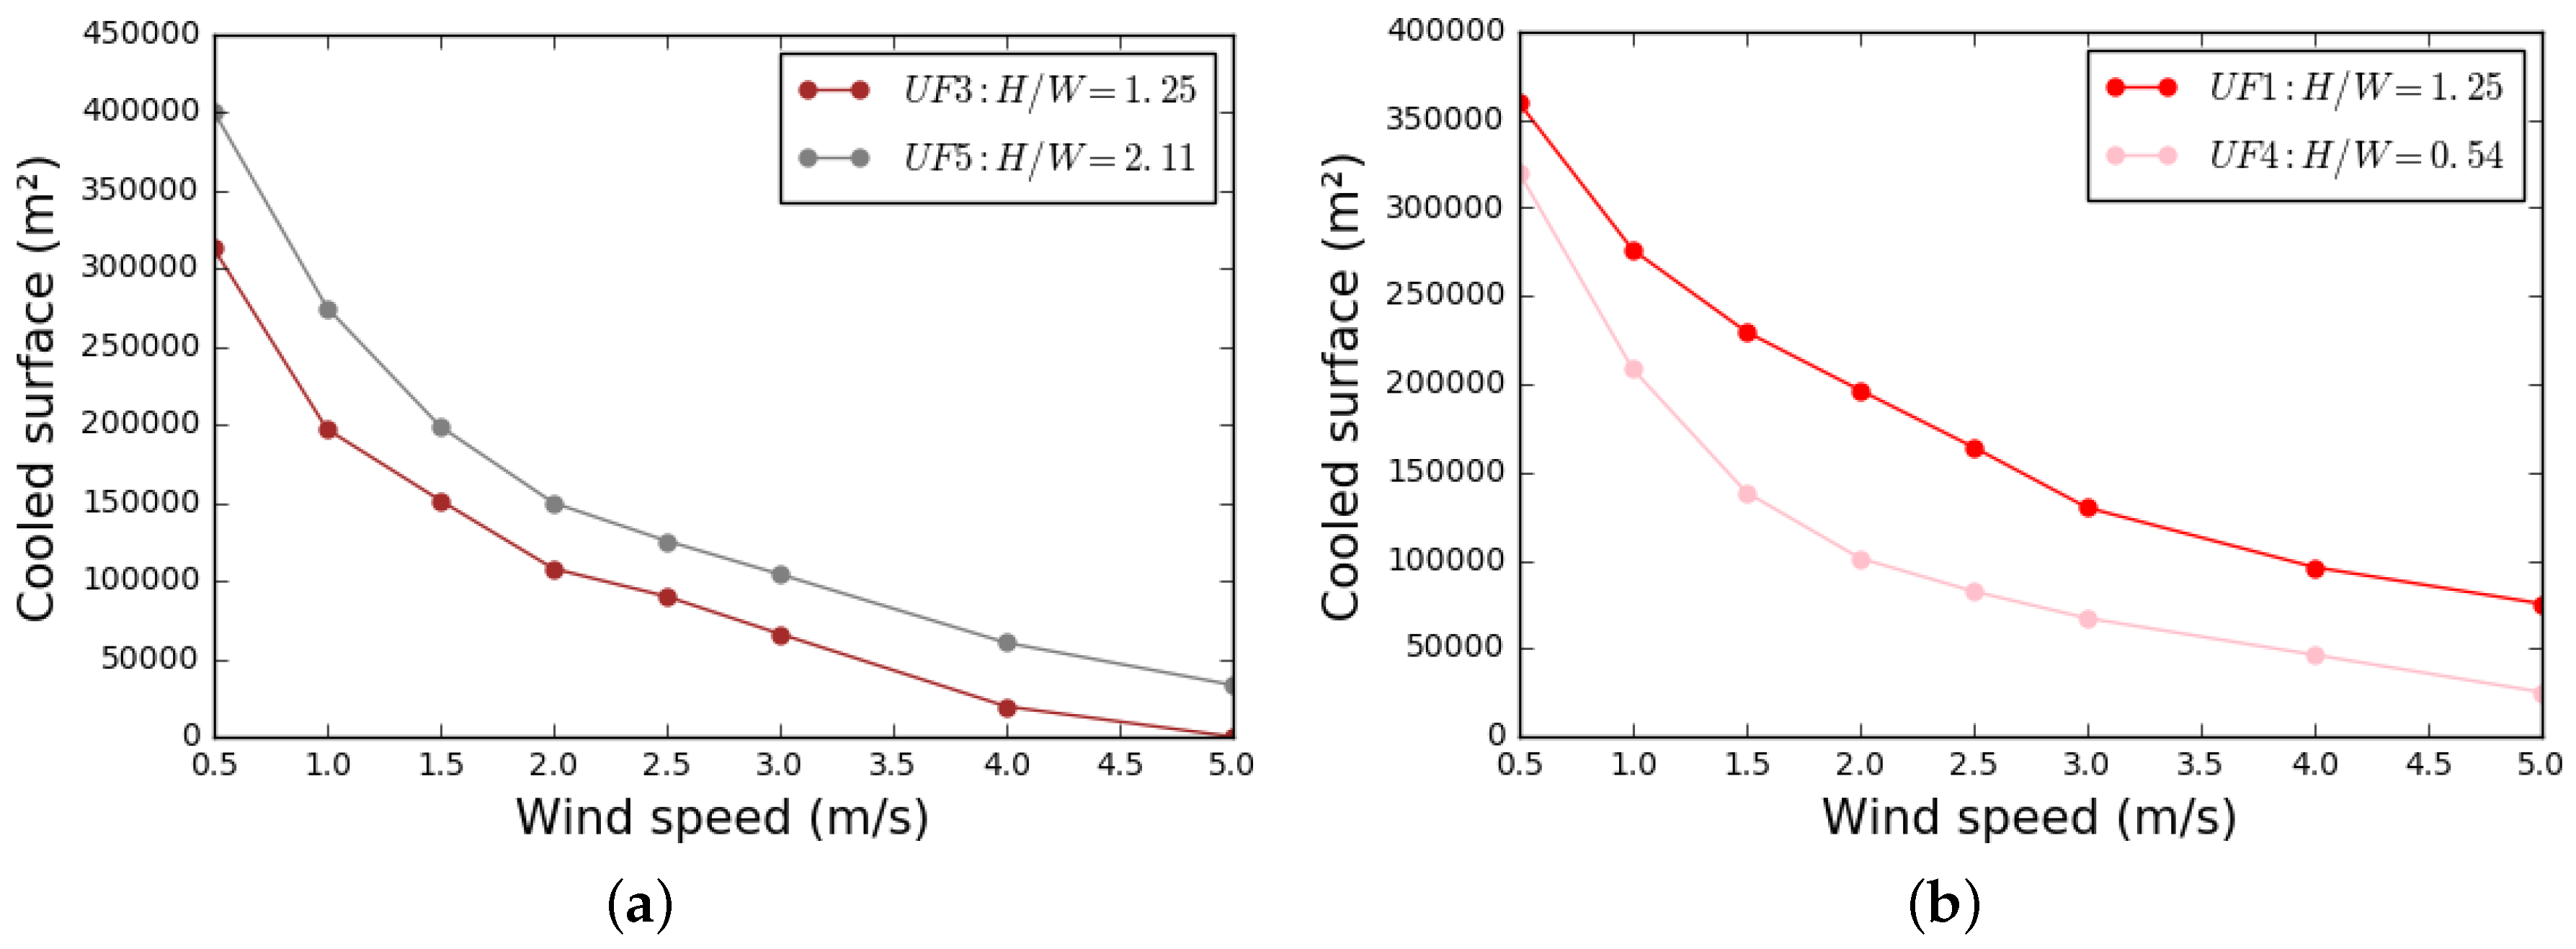
The effect of the aspect ratio on the cooled surface was tested by decreasing the street width. In this manner, the aspect ratio was increased, thus keeping building density and building height constant. For a given wind speed, the size of the cooled surface increased as the aspect ratio increased (also true for a given building density, regardless of its value (Figure 8).
Thirdly, the building height was increased for a given building density with an increasing aspect ratio. For high building density (Figure 9a) at a given wind speed, the cooled surface area was similar when the building height increased from 10 m to 17 m. For the low building density case (Figure 9b), it increased as the building height rose from 4 m to 10 m. According to an initial analysis, we could assume that building height—like building density—is not a key parameter in explaining the cooled surface, while the aspect ratio was a key parameter. It is also possible that the effect of building height only appears at a certain threshold value. This assumption will be further analyzed in the following section.
The three urban form parameters (building density, aspect ratio, and height) investigated herein do not impact the air spreading pattern in a way that could have been expected:
- For a given building height and aspect ratio, the building density increase enhances or reduces the spreading of cooled air, depending on how the density is modified. Density does not seem to be a key parameter affecting air spreading.
- For a given building height and building density, the aspect ratio appears to enhance the cooling process, whereas it is not often identified in the literature as a key parameter.
- Higher buildings may increase air spreading under a certain threshold value, which has not yet been identified (note that this threshold may be dependent on wind speed conditions).
4. Discussion
The results presented above lead to a more detailed investigation of the simulation results and then a discussion of these results. This discussion section will focus on two points:
- An understanding of the influence of building height on air spreading based on the configuration
- The identification of other parameters that could be relevant for the air spreading characterization.
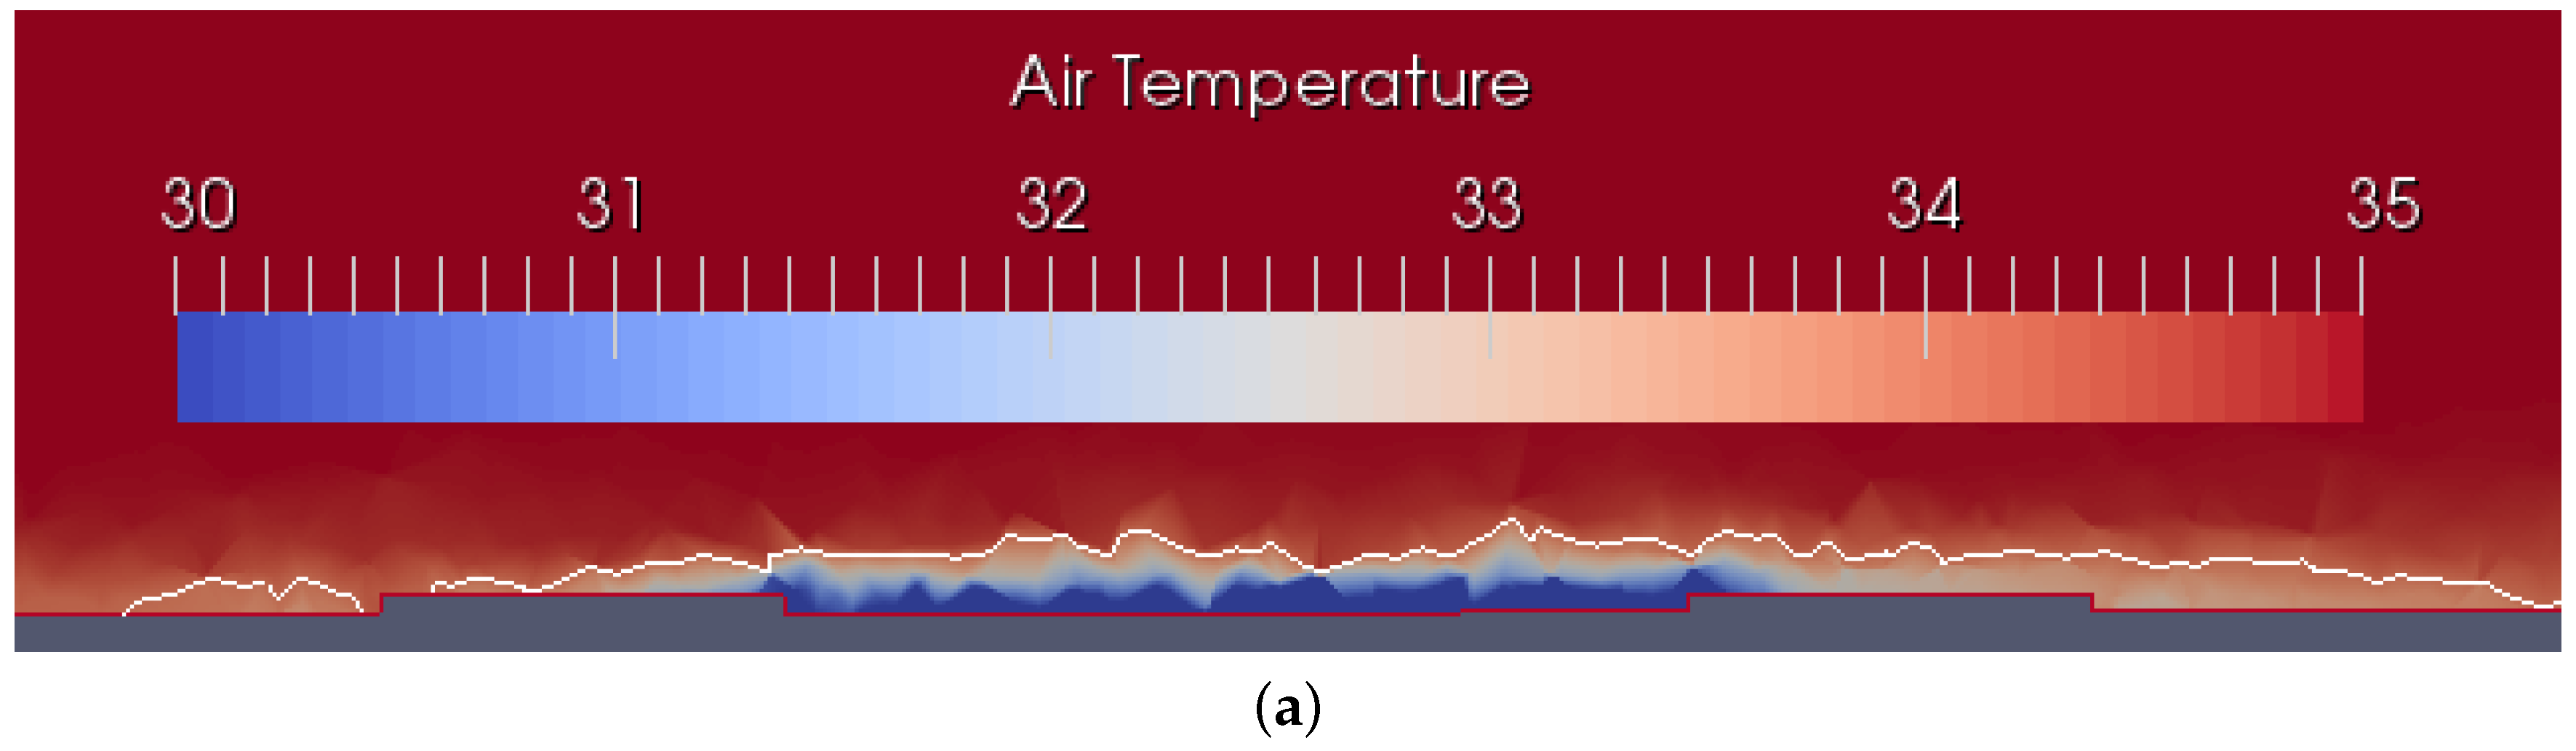
The air temperature field for UF 3 and UF 7 (buildings 10 m and 4 m high, respectively, in a high-density district due to large buildings—few streets) is presented in Figure 10. In the low building height case (UF 7), the cool air diffused over the buildings (Figure 10a). In the tall building case (UF 3), the buildings seemed to be sufficiently high to prevent air from spreading above them (Figure 10b). As a result, the cool air was channeled into the streets, reaching a further distance from the park and thus covering a wider area.
The air temperature field for UF 1 and UF 6 (buildings 10 m and 17 m high, respectively, in a low-density district—many streets) is presented Figure 11. For the UF 1, the cool air did not pass over the buildings; it remained channeled in the streets. It is obvious that in this case building height increases did not affect the spreading of cool air.
Above a certain building height threshold, the cool air can no longer spread over the buildings. Further increasing the building height would then have no effect on the cooled surface since the air is only spreading under the urban canopy.
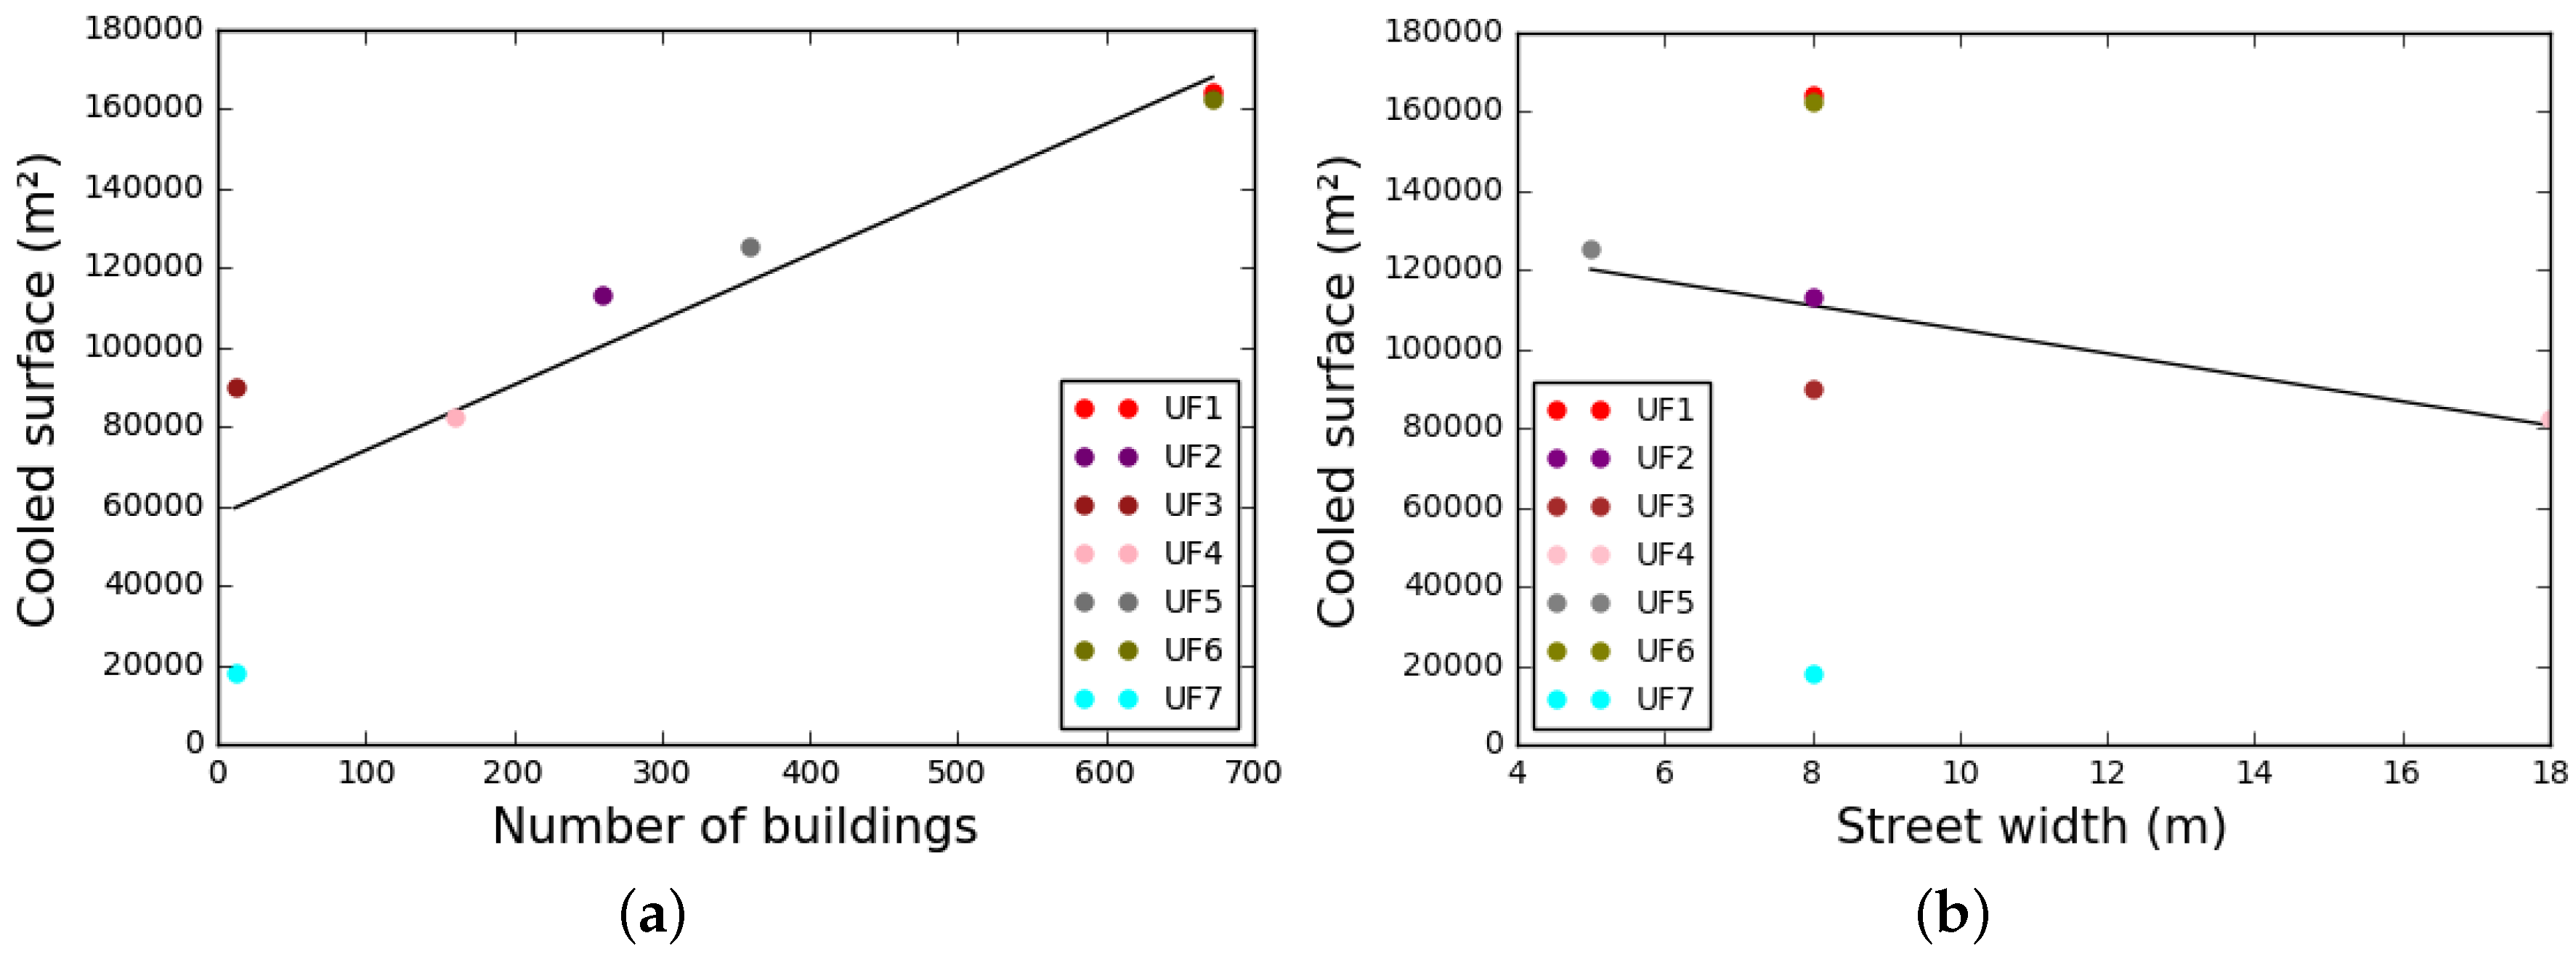
The issue of building height relevance calls into question the relevance of two other indicators, namely: urban fragmentation (e.g., number of buildings), and street width. We previously showed that the aspect ratio is positively correlated with the cooled surface area. The aspect ratio is defined as the ratio of building height to street width. Since past results have demonstrated that building height only affects the cool air spreading in very specific configurations, we might wonder whether street width is an influential parameter. Urban fragmentation was not initially identified as an important parameter as regards the cool air spreading. However, the number of buildings varies along the chosen urban form, and thus its cooling potential warrants investigation. The cooled surface area is plotted versus both the number of buildings (Figure 12a) and the street width (Figure 12b). The number of buildings appears to be much more closely correlated with the cooled surface area than street width. A large variability in the cooled surface area existed for the UF with 8-m width streets, thus making this parameter insignificant (Figure 12b). In Figure 12a, the cooled surface area clearly increased as the number of buildings or streets increased. Moreover, the distance to the regression line remained low (except when the number of buildings was very small).
Ultimately, urban fragmentation (here the number of buildings) seemed to be a more relevant variable than building density, aspect ratio, or building height for characterizing the cooled air spreading from a park through a district.
5. Conclusions
The parameters impacting the spreading of cool air produced by a park have been investigated herein. Simulations were performed to observe the cooling distance (surface included inside the 1 C temperature decrease isoline) induced by the park and by the form of its surrounding urban district. Some of the studied parameters are intrinsic to the park (shape and size), while others describe the urban morphology of the surrounding neighborhoods (building density, building height, and aspect ratio). The simulations were run for various wind speeds and under a constant cooling flux of 300 W/m generated by the green area.
The analysis of our results led to the following conclusions:
- A larger park will cool more efficiently: it will generate a greater surface area of cooled air per square meter than a smaller park.
- The building density variation can enhance or reduce the spreading of cooled air. This parameter is therefore irrelevant as regards cool air spreading.
- For a given building height and building density, the aspect ratio seems to enhance the cooling process, even though it has not often been identified in the literature as a key parameter.
- Building height does not exert any influence on air spreading above a certain threshold value.
- The number of buildings seems to be a very relevant parameter for characterizing the cooled air spreading from a park through a district. This parameter and all other fragmentation indicators (the number of buildings is an indicator of fragmentation intensity, but the direction and shape of fragmentation may also be of interest) should be further analyzed by the research community.
In this paper, a constant cooling flux was considered in order to focus solely on the spreading of the cool air being produced. Some bias was thus introduced when using this method for analysis (if air remains for an infinite time in the park, its temperature should be infinitely negative). In reality, the flux should have been modified by the temperature difference between the ground and the air and by the wind speed. This hypothesis could be revised in future work by employing a coupled heat transfer simulation (thermo radiative and CFD) in order to generalize the methodology proposed herein and consider a cooling flux that varies in both space and time.
This paper has highlighted new findings, but it is based on strong hypotheses. Further investigation is thus required (empirical data should be used) to verify that these assumptions do not affect the veracity of the main findings. However, only a few studies regarding the topic of cool park air spreading have so far been performed using a numerical approach. The academic approach proposed in this paper has led to both a better understanding of the physical phenomena involved and an identification of the key parameters affecting cool air spreading. For these reasons, it is complementary to the experimental studies available in the literature.
Author Contributions
This work was been conducted within the scope of Xueyao Zhang’s internship. The work program was managed by Jérémy Bernard, Benjamin Morille and Auline Rodler. Xueyao Zhang studied the bibliography and carried out all of the simulation runs. Jérémy Bernard, Benjamin Morille and Auline Rodler wrote the paper and contributed to this effort in equal measure.
Conflicts of Interest
The authors declare no conflict of interest.
References
- Revel, D.; Füssel, H.M.; Jol, A. Climate Change, Impacts and Vulnerability in Europe 2012; Office of Official Publication of the European Union: Luxembourg, 2012. [Google Scholar]
- Robine, J.M.; Cheung, S.L.K.; Le Roy, S.; Van Oyen, H.; Griffiths, C.; Michel, J.P.; Herrmann, F.R. Death toll exceeded 70,000 in Europe during the summer of 2003. C. R. Biol. 2008, 331, 171–178. [Google Scholar] [CrossRef] [PubMed]
- Oke, T.R. Boundary Layer Climates; Routledge: London, UK, 2002. [Google Scholar]
- Eurostat. Eurostat Regional Yearbook 2014: Focus on European Cities; Office of Official Publication of the European Union: Luxembourg, 2014. [Google Scholar]
- Santamouris, M.; Ding, L.; Fiorito, F.; Oldfield, P.; Osmond, P.; Paolini, R.; Prasad, D.; Synnefa, A. Passive and active cooling for the outdoor built environment—Analysis and assessment of the cooling potential of mitigation technologies using performance data from 220 large scale projects. Sol. Energy 2017, 154, 14–33. [Google Scholar] [CrossRef]
- Barradas, V.L. Air temperature and humidity and human comfort index of some city parks of Mexico City. Int. J. Biometeorol. 1991, 35, 24–28. [Google Scholar] [CrossRef] [PubMed]
- Jauregui, E. Influence of a large urban park on temperature and convective precipitation in a tropical city. Energy Build. 1991, 15, 457–463. [Google Scholar] [CrossRef]
- Chang, C.R.; Li, M.H. Effects of urban parks on the local urban thermal environment. Urban For. Urban Green. 2014, 13, 672–681. [Google Scholar] [CrossRef]
- Spronken-Smith, R.; Oke, T. Scale modelling of nocturnal cooling in urban parks. Bound.-Layer Meteorol. 1999, 93, 287–312. [Google Scholar] [CrossRef]
- Cao, X.; Onishi, A.; Chen, J.; Imura, H. Quantifying the cool island intensity of urban parks using ASTER and IKONOS data. Landsc. Urban Plan. 2010, 96, 224–231. [Google Scholar] [CrossRef]
- Ca, V.T.; Asaeda, T.; Abu, E.M. Reductions in air conditioning energy caused by a nearby park. Energy Build. 1998, 29, 83–92. [Google Scholar] [CrossRef]
- Shashua-Bar, L.; Hoffman, M.E. Vegetation as a climatic component in the design of an urban street: An empirical model for predicting the cooling effect of urban green areas with trees. Energy Build. 2000, 31, 221–235. [Google Scholar] [CrossRef]
- Doick, K.J.; Peace, A.; Hutchings, T.R. The role of one large greenspace in mitigating London’s nocturnal urban heat island. Sci. Total Environ. 2014, 493, 662–671. [Google Scholar] [CrossRef] [PubMed]
- Chandler, T.J. The Climate of London; Hutchinson: London, UK, 1965. [Google Scholar]
- Upmanis, H.; Eliasson, I.; Lindqvist, S. The influence of green areas on nocturnal temperatures in a high latitude city (Göteborg, Sweden). Int. J. Climatol. 1998, 18, 681–700. [Google Scholar] [CrossRef]
- Jansson, C.; Jansson, P.E.; Gustafsson, D. Near surface climate in an urban vegetated park and its surroundings. Theor. Appl. Climatol. 2007, 89, 185–193. [Google Scholar] [CrossRef]
- Skoulika, F.; Santamouris, M.; Kolokotsa, D.; Boemi, N. On the thermal characteristics and the mitigation potential of a medium size urban park in Athens, Greece. Landsc. Urban Plan. 2014, 123, 73–86. [Google Scholar] [CrossRef]
- Oke, T.R.; Crowther, J.; McNaughton, K.; Monteith, J.; Gardiner, B. The micrometeorology of the urban forest [and discussion]. Philos. Trans. R. Soc. B Biol. Sci. 1989, 324, 335–349. [Google Scholar] [CrossRef]
- Lacombe, M.; Bousri, D.; Leroy, M.; Mezred, M. WMO Field Intercomparison of Thermometer Screens/Shields and Humidity Measuring Instruments, Ghardaia, Algeria, November 2008–October 2009; Technical Report; World Meteorological Organization: Geneva, Switzerland, 2011. [Google Scholar]
- Lacombe, M. Results of the WMO intercomparison of thermometer screens/shields and hygrometers in hot desert conditions. In Proceedings of the TECO-2010—WMO Technical Conference on Meteorological and Environmental Instruments and Methods of Observation, Helsinki, Finland, 30 August–1 September 2010. [Google Scholar]
- Oke, T. Initial Guidance to Obtain Representative Meteorological Observations at Urban Sites; World Meteorological Organization: Geneva, Switzerland, 2004; Volume 81. [Google Scholar]
- Perini, K.; Magliocco, A. Effects of vegetation, urban density, building height, and atmospheric conditions on local temperatures and thermal comfort. Urban For. Urban Green. 2014, 13, 495–506. [Google Scholar] [CrossRef]
- Rodriguez, F. FluxSAP—A collaborative experimental campaign on water and energy fluxes in urban areas and the relation with the vegetation: The case of a Nantes district. In Proceedings of the 9th International Conference on Urban Climate (ICUC9), Toulouse, France, 20–24 July 2015. [Google Scholar]
- Peel, M.C.; Finlayson, B.L.; McMahon, T.A. Updated world map of the Köppen-Geiger climate classification. Hydrol. Earth Syst. Sci. Discuss. 2007, 4, 439–473. [Google Scholar] [CrossRef]
- McPherson, G.E.; Nowak, D.J.; Rowntree, R.A. Chicago’s Urban Forest Ecosystem: Results of the Chicago Urban Forest Climate Project; US Department of Agriculture, Forest Service, Northeastern Forest Experiment Station: Radnor, PA, USA, 1994.
- Morille, B.; Lauzet, N.; Musy, M. SOLENE-microclimate: A tool to evaluate envelopes efficiency on energy consumption at district scale. Energy Procedia 2015, 78, 1165–1170. [Google Scholar] [CrossRef]
- Musy, M.; Malys, L.; Morille, B.; Inard, C. The use of SOLENE-microclimat model to assess adaptation strategies at the district scale. Urban Clim. 2015, 14, 213–223. [Google Scholar] [CrossRef]
- Malys, L. Évaluation des Impacts Directs et Indirects des Façades et des Toitures Végétales sur le Comportement Thermique des Bâtiments. Ph.D. Thesis, École Nationale Supérieure d’Architecture Nantes, Nantes, France, 2012. [Google Scholar]
Figure 1.
Study area and parameter definition—note that the reference surface consists of the entire square surface area.
Figure 1.
Study area and parameter definition—note that the reference surface consists of the entire square surface area.
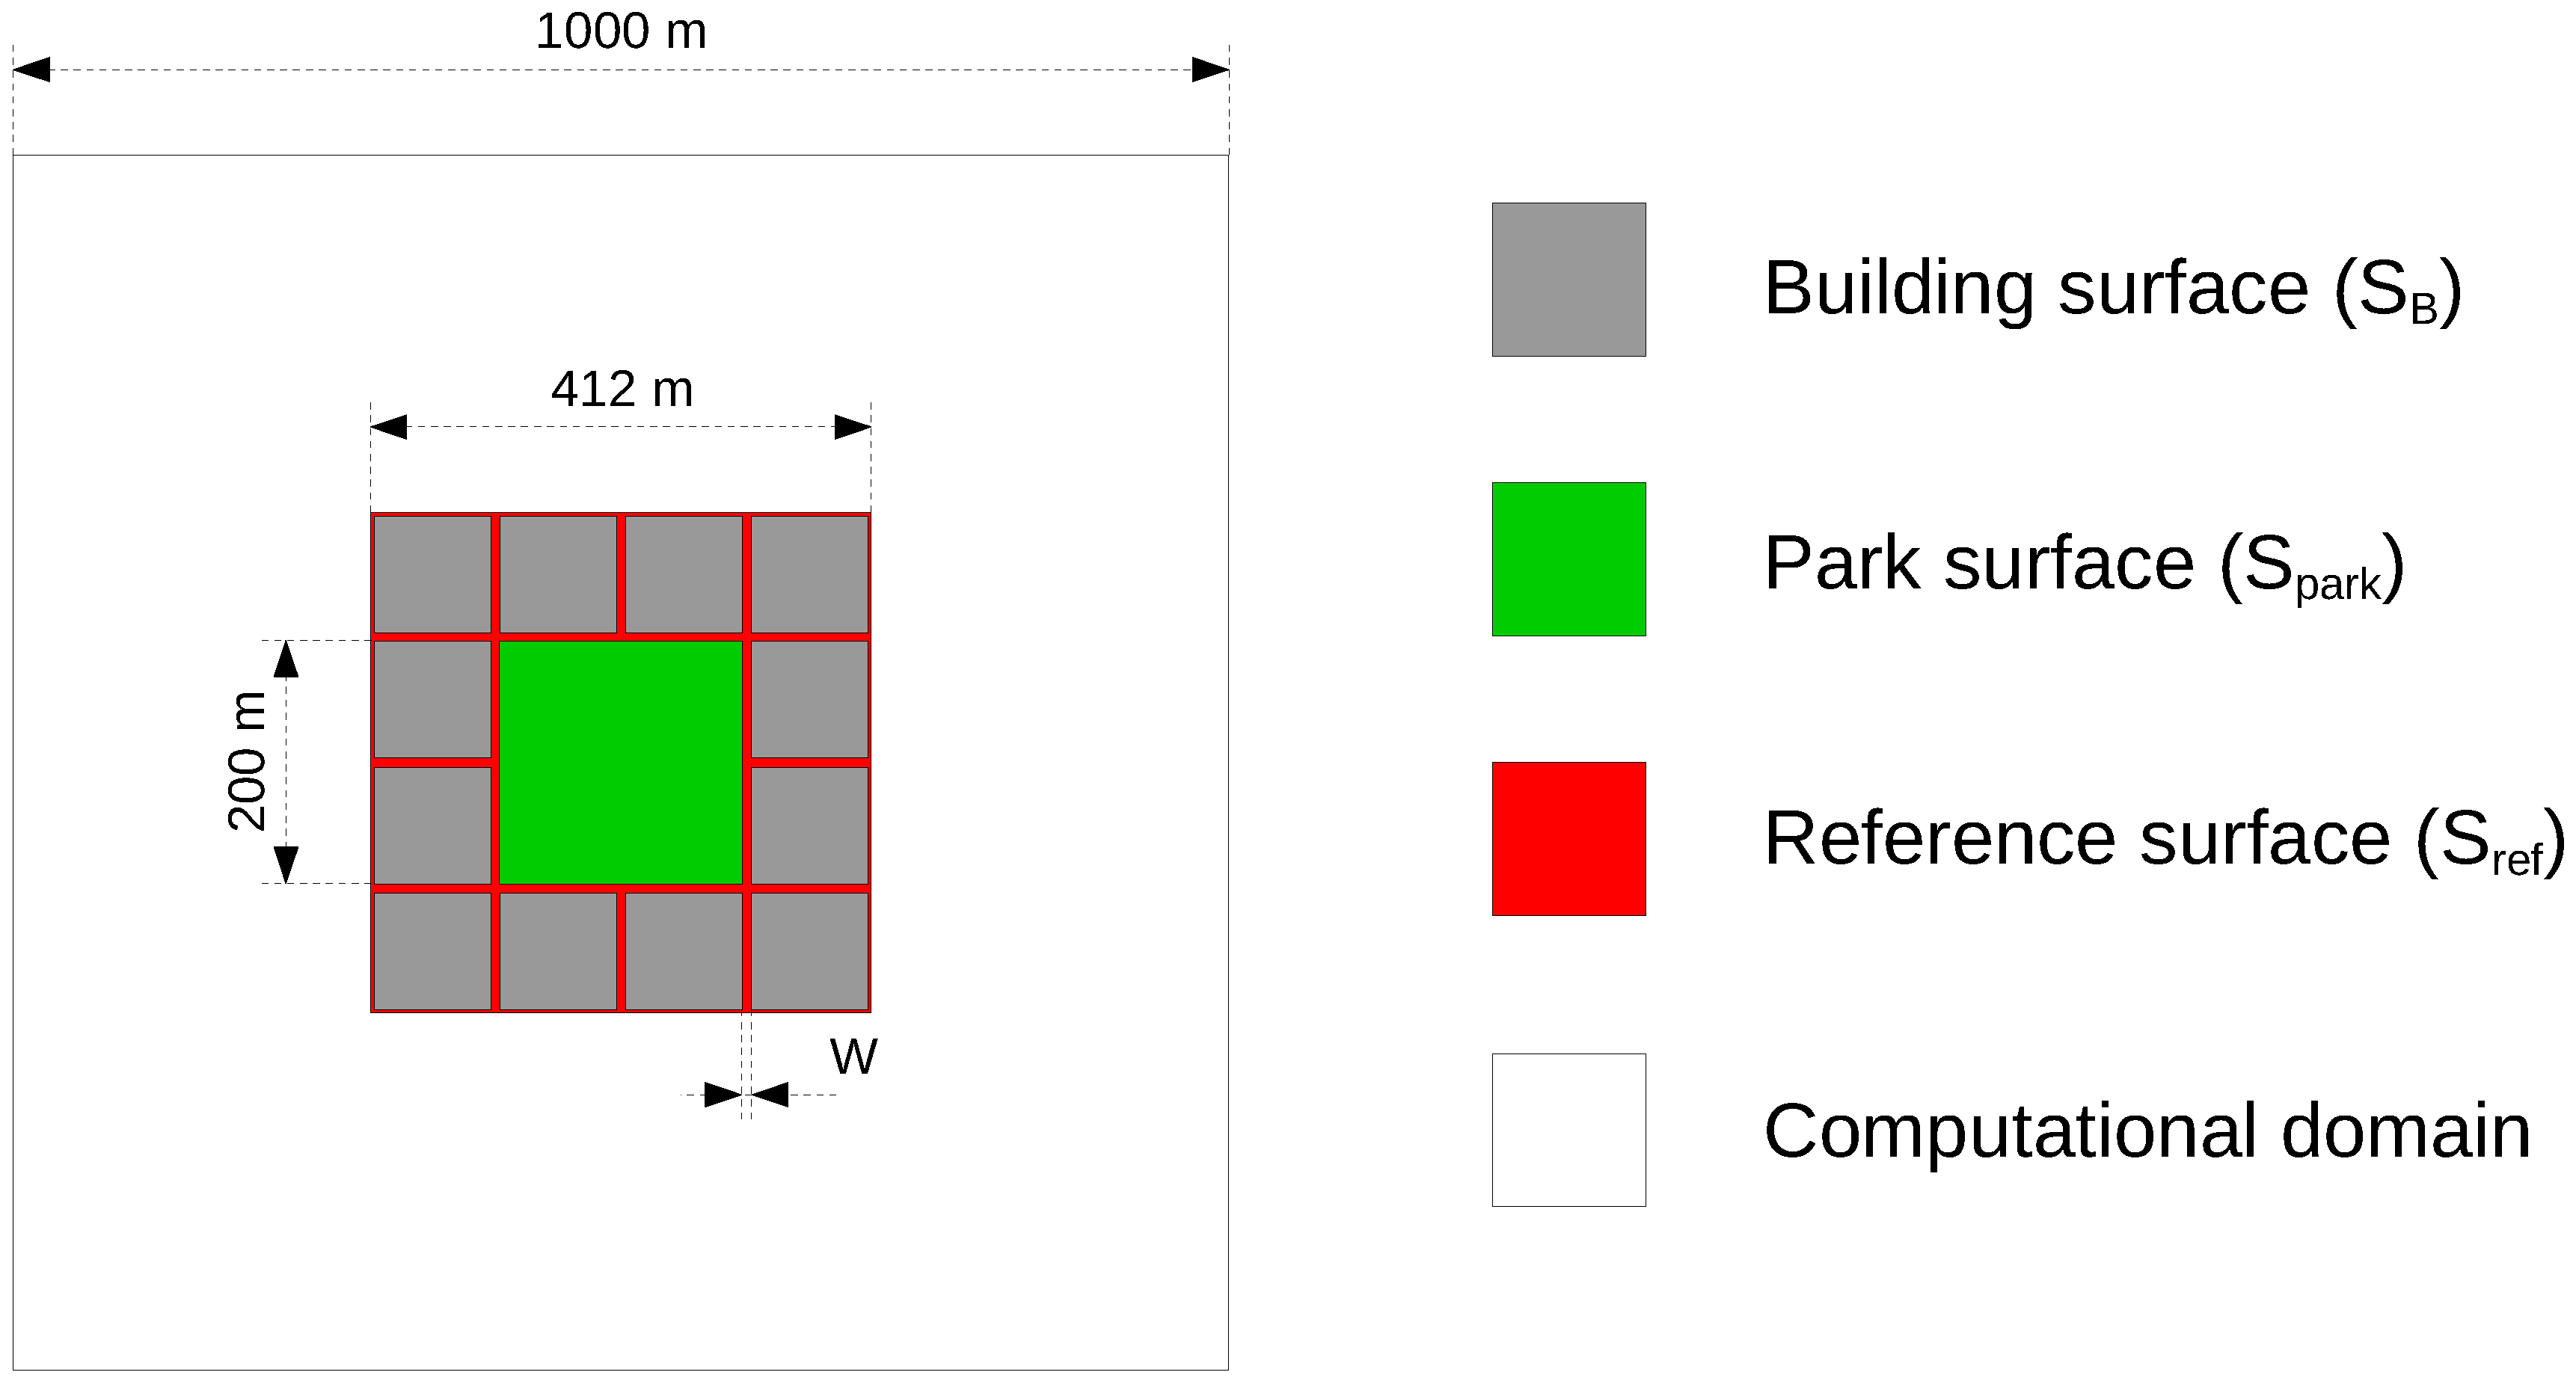
Figure 2.
Meshed computational domain.
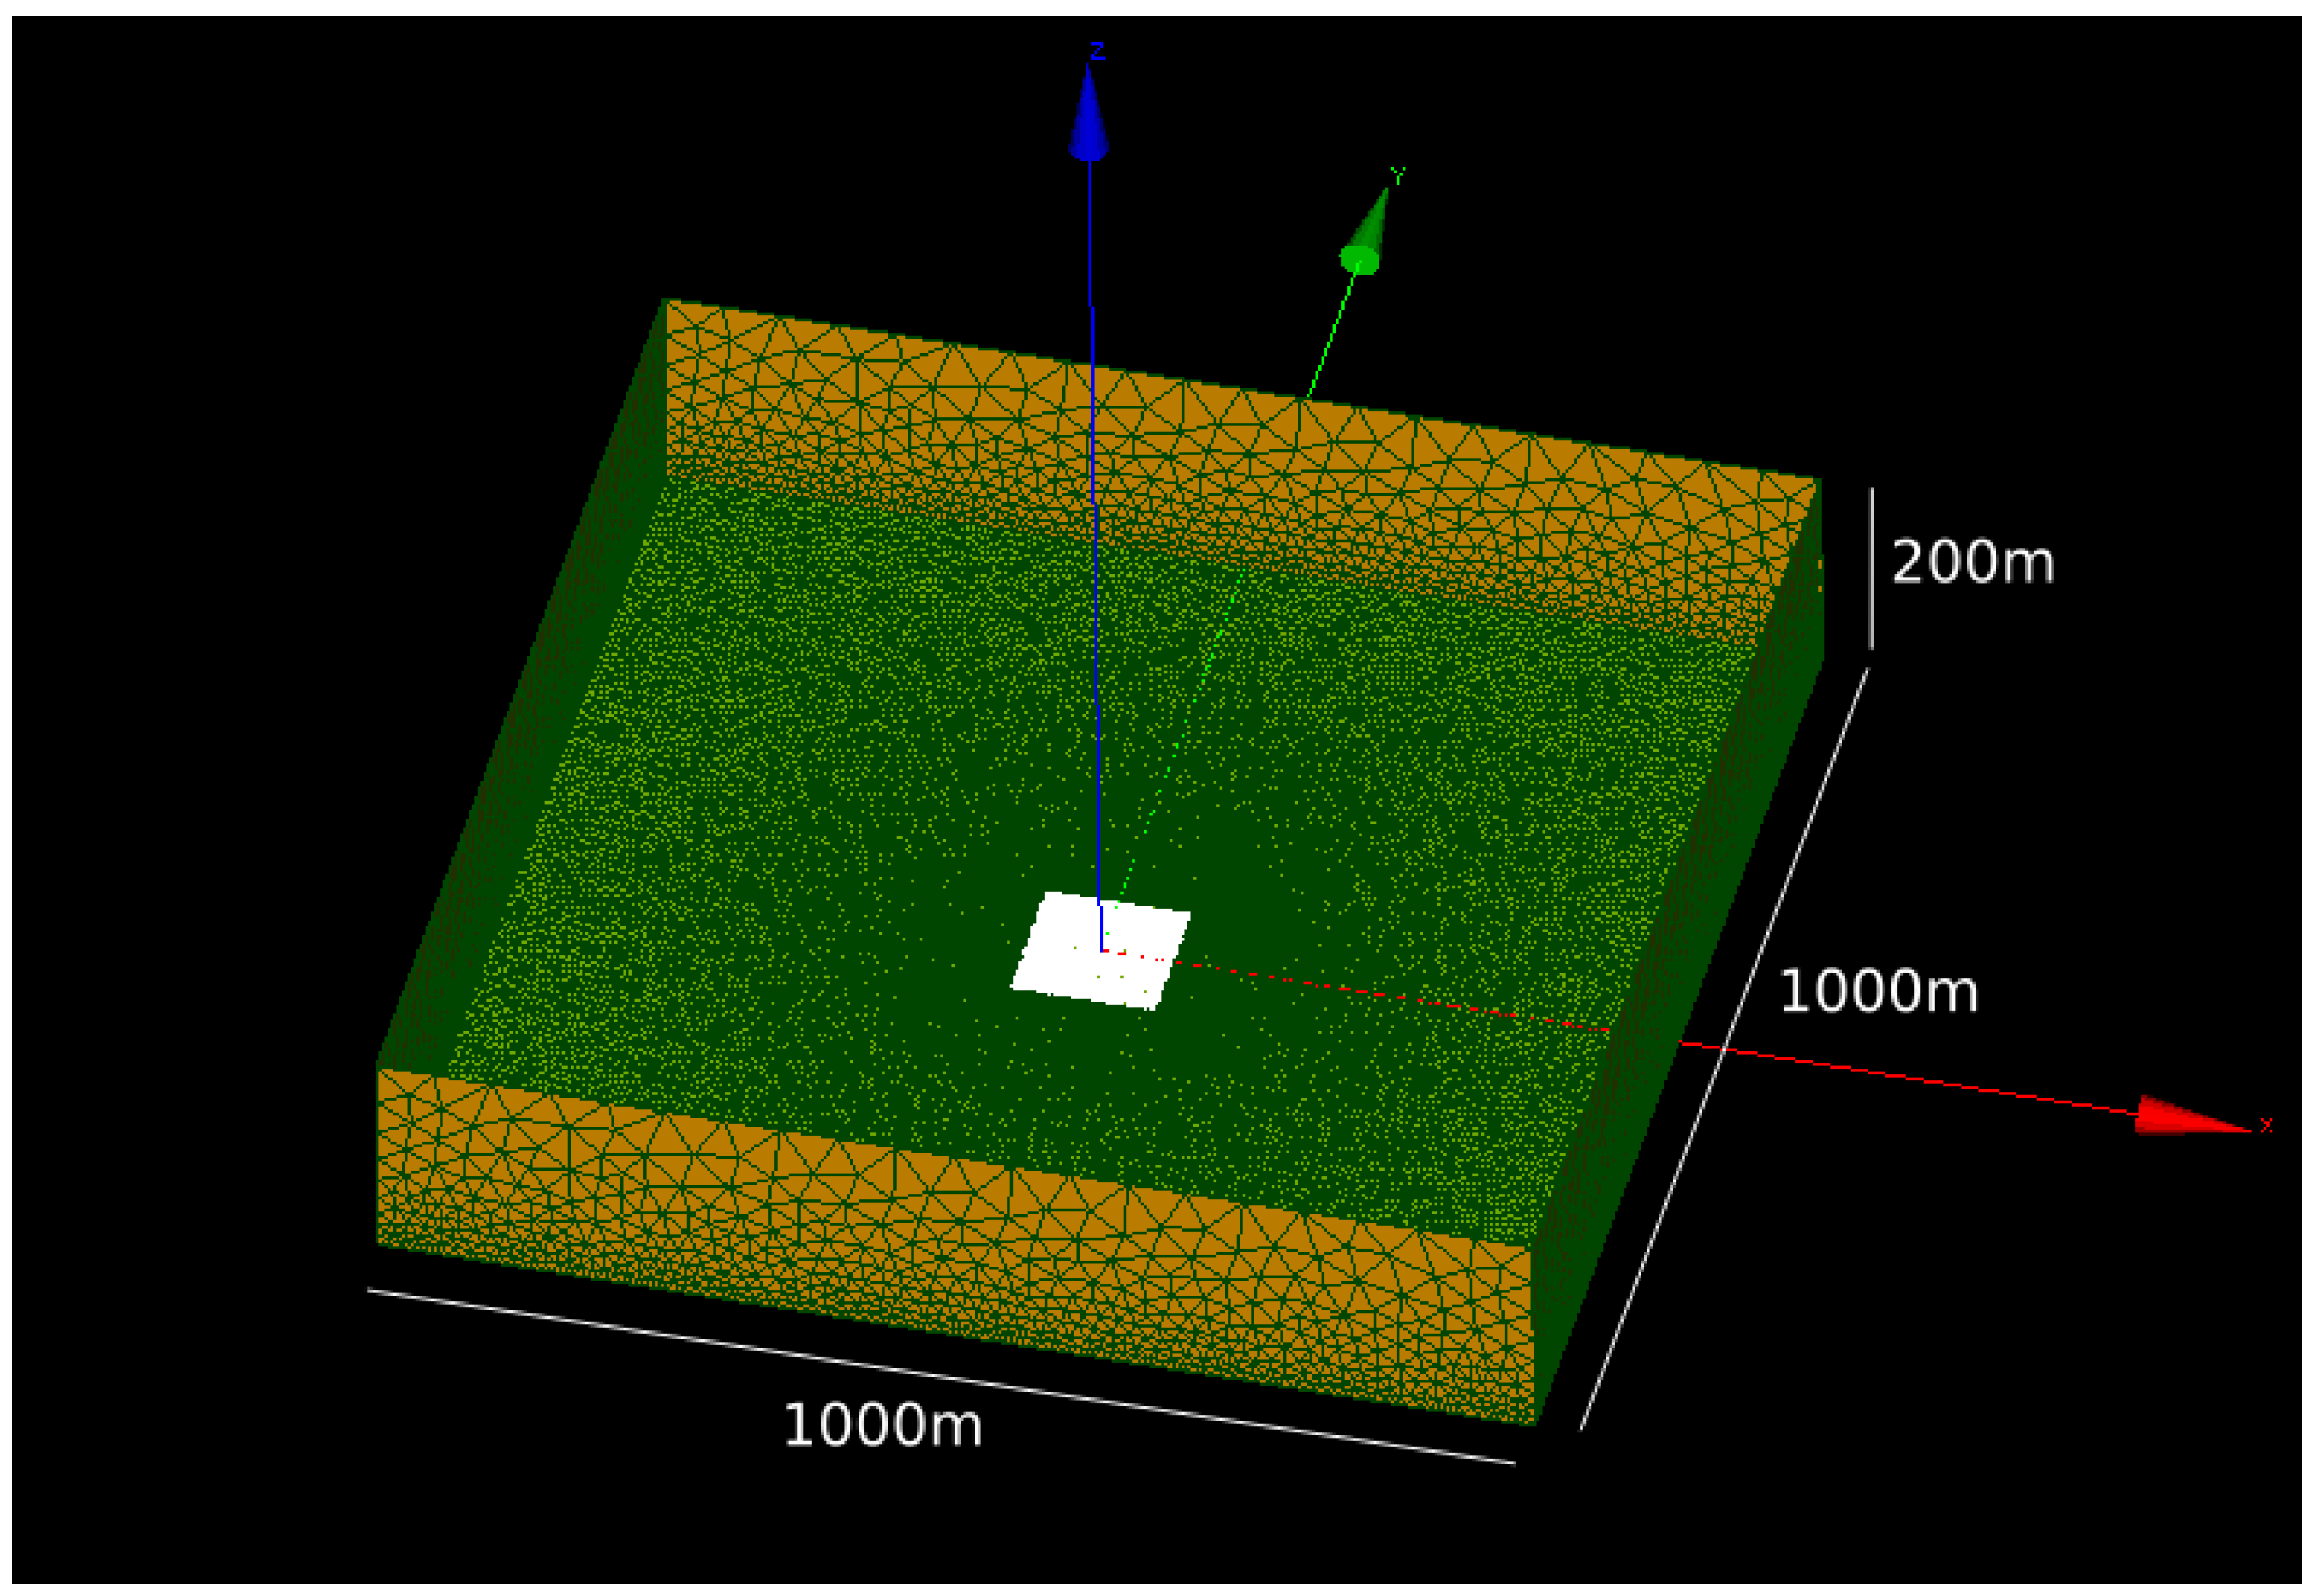
Figure 3.
Zoning (dashed lines and numbers) and example of calculation (red lines) used to calculate the distance between any point on the 34 °C isoline and the park boundary.
Figure 3.
Zoning (dashed lines and numbers) and example of calculation (red lines) used to calculate the distance between any point on the 34 °C isoline and the park boundary.
Figure 4.
Cooled surface evolution with wind speed.
Figure 5.
Two-meter-high air temperature distribution inside and around a park with a width of 125 m: (a) Exposed to a wind speed of 2 m/s; (b) Exposed to a wind speed of 0.5 m/s—the white line is the 34 °C isoline.
Figure 5.
Two-meter-high air temperature distribution inside and around a park with a width of 125 m: (a) Exposed to a wind speed of 2 m/s; (b) Exposed to a wind speed of 0.5 m/s—the white line is the 34 °C isoline.
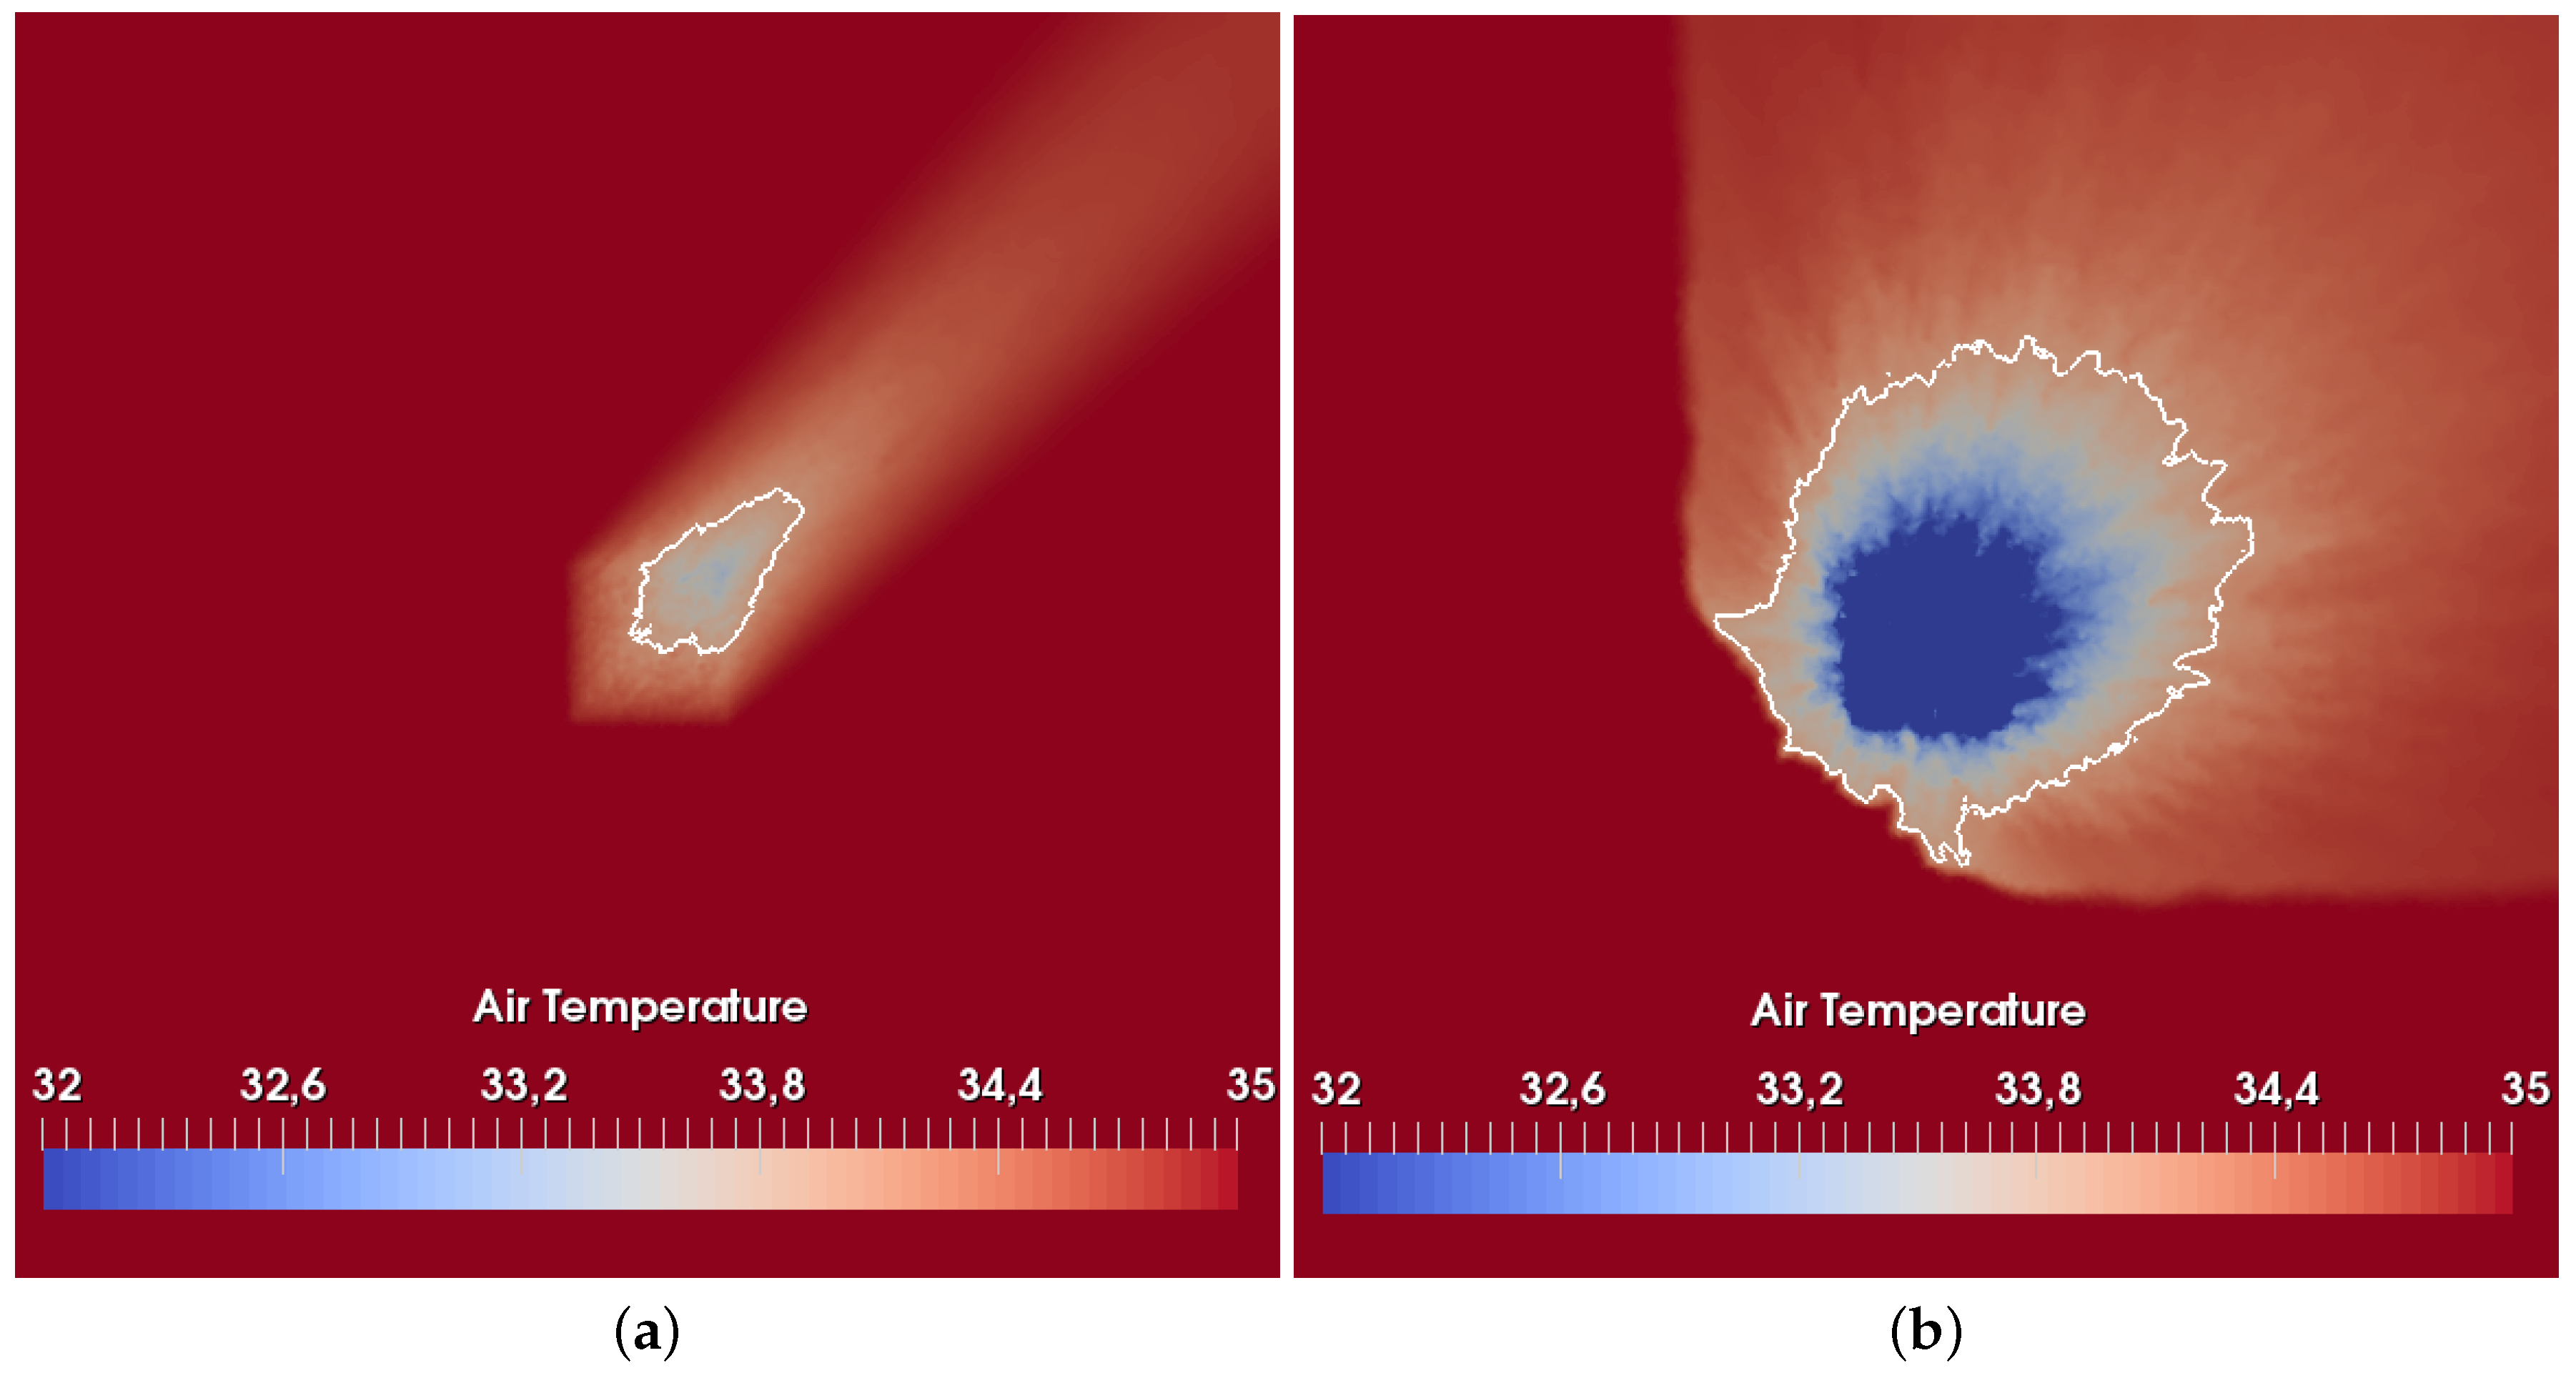
Figure 6.
The 34 °C isotherm at a 0.5 m/s wind speed for the reference urban form (no buildings—orange line) and for UF 1 (red line)—the small white squares represent building footprints.
Figure 6.
The 34 °C isotherm at a 0.5 m/s wind speed for the reference urban form (no buildings—orange line) and for UF 1 (red line)—the small white squares represent building footprints.
Figure 7.
Influence of wind speed on the cooled surface for various building density values: (a) When building density was increased by modifying the building size; (b) When building density was increased by modifying the street width.
Figure 7.
Influence of wind speed on the cooled surface for various building density values: (a) When building density was increased by modifying the building size; (b) When building density was increased by modifying the street width.
Figure 8.
Influence of wind speed on the cooled surface for different aspect ratio values. (a) For high building density; (b) For low building density.
Figure 8.
Influence of wind speed on the cooled surface for different aspect ratio values. (a) For high building density; (b) For low building density.
Figure 9.
Influence of wind speed on the cooled surface for various building heights. (a) For a low building density district; (b) For a high building density district.
Figure 9.
Influence of wind speed on the cooled surface for various building heights. (a) For a low building density district; (b) For a high building density district.
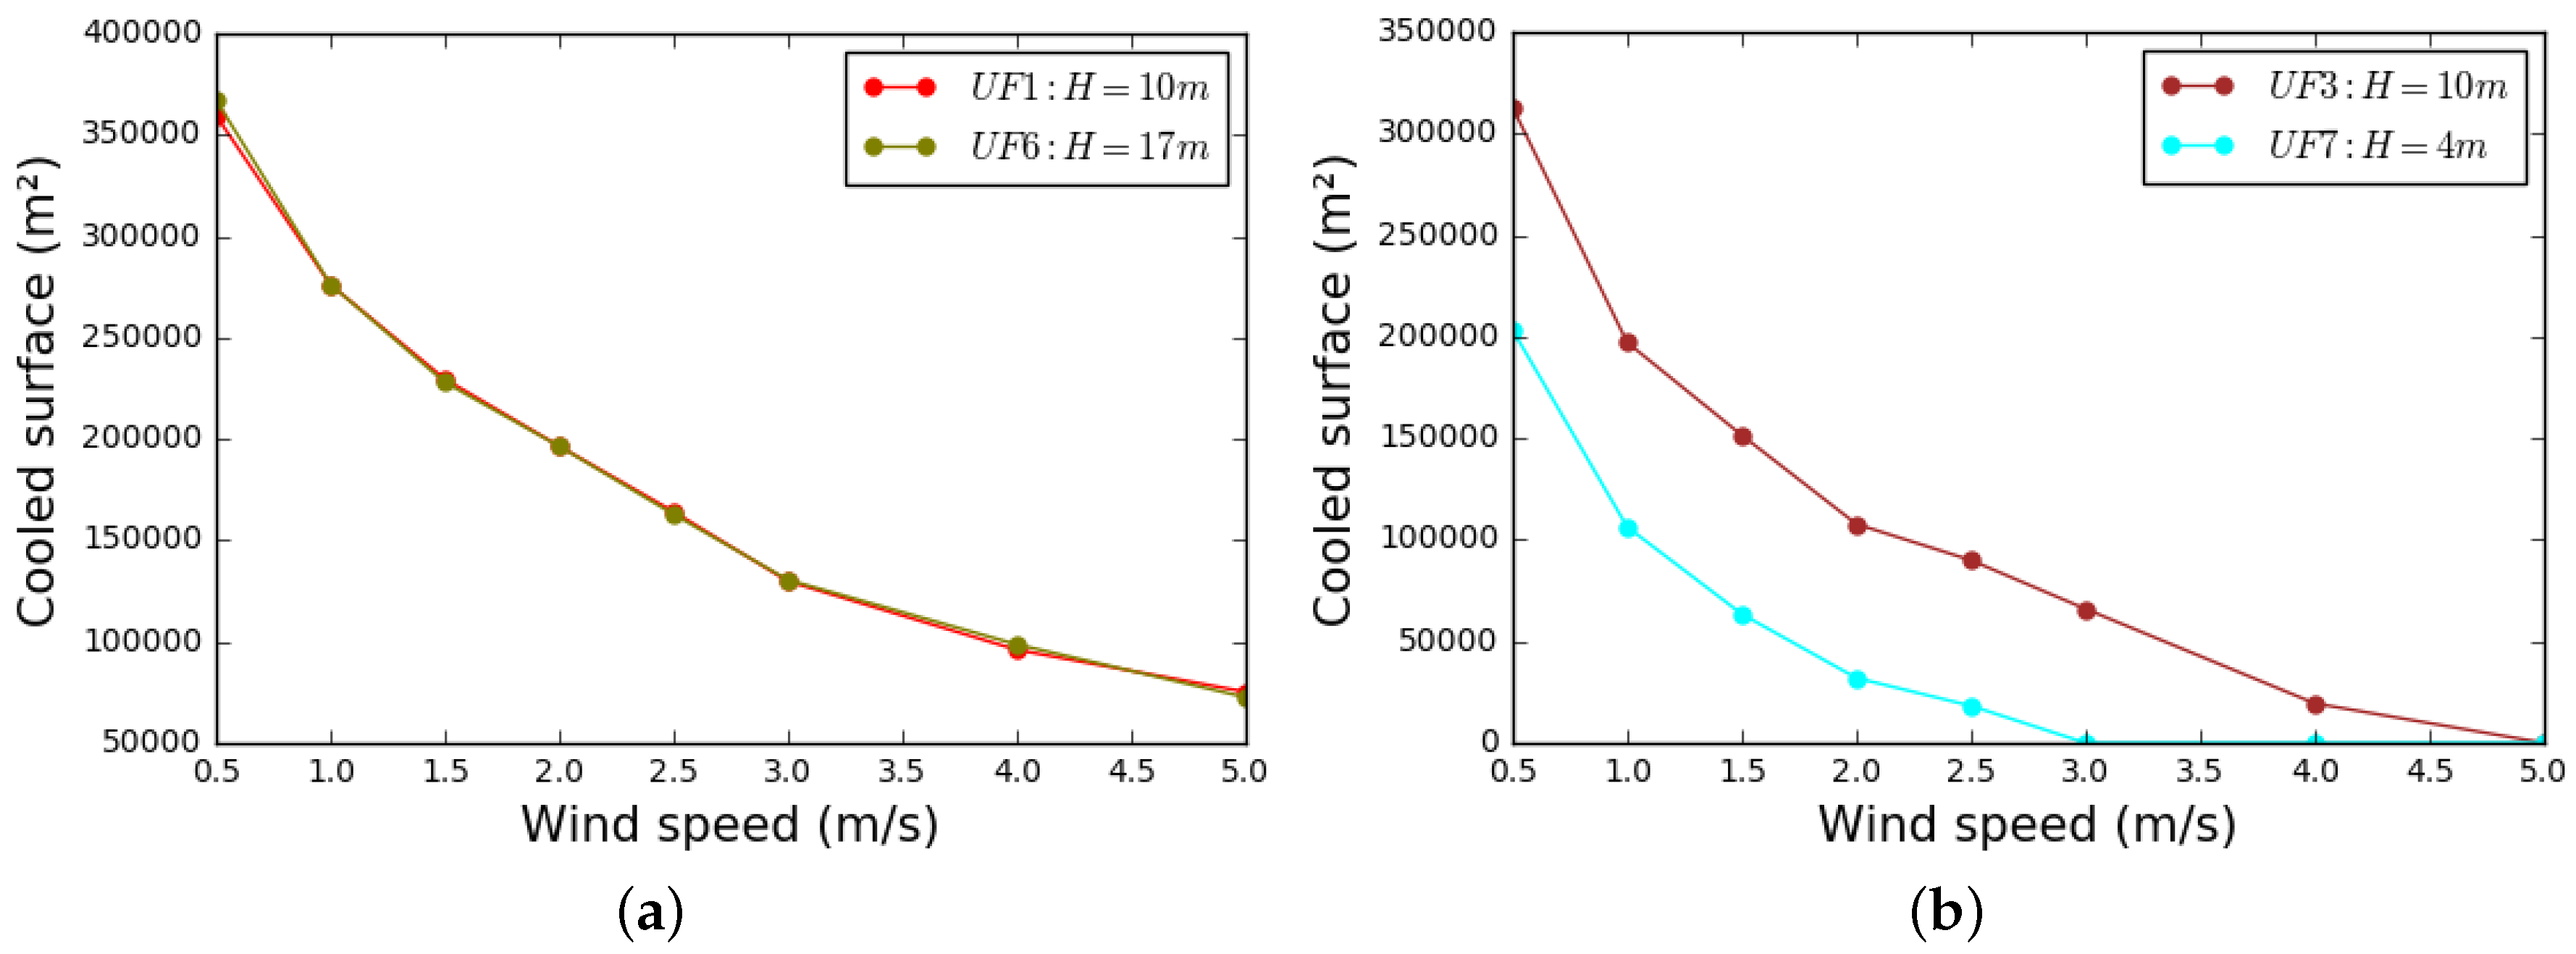
Figure 10.
Vertical slice of the air temperature field for a high building density district. (a) UF 7: buildings are 4 m high; (b) UF 3: buildings are 10 m high—the white line is the 34 °C isotherm.
Figure 10.
Vertical slice of the air temperature field for a high building density district. (a) UF 7: buildings are 4 m high; (b) UF 3: buildings are 10 m high—the white line is the 34 °C isotherm.

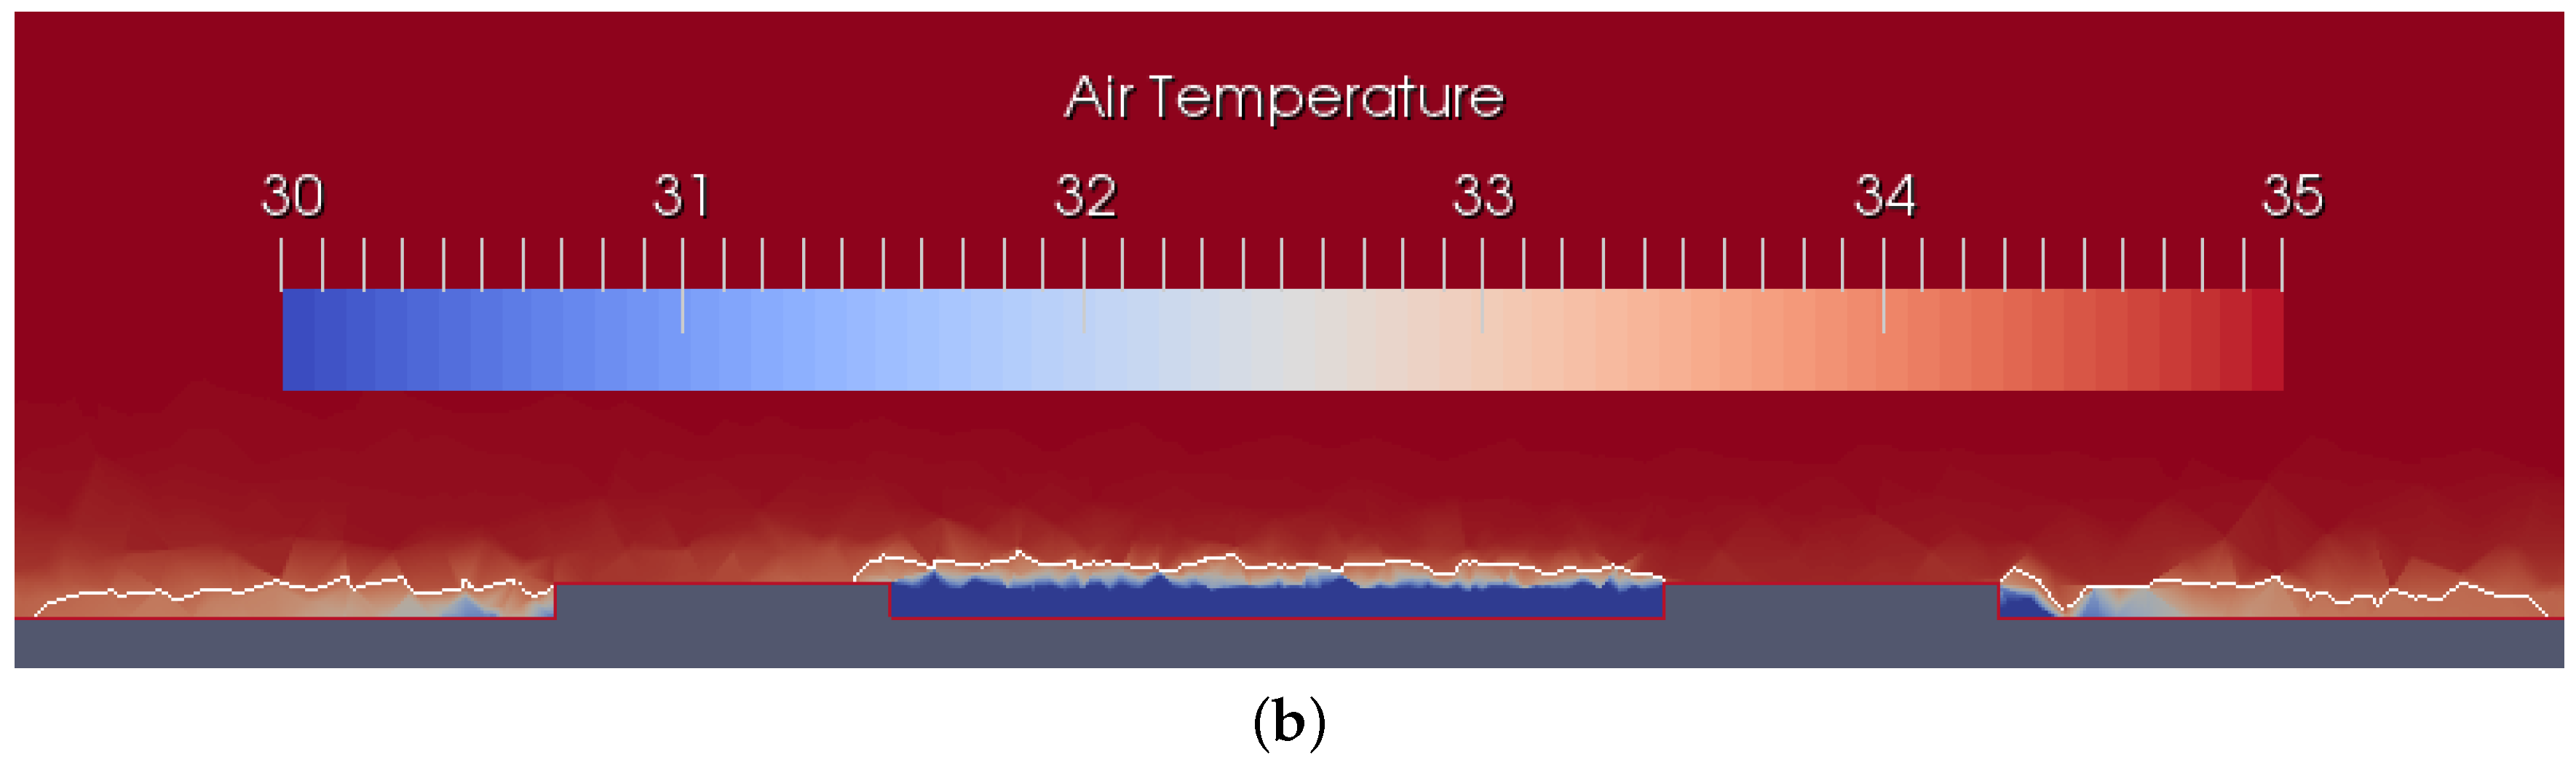
Figure 11.
Vertical slice of the air temperature field for a low building density district. (a) UF 1: buildings are 10 m high; (b) UF 6: buildings are 17 m high)—the white line is the 34 °C isotherm.
Figure 11.
Vertical slice of the air temperature field for a low building density district. (a) UF 1: buildings are 10 m high; (b) UF 6: buildings are 17 m high)—the white line is the 34 °C isotherm.
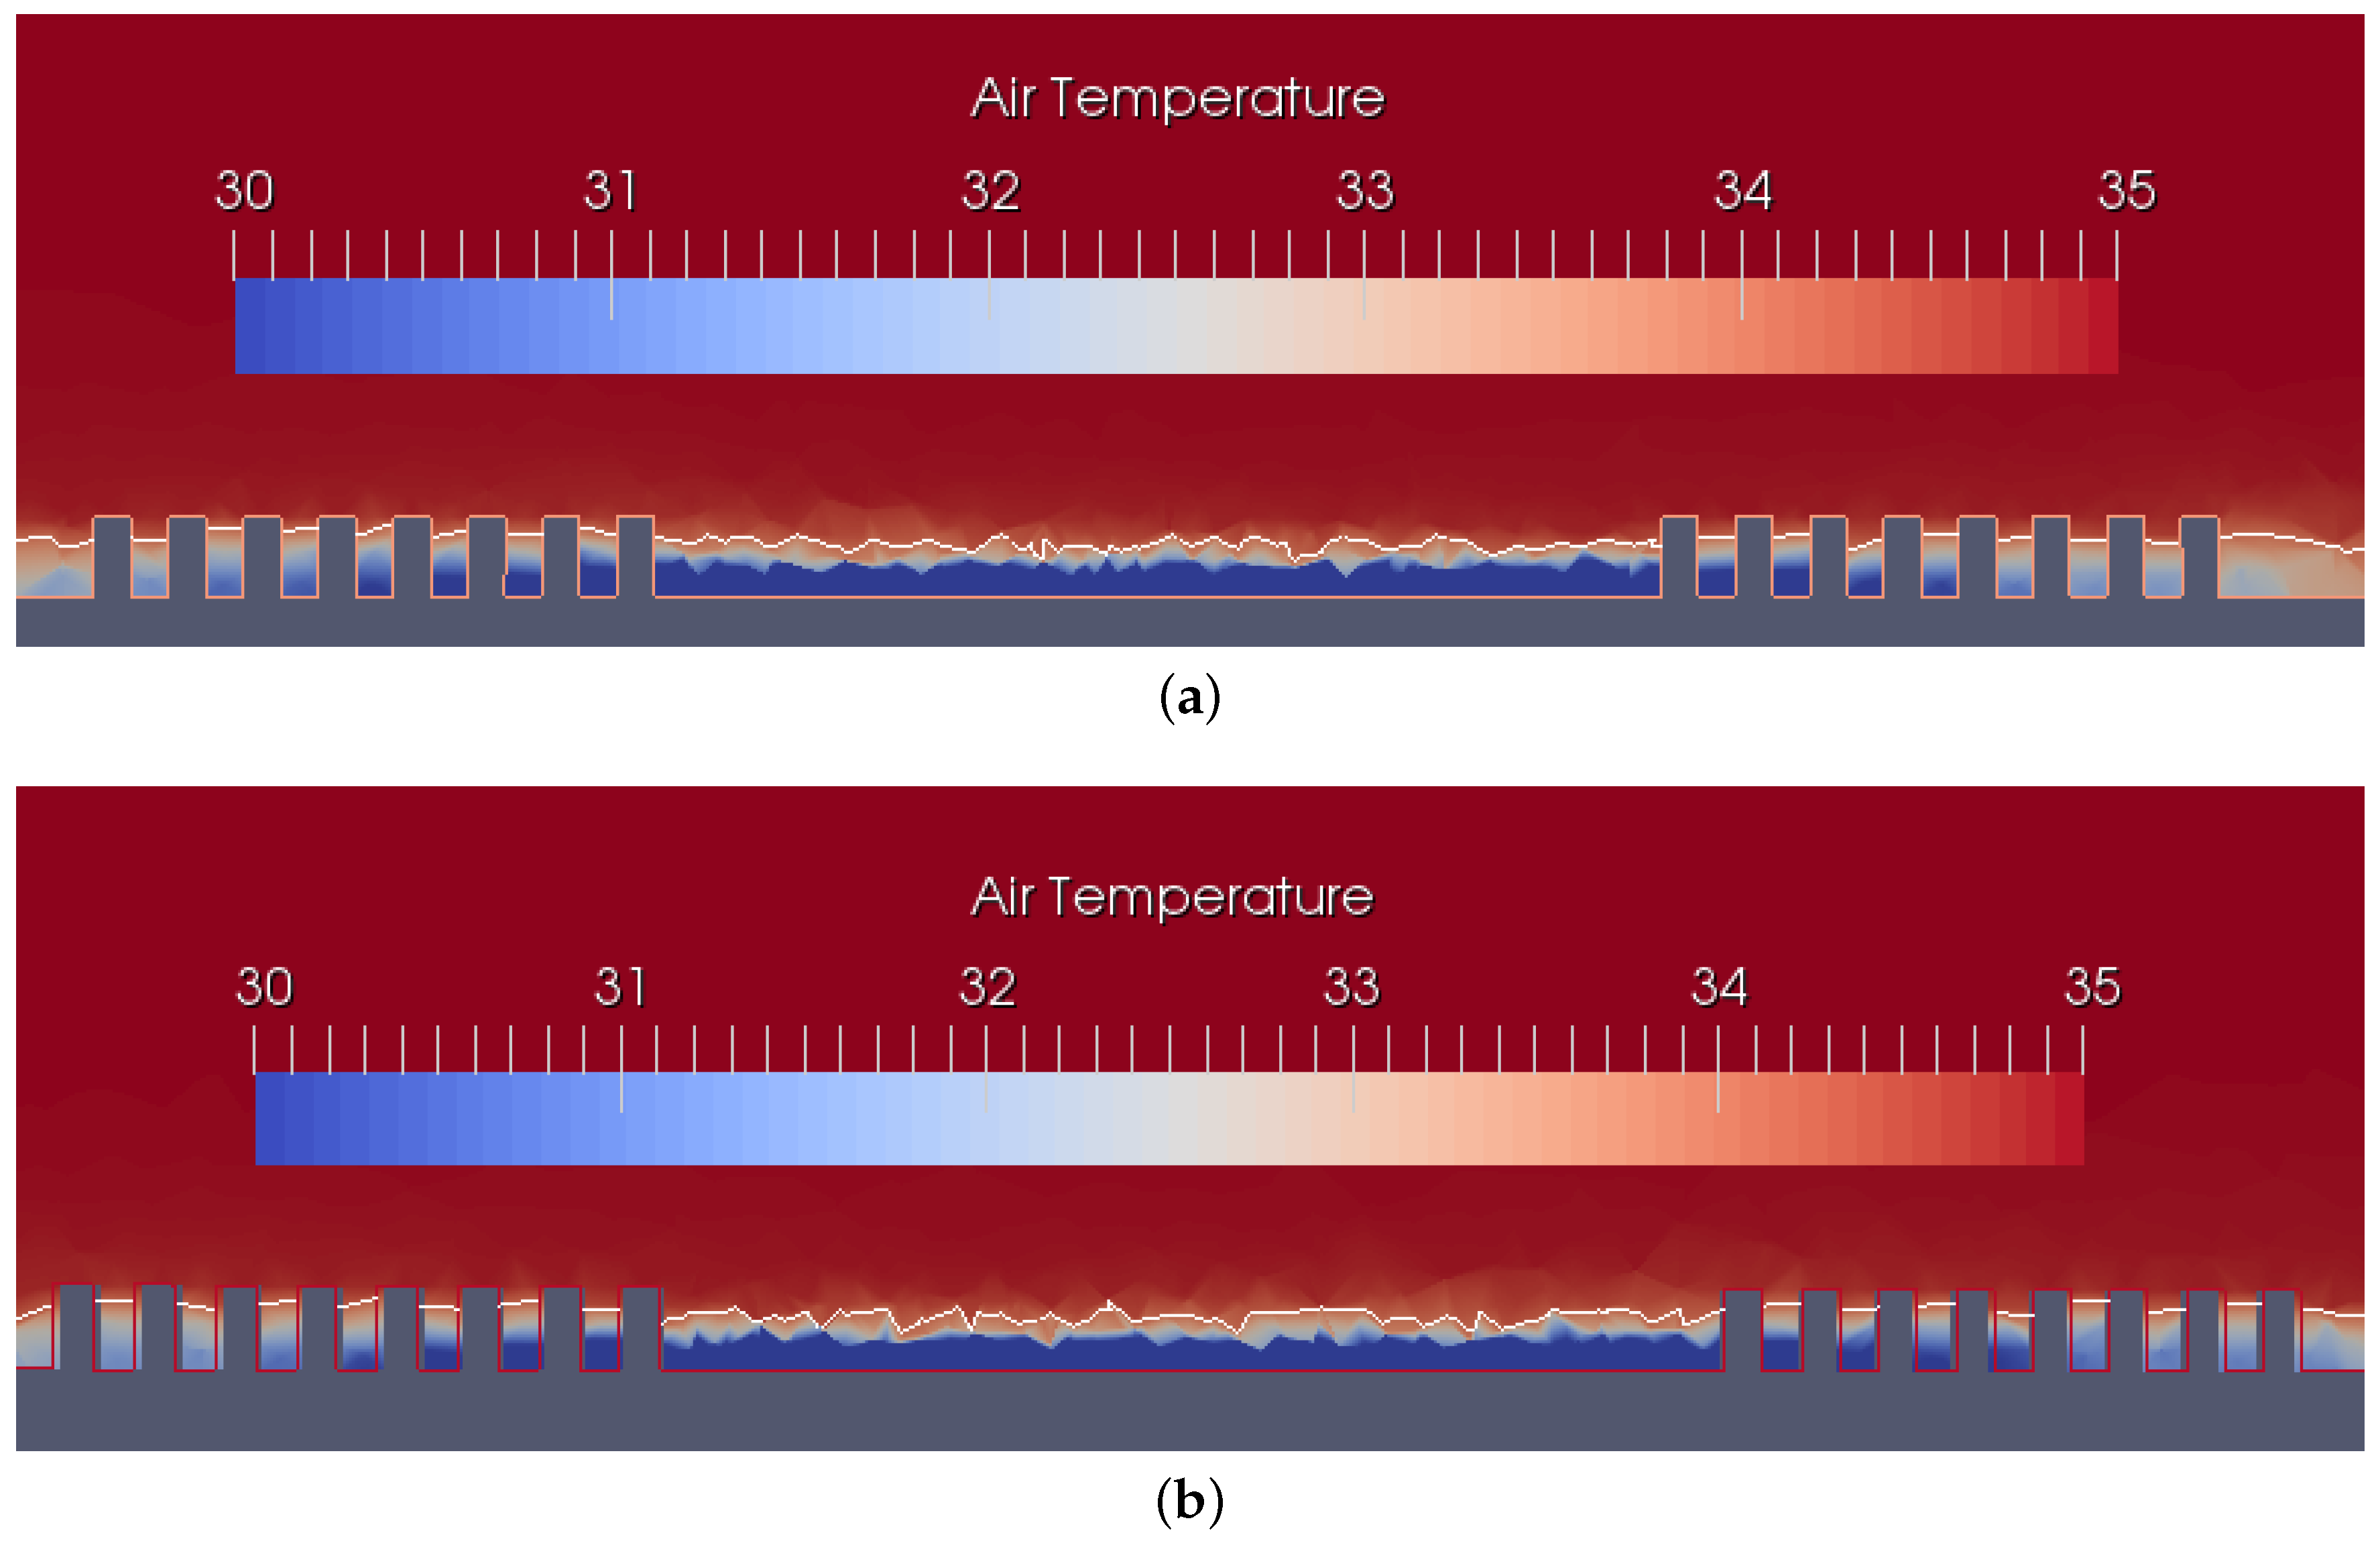
Figure 12.
Cooled surface area evolution versus: (a) the number of buildings; (b) street width—wind speed set at 2.5 m/s.
Figure 12.
Cooled surface area evolution versus: (a) the number of buildings; (b) street width—wind speed set at 2.5 m/s.


Table 1.
Parameters set for each of the seven scenarios investigated.
| UF | Height (m) | Building Width (m) | Street Width (m) | D (%) | H/W | Number of Buildings |
|---|---|---|---|---|---|---|
| 1 | 10 | 8 | 8 | 25 (low) | 1.25 | 672 |
| 2 | 10 | 18 | 8 | 48 (medium) | 1.25 | 260 |
| 3 | 10 | 96 | 8 | 85 (high) | 1.25 | 12 |
| 4 | 10 | 18 | 18 | 25 (low) | 0.56 | 160 |
| 5 | 10 | 18 | 5 | 95 (high) | 2.00 | 360 |
| 6 | 17 | 8 | 8 | 25 (low) | 2.12 | 672 |
| 7 | 4 | 96 | 8 | 85 (high) | 0.50 | 12 |
Table 2.
Geometry of each urban form (UF).
| UF 1/UF 6 | UF 2 | UF 3/UF 7 |
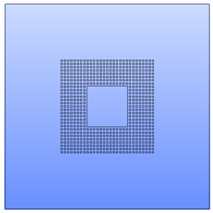 | 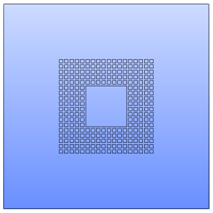 | 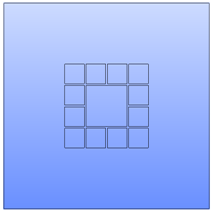 |
| UF 4 | UF 5 | |
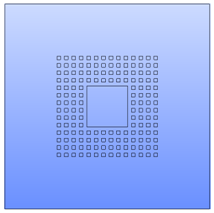 | 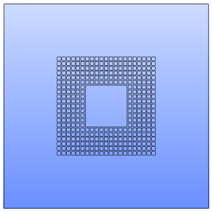 |
© 2018 by the authors. Licensee MDPI, Basel, Switzerland. This article is an open access article distributed under the terms and conditions of the Creative Commons Attribution (CC BY) license (http://creativecommons.org/licenses/by/4.0/).
Share and Cite
MDPI and ACS Style
Bernard, J.; Rodler, A.; Morille, B.; Zhang, X. How to Design a Park and Its Surrounding Urban Morphology to Optimize the Spreading of Cool Air? Climate 2018, 6, 10. https://doi.org/10.3390/cli6010010
AMA Style
Bernard J, Rodler A, Morille B, Zhang X. How to Design a Park and Its Surrounding Urban Morphology to Optimize the Spreading of Cool Air? Climate. 2018; 6(1):10. https://doi.org/10.3390/cli6010010
Chicago/Turabian StyleBernard, Jérémy, Auline Rodler, Benjamin Morille, and Xueyao Zhang. 2018. "How to Design a Park and Its Surrounding Urban Morphology to Optimize the Spreading of Cool Air?" Climate 6, no. 1: 10. https://doi.org/10.3390/cli6010010
Note that from the first issue of 2016, this journal uses article numbers instead of page numbers. See further details here.