Article

Association between Empirically Estimated Monsoon Dynamics and Other Weather Factors and Historical Tea Yields in China: Results from a Yield Response Model

1
Agriculture, Food, and Environment Program, Friedman School of Nutrition Science and Policy, Tufts University, 150 Harrison Avenue, Room 108, Boston, MA 02111, USA
2
Department of Earth and Environment, Boston University, 685 Commonwealth Avenue, Boston, MA 02215, USA
3
Department of Health and Human Development, Montana State University, P.O. Box 173540, Bozeman, MT 59717, USA
4
Department of Chemistry, Pearson Chemical Laboratory, Tufts University, 62 Talbot Avenue, Medford, MA 02155, USA
5
Department of Anthropology, University of Florida, Gainesville, FL 32611-7305, USA
6
Tea Research Institute, Chinese Academy of Agricultural Sciences, Hangzhou 310008, China
7
Friedman School of Nutrition Science and Policy, Tufts University, Medford, MA 02155, USA
8
Department of Biology, Barnum Hall, Room 102, Tufts University, Medford, MA 02155, USA
*
Author to whom correspondence should be addressed.
Climate 2016, 4(2), 20; https://doi.org/10.3390/cli4020020
Submission received: 10 November 2015 / Revised: 23 March 2016 / Accepted: 25 March 2016 / Published: 8 April 2016
(This article belongs to the Special Issue Climate Change on Crops, Foods and Diets)

Abstract

:
Farmers in China’s tea-growing regions report that monsoon dynamics and other weather factors are changing and that this is affecting tea harvest decisions. To assess the effect of climate change on tea production in China, this study uses historical weather and production data from 1980 to 2011 to construct a yield response model that estimates the partial effect of weather factors on tea yields in China, with a specific focus on East Asian Monsoon dynamics. Tea (Camellia sinensis (L.) Kunze) has not been studied using these methods even though it is an important crop for human nutrition and the economic well-being of rural communities in many countries. Previous studies have approximated the monsoon period using historical average onset and retreat dates, which we believe limits our understanding of how changing monsoon patterns affect crop productivity. In our analysis, we instead estimate the monsoon season across China’s tea growing regions empirically by identifying the unknown breakpoints in the year-by-province cumulative precipitation. We find that a 1% increase in the monsoon retreat date is associated with 0.481%–0.535% reduction in tea yield. In the previous year, we also find that a 1% increase in the date of the monsoon retreat is associated with a 0.604% decrease in tea yields. For precipitation, we find that a 1% increase in average daily precipitation occurring during the monsoon period is associated with a 0.184%–0.262% reduction in tea yields. In addition, our models show that 1% increase in the average daily monsoon precipitation from the previous growing season is associated with 0.258%–0.327% decline in yields. We also find that a 1% decrease in solar radiation in the previous growing season is associated with 0.554%-0.864% decrease in tea yields. These findings suggest the need for adaptive management and harvesting strategies given climate change projections and the known negative association between excess rainfall and delayed monsoon retreat on tea quality and yield.

Graphical Abstract

1. Introduction

Understanding the impact that climate change has on tea crops (derived from the plant Camellia sinensis (L) Kuntze) is critical given the significance of the product to human societies and cultures globally. Tea is the most consumed beverage in the world after water and is an important economic engine for rural communities in many countries [1]. Camellia sinensis is an evergreen perennial shrub that produces leaves that are used to make a variety of tea types including green, black, white, and oolong. In 2012, 4.6 million tons of it were produced in 50 countries worldwide [2]. Tea is grown predominately in Southeast Asia, Eastern Africa, and in parts of Latin America and can be grown in a variety of ecosystems from 49°N to 30°S and from sea level up to 2700 m in altitude [3]. In China and India, the top two global tea producers, 80 million and three million rural laborers, respectively, are involved in tea production or processing [4,5].
Camellia sinensis (hereafter referred to as tea) has been found to have health benefits when consumed regularly. For example, some epidemiological studies have found tea consumption to be associated with a lower risk of developing Type 2 Diabetes, cardiovascular disease, cognitive impairment, depressive symptoms, and reduced incidence of cold and flu symptoms [6,7]. One recent meta-analysis found a statistically significant decrease in lung cancer risk in people consuming green tea [8]. A literature review of the association between tea consumption and cardiovascular disease found a dose response association on the incidence of mortality from stroke [9]. These health benefits are attributed to the chemicals contained in tea. Flavonoids, L-theananine, caffeine, and nonproteinic amino acid have known health benefits and make up between 25% and 35% of tea’s fresh weight [10,11].
The quantity of these chemicals in tea is highly dependent on the prevailing climate conditions where tea production occurs [12,13]. These chemicals, in turn, drive both harvesting and consumption decisions. For example, teas harvested in Southern Yunnan Province, China before and after the onset of the East Asian Monsoon exhibited dramatic changes in secondary metabolite chemistry [14,15,16]. According to research on tea production in Australia, tea shoot growth favors warm and rainy conditions that prevail during the season of heaviest rainfall. However, it is during slow growth periods when there is less rainfall that shoots are plucked because leaves accumulate greater secondary metabolites that drive quality [17]. Farmers interviewed in Yunnan China confirm this finding; they believe tea quality varies by season and is especially affected by the arrival date of the East Asian Monsoon [18]. Another study in a controlled greenhouse environment found that tea grown with higher water availability had significantly lower concentrations of epigallocatechin 3-gallate, a flavonoid found in many teas that helps to drive quality of the consumable product [19]. Clearly, the monsoon rainfall plays a key role in plant growth and quality and harvesting decisions. This serves as a key motivating factor for the analysis in this paper.
Our analysis is also motivated by the fact that precipitation, temperature, and surface radiation patterns have already significantly changed across China’s tea growing regions over the last half century. One study reports that rainfall has increased 20 to 60 mm per decade since 1950 in southern and southwestern China [20]. This increase has come in the form of fewer rain days but more intense rain events, which can be detrimental to agricultural crops [21]. The number of days per year with a daily maximum temperature of 35 °C or greater has increased during the past 50 years as well [21]. Wild (2005) also found that solar radiation has been increasing across China since 1990 [22].
These climatic changes have also already had an impact on agricultural production, including tea, in China according to recent research. Using simple pairwise correlations and trend analysis one study found that changes in temperature and precipitation between 1981 and 2000 resulted in declining yields for rice, wheat, and maize across China [23]. For tea, rising temperatures in tea growing regions of China have been found to result in later spring freezes which can severely impact tea growth and development [24]. Changes in prevailing weather patterns are expected to continue across China in the future according to various climate change projections. The 2014 Intergovernmental Panel on Climate Change (IPCC) found that mean surface temperatures in China are expected to increase between 2 °C and 5 °C over the next century [25]. The number of extreme warm temperature events across China are expected to increase significantly over the same time period even in the most conservative global warming scenarios [26]. The IPCC also concludes that future climatic changes will increase East Asian Monsoon precipitation via an earlier monsoon onset and a delayed retreat across much of southwestern China [27]. All of this suggests the need for continued research quantifying the impact of weather factors on agricultural yields. These types of analyses provide critical information for predicting the impact that climate change will have on agricultural production, farmer livelihoods, and food security outcomes for the global population.
The link between climate and tea production has been studied in detail in some parts of the world and in field-scale experiments [17,18,19,28]. However, no study to date has typified this association on a large scale or specific to the Chinese context. To fill this knowledge gap the present study assesses how historical climate changes in China are associated with tea yields using a yield response model. A yield response model uses Ordinary Least Squares (OLS) linear regression to model yield as a function of various exogenous weather factors. Our analysis focuses on quantifying the association between the East Asian Monsoon onset, duration, and retreat and tea yields. We also examine how other weather factors are associated with tea yields, including minimum temperatures, precipitation before, during and after the estimated monsoon period, and solar radiation. Previous large to medium scale studies employing yield response or Ricardian analysis techniques have focused on staple crops like corn and rice, as well as on fruits and vegetables, but none have examined tea [29,30,31,32]. There are a variety of other statistical methods not used in this paper to identify the contribution of climate change to crop yield variation and these are discussed in some detail in [33].
Our analysis is novel because unlike previous studies examining the relationship between monsoon dynamics and agricultural yields, which have assumed the monsoon is stationary over time, we estimate the actual monsoon onset and retreat empirically [29]. As noted before, the timing of rains, at least anecdotally, is important to Chinese tea productivity and management decisions. Studies of other agricultural crops also confirm this association between timing of rainfall and yields and that the onset of seasonal rains may not be stationary because of a changing climate conditions [34,35]. As such we hypothesize the monsoon period to be non-stationary over the study period and so the onset and retreat should be estimated empirically. To do this we find the break-points in the linear daily year-by-province cumulative precipitation function to arrive at approximate East Asian Monsoon onset and retreat dates for the study period in the tea growing provinces of China [36,37]. This method provides new insights into how climate change affects tea yields through changes in the timing of seasonal rains. We hope the application of this technique more accurately captures how monsoon and seasonal dynamics affect crop productivity in tropical and subtropical regions globally.
The primary unit of analysis in the present study is the Chinese province. Chinese provinces are relatively large geographical regions, which does present some inferential limitations to our study. Nevertheless, this study is an important contribution to the examination of the relationship between Chinese tea yields and weather patterns, especially with respect to the timing of the monsoon season. Additionally, understanding at a large-scale the association between weather and yields is, in its own right, important for policymaking purposes and for informing farm management practices in a broad sense. We also hope the methodology in this study will spur future analyses of Chinese tea production at the sub-province level since data limitations currently preclude that level of detail. We will discuss this limitation further in later sections of this paper.
We use general bounds of acceptable temperature and precipitation for tea to develop our analytical model. Camellia sinensis varieties achieve optimal growth with maximum daily temperatures between 20 °C and 30 °C and can continue to grow without risk of serious heat stress up to 35 °C [38]. Minimum temperatures should remain above −10 °C for optimal growth and can reach -20 °C without causing irreversible damage [28,38]. In the spring, bud bursting, leafing, and flowering occur when the mean maximum daily temperature is above 10 °C [38,39]. In general, extreme minimum temperatures are detrimental to tea growth [40]. Temperatures in the spring are particularly important for tea quality and yields and in recent years late spring frosts have caused significant financial loss for Chinese tea farmers [24,40,41].
The annual rainfall needed for optimal growth is 1500–2000 mm [5,42]. However, as noted in Carr (1972), the distribution of rainfall over the course of a growing season is as important to tea growth as total rain accumulation [28]. A relatively old study showed that rainfall during the early part of the growing season had a greater positive impact on yield than precipitation falling during the rainy season [43]. There are also reports that rains in excess of 5000 mm per year could affect tea growth success [28]. More generally, additional research has found that extreme rainfall can negatively affect tropical plant growth and development [19,44]. However, the upper threshold of rainfall (daily or at other temporal scales) has not been definitively ascertained according to our search of the literature. In this regard, our study helps to address this particular knowledge gap, albeit at a very aggregated geographic scale.
Finally, we also consider the relationship between solar radiation and tea yields. Solar radiation provides energy for plants to photosynthesize and grow [45]. Further, as noted earlier, recent evidence suggests that solar radiation is changing over China and this change could have an impact on tea yields [22]. As such, solar radiation its own right an important factor to consider in the assessment of weather factors and tea yields.

2. Experimental Section
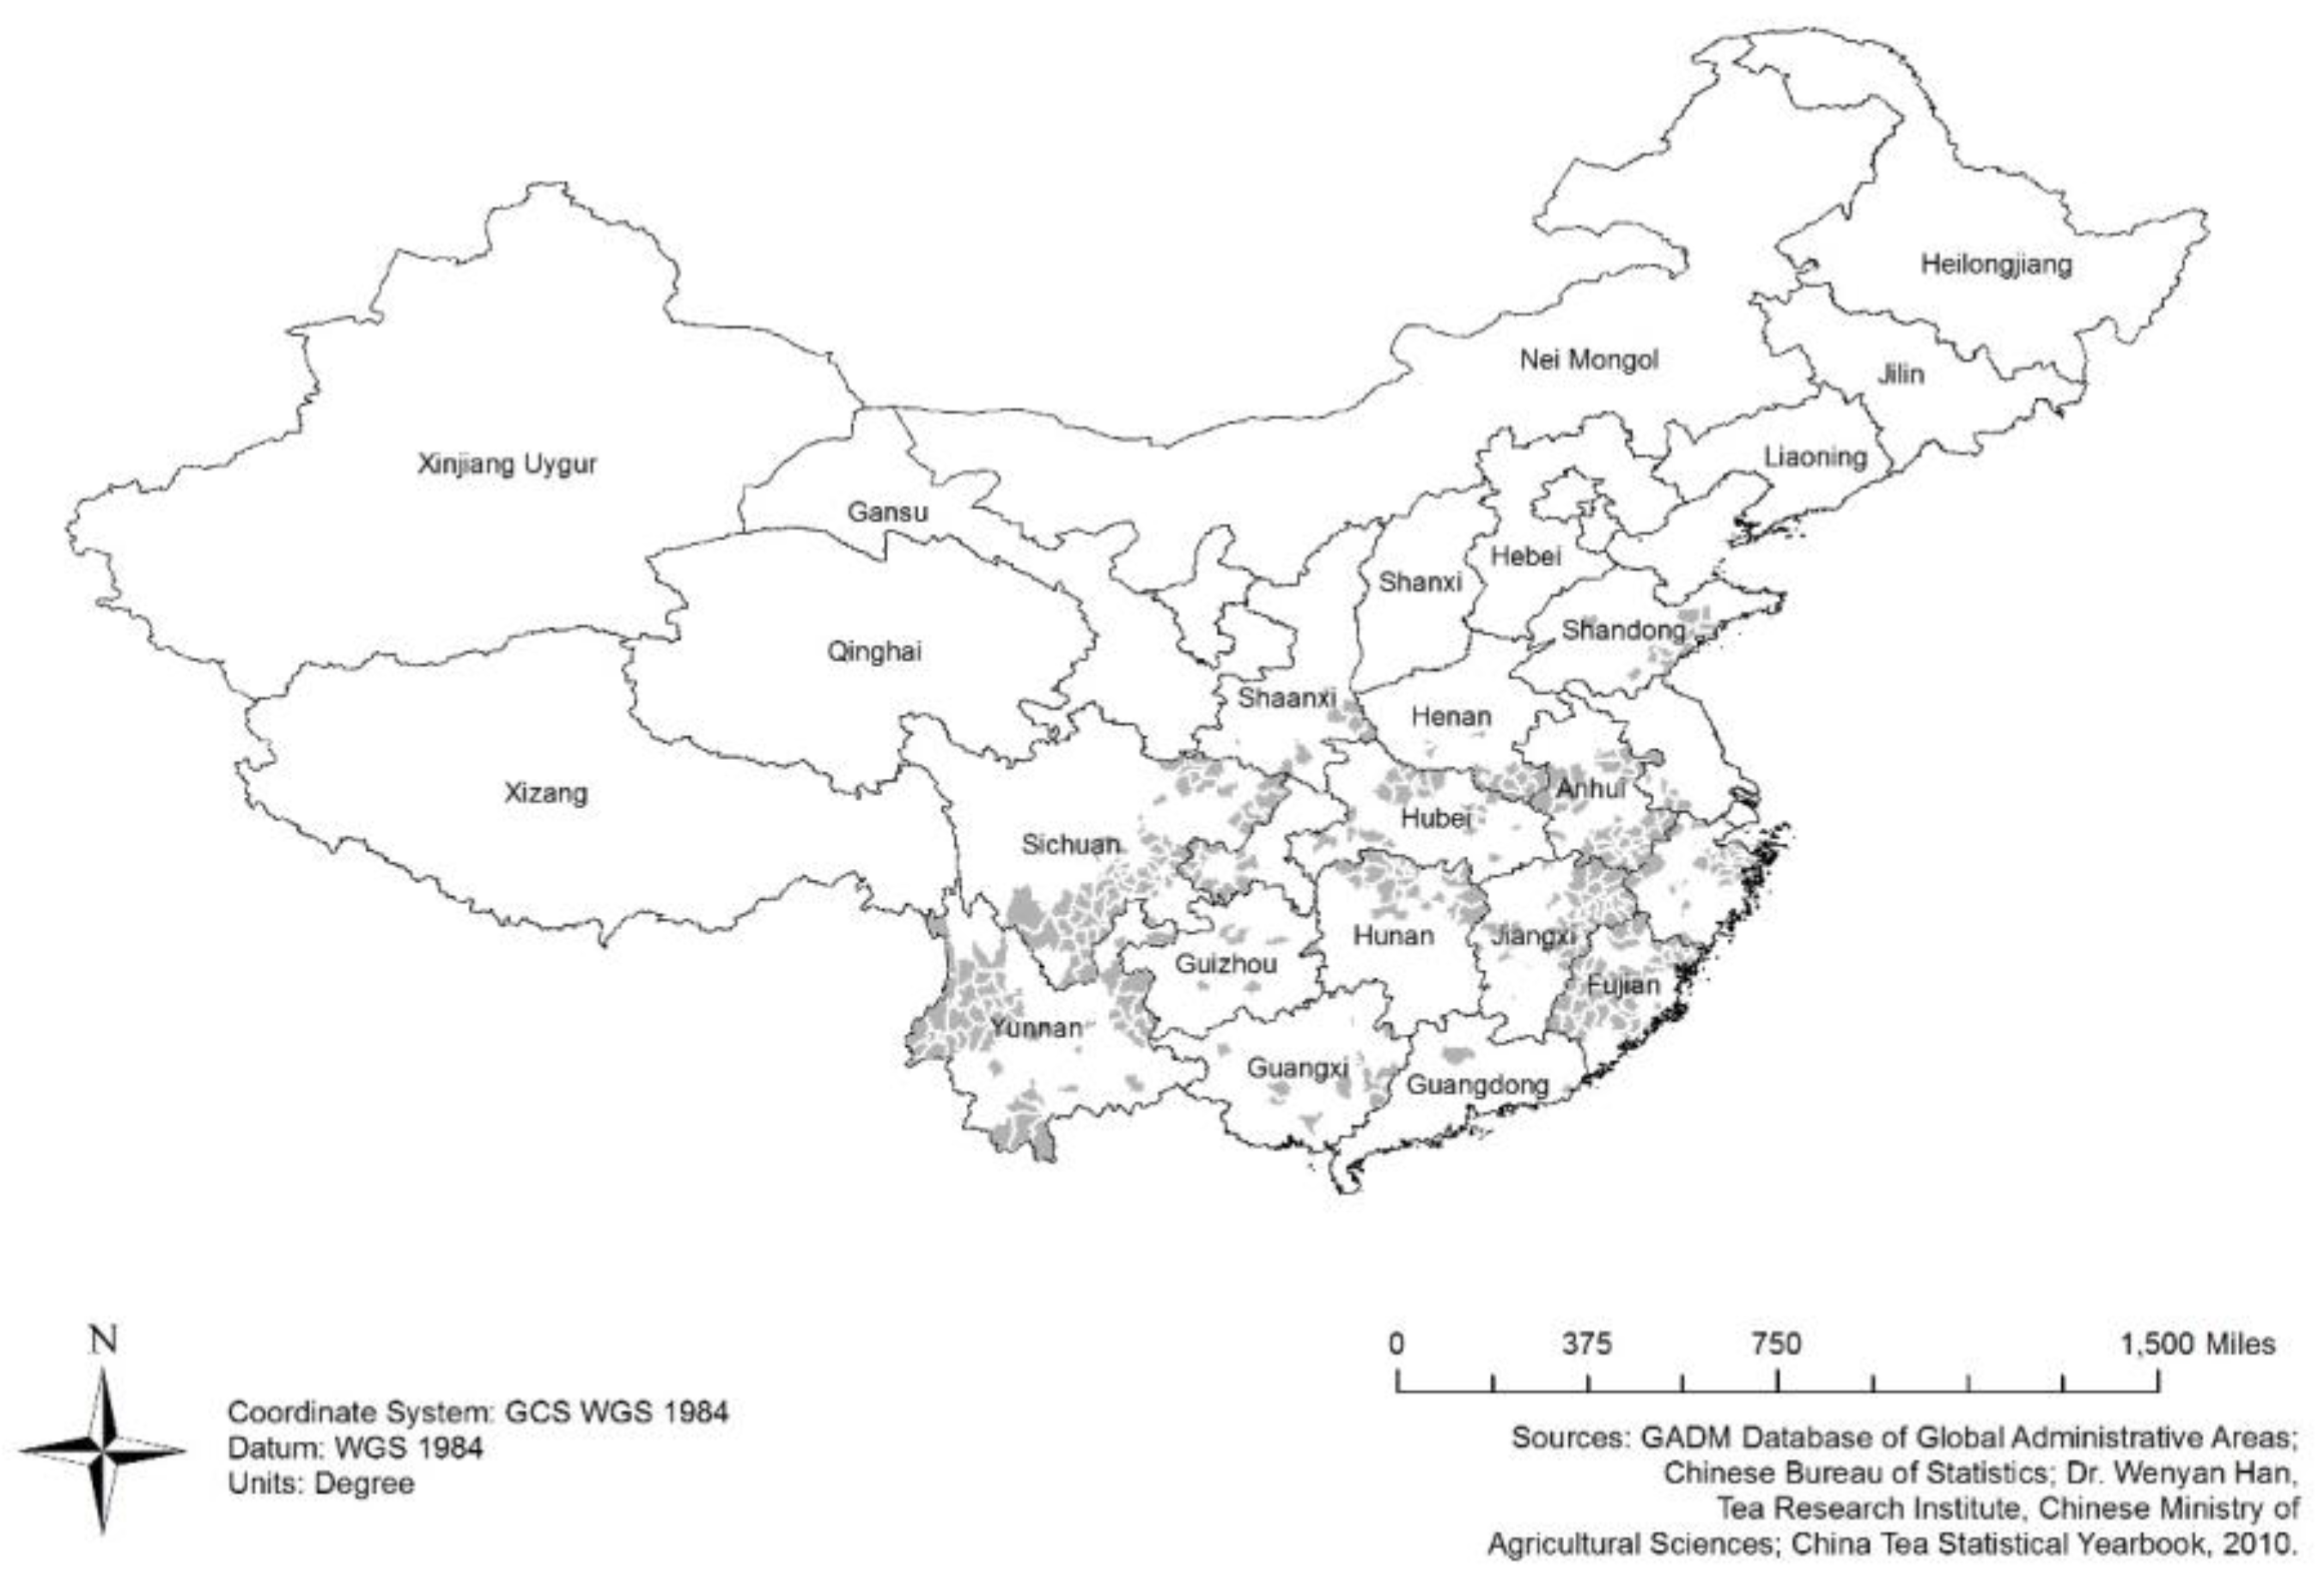
2.1. Data Sources

The principal climate dataset used in this investigation is the Modern Era-Retrospective Analysis for Research and Applications (MERRA) product [46] developed by the National Aeronautics and Space Administration (NASA), which we chose because of the consistency and frequency of its coverage (both spatially and temporally) over the time period of interest. In particular, the dataset provides climate data at approximately the same spatial scale—0.50 × 0.66-degree resolution in the meridional and zonal direction, respectively—as the yield data we are analyzing (see below) and as such is more relevant than station-based data for characterizing the environmental conditions across tea-growing regions, particularly at daily time-scales [47] and over complex topography during the warm season [48,49]. For this analysis, we archived the hourly surface fields, in particular temperature, precipitation, evaporation, specific humidity, and solar radiation, which we then subsequently aggregated into daily quantities prior to our analysis. We chose these fields because of their integral and generalized influence on agricultural yields. It should be noted that although in situ and satellite-derived observations are incorporated into the reanalysis procedure, the surface fields also tend to be influenced by the atmospheric model (Goddard Earth Observing System Data Assimilation System Version 5 GEOS-5), which adjusts them to dynamically match the overlying atmosphere. Therefore, these variables should be considered a blend of both observational and simulated values. Generally, the MERRA-based climate estimates are comparable to, or better than, other standard reanalysis products, particularly when considering daily-scale correlations with observed precipitation events—both globally and over subregions of China [48,50,51]—that are required for determining the onset and retreat of the monsoon from a given region. That said, subsequent to our analysis (and submission of the results for publication), an updated, post-processed MERRA-based product [51] was released; while inclusion of this revised data could further refine the results discussed herein, we felt that such a data-sensitivity analysis should be reserved for another paper.
Data on annual total province tea output and harvested area were collected from annual statistical yearbooks published by the Chinese National Statistical Bureau and accessed through the University of Michigan China Data Center Online, available at http://chinadatacenter.org/ [52]. While we understand there is some uncertainty in the quality of the yield data we did speak with a senior researcher at the Chinese Tea Research Institute regarding data quality. Based on his review of the data we are reasonably certain that data are accurate overall with some acceptable margins of error [53]. We also started our analysis after major government economic reforms in China, which we believe reduces the amount of potential bias in the yield data collected.
Tea producing counties were identified within each province using qualitative information from the 2008 to 2010 Chinese Tea Industry Statistical Yearbooks, published by the Chinese Ministry of Agriculture [52]. ArcGIS 10.1 [54] was used to average continuous climatic variables over tea-producing counties in each province.
As noted in the introduction, sub-provincial yield data were not available in sufficient quantity and quality in order to conduct a comprehensive analysis at a finer level of resolution than we do here. The availability of more disaggregate yield data for this type of analysis would allow us to include additional non-weather production factors in our modeling as well additional variables representing the frequency of extreme weather events. Production factors of interest include tea production inputs such as fertilizers, pesticides, and labor, water use practices (i.e., irrigation) and soil quality indicators. While these production factors are important predictors of yield, we did not believe these should be incorporated into the aggregate level of analysis we conducted. Instead, our analysis focuses on how major weather patterns affect aggregate yields at the provincial level. This analysis provides for a better understanding of how major weather patterns, in particular monsoon dynamics, are associated with tea yields irrespective of management decisions. Understanding the association between prevailing weather patterns and crop yields is important in its own right given what we know about the effect that climate change has had and will continue to have on these patterns.

2.2. Methods and Statistical Analysis

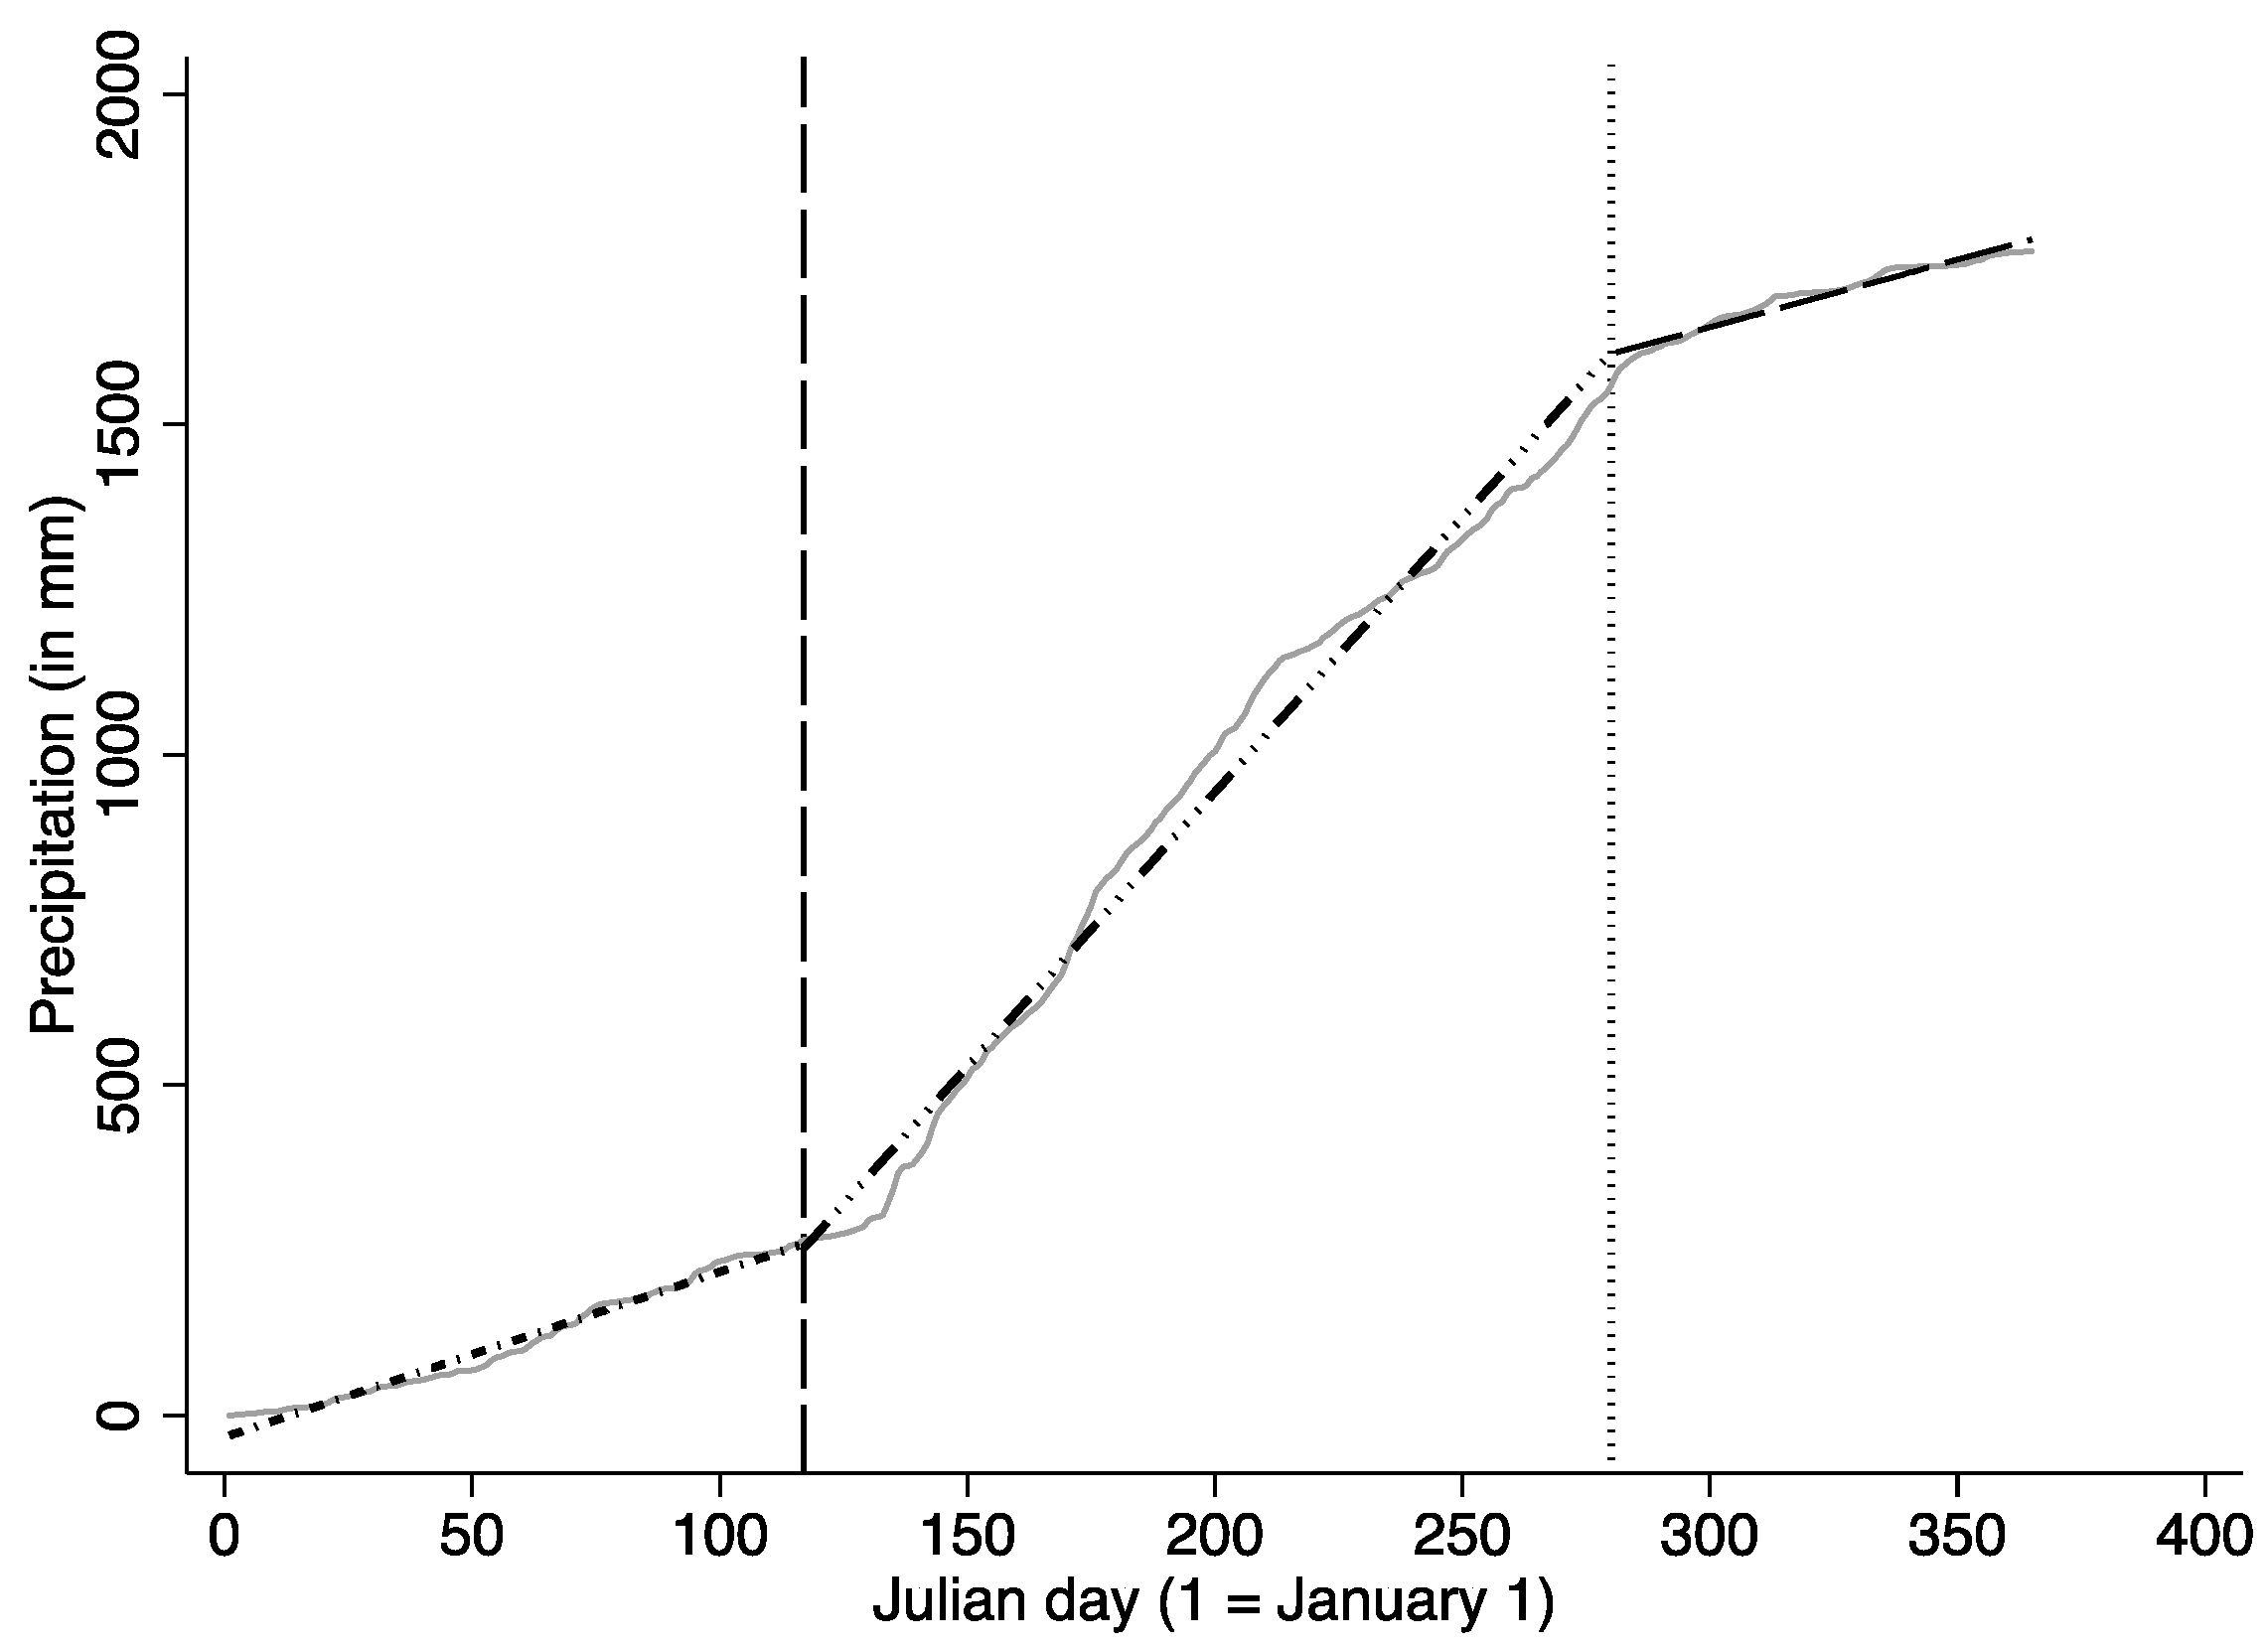
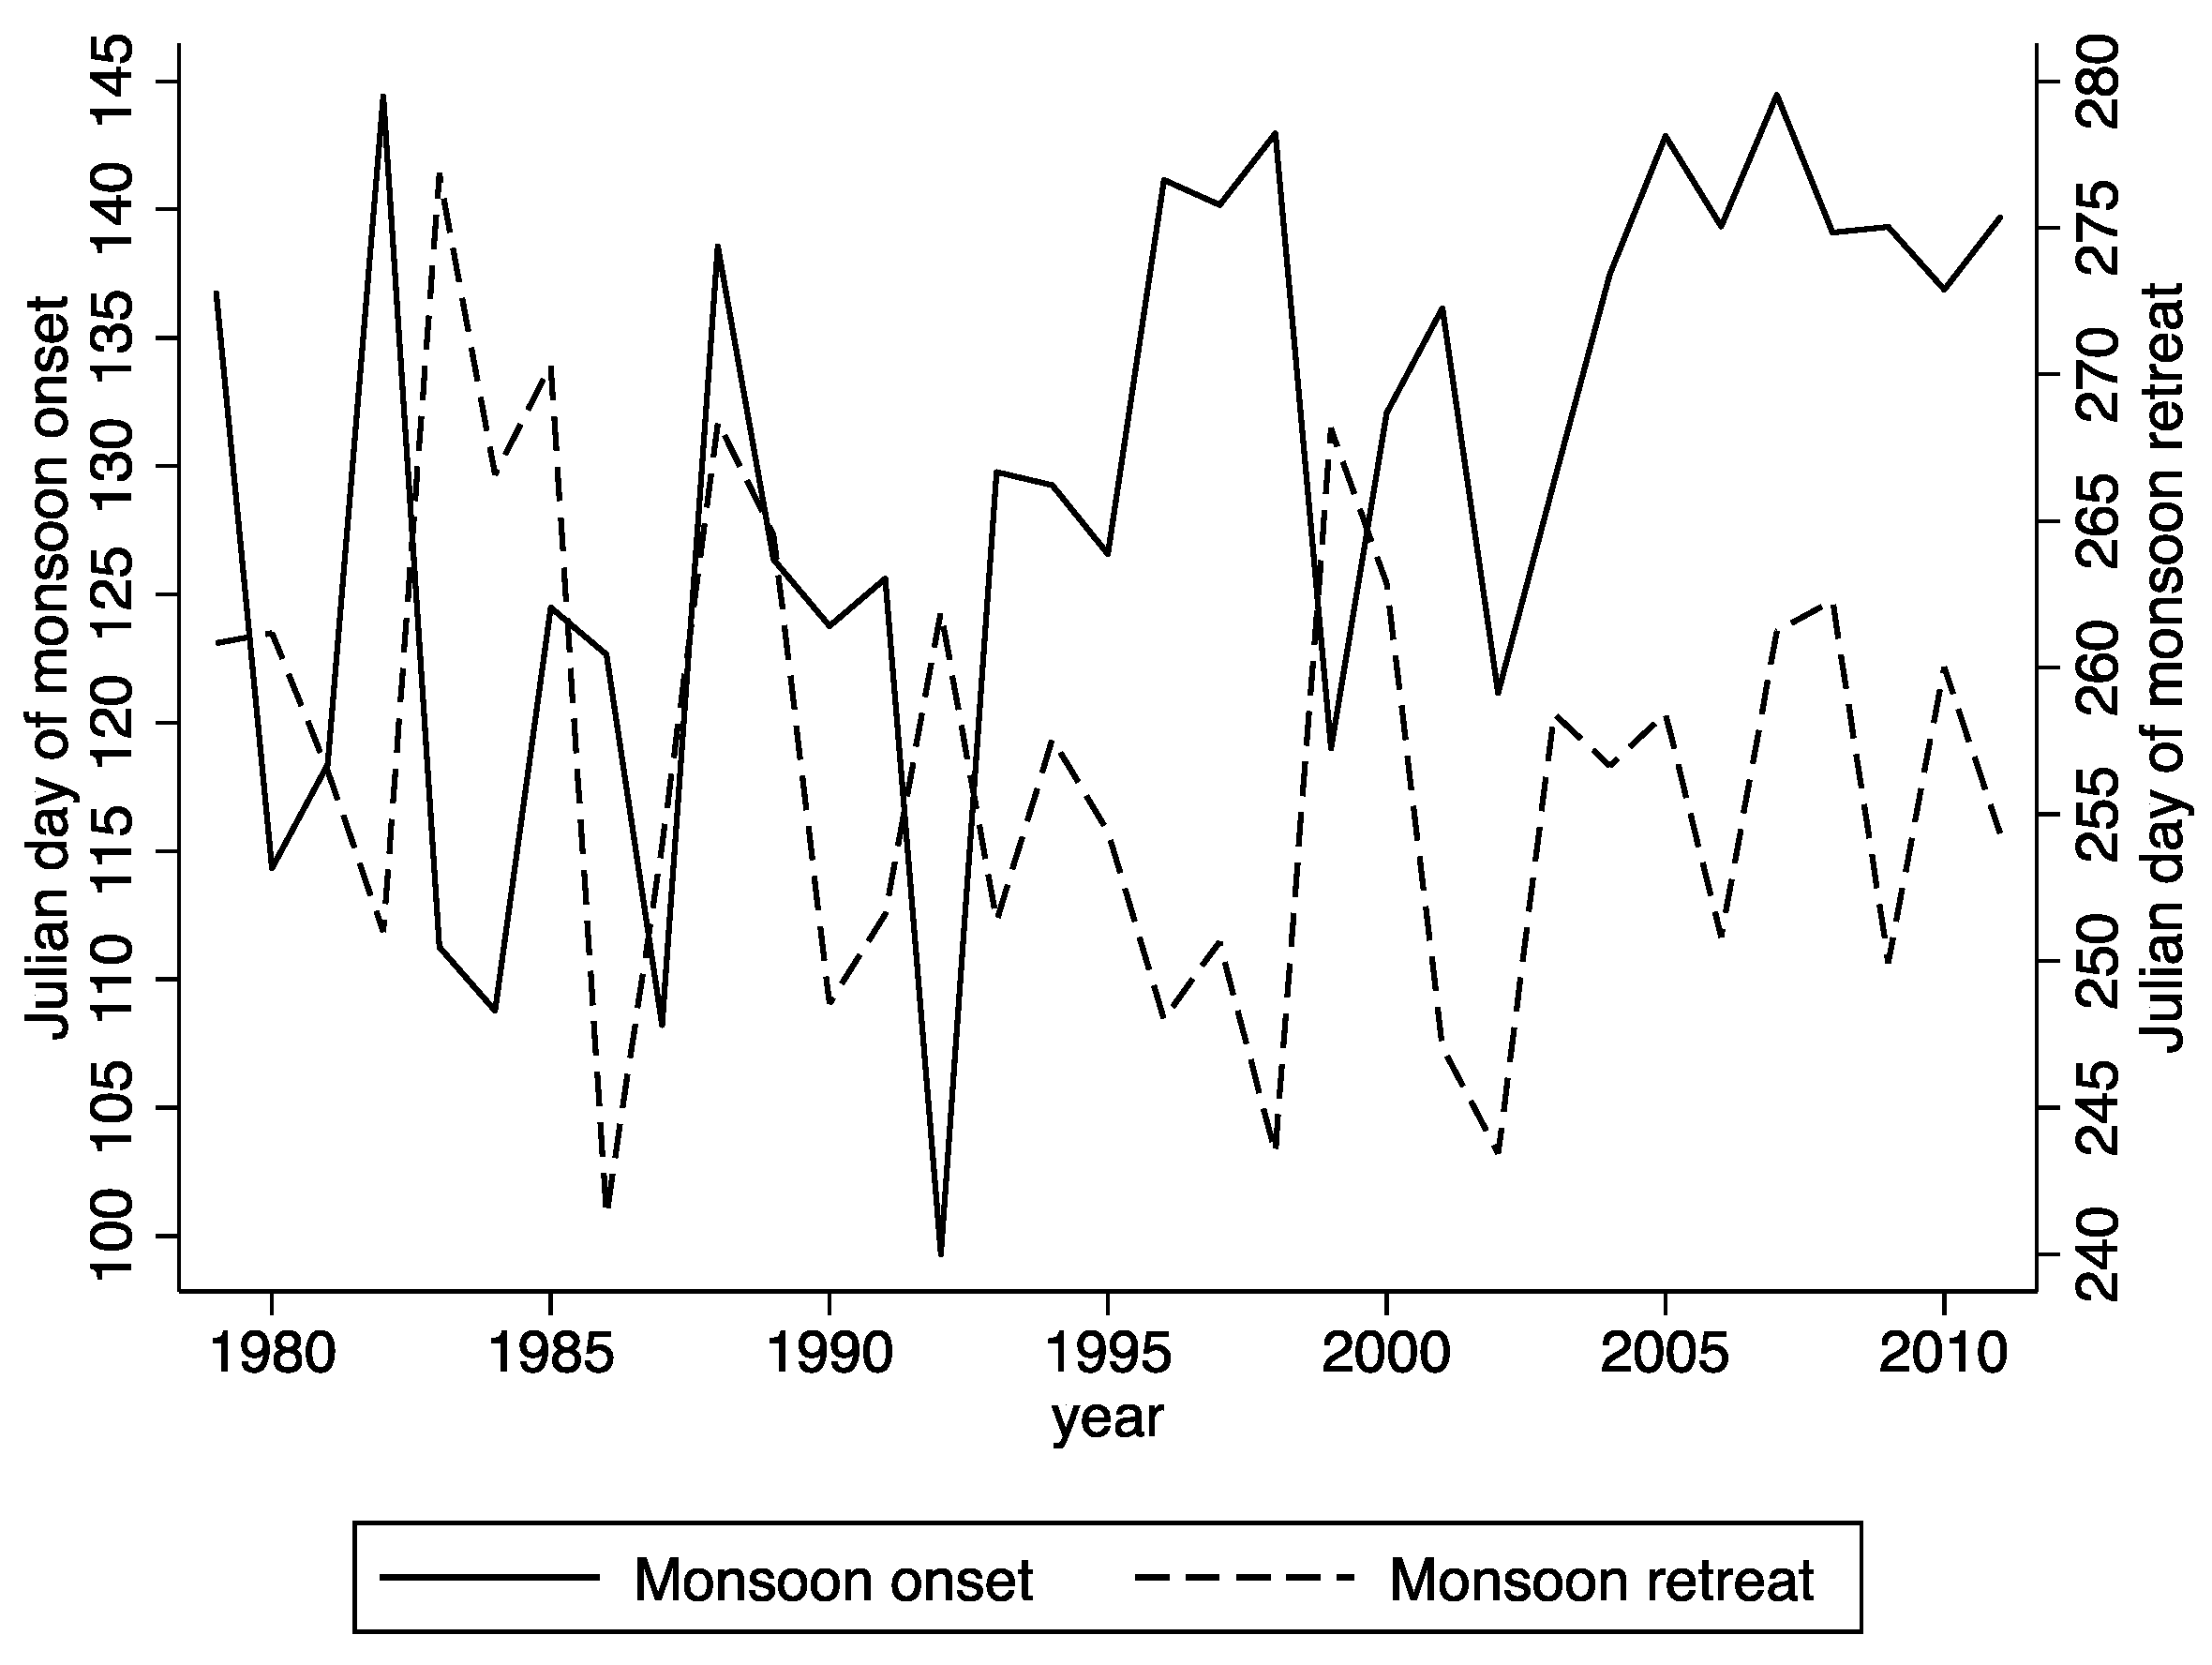
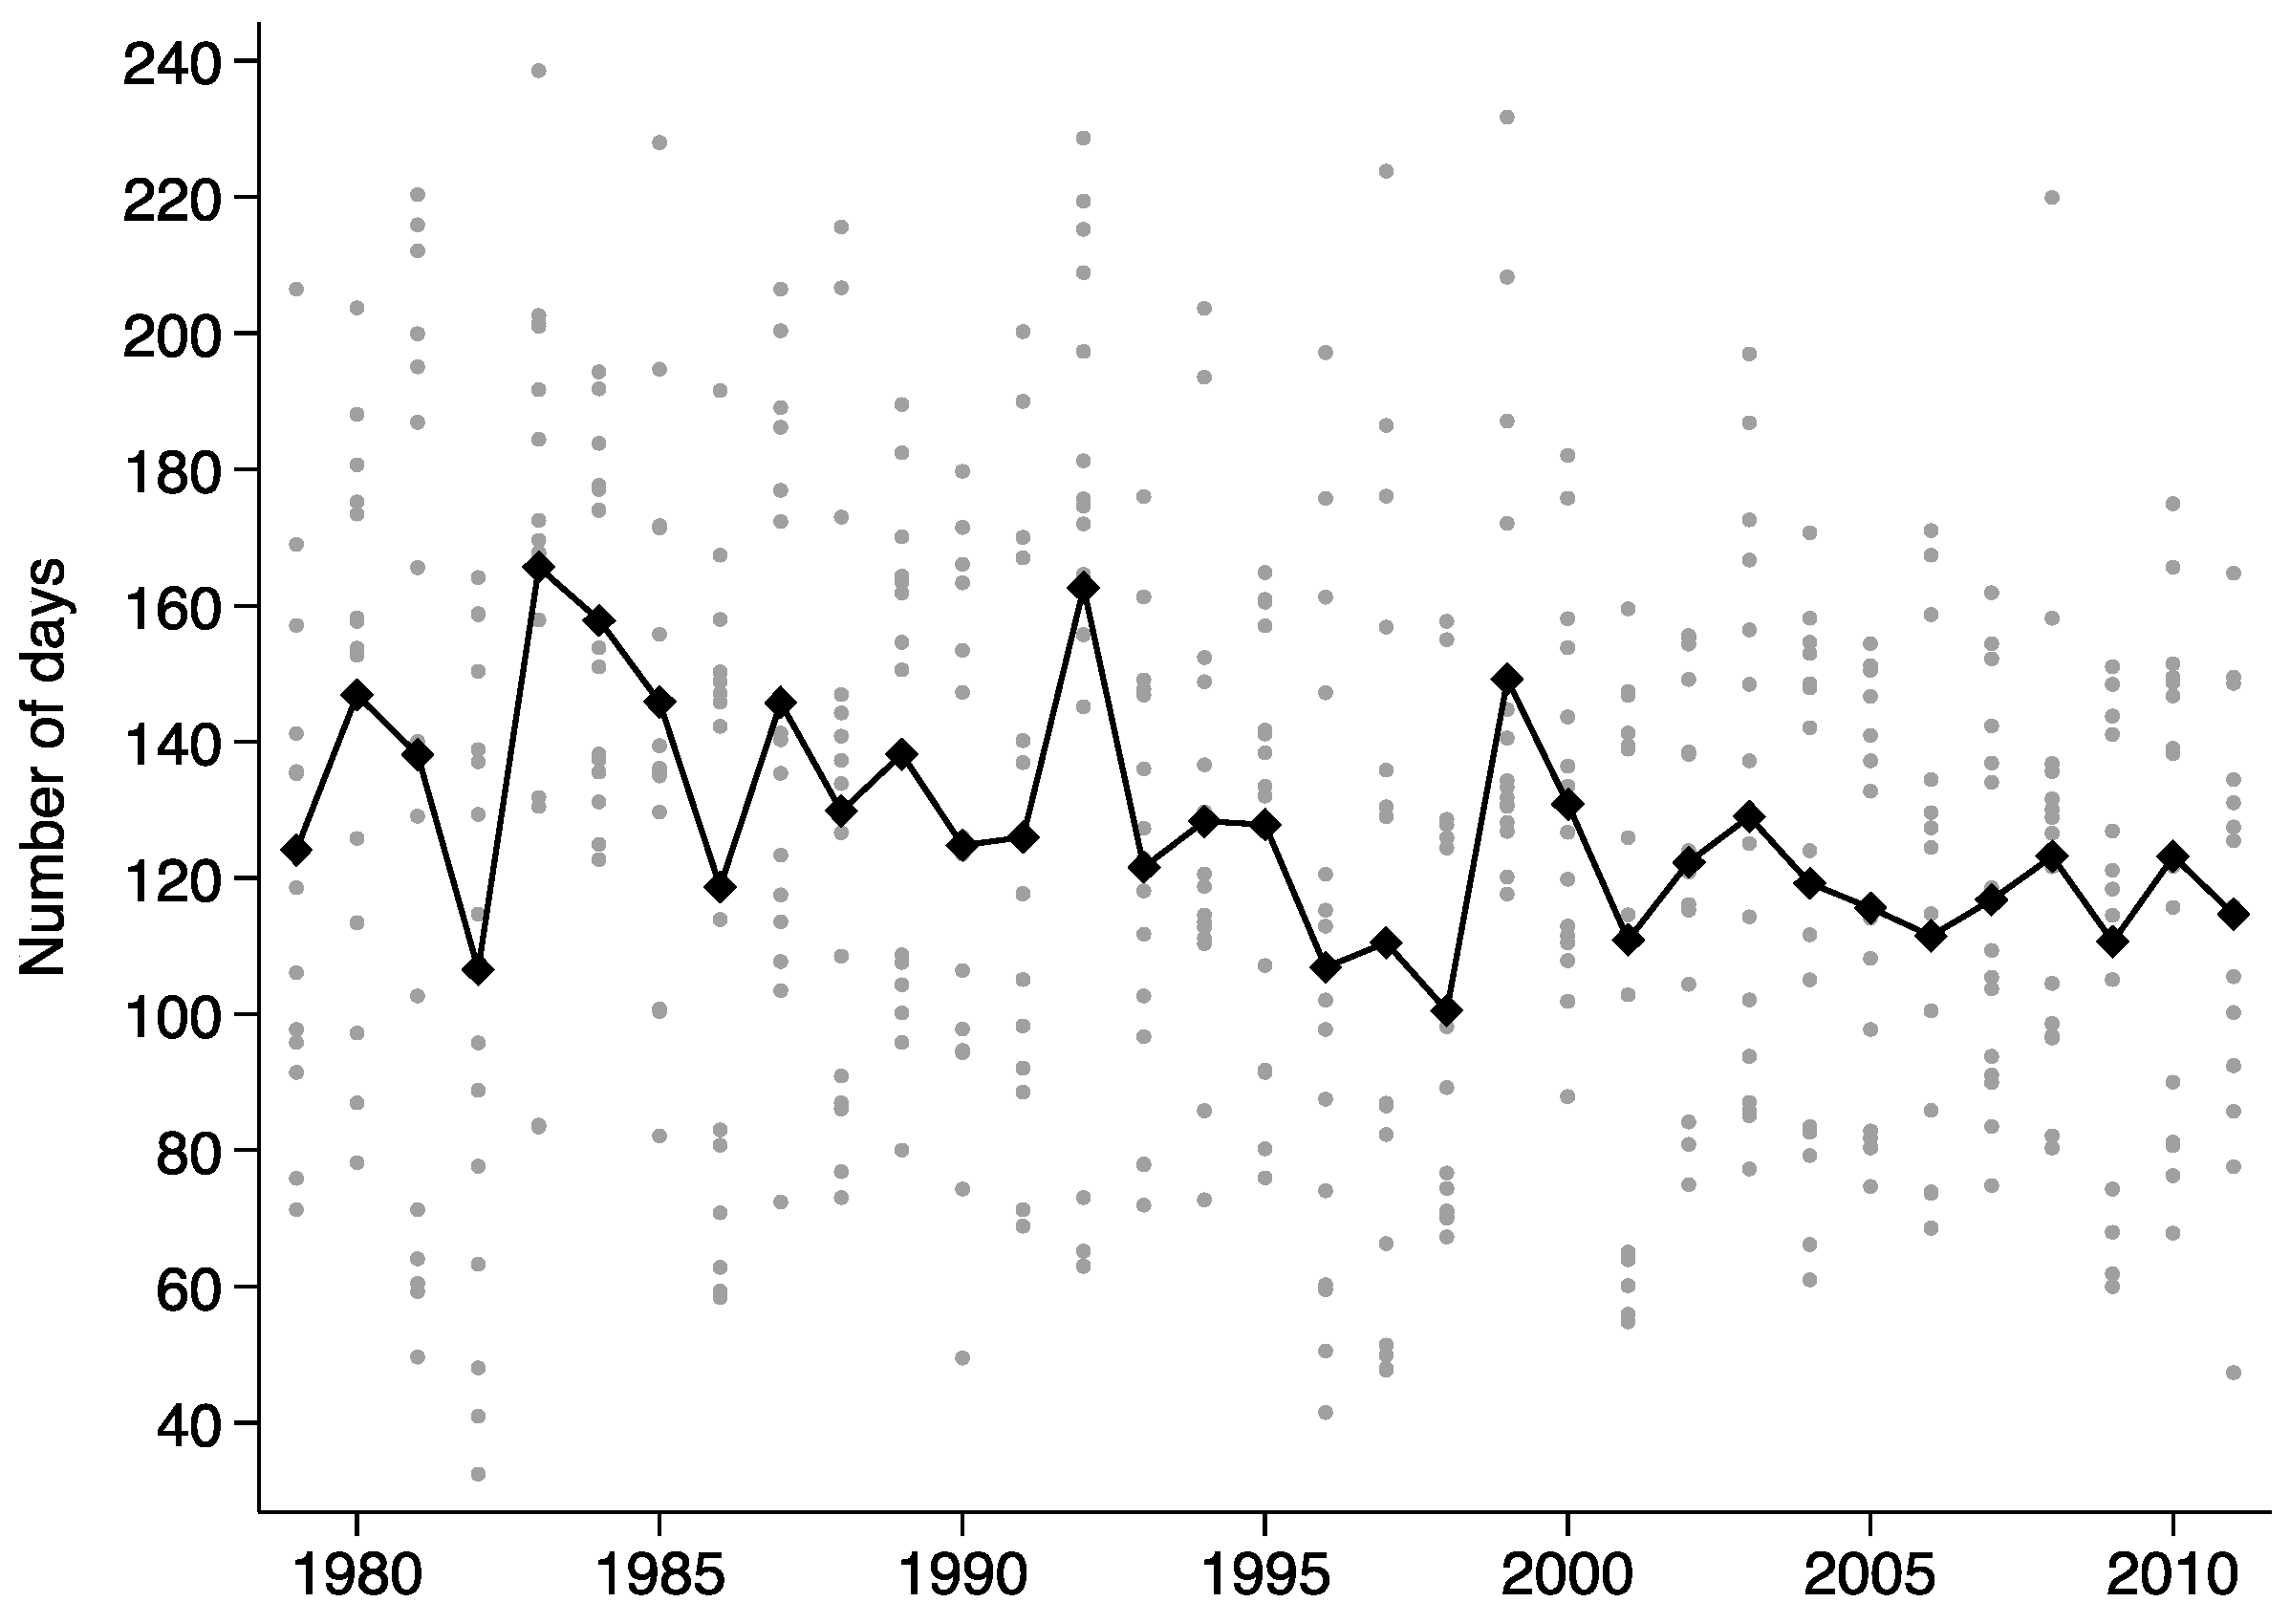
2.2.1. Monsoon Onset and Retreat Estimation and Weather Variable Construction

We estimate the monsoon for the years 1980–2011 by examining the break points in the slope of the cumulative precipitation function for each province in each year. Cook and Buckley (2009) provide the theoretical framework for this method [37]. Figure 1 provides an illustration of how unknown breakpoints in each cumulative precipitation function are determined using this method [37]. We used the “Segmented” package in R, an open source statistical software package [55] to estimate each breakpoint in the cumulative precipitation function. The “Segmented” package estimates the number of times a linear function’s slope changes and then estimates the points at which this slope change occurs [36]. Since we know that the rate of precipitation changes with the onset and retreat of the East Asian Monsoon we used “Segmented” to find the point at which the cumulative precipitation function slope significantly changes during the course of one year in each province. In order for the algorithm to estimate the function breakpoints the program requires seed values. The historical average East Asian Monsoon onset and retreat dates for the fifteen provinces under examination here are used for this purpose [56]. Other methodologies exist for estimating the onset and retreat of the monsoon season or rainy season and these are discussed in greater detail in [35].

2.2.2. Regression Methods

We use OLS regression to conduct our analysis. Our yield response model is based on the model used in Auffhammer et al. (2006) and (2012) [29,57] and is specified as follows:
ln ( y i t ) =   p i +   β Χ i t + t +   ε i t
where y i t is the yield in province i in year t in tons per hectare; and p i is the province fixed-effects term to account for unobservable provincial factors affecting tea yield [29,57]. This fixed-effect term is important because we do not account for non-weather factors that might explain the difference in yields across provinces. These factors include soil quality, labor, fertilizer, or pesticide use. This limitation is described in more detail in the discussion and conclusion section. Χ i t is a vector of weather variables including monsoon characteristics such as onset, retreat, and duration; β are parameter estimates for each weather variable; t is the time trend to account for a linear change over time in yield due to technological advances; and ε i t is the error term. Both the fixed-effects and time trend terms are standard econometric methods for accounting for unobservable factors that may influence the estimates of each β [58].   Χ i t also contains one-year lags for each weather variable in some of our models. Lagged weather variables account for the fact that tea is a perennial crop and harvests in the current year may be impacted by weather in the previous year. The construction of weather variables contained in Χ i t is described in detail in Table 1. All variables are transformed with the logarithmic function so that they can be interpreted as elasticities and because the functional form of these variables is inherently logarithmic in nature. The panel is strongly balanced and fifteen tea-producing provinces are included in the analysis, which are shown on the map in Figure 2. These provinces include Guangxi, Jiangsu, Shandong, Shaanxi, Guizhou, Fujian, Yunnan, Sichuan, Anhui, Hubei, Henan, Hunan, Zheijiang, Jiangxi, and Guandong.
We construct precipitation and temperature variables using the three seasons based on the empirically derived monsoon period described earlier. These three seasons include the pre-monsoon, monsoon, and post-monsoon period. Because climate change has been reported to alter the timing of the East Asian Monsoon we believe this alternative approach to defining seasons may have more predictive power than using historical onset and retreat dates. Average daily pre-monsoon or spring temperatures are important for tea bud bursting, so we include a variable representing the pre-monsoon average daily minimum temperature in our model [38]. We also include the average daily minimum temperature during the monsoon period since minimum temperatures during this period have an interactive effect with precipitation on tea plant growth [28]. We use minimum instead of maximum temperatures across all our models because we also wanted to assess the relationship of surface radiation in our analysis. Average daily surface radiation (W/m2) and average daily maximum temperatures are more highly correlated than solar radiation and average daily minimum temperatures. Thus, we use surface radiation as our measure of daily sunlight and heat exposure rather than average daily maximum temperatures. We include in our analysis a variable representing average daily precipitation during all three estimated seasons since rainfall is such an important driver of tea yields [19]. We did not construct or use variables representing extreme weather events (i.e., high heat days, extreme rain days, etc.) in our models because of the spatial resolution of our analysis. Because we spatially averaged each of the climate variables over relatively large geographic areas (i.e., the province), the frequency of weather anomalies would be extremely small and not affect the results of our analysis.
We specify four separate models to examine the effect of monsoon dynamics, temperature, solar radiation, and precipitation on tea yields since these variables are key drivers of tea yield and quality and have been changing over time in China as discussed earlier. In Model 1, we regress yield on the monsoon onset and retreat dates and other contemporaneous weather variables. We start with this simple model to show how yield is associated with the key contemporaneous weather variables of interest as noted in the introduction. In Model 2, a first-order lag model, we add the previous year’s weather variables to Model 1. Because tea is a perennial crop we hypothesize that previous year’s weather conditions are associated with current the current year’s yields and this has not been tested empirically to our knowledge. In Model 3 we regress yield on monsoon duration and the contemporaneous weather variables, while in Model 4 we add the previous year’s weather variables to Model 3. Compared to Models 1 and 2 these models allow us to understand how the monsoon duration, instead of the date of onset and retreat entered separately into these models, is associated with yield.
We considered other model specifications including those with more lag terms (i.e., 3, 5, 10-year weather variable lags) and a one-year yield lag since tea is a perennial crop. However, these terms did not improve the fit or explanatory power of our models.

3. Results and Discussion

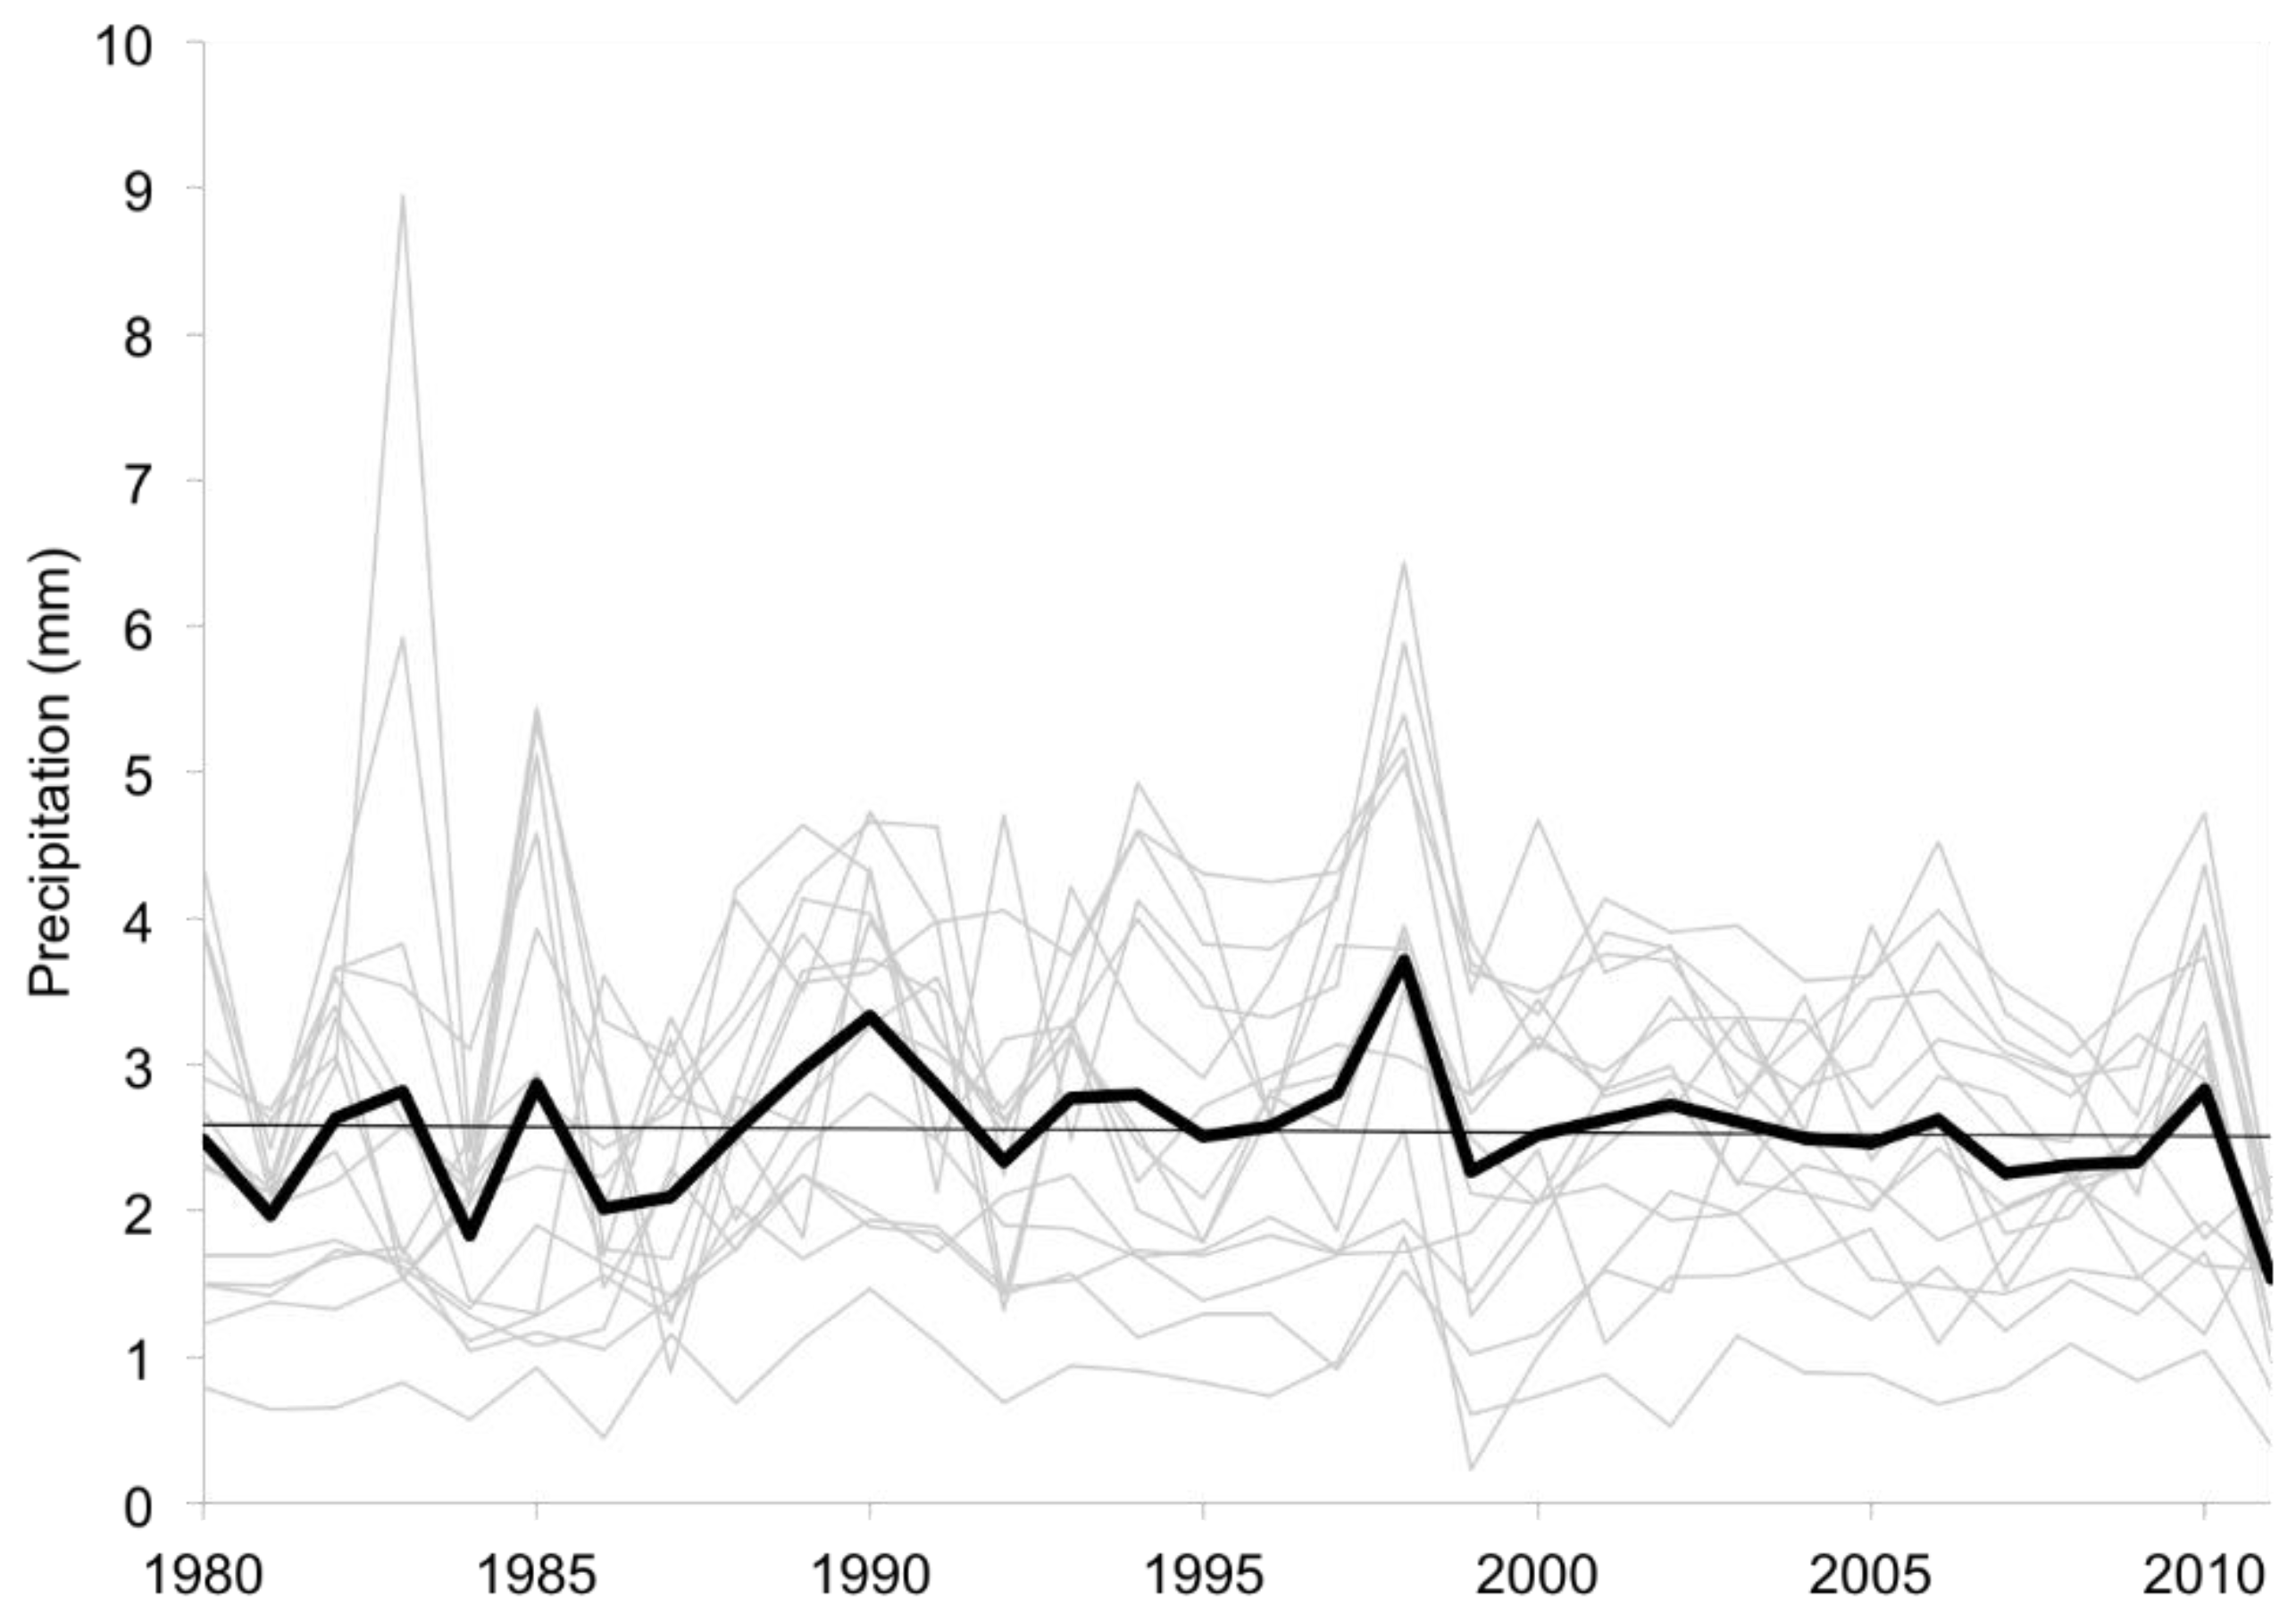
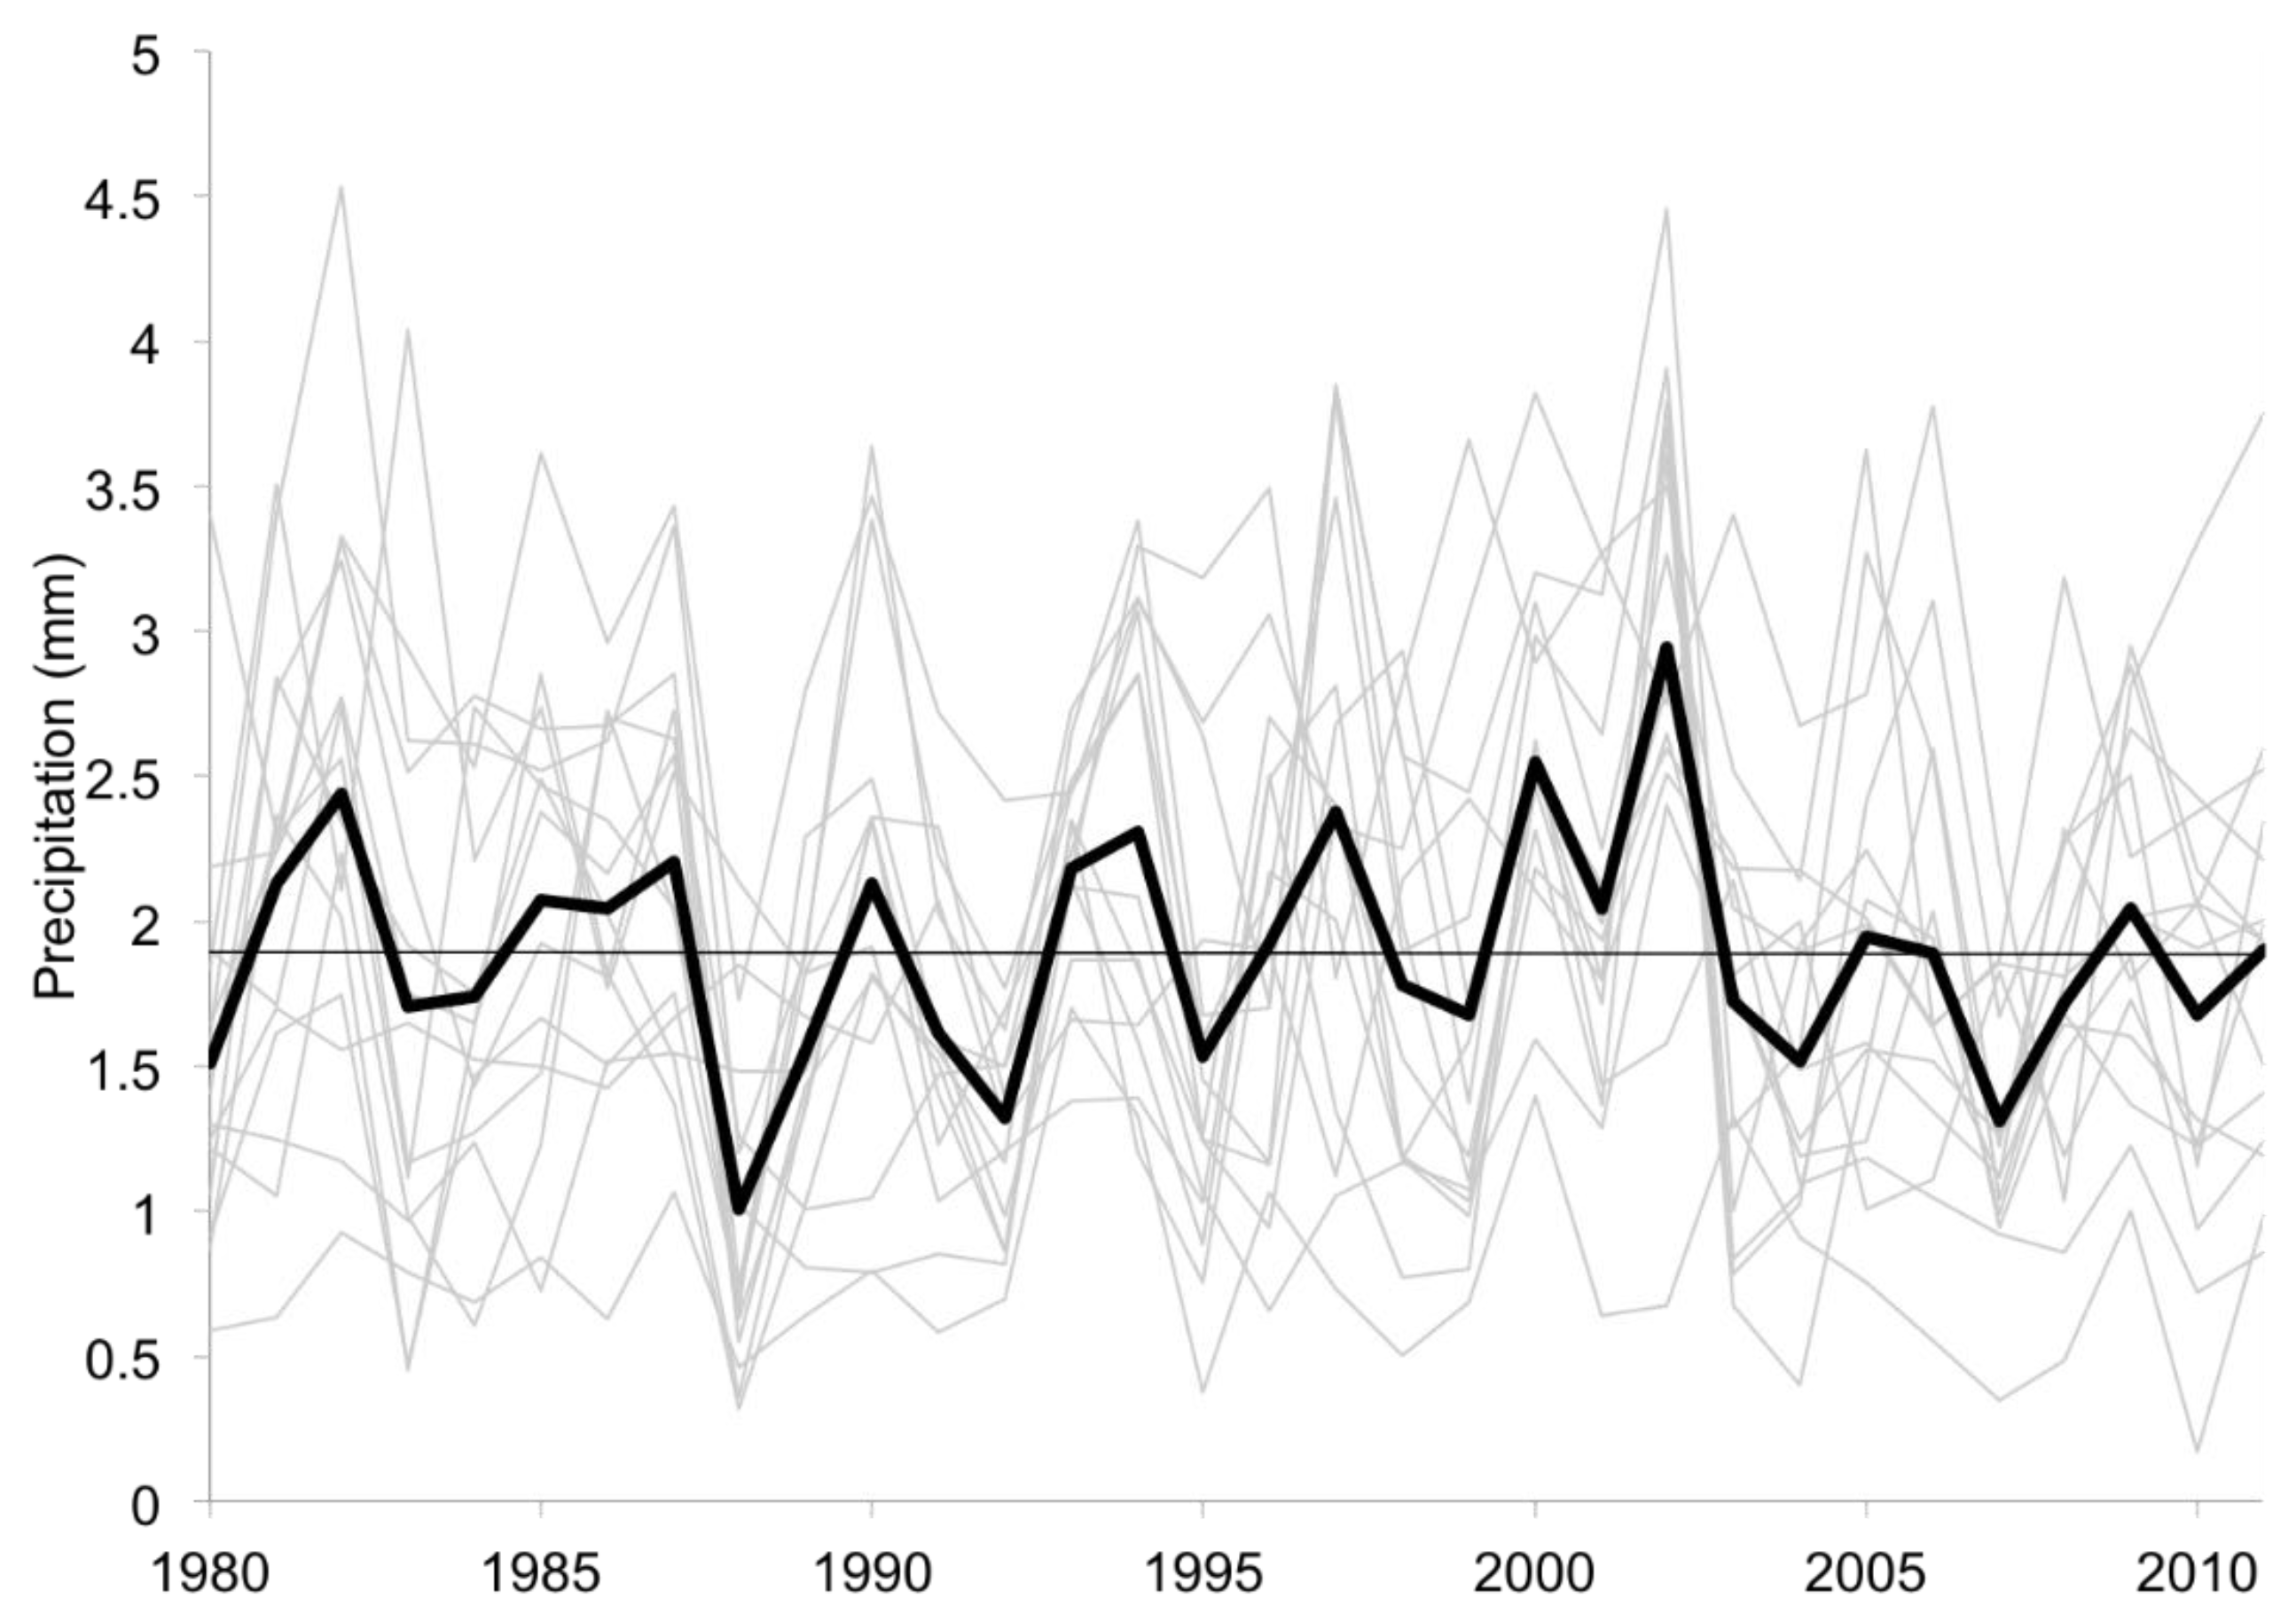
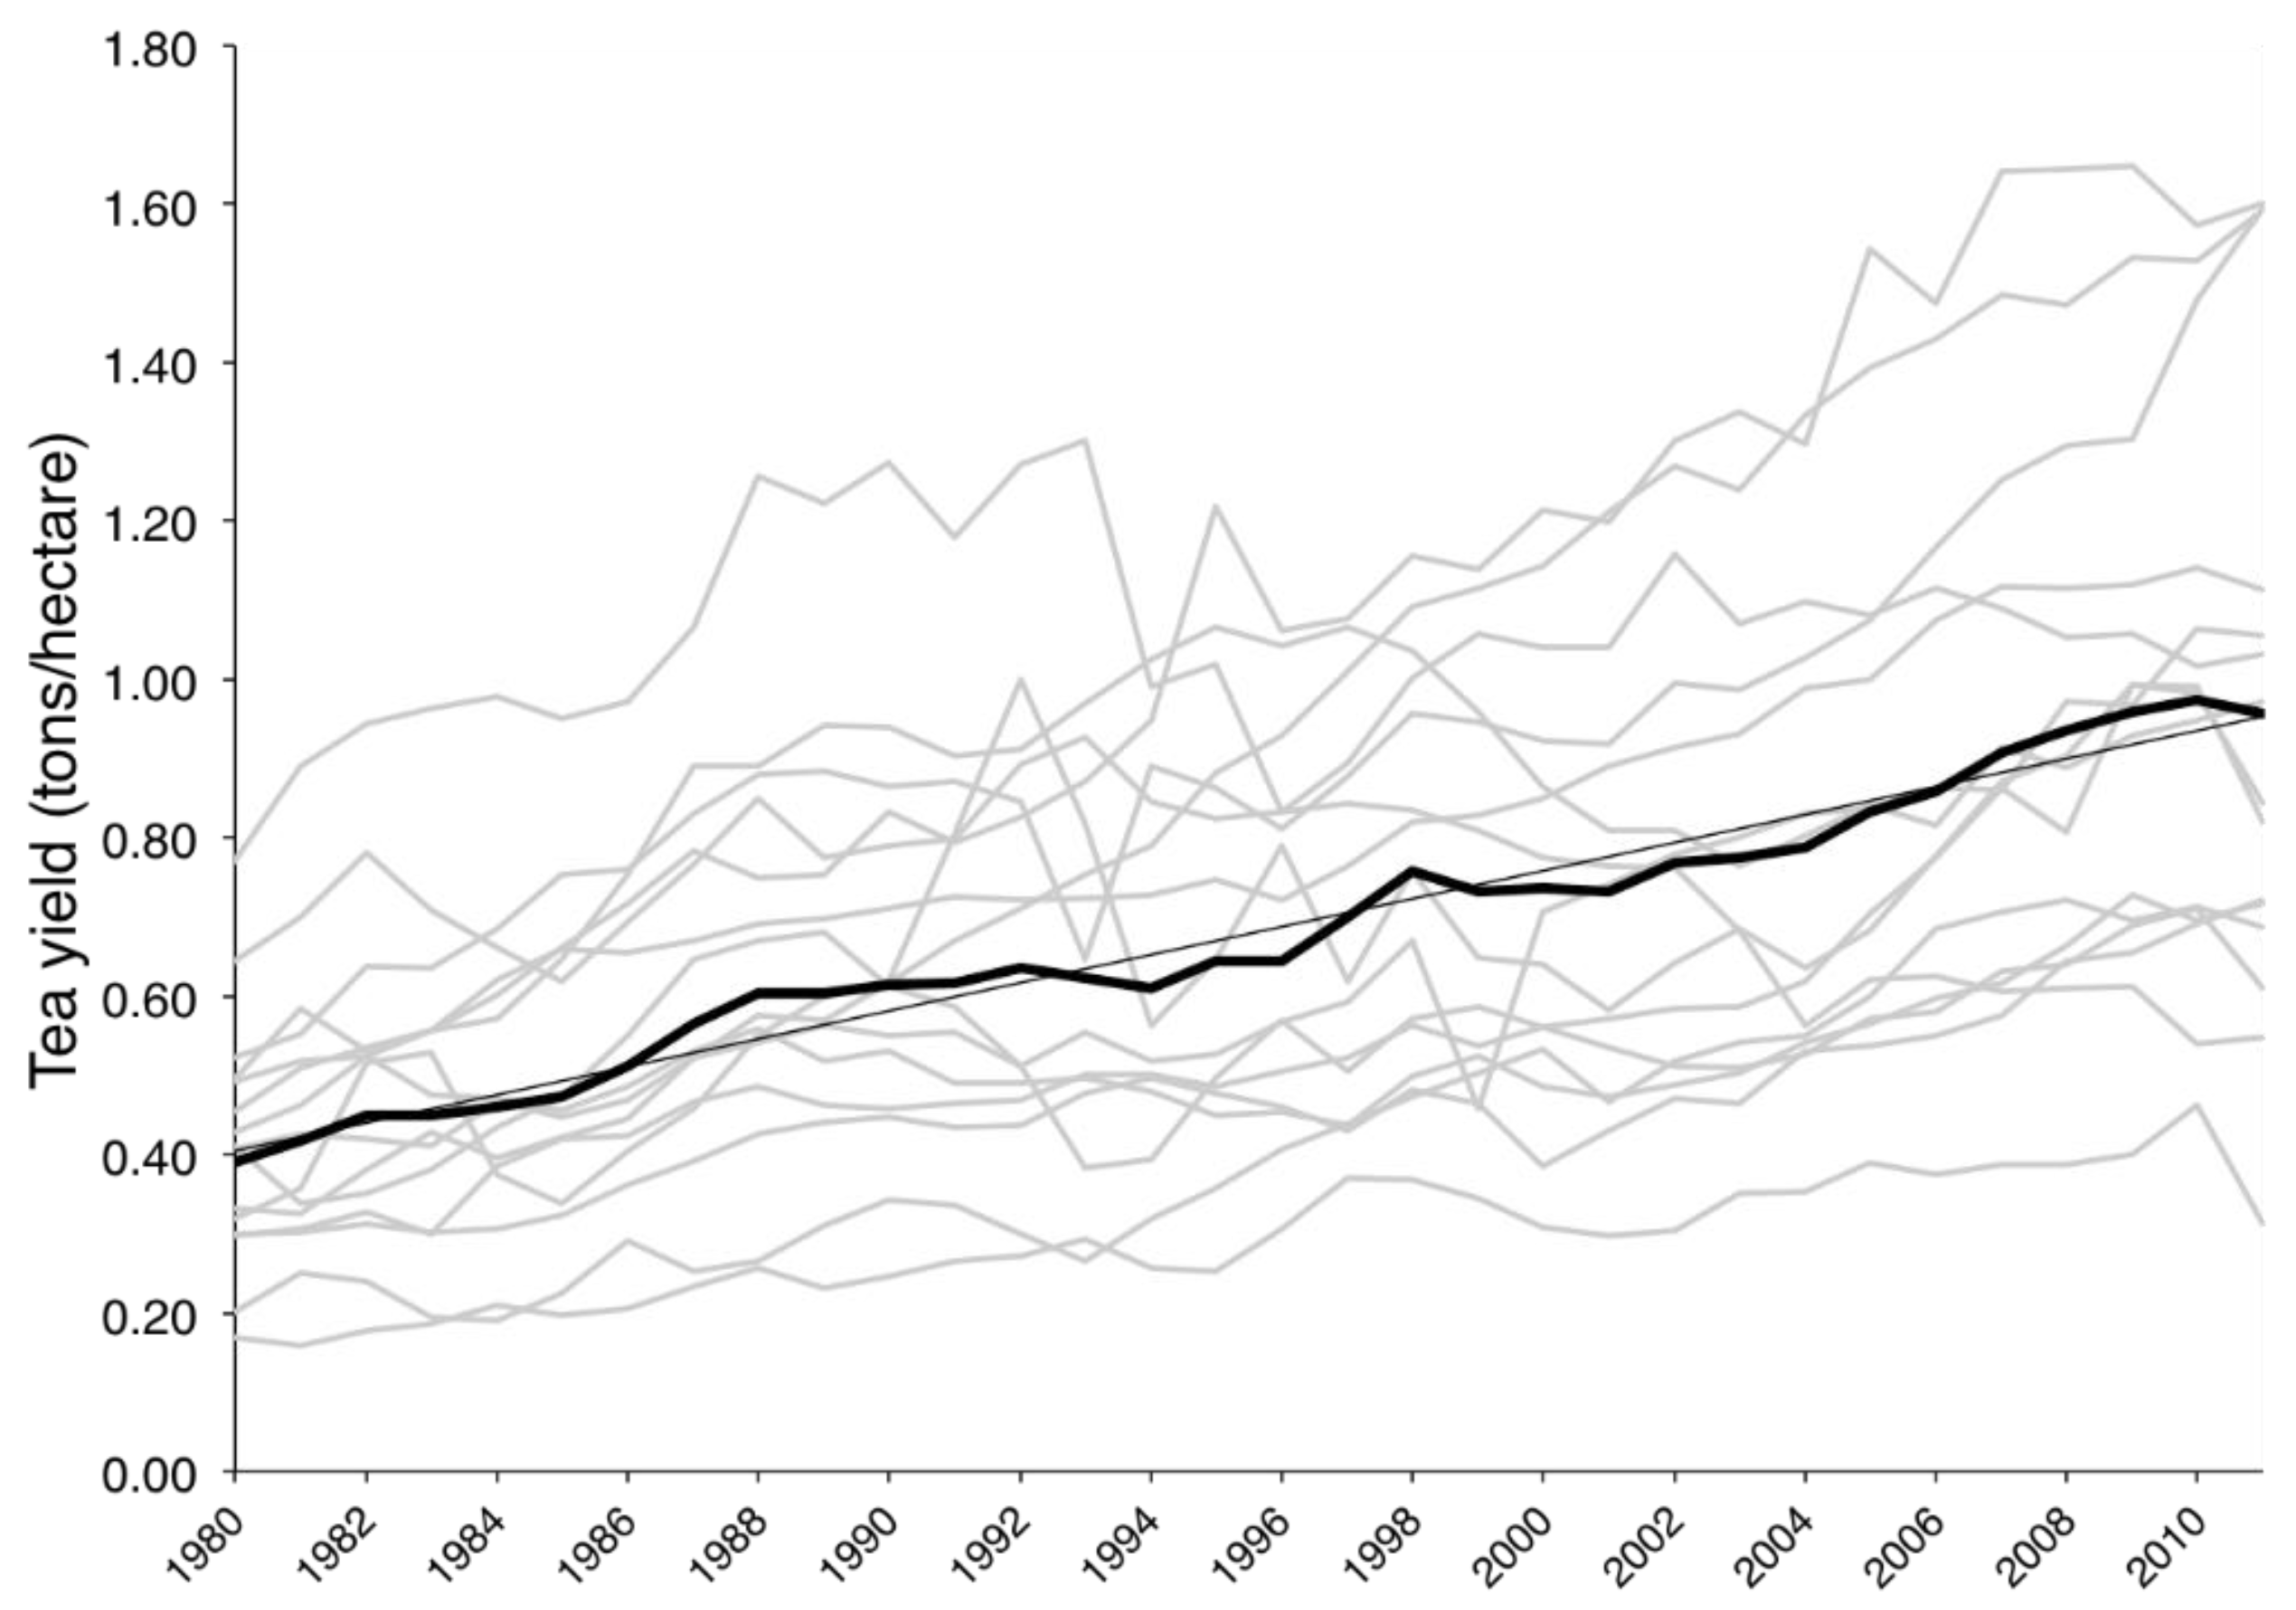
3.1. Trends in Yield, Weather Factors, and Monsoon Dynamics over China’s Tea Growing Regions

Prior to regression analysis we examine how the weather variables of interest changed between 1980 and 2011 in the study area. The online supplementary document further describes some of these time trends and can be referred to as supporting information for this analysis. Here we show some of the more important trends over time in the weather variables of interest. Figure 3 shows the yield trend for the 15 tea producing provinces in our sample and the average across all the provinces. There has been a steady upward trend in yields over time across most of the tea producing provinces and this positive trend was statistically significant at the generally accepted five percent type 1 error threshold (p = 0.000). Figure 4, Figure 5 and Figure 6 show the trends in average daily precipitation values for the pre-monsoon, monsoon and post-monsoon period over the 30-year study period. The pre-monsoon period is defined as 1 January to the start of the monsoon and the post-monsoon period is defined as the end of the monsoon to 31 December in each year. We find over the study period that the apparent negative trend in average daily precipitation before the monsoon depicted in Figure 4 is not statistically significant (p = 0.777). There appears to be a positive trend in both average daily monsoon and post-monsoon precipitation over the study period. However, we find neither of these trends are statistically significant (p = 0.131 and p = 0.640, respectively).
Figure 7 shows the province-specific and yearly average monsoon onset and retreat dates and Figure 8 shows the average monsoon duration, respectively, based on the estimated monsoon period derived using the “Segmented” approach discussed earlier. Table 2 also provides a summary of the provincial mean and standard deviation for the monsoon onset, retreat, and duration for each five-year period between 1980 and 2011. As illustrated in Figure 7, the average monsoon onset for 2011 occurred approximately 22 days later than it did in 1980. Over the time period we find the trend in Figure 6 to be statistically significant (p = 0.002) and a positive trend meaning that the onset of the monsoon is occurring, on average, later in the year across the provinces in our sample. Meanwhile, the provincial average retreat date experienced significant fluctuations over the time period, but overall has remained constant since 1980 (also Figure 7). We did not find a statistically significant trend over time period in the monsoon retreat date (p = 0.210).
The average length of the monsoon for 2011 was approximately 23 days shorter than it was in 1980 as well. We find a statistically significant (p < 0.05) negative trend over the time period for average monsoon duration (p = 0.004) (see Figure 8), which means that the average duration of the monsoon across the tea producing provinces in China is getting shorter. It should be noted that the monsoon length in individual provinces may be increasing or decreasing and that the trend presented here is just an average. We also examined trends in other key weather variables and yields over the study period, as shown in the online supplementary material mentioned earlier.

3.2. Regression Results

Table 3 shows the results from four regression models we used to estimate the marginal effect of weather variables on tea yield across the major tea producing regions of China. In Model 1, we regress yield on all weather variables, province fixed-effects, a linear time trend, and use robust standard errors to account for heteroskedasticity in the error term. Yield and all weather variables are in natural logarithm form so the coefficients are interpreted as elasticities.
To ensure proper fit and specification of our model estimators we conducted an analysis of the residuals and the variance inflation factors (VIF). Residuals provide a measure of the difference between the observed yield value and the predicted yield value based on the parameter estimates of our model [58]. The average residual value for all models are very close to zero so we believe the models are quite good at predicting yield as a function of the weather variables of interest. We also calculated the variance inflation factor (VIF) for all independent variables to ensure that they are not highly correlated. The estimated standard error of OLS estimators can be inflated with high VIFs, but the presence of high inter-variable correlation does not bias parameter estimates [58]. The average VIF for each model ranges from 4 to 7, which is well below the standard upper threshold of worry according to standard econometric texts [59].
In Model 1, we find that a 1% increase in the monsoon retreat date is associated with a 0.481% reduction in tea yield, all else being equal, and the relationship is statistically significant at the 5% level (p = 0.049). We also find that a 1% increase in average daily precipitation occurring during the monsoon period is associated with a 0.228% reduction in tea yields (p = 0.042). No other weather variables are found to be statistically associated with tea yield in this model specification.
When controlling for previous year’s weather conditions as in Model 2, we find similar results to Model 1. A 1% increase in the monsoon retreat date is associated with a 0.535% reduction in tea yield, all else being equal, and the relationship is statistically significant at the 5% level (p = 0.031). The effect of the monsoon retreat increases when we control for previous year weather. We also find that a 1% increase in average daily precipitation occurring during the monsoon period is associated with a 0.262% reduction in tea yields (p = 0.021), which is similar to our findings in Model 1. When controlling for previous year’s weather, we find that average daily monsoon precipitation from the previous year is negatively associated with the current year yield (p = 0.008). We also find the same association between yield and previous year monsoon retreat date. Additionally, the one-year lag of average daily monsoon surface radiation is negatively associated with yield (p = 0.011).
In Models 3 and 4, we assess the effect of all weather variables, including their lags, and monsoon duration. Monsoon duration is not statistically associated with yield, but we find the same negative association between average daily monsoon precipitation, and with the one-year lags of average daily monsoon solar radiation and average daily monsoon precipitation and yield, as in Model 2.
In model specifications not reported here, we investigated non-linear relationships between tea yield and weather variables, which we found were not statistically significant (at the 5% level of significance), thus they were excluded from the results we report here. We also exclude variables representing extreme weather events because of the way in which our climate data are interpolated across geography and time.

4. Discussion

Our results show that tea yields in China are impacted by daily precipitation and temperatures, as well as by seasonality as determined by the empirically estimated onset and retreat of the East Asian Monsoon. Notably, we find a consistent negative association between tea yields and the monsoon retreat date in all of our model specifications. We find that a 1% increase in the monsoon retreat date is associated with a 0.481% and 0.535% reduction in tea yield. We can consider this association in practical terms by examining recent average retreat dates of the East Asian Monsoon. In 2010 the average retreat date was on the 260th Julian day, which corresponds to the East Asian Monsoon ending in mid-September. According to the results in Model 1, a 2- to 3-day lengthening of the monsoon corresponds to a 0.481% reduction in yields over the historical period. In 2010, the average yield across the 15 provinces in our study was 1000 kg/ha, and thus a 0.481% reduction would cause yield to decline to 952 kg/ha on average. This is a notable reduction in yields resulting from such a small shift in the monsoon retreat.
The mechanism for yield loss with a delayed monsoon retreat can be explained by plant responses to changes in the distribution of rainfall over a season and, as a consequence, harvest timing decisions. Both plant phenological and physiological processes are impacted by extreme weather patterns, including precipitation, caused by climate change [44]. It can also be explained through changes in management practices. To our knowledge tea farmers in some parts of China wait until the end of the monsoon to harvest tea and a delayed retreat would reduce the number of picking days available to farmers in the post-monsoon period. Additionally, excess water in soils after a longer or rainier monsoon season may leach nutrients from the soil thereby reducing crop growth or quality or both. These are merely hypotheses and further work is warranted. Some recent research has confirmed the monsoon-yield association with tea farmers in Yunnan Province, China who harvest premium tea especially during the spring, but also in the autumn once the monsoon has ended [18]. Tea harvested outside of the monsoon garners higher prices in tea markets in China because of sensory characteristics preferred by tea buyers [18]. As was illustrated in Figure 7, the East Asian Monsoon retreat has experienced significant variability since 1980 to the present time across our sample even though the average retreat date is the same in 1980 and 2010. However, the IPCC expects that the East Asian Monsoon retreat will occur later in the year across China over the next half century [27]. This could be detrimental to the success of tea production across China and adaptive management strategies may need to be identified to adjust to a longer monsoon season or a delayed monsoon retreat.
In our analysis, we also consistently find that an increase in average daily monsoon precipitation is negatively associated with tea yields. While we know that tea requires a relatively large amount of rainfall annually for adequate growth [38], this finding suggests that an increase in daily precipitation, on average over the monsoon season, may be detrimental to tea yields. Two factors might explain this negative correlation. First, cloud cover associated with increasing daily precipitation limits plant and tree growth in tropical regions [60]. From a farm management perspective less tea may be harvested during the monsoon season or during growing seasons with an increased in the frequency of heavy one-day rain events because this results in lower quality tea. Ahmed et al. (2014) found that farmers in Yunnan harvest much less tea during the monsoon and some even note that the quality of tea is inversely related to the amount of precipitation that falls during the season which supports this hypothesis [18]. We also postulate that tea farmers will not want to harvest plants in water-logged fields after a heavy rain event because it takes more effort to harvest and process wet leaves, which are already of lower quality.
Ultimately, new planting and soil management practices may need to be developed to help Chinese tea farmers cope with changes in precipitation and monsoon dynamics. These might include more robust soil management techniques that help to build and maintain soil organic matter which can increase water holding capacity so that more water can infiltrate and percolate the soil when extreme rain events occur [61]. Soil with high levels of organic matter can also retain more water during drier conditions or in droughts. These management strategies are likely to be of increasing importance in light of the fact that the frequency of extreme rain events is expected to increase as a result of future effects of climate change [27]. Farmers in Yunnan province report some other strategies to address changes in precipitation patterns. These include planting tea from seed instead of using clonal propugules which have less dense and deep root systems; mixed cropping of tea gardens in forests; and enhancing the drainage of tea gardens [19].
We also find that the previous year’s monsoon retreat date and average daily monsoon precipitation are negatively associated with tea yields. In general, this is plausible because tea plants are perennial and so previous year’s weather patterns and seasonal dynamics could feasibly be associated with contemporaneous yields. To our knowledge the impact of previous year’s weather conditions on tea yields has not been established in the agronomic research. This is certainly an important area for further exploration, the results of which could validate our findings. It is unclear, however, why average daily solar radiation in the previous year was negatively associated with yields since tea generally prefers tropical temperatures in the range of 20 °C to 30 °C. Since surface radiation can be interpreted as a proxy measure of average daily maximum temperatures, we could interpret this finding to mean that average daily maximum temperatures (only included in the model through average daily solar radiation) during the monsoon from the previous year have a delayed, yet detrimental effect on tea yields contemporaneously. While this finding makes sense if the previous year experienced hotter than average daily maximum temperatures, there could also be a non-linear relationship between solar radiation and tea yields. In addition to being related to temperature, solar radiation is also generally found to be negatively associated with precipitation—hence, increased solar radiation may decrease tea yields because it represents a reduction in precipitation as well as an increase in temperature. Understanding which is more detrimental to tea growth the following year is a question for further research. As noted above, we assessed the potential for a non-linear relationship between solar radiation and yields by regressing the natural logarithm of yield on the natural logarithm of surface radiation and its quadratic term. We did not, however, find that this non-linear relationship was significant at our aforementioned statistical thresholds.

5. Conclusions and Limitations

Overall, our findings indicate that the monsoon retreat date and average daily precipitation during the monsoon are the strongest predictor of yields in major tea producing regions in China over the historical period. These findings suggest the need for adaptive management and harvesting strategies given the known negative effects of excess rainfall and delayed monsoon retreat have on tea [18]. More research is needed to continue to understand the relationship between climate change, weather patterns and tea yields, not just in China but also in other major tea producing countries. The analytical limits of the present study also warrant further examination of this relationship.
Our study has three major limitations that warrant clear explanation. First, tea is grown in a variety of ecosystem types and under a fairly wide range of acceptable temperature and precipitation values as noted in the introduction. Thus, some of our general conclusions about the association with specific weather factors and yields may not hold when examined at a finer scale (i.e., at the county or prefecture level). A sub-provincial analysis would require significant data collection efforts in China that were beyond the scope of the current study. Because of the scale of our analysis we are also unable to determine the relationship between yields and extreme weather events on tea production. This is because the association between extreme weather events and yield are diluted by the geographic scale of our data.
Second, weather factors are not the only driver of tea production. There are likely intra- and inter-province differences in tea production including fertilizer and pesticide application rates, labor use, and water use. These non-weather input use differences would certainly affect the results of our analysis. To our knowledge, no data on these farm inputs was readily available at the time that this study was being conduced. Entity fixed-effects were used to capture the effect of some of these unobservable differences across provinces. However, there may still be some bias in our estimates for each climate indicator because of these data limitations. We also did not control for wind factors because data on prevailing winds was not available. This could potentially cause biased parameter estimates as noted by Auffhammer et al. (2013) [62].
Third, at this level of analysis we cannot account for the fact that the production mix of Camellia sinensis varies across provinces. Average yield does vary according to the tea type being produced and because of differences in post-harvest processing [53]. Many varieties of tea can be produced from Camellia sinensis including green, black, Oolong, and white. The only difference in production for these teas is the plucking standard. For example, only one leaf bud is typically harvested for oolong tea, whereas one to two leaves and one bud are plucked for premium green tea [53]. Unfortunately, a specific measure of the production mix of tea in each province was not available to us but we did account for differences in yield across provinces using a fixed-effects term.
These limitations notwithstanding, we believe this research is an important contribution to the literature on how climate change impacts agriculture for two reasons. First, our analysis is the first to quantitatively assess China’s tea yield using a yield response model. This body of research tends to focus on calorie-rich crops like corn, wheat, and rice. However, tea is an important agricultural crop in terms of nutrition, economic value, and to the cultural heritage of many societies. Second, instead of quantifying the relationship between yield and historical average monsoon onset and retreat dates, we utilize a technique to estimate the monsoon empirically, shedding light on how the dynamics of seasons are correlated with tea yields. To our knowledge, this is the first study to examine the association between crop yields and empirically derived seasons. This is an important contribution to this area of research because it allows our quantitative model to better reflect what is happening in the real world. As noted before, Chinese tea farmers interviewed by Ahmed et al. (2014) report the timing of the monsoon is as important as the amount of rain that falls in a particular growing season [18].
Our study is the first of its kind to estimate the effect of climate change on Chinese tea production it by no means provides a complete picture of the relationship between climate, weather, and tea productivity. However, we do believe our approach can be coupled with case studies and smaller-scale analyses to create a detailed picture of the climate-tea yield-quality relationship in China. Continued research in this area is most certainly warranted given tea’s importance to human societies globally.

Supplementary Files

Supplementary File 1Supplementary File 2

Acknowledgments

The authors would like to thank the organizations that provided financial and material support for this project. These organizations include: the National Science Foundation Coupled Natural Human Systems program (NSF grant #BCS-1313775), Tufts Collaborates, Tufts University, and the Friedman Family Foundation. The authors would also like to thank the following individuals for providing support on this project: Durwood Marshall, Tufts University; Leah Lazer, Tufts University; Daniel C. Bowman, University of North Carolina; and Robert Houser, Tufts University.

Author Contributions

R.B., S.B.C., and T.S.G. initiated the research questions posed in this project; S.A., A.R., J.R.S., B.T.A. and C.M.O. contributed to defining the research scope and methods; R.B., B.T.A., and M.H. collected and prepared data; R.B. and S.B.C. conducted data analysis; R.B. and S.B.C. prepared the initial draft manuscript; and R.B., S.B.C., B.T.A., T.S.G., S.A., J.R.S., C.M.O., M.H., A.R. and W.H. contributed to and commented on the final manuscript.

Conflicts of Interest

The authors have no conflicts of interest.

References

  1. Chen, L.; Zhou, Z. Variations of main quality components of tea genetic resources [Camellia Sinensis (L.) O. Kuntze] preserved in the China National Germplasm Tea Repository. Plant. Foods Hum. Nutr. 2005, 60, 31–35. [Google Scholar] [CrossRef] [PubMed]
  2. Food and Agriculture Organization. FAOSTAT. Available online: http://faostat.fao.org/ (accessed on 28 April 2014).
  3. Owuor, P.O.; Wachira, F.N.; Ng’etich, W.K. Influence of region of production on relative clonal plain tea quality parameters in Kenya. Food Chem. 2010, 119. [Google Scholar] [CrossRef]
  4. Columbia Law School Human Rights Institute. “The More Things Change...” The World Bank, Tata and Enduring Abuses on India’s Tea Plantations. Columbia Law School Human Rights Institute. Available online: http://web.law.columbia.edu/sites/default/files/microsites/human-rights-institute/files/tea_report_final_draft-smallpdf.pdf (accessed on 26 January 2015).
  5. Han, W. Climate Change and its Impacts on Tea Economy and Counteract Strategies in China; Intergovernmental Group on Tea of the Food and Agricultural Organization of the United Nations: Colombo, Sri Lanka, 2012. [Google Scholar]
  6. Bukowski, J.F.; Percival, S.S. L-Theanine intervention enhances human γδ T lymphocyte function. Nutr. Rev. 2008, 66, 96–102. [Google Scholar] [CrossRef] [PubMed]
  7. Da Silva Pinto, M. Tea: A New Perspective on health benefits. Food Res. Int. 2013, 53, 558–567. [Google Scholar] [CrossRef]
  8. Wang, L.; Zhang, X.; Liu, J.; Shen, L.; Li, Z. Tea consumption and lung cancer risk: A meta-analysis of case-control and cohort studies. Nutrition 2014, 30, 1122–1127. [Google Scholar] [CrossRef] [PubMed]
  9. Arab, L.; Khan, F.; Lam, H. Tea Consumption and cardiovascular disease risk. Am. J. Clin. Nutr. 2013, 98, 1651S–1659S. [Google Scholar] [CrossRef] [PubMed]
  10. Blumberg, J.B. Introduction to the proceedings of the fifth international scientific symposium on tea and human health. Am. J. Clin. Nutr. 2013, 98, 1607S–1610S. [Google Scholar] [CrossRef] [PubMed]
  11. Chaturvedula, V.S.P.; Prakash, I. The aroma, taste, color and bioactive constituents of tea. J. Med. Plants Res. 2011, 5, 2110–2124. [Google Scholar]
  12. McKay, D.L.; Blumberg, J.B. The role of tea in human health: An update. J. Am. Coll. Nutr. 2002, 21, 1–13. [Google Scholar] [CrossRef] [PubMed]
  13. Lin, Y.; Tsai, Y.; Tsay, J.; Lin, J. Factors affecting the levels of tea polyphenols and caffeine in tea leaves. J. Agric. Food Chem. 2003, 51, 1864–1873. [Google Scholar] [CrossRef] [PubMed]
  14. Kowalsick, A.; Kfoury, N.; Robbat, A., Jr.; Ahmed, S.; Orians, C.; Griffin, T.; Cash, S.B.; Stepp, J.R. Metabolite profiling of Camellia Sinensis by automated sequential, multidimensional gas chromatography/mass spectrometry reveals strong monsoon effects on tea constituents. J. Chromatogr. A 2014, 1370, 230–239. [Google Scholar] [CrossRef] [PubMed]
  15. Hönow, R.; Gu, K.R.; Hesse, A.; Siener, R. Oxalate content of green tea of different origin, quality, preparation and time of harvest. Urol. Res. 2010, 38, 377–381. [Google Scholar] [CrossRef] [PubMed]
  16. Yao, L.; Caffin, N.; D’arcy, B.; Jiang, Y.; Shi, J.; Singanusong, R.; Liu, X.; Datta, N.; Kakuda, Y.; Xu, Y. Seasonal variations of phenolic compounds in Australia-grown tea (Camellia Sinensis). J. Agric. Food Chem. 2005, 53, 6477–6483. [Google Scholar] [CrossRef] [PubMed]
  17. Gulati, A.; Ravindranath, S.D. Seasonal variations in quality of Kangra Tea (Camellia sinensis(L) O Kuntze) in Himachal Pradesh. J. Sci. Food Agric. 1996, 71, 231–236. [Google Scholar] [CrossRef]
  18. Ahmed, S.; Stepp, J.R.; Orians, C.; Griffin, T.; Matyas, C.; Robbat, A.; Cash, S.; Xue, D.; Long, C.; Unachukwu, U.; et al. Effects of extreme climate events on tea (Camellia Sinensis) functional quality validate indigenous farmer knowledge and sensory preferences in tropical China. PLoS ONE 2014, 9, e109126. [Google Scholar] [CrossRef] [PubMed]
  19. Ahmed, S.; Orians, C.M.; Griffin, T.S.; Buckley, S.; Unachukwu, U.; Stratton, A.E.; Stepp, J.R.; Robbat, A.; Cash, S.; Kennelly, E. Effects of water availability and pest pressures on tea (Camellia Sinensis) growth and functional quality. AoB Plants 2014. [Google Scholar] [CrossRef] [PubMed]
  20. Wang, J.; Huang, J.; Rozelle, S. 2010. Climate Change and China’s Agricultural Sector: An Overview of Impacts, Adaptation and Mitigation. ICTSD-IPC Platform on Climate Change, Agriculture and Trade. Issue Brief No. 5. Geneva, Switzerland: International Centre for Trade and Sustainable Development and International Food and Agriculutral Trade Policy Council. Available online: http://www.ictsd.org/downloads/2010/06/climate-change-and-chinas-agricultural-sector.pdf (accessed on 10 June 2012).
  21. Wang, H.; Sun, J.; Chen, H.; Zhu, Y.; Zhang, Y.; Jiang, D.; Lang, X.; Fan, K.; Yu, E.; Yang, S. Extreme climate in China: Facts, simulation and projection. Meteorol. Z. 2012, 21, 279–304. [Google Scholar] [CrossRef]
  22. Wild, M.; Gilgen, H.; Roesch, A.; Ohmura, A.; Long, C.N.; Dutton, E.G.; Forgan, B.; Kallis, A.; Russak, V.; Tsvetkov, A. From dimming to brightening: Decadal changes in solar radiation at Earth’s surface. Science 2005, 308, 847–850. [Google Scholar] [CrossRef] [PubMed]
  23. Tao, F.; Yokozawa, M.; Xu, Y.; Hayashi, Y.; Zhang, Z. Climate changes and trends in phenology and yields of field crops in China, 1981–2000. Agric. For. Meteorol. 2006, 138, 82–92. [Google Scholar] [CrossRef]
  24. Lou, W.; Sun, S. Design of agricultural insurance policy for tea tree freezing damage in Zhejiang Province, China. Theor. Appl. Climatol. 2013, 111, 713–728. [Google Scholar] [CrossRef]
  25. IPCC. Summary for Policymakers: The Physical Science Basis; Cambridge University Press: Cambridge, UK, 2014. [Google Scholar]
  26. Lang, X.; Sui, Y. Changes in mean and extreme climates over China with a 2 C global Warming. Chin. Sci. Bull. 2013, 58, 1453–1461. [Google Scholar] [CrossRef]
  27. IPCC. Summary for Policymakers: Impacts, Adaptation, and Vulnerability. Climate Change 2014: Impacts, Adaptation, and Vulnerability. Part A: Global and Sectoral Aspects. Available online: http://www.ipcc.ch/pdf/assessment-report/ar5/wg2/ar5_wgII_spm_en.pdf (accessed on 1 June 2012).
  28. Carr, M.K.V. The climatic requirements of the tea plant: A review. Exp. Agric. 1972, 8, 1–14. [Google Scholar] [CrossRef]
  29. Auffhammer, M.; Ramanathan, V.; Vincent, J.R. Climate change, the monsoon, and rice yield in India. Clim. Chang. 2012, 111, 411–424. [Google Scholar] [CrossRef]
  30. Deschênes, O.; Kolstad, C. Economic impacts of climate change on California agriculture. Clim. Chang. 2011, 109, 365–386. [Google Scholar] [CrossRef]
  31. Deschênes, O.; Greenstone, M. The economic impacts of climate change: Evidence from agricultural output and random fluctuations in weather. Am. Econ. Rev. 2007, 97, 354–385. [Google Scholar] [CrossRef]
  32. Lobell, D.B.; Schlenker, W.; Costa-Roberts, J. Climate trends and global crop production since 1980. Science 2011, 333, 616–620. [Google Scholar] [CrossRef] [PubMed]
  33. Shi, W.; Tao, F.; Zhang, Z. A review on statistical models for identifying climate contributions to crop yields. J. Geogr. Sci. 2013, 23, 567–576. [Google Scholar] [CrossRef]
  34. Dodd, D.E.S.; Jolliffe, I.T. Early detection of the start of the wet season in semiarid tropical climates of Western Africa. Int. J. Climatol. 2001, 21, 1251–1262. [Google Scholar] [CrossRef]
  35. Laux, P.; Kunstmann, H.; Bárdossy, A. Predicting the regional onset of the rainy season in West Africa. Int. J. Climatol. 2008, 28, 329–342. [Google Scholar] [CrossRef]
  36. Muggeo, V.M.R. Estimating regression models with unknown break-points. Stat. Med. 2003, 22, 3055–3071. [Google Scholar] [CrossRef] [PubMed]
  37. Cook, B.I.; Buckley, B.M. Objective determination of monsoon season onset, withdrawal, and length. J. Geophys. Res. Atmos. 2009, 114, D23109. [Google Scholar] [CrossRef]
  38. Huang, S. Meteorology of the tea plant in China: A review. Agric. For. Meteorol. 1989, 47, 19–30. [Google Scholar] [CrossRef]
  39. Lou, W.; Sun, S.; Wu, L.; Sun, K. Effects of climate change on the economic output of the Longjing-43 tea tree, 1972–2013. Int. J. Biometeorol. 2014. [Google Scholar] [CrossRef] [PubMed]
  40. Lou, W.; Sun, K.; Sun, S.; Ma, F.; Wang, D. Changes in pick beginning date and frost damage risk of tea tree in Longjing tea-producing area. Theor. Appl. Climatol. 2013, 114, 115–123. [Google Scholar] [CrossRef]
  41. Lou, W.; Ji, Z.; Sun, K.; Zhou, J. Application of remote sensing and GIS for assessing economic loss caused by frost damage to tea plantations. Precis. Agric. 2013, 14, 606–620. [Google Scholar] [CrossRef]
  42. Yang, Y. Chinese Tea Cultivation; Shanghai Scientific & Technical Publishers: Shanghai, China, 2005. [Google Scholar]
  43. Laycock, D.H. An Empirical Relationship between Rainfall and Tea Yields in Nyasaland; Special Meeting of Applied Meteorology: Nairobi, Kenya, 1958. [Google Scholar]
  44. Reyer, C.P.O.; Leuzinger, S.; Rammig, A.; Wolf, A.; Bartholomeus, R.P.; Bonfante, A.; de Lorenzi, F.; Dury, M.; Gloning, P.; Abou Jaoudé, R.; et al. A plant’s perspective of extremes: Terrestrial plant responses to changing climatic variability. Glob. Chang. Biol. 2013, 19, 75–89. [Google Scholar] [CrossRef] [PubMed]
  45. Monteith, J.L. Solar radiation and productivity in tropical ecosystems. J. Appl. Ecol. 1972, 9, 747–766. [Google Scholar] [CrossRef]
  46. Rienecker, M.M.; Suarez, M.J.; Gelaro, R.; Todling, R.; Bacmeister, J.; Liu, E.; Bosilovich, M.G.; Schubert, S.D.; Takacs, L.; Kim, G. MERRA: NASA’s Modern-Era retrospective analysis for research and applications. J. Clim. 2011, 24, 3624–3648. [Google Scholar] [CrossRef]
  47. Ensor, L.A.; Robeson, S.M. Statistical characteristics of daily precipitation: Comparisons of gridded and point datasets. J. Appl. Meteorol. Climatol. 2008, 47, 2468–2476. [Google Scholar] [CrossRef]
  48. Decker, M.; Brunke, M.A.; Wang, Z.; Sakaguchi, K.; Zeng, X.; Bosilovich, M.G. Evaluation of the reanalysis products from GSFC, NCEP, and ECMWF using flux tower observations. J. Clim. 2012, 25, 1916–1944. [Google Scholar] [CrossRef]
  49. Yuan, W.; Xu, B.; Chen, Z.; Xia, J.; Xu, W.; Chen, Y.; Wu, X.; Fu, Y. Validation of China-wide interpolated daily climate variables from 1960 to 2011. Theor. Appl. Climatol. 2015, 119, 689–700. [Google Scholar] [CrossRef]
  50. Wang, A.; Zeng, X. Evaluation of multireanalysis products with in situ observations over the Tibetan Plateau. J. Geophys. Res. Atmos. 2012. [Google Scholar] [CrossRef]
  51. Ruane, A.C.; Goldberg, R.; Chryssanthacopoulos, J. Climate forcing datasets for agricultural modeling: Merged products for gap-filling and historical climate series estimation. Agric. For. Meteorol. 2015, 200, 233–248. [Google Scholar] [CrossRef]
  52. National Bureau of Statistics of China. China Statistical Yearbook (1979–2011); China Statistics Press: Beijing, China, 2011. [Google Scholar]
  53. Han, W.; (Tea Research Institute, Chinese Academy of Agricultural Sciences, Hangzhou City, China). Personal communication, 2015.
  54. Esri, ArcGIS Desktop. Available online: http://www.esri.com/software/arcgis/arcgis-for-desktop (accessed on 12 September 2012).
  55. R Core Team. R: A language and environment for statistical Computing; R Foundation for Statistical Computing: Vienna, Austria, 2011. [Google Scholar]
  56. Zhai, P.; Zhang, X.; Wan, H.; Pan, X. Trends in total precipitation and frequency of daily precipitation extremes over China. J. Climate 2005, 18, 1096–1108. [Google Scholar] [CrossRef]
  57. Auffhammer, M.; Ramanathan, V.; Vincent, J.R. Integrated model shows that atmospheric brown clouds and greenhouse gases have reduced rice harvests in India. Proc. Natl. Acad. Sci. USA 2006, 103, 19668–19672. [Google Scholar] [CrossRef] [PubMed]
  58. Wooldridge, J. Introductory Econometrics: A Modern Approach; Cengage Learning: Mason, OH, USA, 2012. [Google Scholar]
  59. Greene, W.H. Econometric Analysis; Prentice Hall: Boston, MA, USA, 2011. [Google Scholar]
  60. Clark, D.A.; Clark, D.B. Climate-induced annual variation in canopy tree growth in a Costa Rican tropical rain forest. J. Ecol. 1994, 82. [Google Scholar] [CrossRef]
  61. Franzluebbers, A.J. Water infiltration and soil structure related to organic matter and its stratification with depth. Soil Tillage Res. 2002, 66, 197–205. [Google Scholar] [CrossRef]
  62. Auffhammer, M.; Hsiang, S.M.; Schlenker, W.; Sobel, A. Using Weather Data and Climate Model Output in Economic Analyses of Climate Change. Rev. Environ. Econ. Policy 2013, 7, 181–198. [Google Scholar] [CrossRef]
Figure 1. This graph illustrates how the cumulative precipitation function is used to estimate the onset and retreat dates of the monsoon for each province in each year from 1980 to 2011. It shows the onset (dashed grey vertical line) and retreat (dotted grey vertical line) of the monsoon in Yunnan province in 1990. The slope of the cumulative precipitation function changes significantly at these two points. These two points mark the estimated onset and retreat of the East Asian monsoon in Yunnan province in the example year 1990. The dashed lines overlaid on top of the cumulative precipitation function show the slope of each section of the function as estimated by “Segmented”.
Climate 04 00020 g001
Figure 2. Map of China’s major tea producing counties. Counties within each province where tea production has traditionally occurred or where tea is currently produced are shaded in grey.
Climate 04 00020 g002
Figure 3. Tea yield (tons/hectare) over time across China’s tea producing provinces. The grey lines represent the yield trend over time for each of the 15 provinces and the black line is the mean yield across all provinces.
Climate 04 00020 g003
Figure 4. This graph shows the pre-monsoon average daily precipitation (in millimeters (mm)). The pre-monsoon is defined as the time period between 1 January and the start of the monsoon. The black line indicates the average daily precipitation across all provinces and the grey lines indicate the average daily precipitation for each province.
Climate 04 00020 g004
Figure 5. This graph shows the monsoon average daily precipitation (mm). The black line indicates the average daily precipitation across all provinces and the grey lines indicate the average daily precipitation for each province.
Climate 04 00020 g005
Figure 6. This graph shows the post-monsoon average daily precipitation (mm). The post monsoon is defined as the time period between the monsoon retreat and 31 December. The black line indicates the average daily precipitation across all provinces and the grey lines indicate the average daily precipitation for each province.
Climate 04 00020 g006
Figure 7. Based on our estimation of the monsoon period, this graph shows the average date of the onset and retreat of the monsoon in the 15 provinces in China where tea is grown over the study period (1980–2011).
Climate 04 00020 g007
Figure 8. Yearly average monsoon duration is noted by the black connected line. Each grey dot on the graph shows the monsoon duration for each province in each year in the sample, upon which the yearly average was calculated.
Climate 04 00020 g008
Table 1. Description of weather variables.
VariableDescription of Construction
Monsoon duration (days)
  • Averaged daily gridded precipitation data (0.5° × 0.66°) across grid cells within the tea-growing region of each province.
  • Input the daily cumulative precipitation function into R’s “Segmented” package.
  • “Segmented” requires a starting point from which to approximate the monsoon onset and retreat dates. The average historical monsoon onset and retreat dates across China’s major tea producing regions are used for this purpose. 1 May is the 121st day of the year representing the monsoon onset and 31 August is the 234th day of year representing the end of the monsoon (Zhai et al. 2005) [56].
  • “Segmented” approximates the unknown breakpoints in the slope of the cumulative precipitation function, providing an approximate start and end date of the monsoon, which is then used to calculate the duration of the monsoon by province and year.
Monsoon onset/retreat date (Julian day)Estimated date upon which the monsoon onset/retreat occurs.
Pre-monsoon rainfall (mm)Averaged daily gridded precipitation data across grid cells within the tea-growing region of each province. Then the average total daily rainfall during the approximated pre-monsoon period (1 January—monsoon onset date) was obtained.
Monsoon rainfall (mm)Averaged daily gridded precipitation data across grid cells within the tea-growing region of each province. Then average total daily rainfall during the approximated monsoon period (monsoon onset date—monsoon retreat date) was obtained.
Post-monsoon rainfall (mm)Averaged daily gridded precipitation data across grid cells within the tea-growing region of a province. Then average total daily rainfall occurring during the approximated post-monsoon period (monsoon retreat date—31 December) was obtained.
Pre-monsoon minimum temperature (°C)
  • Averaged daily gridded minimum temperature data across grid cells within the tea-growing region of each province.
  • Averaged daily minimum temperature from 1 January to the monsoon onset date for each province in each year.
Monsoon minimum temperature (°C)
  • Averaged daily gridded minimum temperature data across grid cells within the tea-growing region of each province.
  • Averaged daily minimum temperature over the approximated monsoon period for each province in each year.
Pre-monsoon surface radiation (W/m2)
  • Averaged daily gridded radiation data across grid cells within the tea-growing region of each province.
  • Averaged daily solar surface radiation over the approximated pre-monsoon period for each province in each year.
Monsoon surface radiation (W/m2)
  • Averaged daily gridded radiation data across grid cells within the tea-growing region of each province.
  • Averaged daily solar surface radiation over the monsoon period for each province in each year.
Table 2. Five year mean and standard deviation values for monsoon onset, retreat, and duration.
1980198519901995200020052010
Mean monsoon onset114.3124.5123.8126.6132.1142.9136.9
SD monsoon onset34.835.324.533.524.730.430.9
Mean monsoon retreat261.2270.3248.5254.4262.9258.4260.0
SD monsoon retreat15.514.426.316.214.716.312.3
Mean monsoon duration146.8145.8124.8127.8130.8115.6123.2
SD monsoon duration38.137.938.630.627.530.635.5
Table 3. Regression results, all with fixed effects and annual time trend.
All Variables are in Logarithmic form Standard Errors in Parentheses1234
Monsoon onset (Julian days)0.0510.033
(0.127)(0.128)
Monsoon retreat (Julian days)−0.481 **−0.535 **
(0.244)(0.248)
Monsoon duration −0.096−0.100
(0.078)(0.085)
Pre-monsoon average daily T-min (°C)−0.019−0.025−0.018−0.018
(0.024)(0.024)(0.024)(0.025)
Monsoon average daily T-min (°C)0.1310.3310.0870.153
(0.384)(0.406)(0.314)(0.331)
Pre-monsoon average daily precipitation (mm)0.0870.0870.0830.082
(0.069)(0.070)(0.061)(0.064)
Monsoon average daily precipitation (mm)−0.228 **−0.262 **−0.169−0.184 *
(0.112)(0.113)(0.110)(0.112)
Post-monsoon period average daily precipitation (mm)−0.031−0.043−0.016−0.020
(0.030)(0.031)(0.029)(0.030)
Pre-monsoon average daily solar radiation (W/m2)−0.046−0.073−0.098−0.103
(0.287)(0.292)(0.252)(0.264)
Monsoon average daily solar radiation (W/m2)−0.472−0.481−0.247−0.237
(0.331)(0.341)(0.312)(0.327)
Time trend0.025 ***0.025 ***0.025 ***0.025 ***
(0.001)(0.001)(0.001)(0.001)
ONE-YEAR LAG VARIABLES
Pre-monsoon average daily T-min (°C) −0.030 −0.029
(0.031) (0.032)
Monsoon average daily T-min (°C) 0.127 0.050
(0.372) (0.311)
Pre-monsoon average daily precipitation (mm) 0.051 0.063
(0.065) (0.059)
Monsoon average daily precipitation (mm) −0.327 *** −0.258 **
(0.122) (0.120)
Post-monsoon average daily precipitation (mm) −0.035 −0.012
(0.031) (0.029)
Pre-monsoon average daily surface radiation (W/m2) 0.040 −0.031
(0.274) (0.265)
Monsoon average daily surface radiation (W/m2) −0.864 ** −0.554 *
(0.337) (0.306)
Monsoon onset (Julian days) 0.075
(0.116)
Monsoon retreat (Julian days) −0.604 **
(0.248)
Monsoon duration −0.131
(0.085)
Number of observations462451462451
Note: *** p < 0.01, ** p < 0.05, * p < 0.1.

