
Quantifying the Climate Co-Benefits of Hybrid Renewable Power Generation in Indonesia: A Multi-Regional and Technological Assessment

 ,
,  , ,
, ,
Abstract
:1. Introduction
1.1. Background
1.2. Literature Review
1.3. Research Gaps and Contributions
- Formulating an interactive modeling structure to quantify the environmental–health–economic co-benefits of implementing HRESs.
- Assessing the co-benefits obtained from HRESs based on various locations, technologies, and policies.
- Evaluating the Indonesian stated policies scenario of 2025 and 2030, considering the co-benefits from HRESs.
2. Methodological Approach
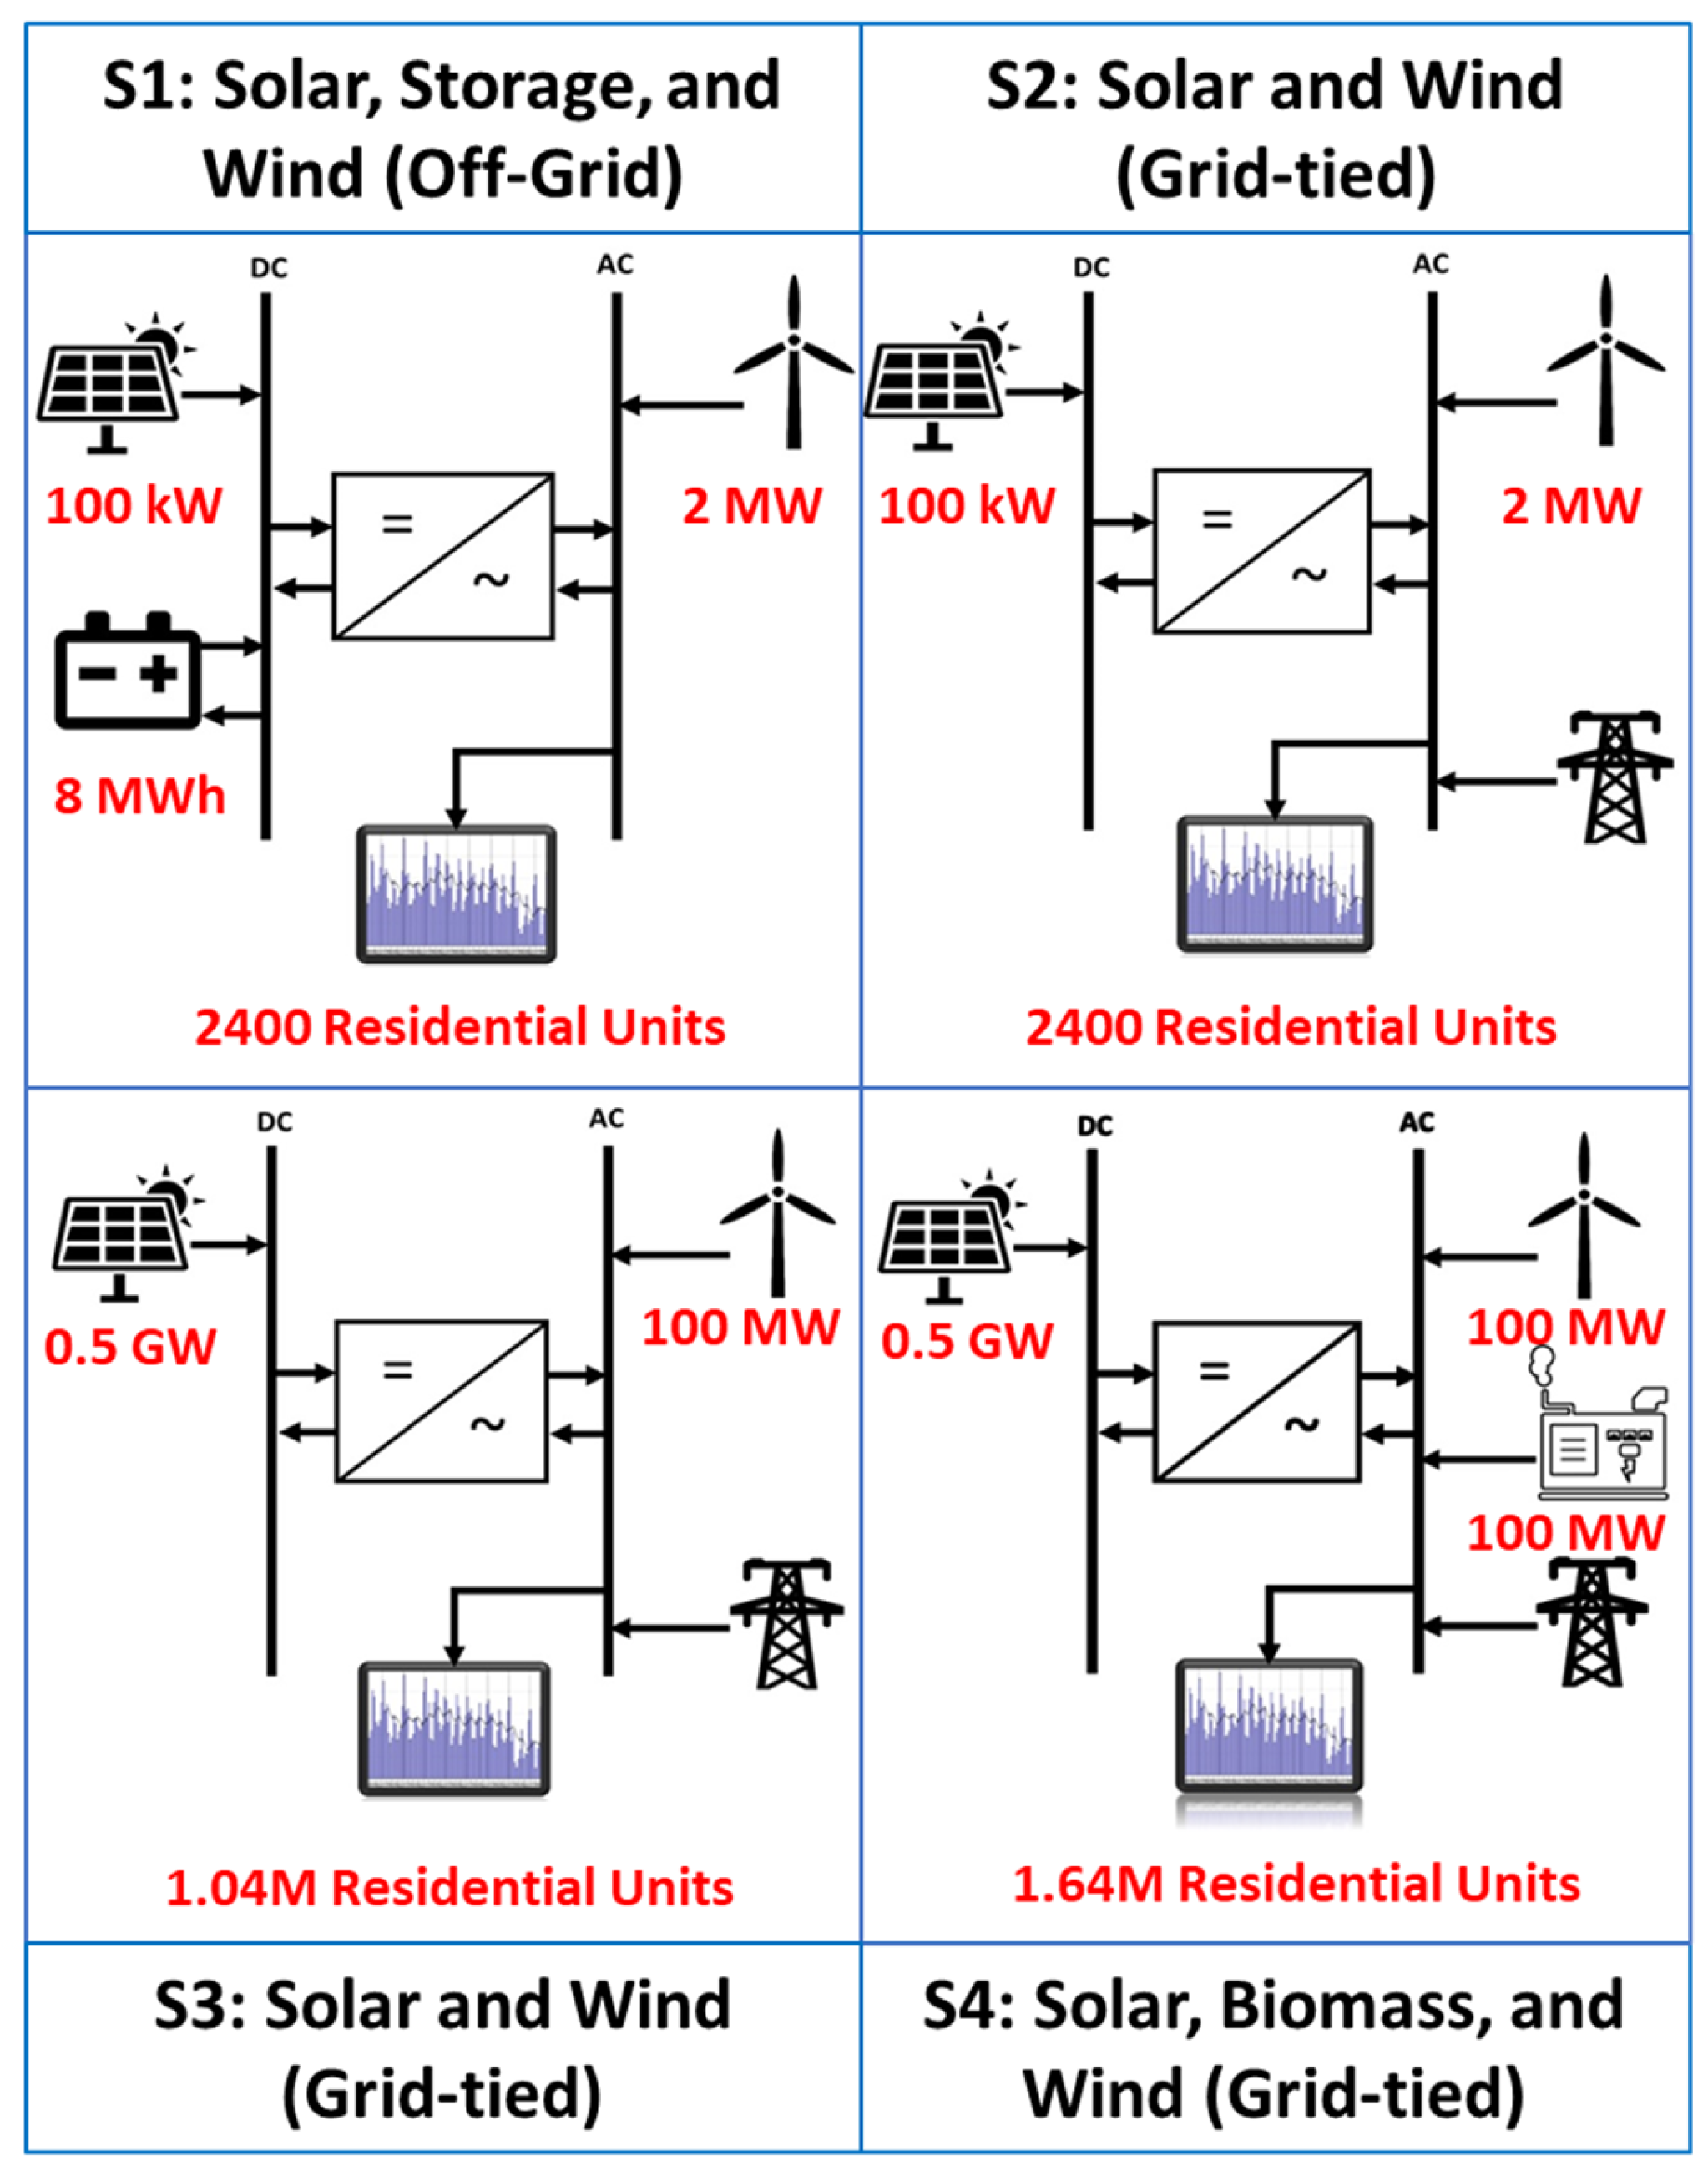
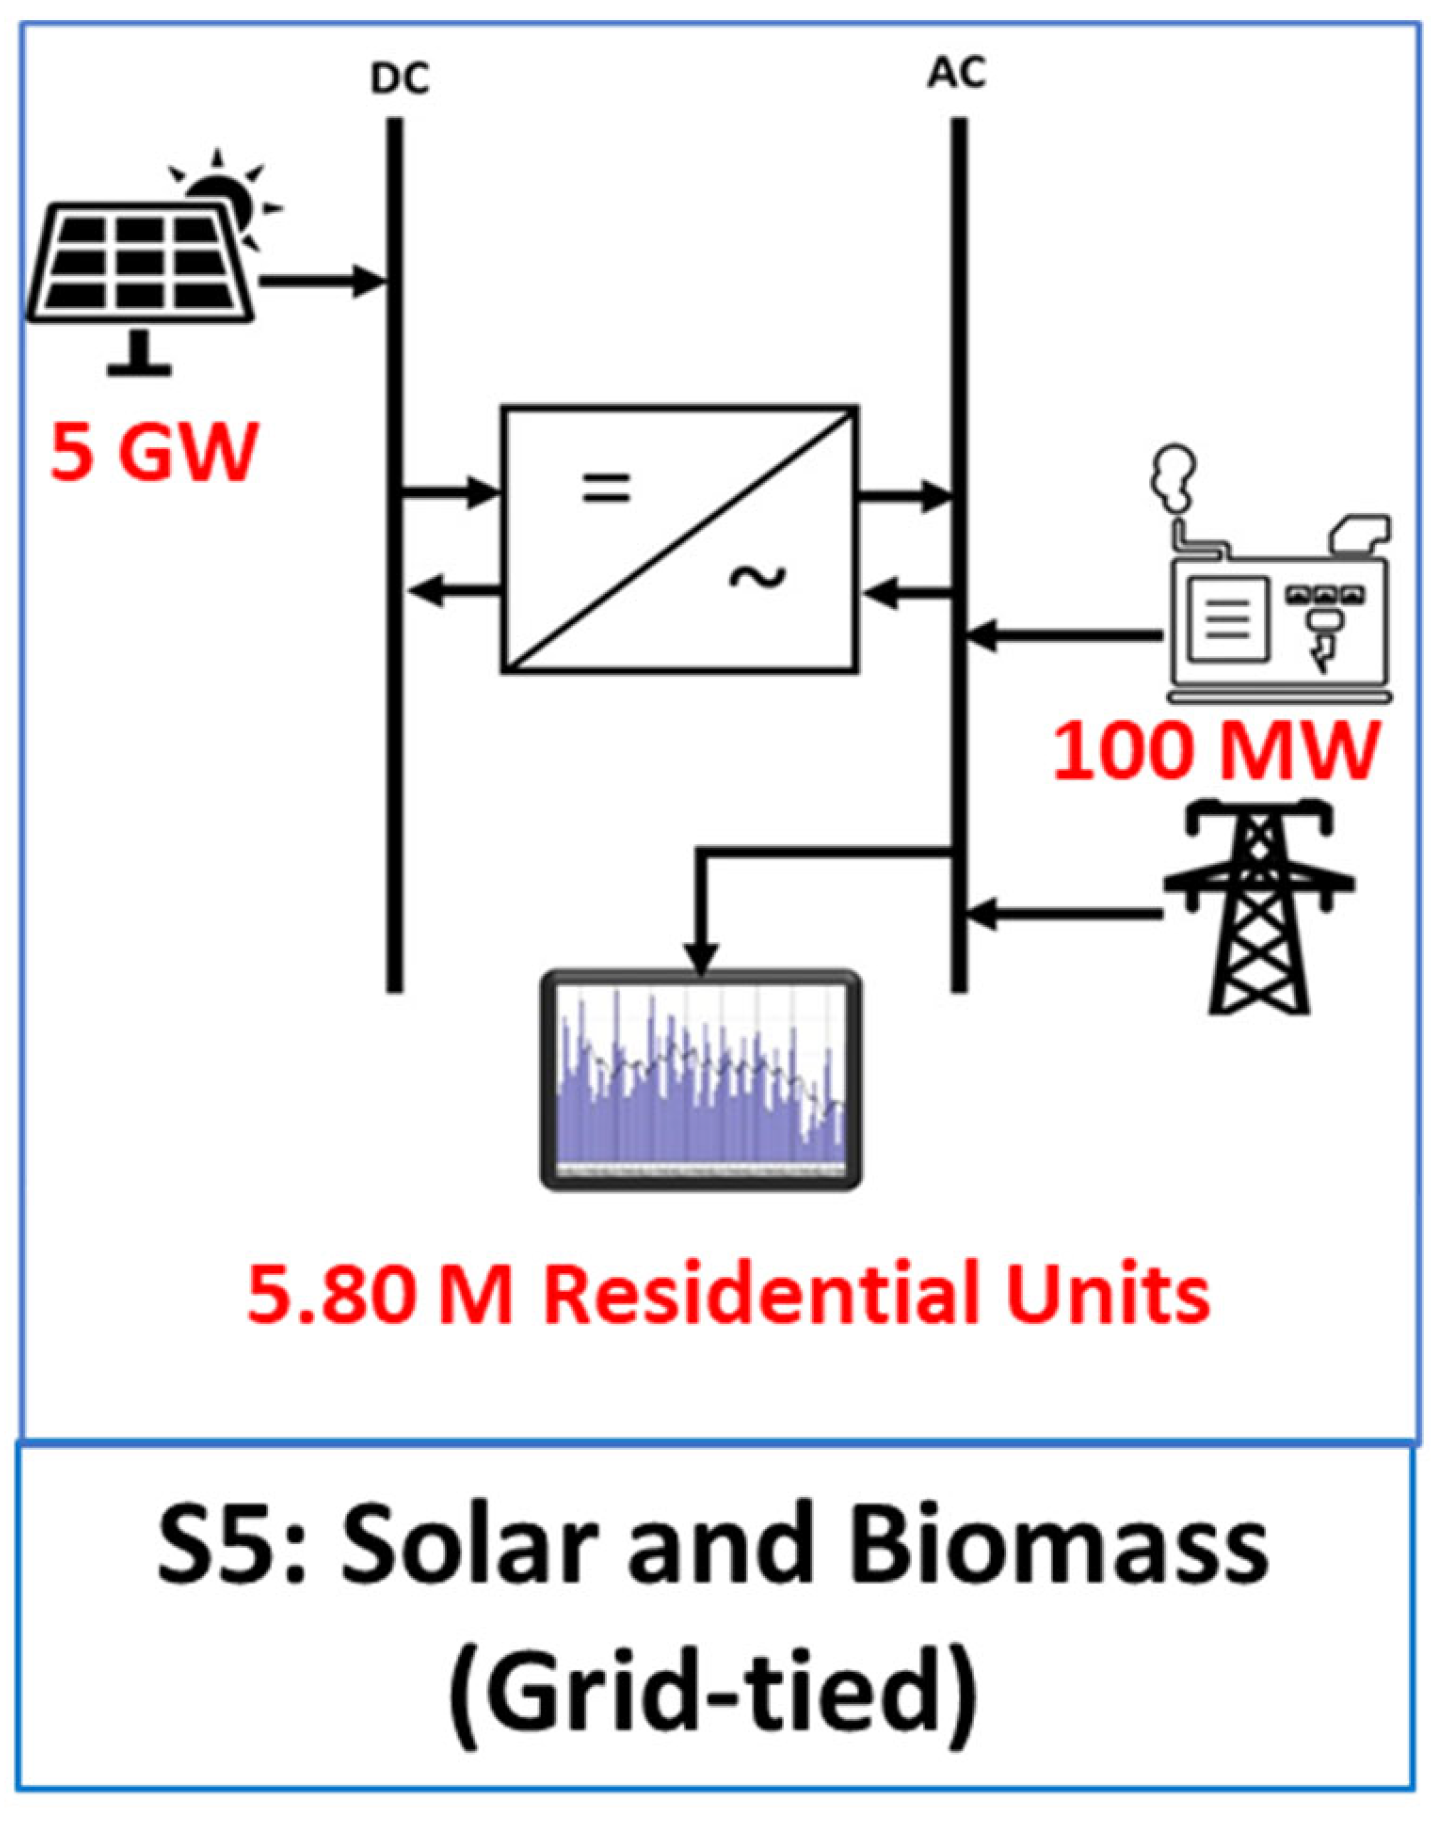
2.1. System Configuration and Scenario Definition
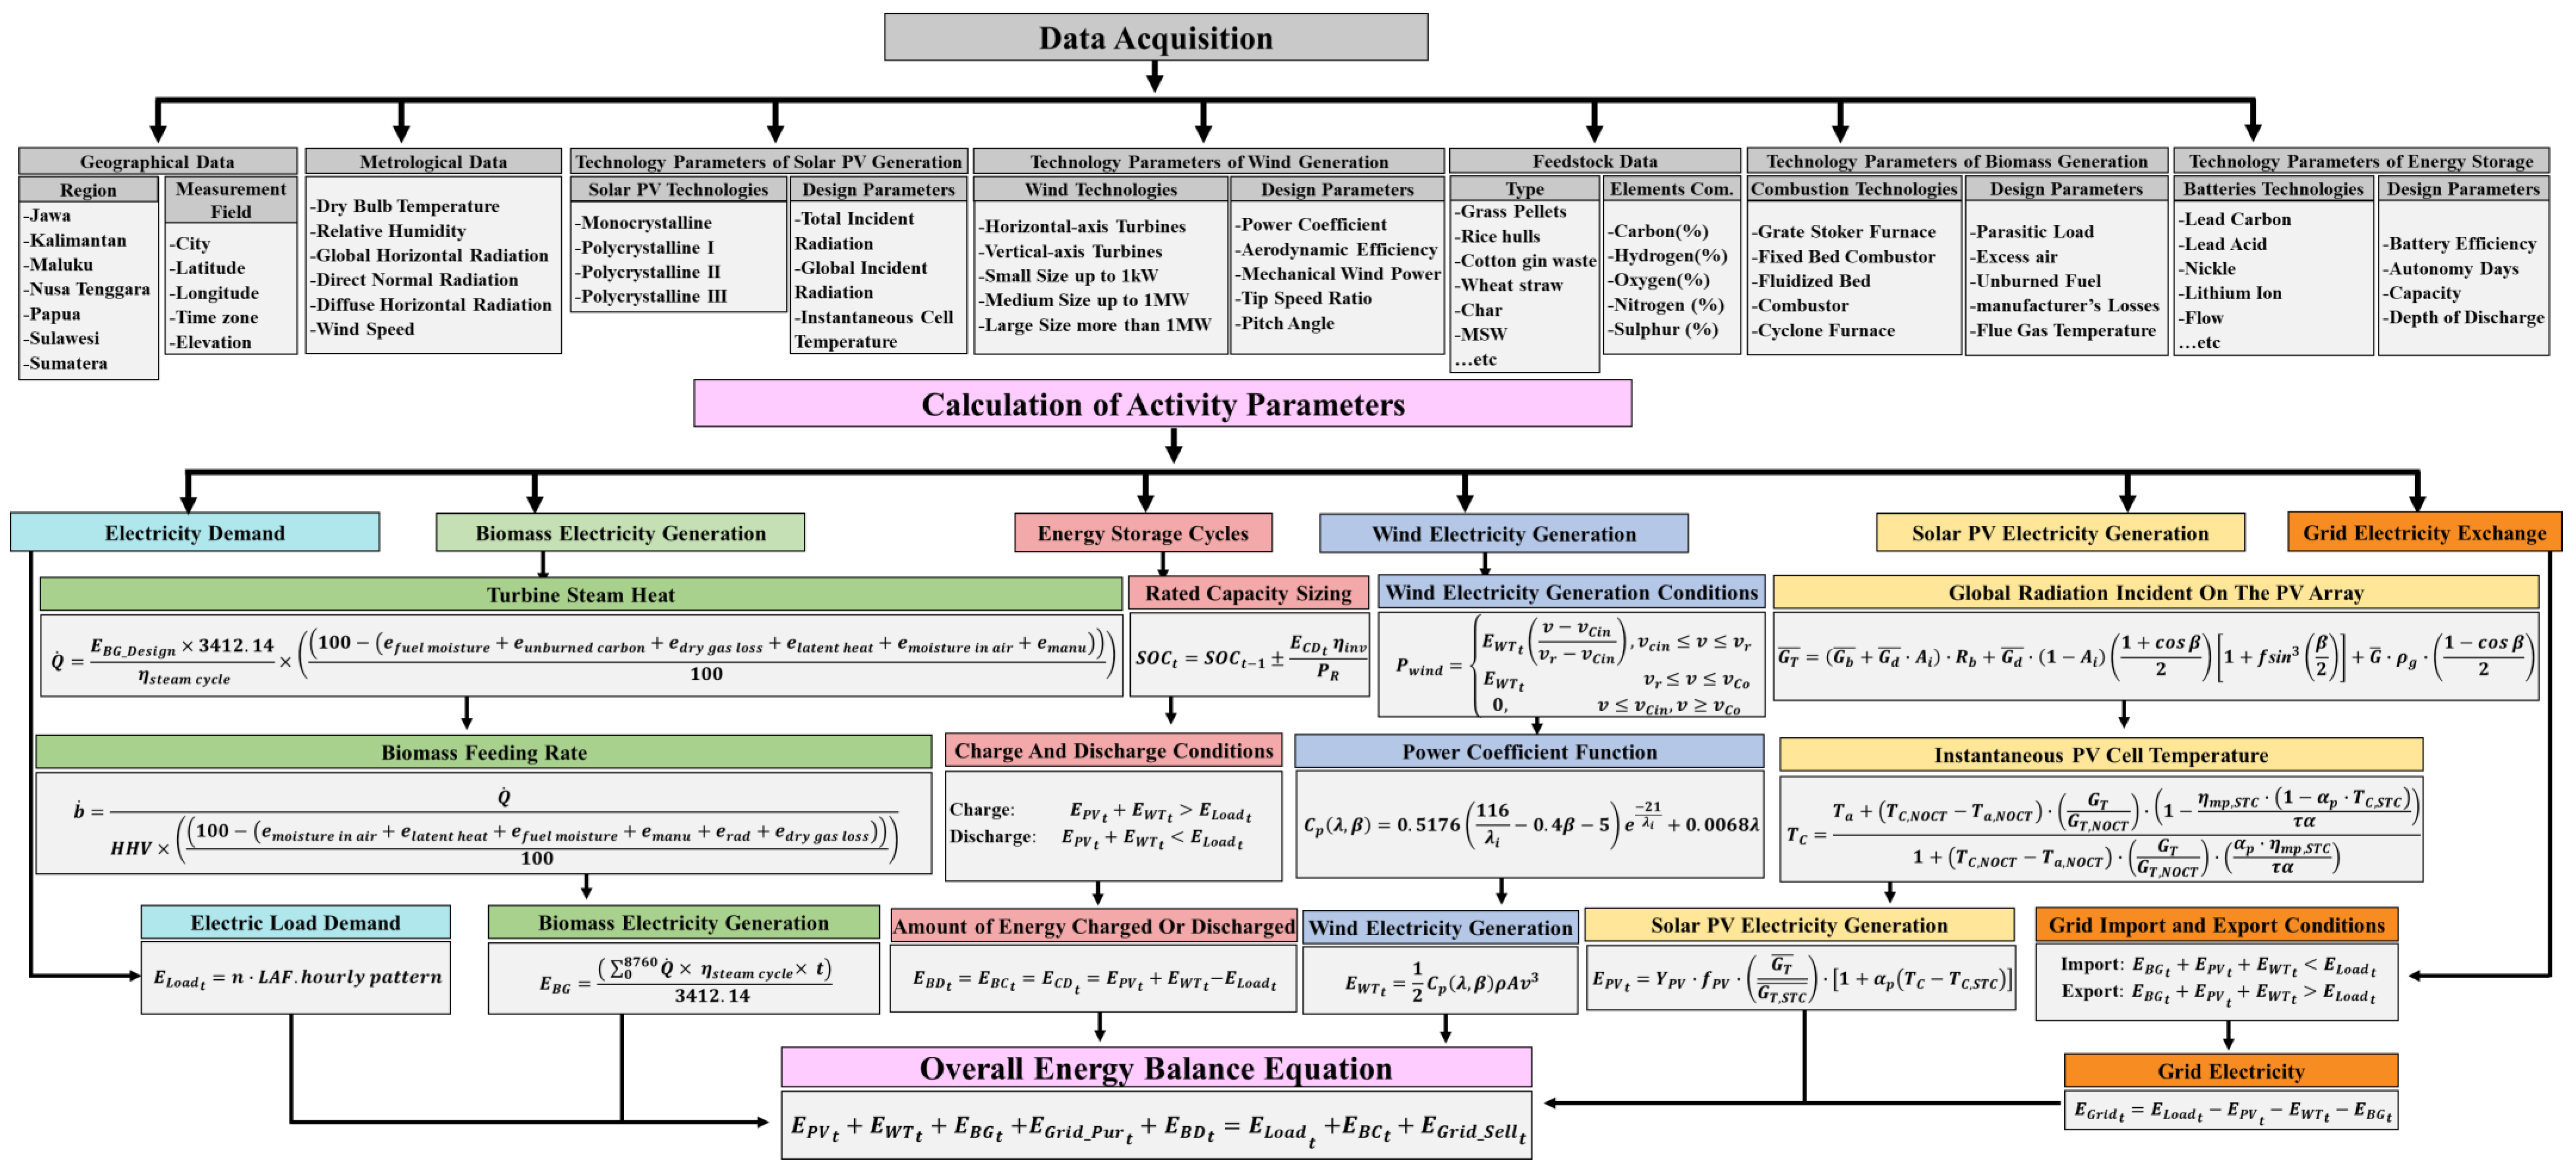
2.2. Data Acquisition
2.3. Calculation of the Activity Parameters
2.4. Potential Reduction in GHG Emissions and Air Pollutants
2.5. Public Health Co-Benefit Assessment
2.6. Cost–Benefit Assessment
3. Results and Discussion
3.1. Technology-Wise Impact Assessment
3.1.1. The Case of Bali
3.1.2. The Case of Jakarta
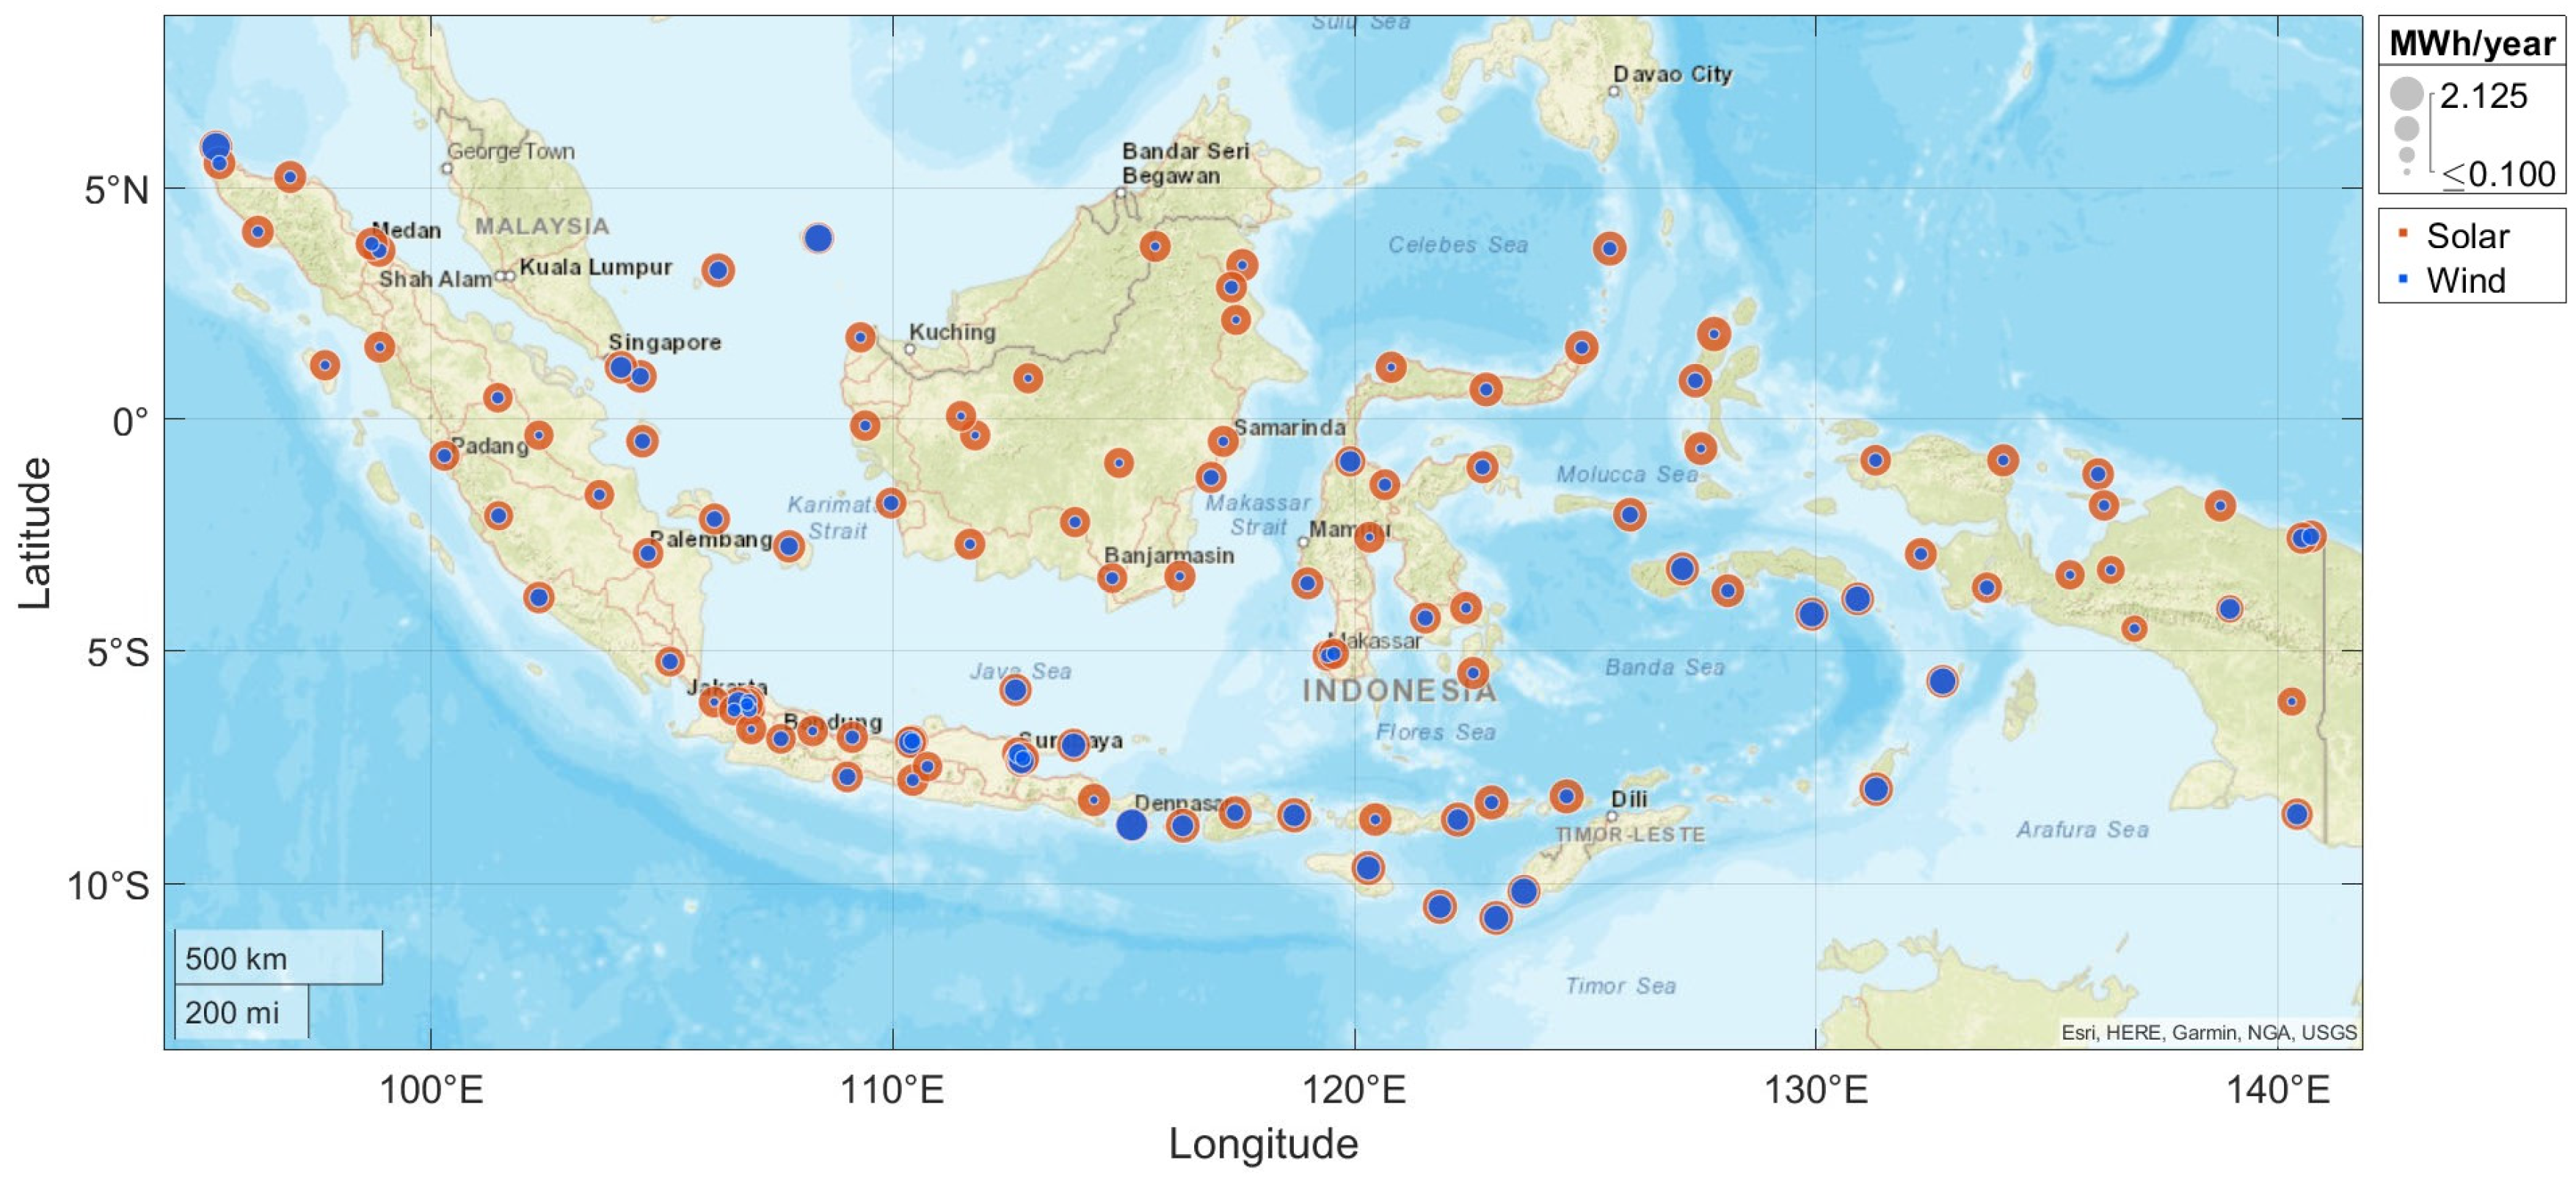
3.2. Regional-Wise Impact Assessment
3.3. Stated Policies Scenarios Assessment
4. Conclusions
Supplementary Materials
Author Contributions
Funding
Data Availability Statement
Conflicts of Interest
Nomenclature
| Abbreviations | |
| ADALYs | Averted Disability-Adjusted Life Years |
| ALRI | Acute Lower Respiratory Infections |
| CO | Carbon Monoxide |
| CO2 | Carbon Dioxide |
| COD | Chronic Obstructive Pulmonary Disease |
| DALYs | Disability-Adjusted Life Years |
| GHG | Greenhouse Gas |
| PGDP | Per capia Gross Domestic Product |
| GRP | Gross Regional Product per Capita |
| HRES | Hybrid Renewable Energy System |
| IEA | International Energy Agency |
| IHD | Ischemic Heart Disease |
| LC | Lung Cancer |
| NDC | Nationally Determined Contribution |
| NOx | Nitrogen Oxides |
| NPV | Net Present Value |
| PM | Particulate Matter |
| PV | Photovoltaic |
| SO2 | Sulfur Dioxide |
| STEPS | Stated Policies Scenario |
| Stroke | Cerebrovascular Disease |
| TB | Tuberculosis And Bronchus |
| TMY | Typical Meteorological Years |
| VOCs | Volatile Organic Compounds |
| Units | |
| MW | Megawatt |
| MWh | Megawatt-hour |
| GW | Gigawatt |
| GWh | Gigawatt-hour |
| t | Ton |
| t/y | Ton per year |
| USD/t | U.S dollar per year |
| M USD/y | Million U.S dollars per year |
| B USD/y | Billion U.S dollars per year |
| Yrs | Years |
| Parameters | |
| Anisotropy index | |
| The ratio of beam radiation on the tilted surface to beam radiation on the horizontal surface | |
| The slope of the surface | |
| The horizon brightening factor | |
| Ground reflectance in percent | |
| The cell temperature | |
| The ambient temperature in kelvin | |
| Nominal operating cell temperature in 317 Kelvin | |
| The ambient temperature at which the NOCT is defined in 293 Kelvin | |
| Temperature coefficient of power in percent per Celsius | |
| The cell temperature under standard test conditions in 298 Kelvin | |
| The solar transmittance of any cover over the PV array in percent | |
| Solar absorptance of the PV array in percent | |
| The efficiency of the PV array at its maximum power point under standard conditions in percent | |
| The rated capacity of the PV array in kW | |
| PV derating factor in percent | |
| Wind speed in meters per second | |
| Cut-in speed in meters per second | |
| Cut-out speed in meters per second | |
| Rated wind speed in meters per second | |
| The wind power coefficient | |
| The tip speed ratio | |
| The pitch angle | |
| ρ | The air density |
| The swept area by the blades | |
| The size of the rated power capacity of the battery in kWh | |
| The peak demand load in kWh | |
| State of charge of the batteries for the time step of in kWh | |
| Steam heat to be supplied to the turbine in Btu | |
| Biomass generator capacity in kW | |
| Steam cycle efficiencies | |
| Fuel moisture efficiency loss | |
| Unburned carbon efficiency loss | |
| Dry gas efficiency loss | |
| Latent heat efficiency loss | |
| Moisture in air efficiency loss | |
| Manufacturer efficiency loss | |
| Number of residential load units | |
| Load adjustment factor | |
| Demand patterns of residential, commercial, or industrial loads | |
| Variables | |
| Solar radiation incident on the PV array in the current time step in kW/m2 | |
| Beam radiation in kW/m2 | |
| Diffuse radiation in kW/m2 | |
| Solar radiation striking the PV array in kW/m2 | |
| Solar radiation at which the NOCT is defined as 0.8 kW/m2 | |
| The incident radiation at standard test conditions in kW/m2 | |
| Hourly generated electricity from solar panels in kWh | |
| The total generated electricity from wind turbines in kWh | |
| Hourly generated electricity from wind turbines in kWh | |
| Hourly charged or discharged amount of battery energy in kWh | |
| Hourly charged amount of battery energy in kWh | |
| Hourly discharged amount of battery energy in kWh | |
| Amount of biomass feeding rate in lb/h | |
| The feedstock gross calorific value | |
| Hourly biomass generated electricity in kWh | |
| Hourly electricity sold or purchased from the grid in kWh | |
| Hourly electricity demand in kWh |
References
- Su, M.; Wang, Q.; Li, R.; Wang, L. Per capita renewable energy consumption in 116 countries: The effects of urbanization, industrialization, GDP, aging, and trade openness. Energy 2022, 254, 124289. [Google Scholar] [CrossRef]
- International Energy Agency (IEA). Global Energy Review 2020. 2020. Available online: https://www.iea.org/reports/global-energy-review-2020 (accessed on 29 January 2024).
- Azam, M. Energy and economic growth in developing Asian economies. J. Asia Pac. Econ. 2020, 25, 447–471. [Google Scholar] [CrossRef]
- McDonald-Buller, E.; McGaughey, G.; Grant, J.; Shah, T.; Kimura, Y.; Yarwood, G. Emissions and Air Quality Implications of Upstream and Midstream Oil and Gas Operations in Mexico. Atmosphere 2021, 12, 1696. [Google Scholar] [CrossRef]
- World Health Organization (WHO). Air Pollution. 2021. Available online: https://www.who.int/health-topics/air-pollution#tab=tab_1 (accessed on 21 December 2023).
- Lu, S.; Bai, X.; Zhang, X.; Li, W.; Tang, Y. The impact of climate change on the sustainable development of regional economy. J. Clean. Prod. 2019, 233, 1387–1395. [Google Scholar] [CrossRef]
- Mamat, R.; Sani, M.S.M.; Khoerunnisa, F.; Kadarohman, A. Target and demand for renewable energy across 10 ASEAN countries by 2040. Electr. J. 2019, 32, 106670. [Google Scholar] [CrossRef]
- Usman, M.; Radulescu, M. Examining the role of nuclear and renewable energy in reducing carbon footprint: Does the role of technological innovation really create some difference? Sci. Total Environ. 2022, 841, 156662. [Google Scholar] [CrossRef]
- Sekaringtias, A.; Verrier, B.; Cronin, J. Untangling the socio-political knots: A systems view on Indonesia’s inclusive energy transitions. Energy Res. Soc. Sci. 2023, 95, 102911. [Google Scholar] [CrossRef]
- ASEAN. ASEAN Plan of Action for Energy Cooperation (APAEC) 2016–2025 Phase II: 2021–2025. 2020. Available online: https://aseanenergy.org/asean-plan-of-action-for-energy-cooperation-apaec-phase-ii-2021-2025/ (accessed on 1 December 2023).
- International Energy Agency (IEA). 2022. Indonesia Data Explorer. Available online: https://www.iea.org/countries/Indonesia (accessed on 30 January 2023).
- Zusman, E.; Chae, Y.; Kim, H.; Farzaneh, H. An Introduction to Co-benefits: Core Concepts and Applications. In Aligning Climate Change and Sustainable Development Policies in Asia; Farzaneh, H., Zusman, E., Chae, Y., Eds.; Springer: Singapore, 2021. [Google Scholar] [CrossRef]
- Ayres, R.U.; Walter, J. The greenhouse effect: Damages, costs and abatement. Environ. Resour. Econ. 1991, 1, 237–270. [Google Scholar] [CrossRef]
- Karlsson, M.; Alfredsson, E.; Westling, N. Climate policy co-benefits: A review. Clim. Policy 2020, 20, 292–316. [Google Scholar] [CrossRef]
- Qian, H.; Xu, S.; Cao, J.; Ren, F.; Wei, W.; Meng, J.; Wu, L. Air pollution reduction and climate co-benefits in China’s industries. Nat. Sustain. 2021, 4, 417–425. [Google Scholar] [CrossRef]
- Xie, Y.; Dai, H.; Xu, X.; Fujimori, S.; Hasegawa, T.; Yi, K.; Masui, T.; Kurata, G. Co-benefits of climate mitigation on air quality and human health in Asian countries. Environ. Int. 2018, 119, 309–318. [Google Scholar] [CrossRef]
- Stroud, H.M.; Kirshen, P.H.; Timmons, D. Monetary evaluation of co-benefits of nature-based flood risk reduction infrastructure to promote climate justice. Mitig. Adapt. Strateg. Glob. Chang. 2022, 28, 5. [Google Scholar] [CrossRef]
- Yang, X.; Teng, F.; Xi, X.; Khayrullin, E.; Zhang, Q. Cost–benefit analysis of China’s Intended Nationally Determined Contributions based on carbon marginal cost curves. Appl. Energy 2018, 227, 415–425. [Google Scholar] [CrossRef]
- Nemet, G.F.; Holloway, T.; Meier, P. Implications of incorporating air-quality cobenefits into climate change policymaking. Environ. Res. Lett. 2010, 5, 014007. [Google Scholar] [CrossRef]
- Plachinski, S.D.; Holloway, T.; Meier, P.J.; Nemet, G.F.; Rrushaj, A.; Oberman, J.T.; Duran, P.L.; Voigt, C.L. Quantifying the emissions and air quality co-benefits of lower-carbon electricity production. Atmos. Environ. 2014, 94, 180–191. [Google Scholar] [CrossRef]
- Permadi, D.A.; Kim Oanh, N.T.; Vautard, R. Assessment of emission scenarios for 2030 and impacts of black carbon emission reduction measures on air quality and radiative forcing in Southeast Asia. Atmos. Chem. Phys. 2018, 18, 3321–3334. [Google Scholar] [CrossRef]
- Li, M.; Zhang, D.; Li, C.-T.; Mulvaney, K.M.; Selin, N.E.; Karplus, V.J. Air quality co-benefits of carbon pricing in China. Nat. Clim. Chang. 2018, 8, 398–403. [Google Scholar] [CrossRef]
- Jiang, X. Rapid decarbonization in the Chinese electric power sector and air pollution reduction Co-benefits in the Post-COP26 Era. Resour. Policy 2023, 82, 103482. [Google Scholar] [CrossRef]
- Bhat, T.H.; Farzaneh, H. Quantifying the multiple environmental, health, and economic benefits from the electrification of the Delhi public transport bus fleet, estimating a district-wise near roadway avoided PM2.5 exposure. J. Environ. Manag. 2022, 321, 116027. [Google Scholar] [CrossRef]
- Peng, B.; Erdoğan, S.; Nasri, A.A.; Zou, Z. Towards a health-conscious transportation planning: A framework for estimating health impacts of active transportation at local level. J. Transp. Health 2021, 22, 101231. [Google Scholar] [CrossRef]
- Chan, E.Y.Y.; Wang, S.S.; Ho, J.Y.E.; Huang, Z.; Liu, S.; Guo, C. Socio-demographic predictors of health and environmental co-benefit behaviours for climate change mitigation in urban China. PLoS ONE 2017, 12, e0188661. [Google Scholar] [CrossRef] [PubMed]
- Zhao, N.; Elshareef, H.; Li, B.; Wang, B.; Jia, Z.; Zhou, L.; Liu, Y.; Sultan, M.; Dong, R.; Zhou, Y. The efforts of China to combat air pollution during the period of 2015–2018: A case study assessing the environmental, health and economic benefits in the Beijing-Tianjin-Hebei and surrounding “2 + 26” regions. Sci. Total Environ. 2022, 853, 158437. [Google Scholar] [CrossRef] [PubMed]
- Lema, R.; Bhamidipati, P.L.; Gregersen, C.; Hansen, U.E.; Kirchherr, J. China’s investments in renewable energy in Africa: Creating co-benefits or just cashing-in? World Dev. 2021, 141, 105365. [Google Scholar] [CrossRef]
- Reyseliani, N.; Purwanto, W.W. Pathway towards 100% renewable energy in Indonesia power system by 2050. Renew. Energy 2021, 176, 305–321. [Google Scholar] [CrossRef]
- Jacob, E.; Farzaneh, H. Dynamic modeling and experimental validation of a standalone hybrid microgrid system in Fukuoka, Japan. Energy Convers. Manag. 2022, 274, 116462. [Google Scholar] [CrossRef]
- Shufian, A.; Mohammad, N. Modeling and analysis of cost-effective energy management for integrated microgrids. Clean. Eng. Technol. 2022, 8, 100508. [Google Scholar] [CrossRef]
- Lawrie, L.K.; Crawley, D.B. Development of Global Typical Meteorological Years (TMYx). 2019. Available online: http://climate.onebuilding.org (accessed on 1 December 2023).
- Badan Pusat Statistik. 2023. Available online: https://www.bps.go.id (accessed on 21 December 2023).
- Energy Policy Institute of the University of Chicago. Air Quality Life Index. 2023. Available online: https://aqli.epic.uchicago.edu/the-index/ (accessed on 21 December 2023).
- Japan International Cooperation Agency. Data Collection Survey on Power Sector in Indonesia for Decarbonization. 2022. Available online: https://openjicareport.jica.go.jp/pdf/12342481.pdf (accessed on 21 December 2023).
- International Energy Agency (IEA). Enhancing Indonesia’s Power System. 2022. Available online: https://www.iea.org/reports/enhancing-indonesias-power-system (accessed on 21 December 2023).
- U.S. Environmental Protection Agency (EPA). AP 42, Fifth Edition, Volume I Chapter 3: Stationary Internal Combustion Sources. 2022. Available online: https://www.epa.gov/air-emissions-factors-and-quantification/ap-42-fifth-edition-volume-i-chapter-3-stationary-0 (accessed on 21 December 2023).
- Hassan Bhat, T.; Jiawen, G.; Farzaneh, H. Air Pollution Health Risk Assessment (AP-HRA), Principles and Applications. Int. J. Environ. Res. Public Health 2021, 18, 1935. [Google Scholar] [CrossRef] [PubMed]
- Farzaneh, H.; Dashti, M.; Zusman, E.; Lee, S.Y.; Dagvadorj, D.; Nie, Z. Assessing the environmental-health-economic co-benefits from solar electricity and thermal heating in Ulaanbaatar, Mongolia. Int. J. Environ. Res. Public Health 2022, 19, 6931. [Google Scholar] [CrossRef]
- Institute for Health Metrics and Evaluation. Global Burden of Disease (GBD). 2022. Available online: https://vizhub.healthdata.org/gbd-compare/ (accessed on 21 December 2023).
- Delapedra-Silva, V.; Ferreira, P.; Cunha, J.; Kimura, H. Methods for financial assessment of renewable energy projects: A review. Processes 2022, 10, 184. [Google Scholar] [CrossRef]
- Xiao, H.; Wei, Q.; Wang, H. Marginal abatement cost and carbon reduction potential outlook of key energy efficiency technologies in China’s building sector to 2030. Energy Policy 2014, 69, 92–105. [Google Scholar] [CrossRef]
- The World Bank. Electric power consumption (kWh per capita)—Indonesia. Available online: https://data.worldbank.org/indicator/EG.USE.ELEC.KH.PC?locations=ID (accessed on 1 December 2023).
- Wind-Turbine-Models. Wind Turbines Database. 2023. Available online: https://en.wind-turbine-models.com/ (accessed on 1 December 2023).
- Cui, J.; Liu, S.; Liu, J.; Liu, X. A comparative study of MPC and economic MPC of wind energy conversion systems. Energies 2018, 11, 3127. [Google Scholar] [CrossRef]
- Munteanu, I.; Bacha, S.; Bratcu, A.I.; Guiraud, J.; Roye, D. Energy-reliability optimization of wind energy conversion systems by sliding mode control. IEEE Trans. Energy Convers. 2008, 23, 975–985. [Google Scholar] [CrossRef]
- Zou, Y. Induction generator in wind power systems. In Induction Motors-Applications, Control and Fault Diagnostics; IntechOpen: London, UK, 2015. [Google Scholar] [CrossRef]
- Jorgenson, J.; Gilman, P.; Dobos, A. Technical Manual for the SAM Biomass Power Generation Model (No. NREL/TP-6A20-52688); National Renewable Energy Lab. (NREL): Golden, CO, USA, 2011. [Google Scholar] [CrossRef]
- Phyllis. Database for Biomass and Waste. 4 August 2011. Available online: http://www.ecn.nl/phyllis/ (accessed on 1 December 2023).
- Kitto, J.B.; Stultz, S.C. Steam/Its Generation and Use, 41st ed.; Library of Congress Catalog Number: 92-74123; The Babcock & Wilcox Company: Barberton, OH, USA, 2005; ISBN 978-0-9634570-2-8. ISSN 1556-5173. [Google Scholar]
- EPA. U.S. Environmental Protection Agency, Combined Heat and Power Partnership. Biomass Combined Heat and Power Catalog of Technologies. 2017. Available online: https://www.epa.gov/sites/default/files/2015-07/documents/catalog_of_chp_technologies.pdf (accessed on 1 December 2023).
- Technical Feasibility Assessment Team. Foresthill Biomass Utilization Feasibility Study. Placer County Resource Conservation District. 2015. Available online: https://www.placerair.org/DocumentCenter/View/1916/09-2015-Foresthill-Biomass-Utilization-Feasibility-Study-PDF (accessed on 1 December 2023).
- Ogunjuyigbe, A.S.O.; Ayodele, T.R.; Akinola, O.A. Optimal allocation and sizing of PV/Wind/Split-diesel/Battery hybrid energy system for minimizing life cycle cost, carbon emission and dump energy of remote residential building. Appl. Energy 2016, 171, 153–171. [Google Scholar] [CrossRef]
- ANCHOR by Panasonic. Panasonic Solar Panel Polycrystalline. 2023. Available online: https://www.wattscore.com/_files/ugd/07f8d4_b3c826c86835493e8a2bf9954fa90251.pdf?index=true (accessed on 1 December 2023).
- Panasonic. EverVolt HK Black Series Solar Module, 410/400 W. 2023. Available online: https://ftp.panasonic.com/solar/datasheet/400_410_hk_series.pdf (accessed on 1 December 2023).
- EcoSoch. Lead Acid Battery. 2020. Available online: https://www.ecosoch.com/lead-acid-battery/ (accessed on 1 December 2023).


| Scenario | S1 | S2 | S3 | S4 | S5 | S6 | S7 | S8 | |
|---|---|---|---|---|---|---|---|---|---|
| Assessment | -------------------------------Technology-Wise------------------------ | --Region-Wise-- | |||||||
| Province | Bali | Bali | Bali | Bali | Jakarta | Jakarta | Aceh | East Java | |
| Residential Load Unit Number | 2400 | 2400 | 1.04M | 1.64M | 5.80M | 5.42M | 7.28M | 7.33M | |
| Demand | (GWh) | 2.6 | 2.6 | 1117 | 1762 | 6239 | 5830 | 7827 | 7891 |
| HRES Supply | (GWh) | 2.6 | 2.6 | 1122 | 1769 | 6266 | 5851 | 7858 | 7923 |
| Grid Supply Sell | (GWh) | 0 | 1.17 | 517 | 546 | 2945 | 2720 | 4320 | 4310 |
| Grid Supply Purchase | (GWh) | 0 | 1.17 | 512 | 539 | 2918 | 2699 | 4289 | 4278 |
| Energy Storage Capacity | (MWh) | 8 | - | - | - | - | - | - | - |
| Solar Installed Capacity | (MW) | 0.1 | 0.1 | 500 | 500 | 3000 | 3000 | 4000 | 4000 |
| Wind Installed Capacity | (MW) | 2 | 2 | 100 | 100 | - | - | - | - |
| Biomass Installed Capacity | (MW) | - | - | - | 100 | 100 | 100 | - | - |
| Scenario | S1 | S2 | S3 | S4 | S5 | S6 | S7 | S8 | ||
|---|---|---|---|---|---|---|---|---|---|---|
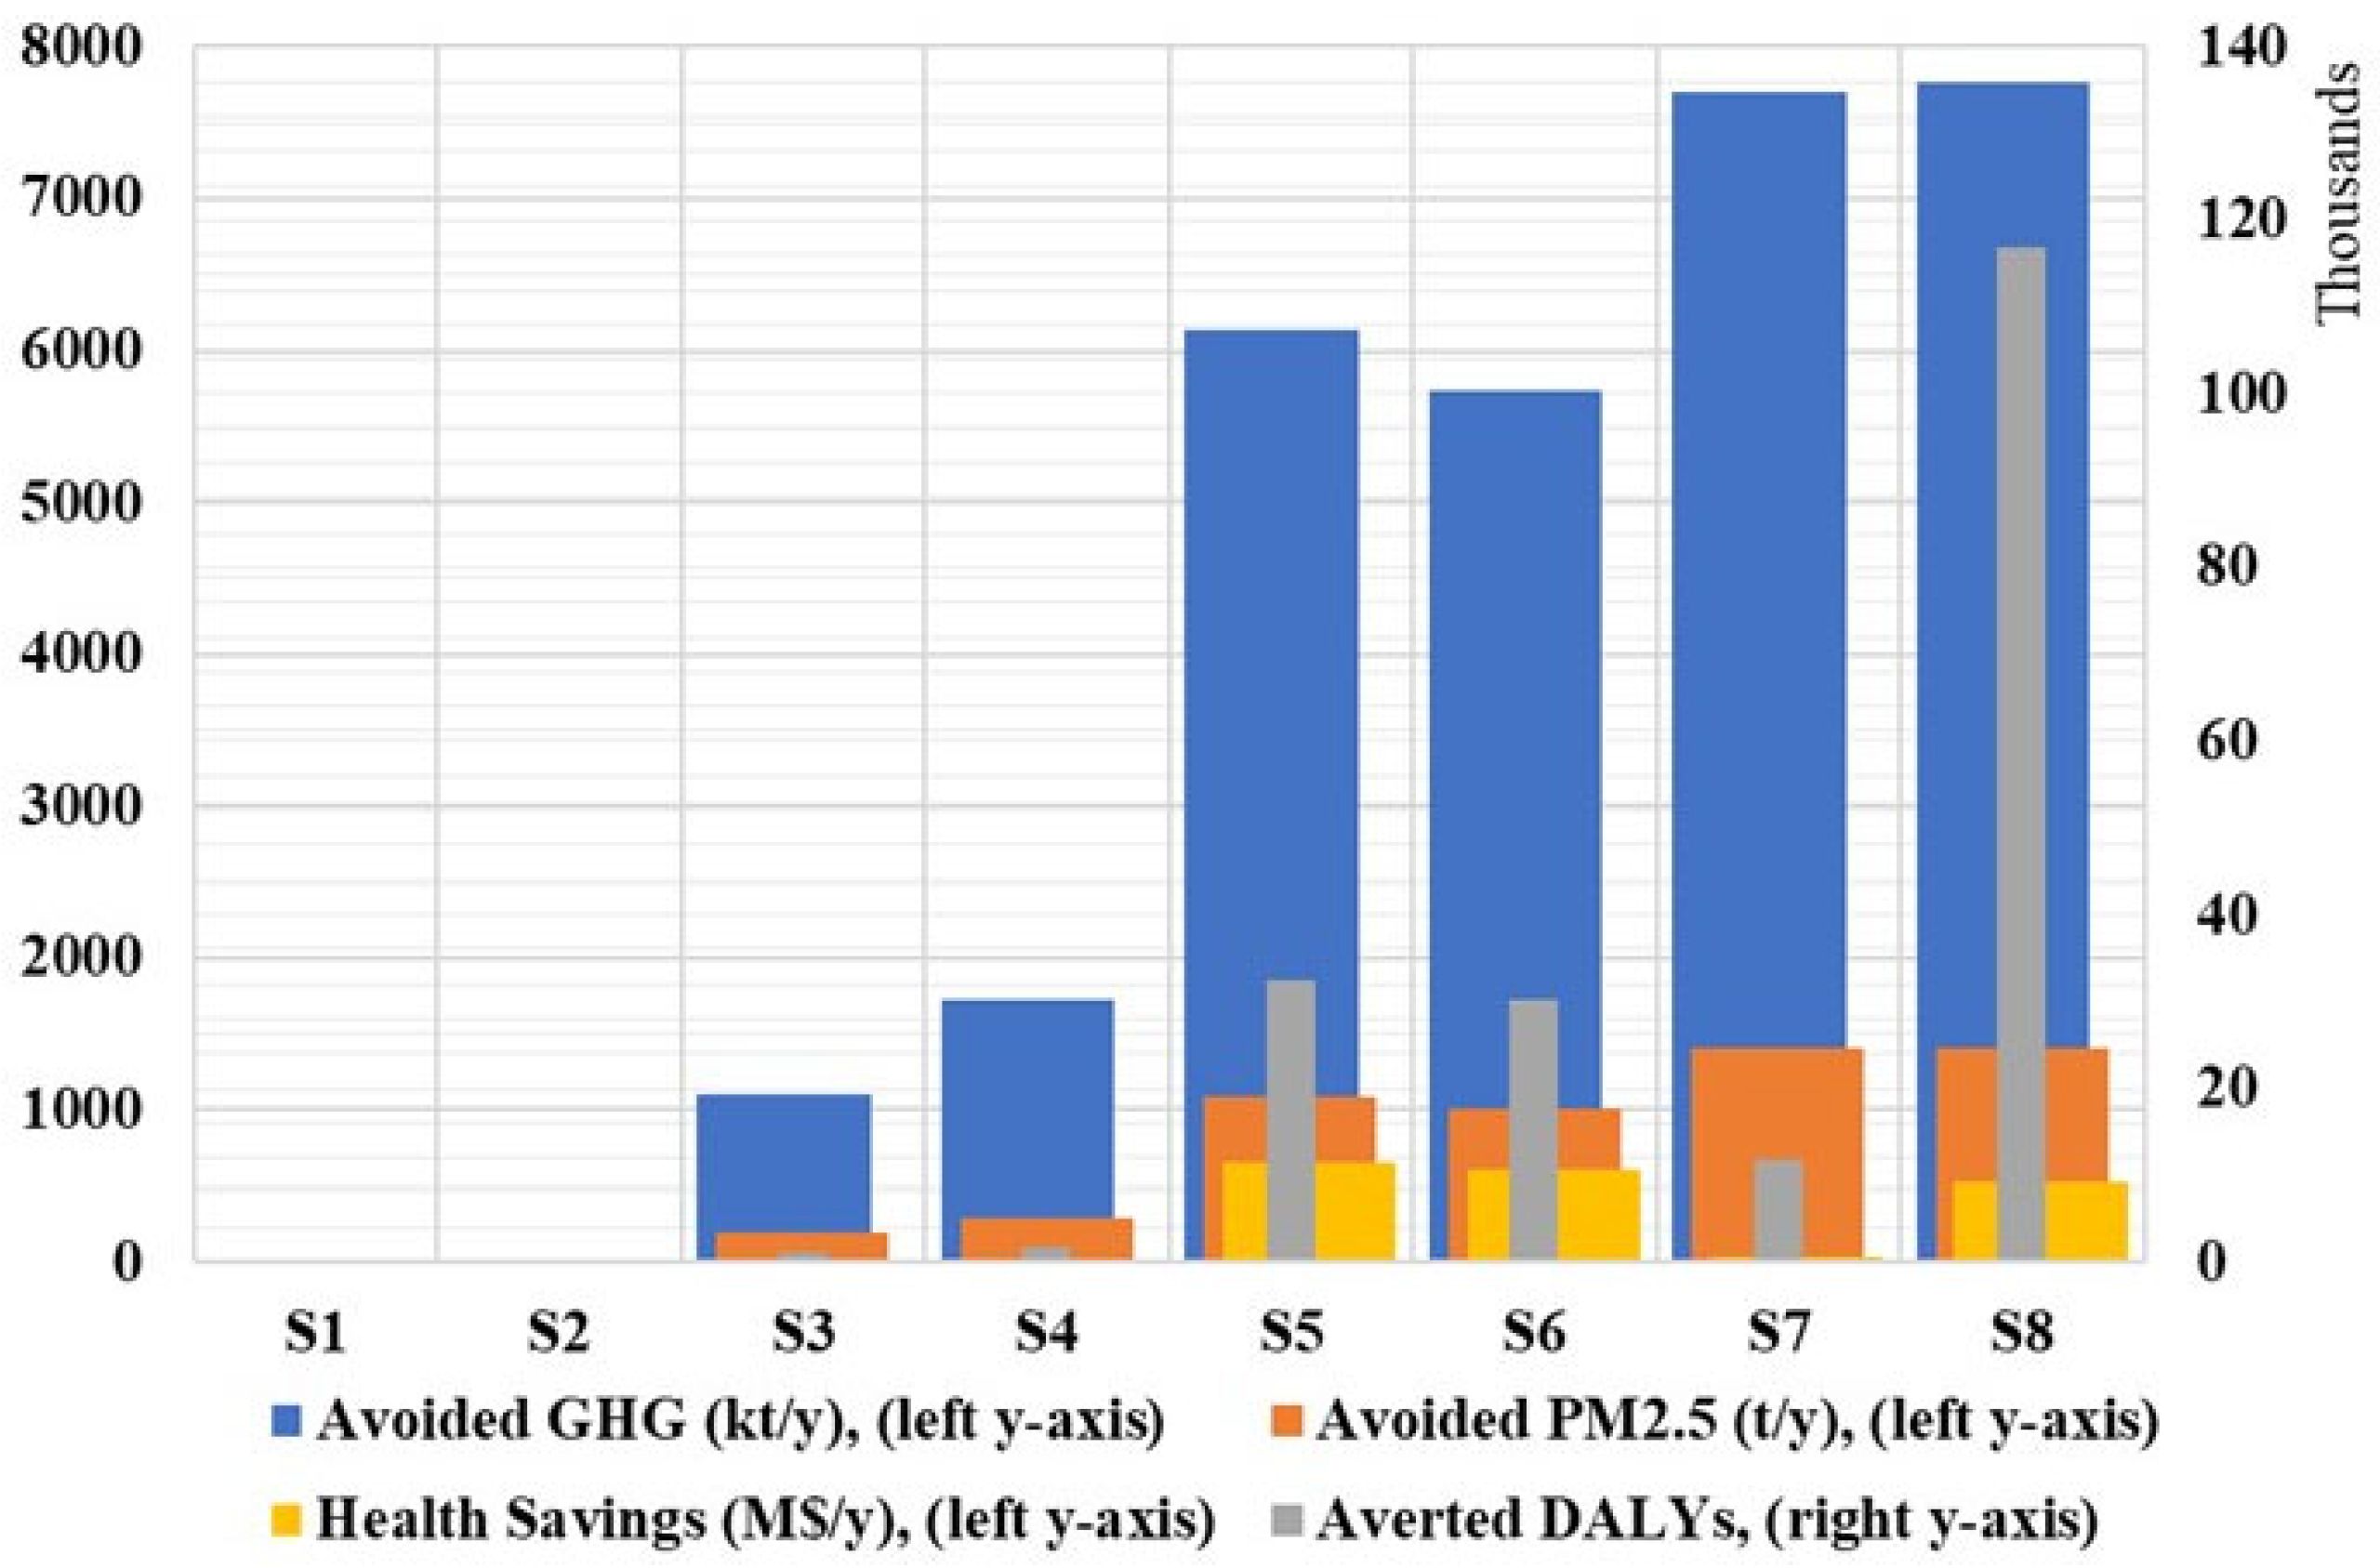
| Avoided GHG | (Mt/y) | 0.0025 | 0.0025 | 1.1 | 1.73 | 6.14 | 5.73 | 7.7 | 7.76 | |
| Avoided PM2.5 | (t/y) | 0.45 | 0.45 | 199.68 | 289.02 | 1088.01 | 1014.11 | 1398.76 | 1410.24 | |
| Averted DALYs | 3 | 3 | 1136 | 1648 | 32,490 | 30,146 | 11,818 | 116,835 | ||
| Health Savings | (M USD/y) | 0.9 | 0.9 | 4.25 | 6.16 | 652.81 | 605.72 | 31.16 | 522.14 | |
| NPV | Without Co-benefits | (M USD) | −143.39 | −67.93 | −8495.58 | −5747.00 | −35,385.42 | −54,414.46 | −32,086.23 | −30,770.96 |
| With Co-benefits | (M USD) | −140.847 | −65.45 | −7384.78 | −4135.53 | 135,265.88 | 103,926.07 | −23,939.66 | 105,720.31 | |
| PBP | Without Co-benefits | (Yrs) | >25 | >25 | 18 | 15 | 17 | 20 | 15 | 15 |
| With Co-benefits | (Yrs) | >25 | >25 | 17 | 15 | 7 | 8 | 15 | 9 | |
| Marginal Abatement Cost | Without Co-benefits | (USD/t) | 1890.41 | 917.21 | 257.76 | 110.56 | 192.21 | 316.54 | 138.98 | 132.19 |
| With Co-benefits | (USD/t) | 1856.88 | 883.68 | 224.06 | 79.56 | −734.74 | −604.56 | 103.69 | −454.18 | |
Disclaimer/Publisher’s Note: The statements, opinions and data contained in all publications are solely those of the individual author(s) and contributor(s) and not of MDPI and/or the editor(s). MDPI and/or the editor(s) disclaim responsibility for any injury to people or property resulting from any ideas, methods, instructions or products referred to in the content. |
© 2024 by the authors. Licensee MDPI, Basel, Switzerland. This article is an open access article distributed under the terms and conditions of the Creative Commons Attribution (CC BY) license (https://creativecommons.org/licenses/by/4.0/).
Share and Cite
Suliman, M.S.; Farzaneh, H.; Zusman, E.; Mulumba, A.N.; Lestari, P.; Permadi, D.A.; Janardhanan, N. Quantifying the Climate Co-Benefits of Hybrid Renewable Power Generation in Indonesia: A Multi-Regional and Technological Assessment. Climate 2024, 12, 23. https://doi.org/10.3390/cli12020023
Suliman MS, Farzaneh H, Zusman E, Mulumba AN, Lestari P, Permadi DA, Janardhanan N. Quantifying the Climate Co-Benefits of Hybrid Renewable Power Generation in Indonesia: A Multi-Regional and Technological Assessment. Climate. 2024; 12(2):23. https://doi.org/10.3390/cli12020023
Chicago/Turabian StyleSuliman, Mohamed Saad, Hooman Farzaneh, Eric Zusman, Alphonce Ngila Mulumba, Puji Lestari, Didin Agustian Permadi, and Nandakumar Janardhanan. 2024. "Quantifying the Climate Co-Benefits of Hybrid Renewable Power Generation in Indonesia: A Multi-Regional and Technological Assessment" Climate 12, no. 2: 23. https://doi.org/10.3390/cli12020023