
Projections of Changes in Atmospheric Conditions Leading to Storm Surges along the Coast of Santos, Brazil


 ,
,  ,
,  and
and 
Abstract
:1. Introduction
2. Materials and Methods
2.1. The Study Region
2.2. Eta Model
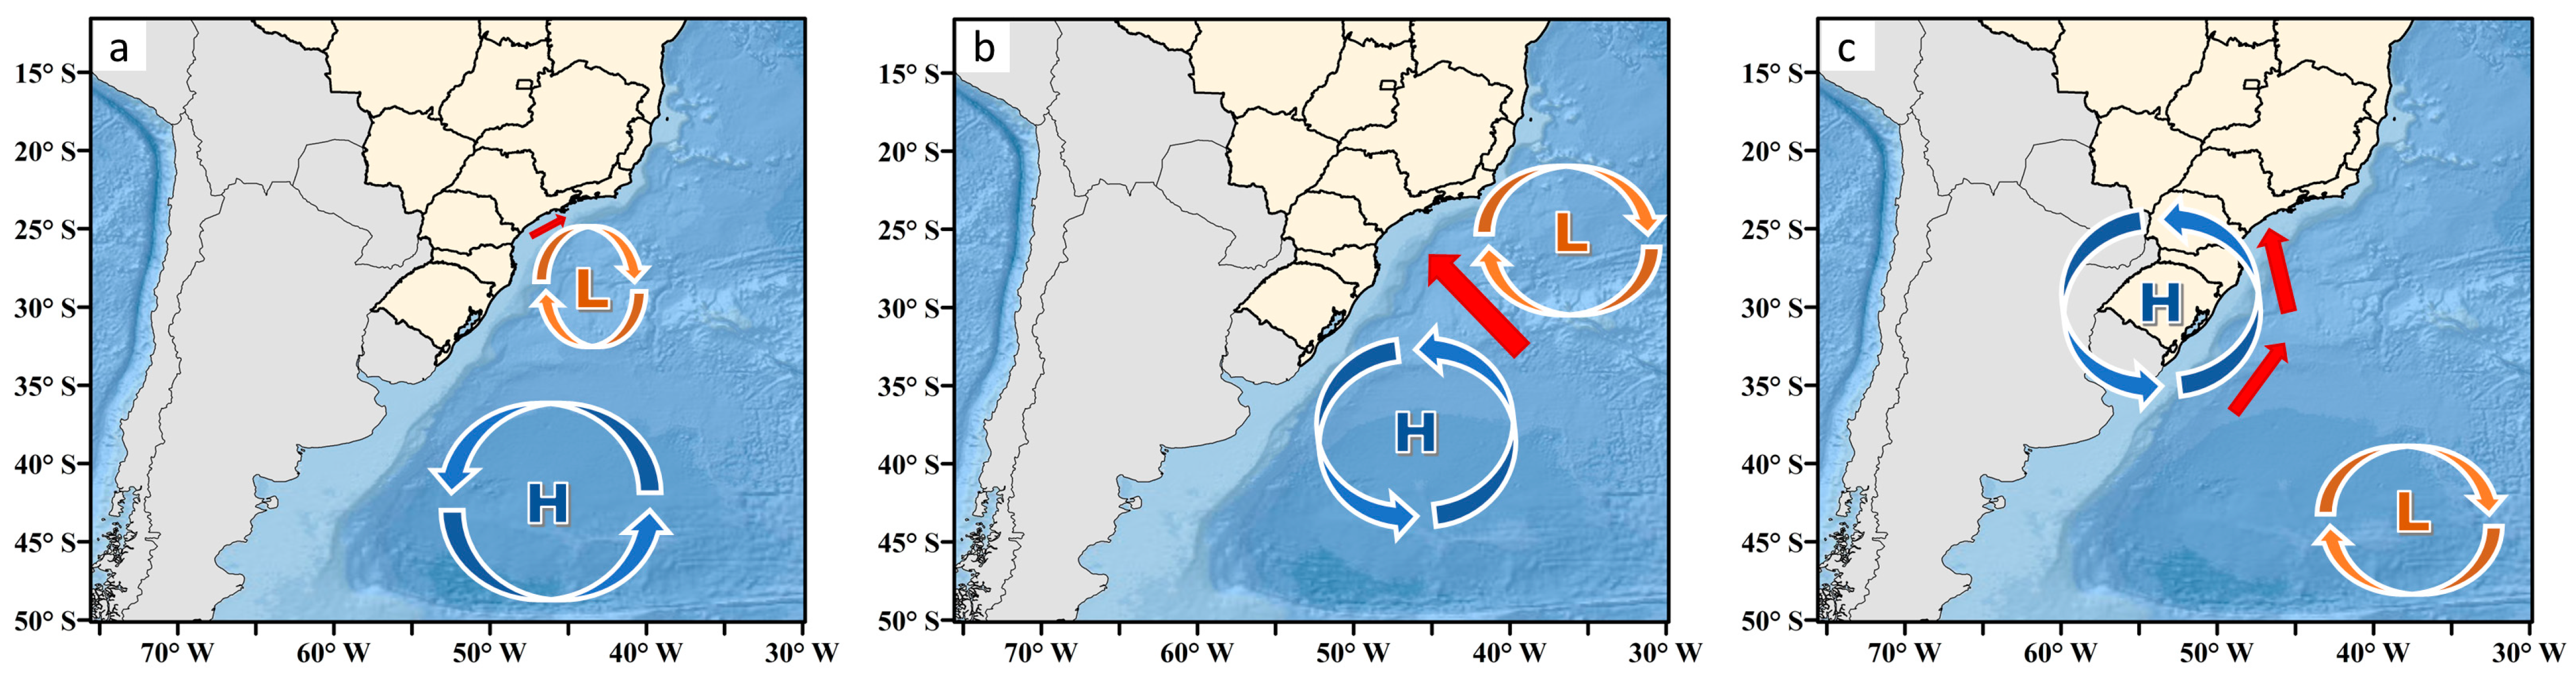
2.3. Atmospheric Patterns in Storm Surge
2.4. Detecting Atmospheric Patterns in Storm Surge
3. Results
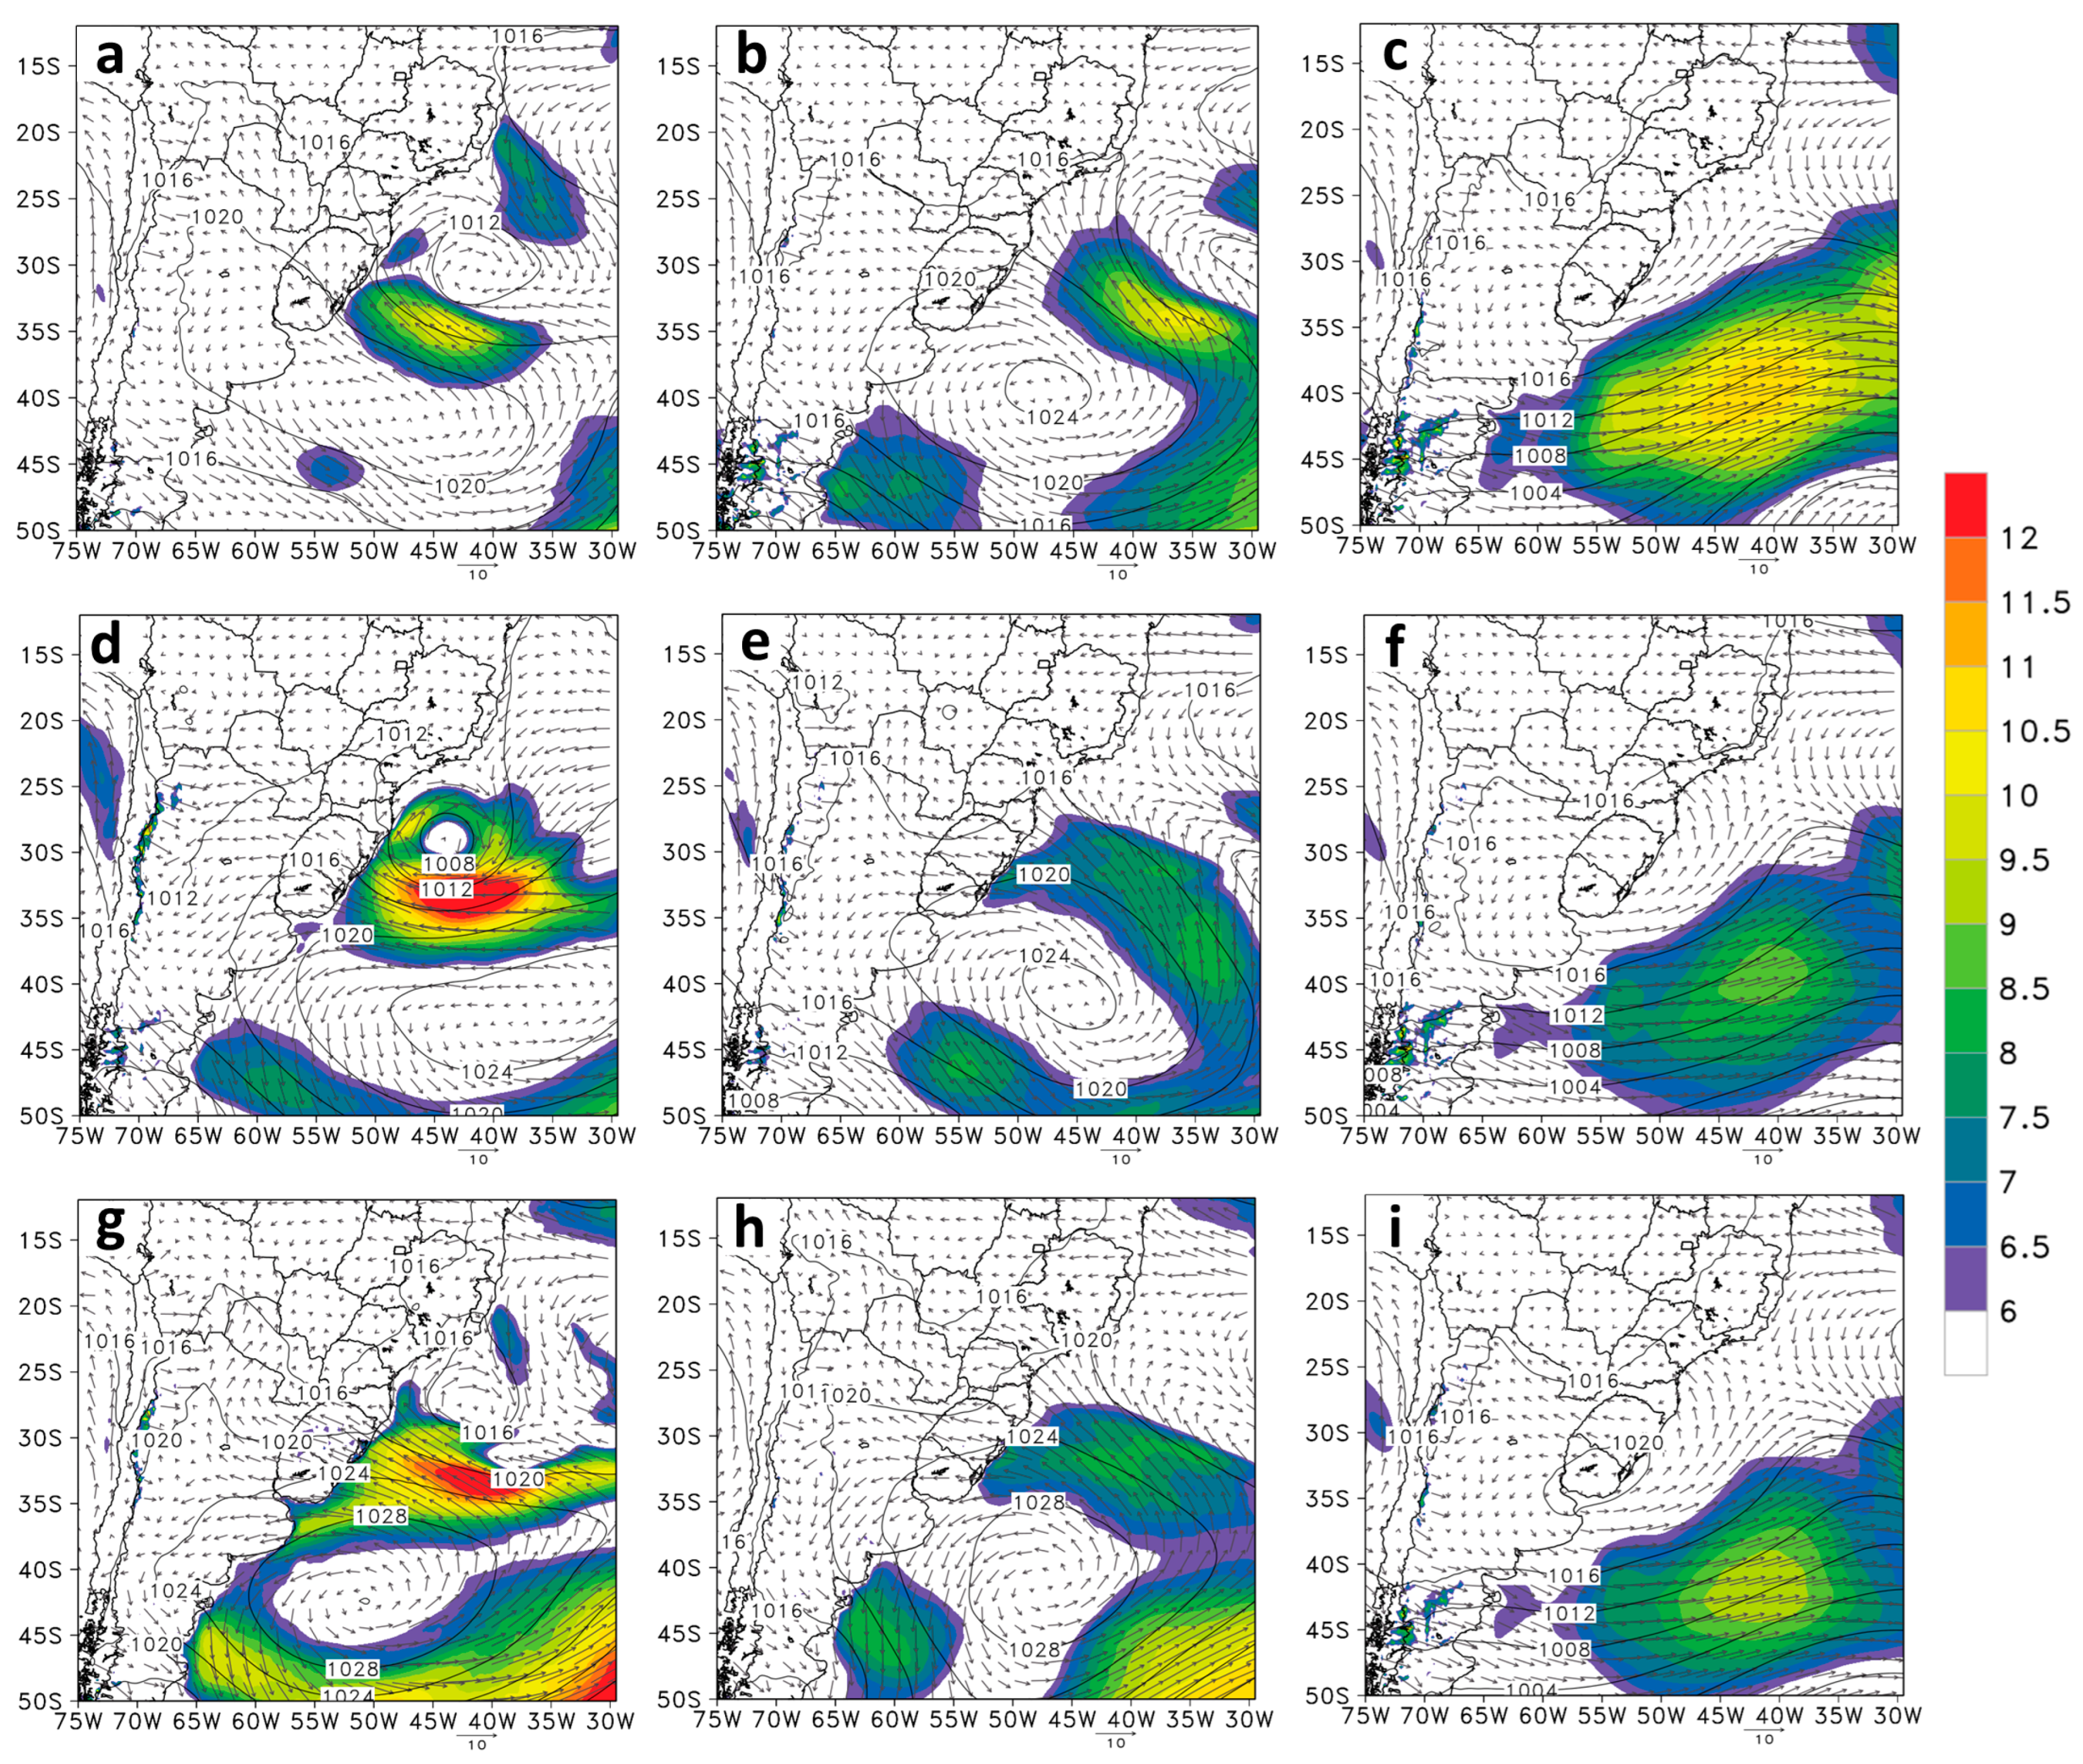
3.1. Large-Scale Atmospheric Patterns
3.1.1. Reference Climate
3.1.2. Future Climate
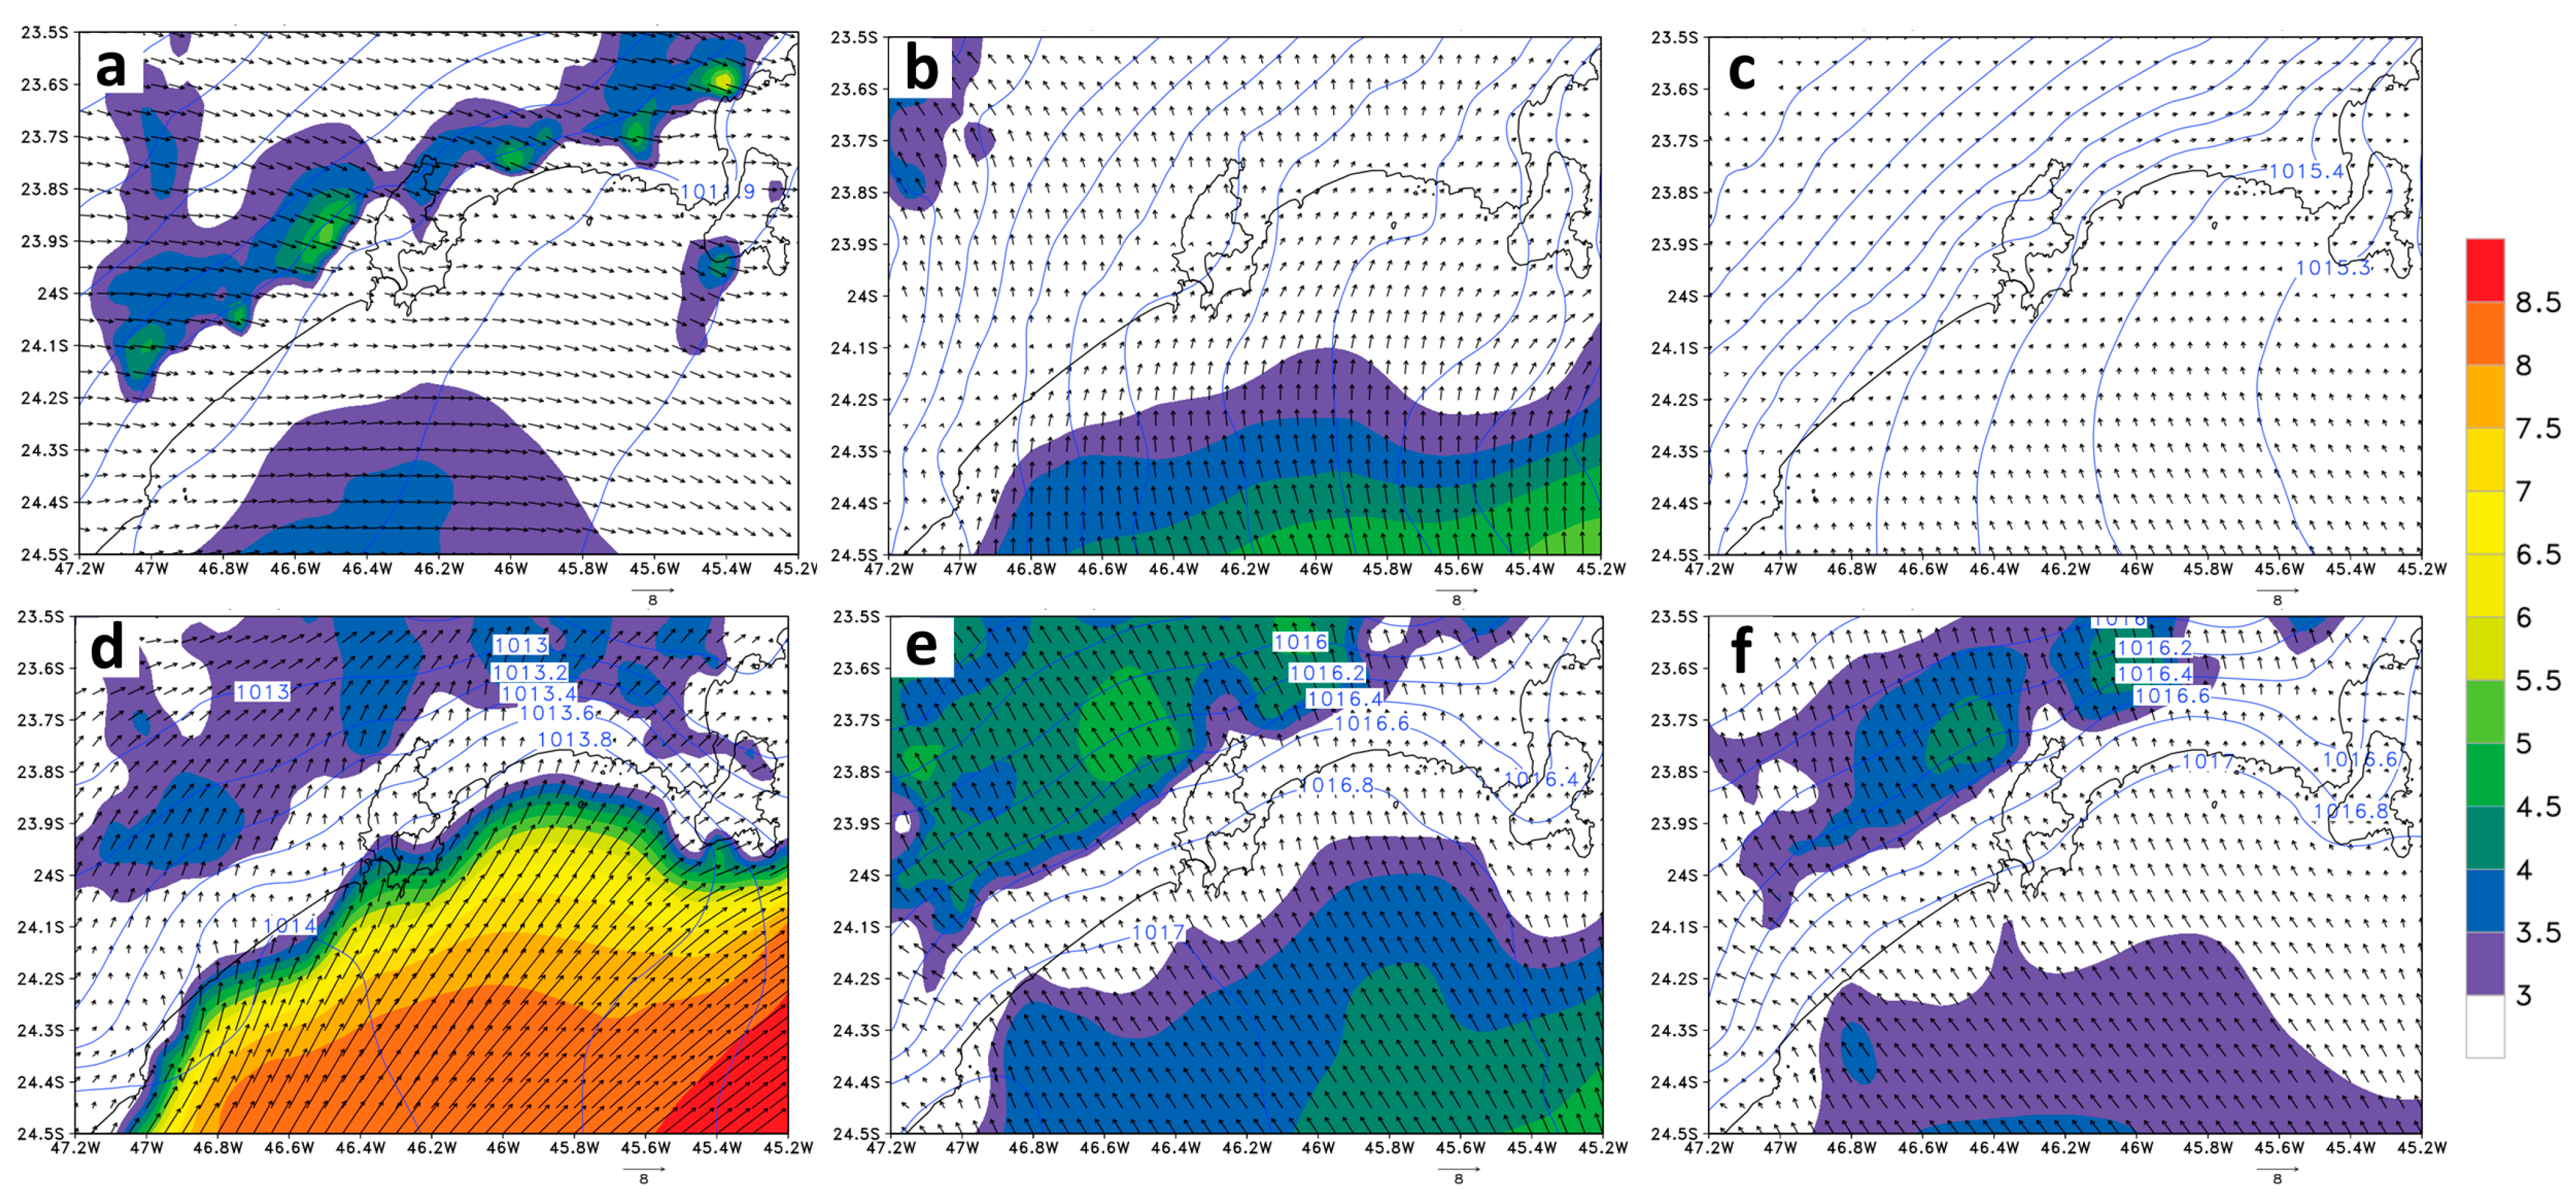
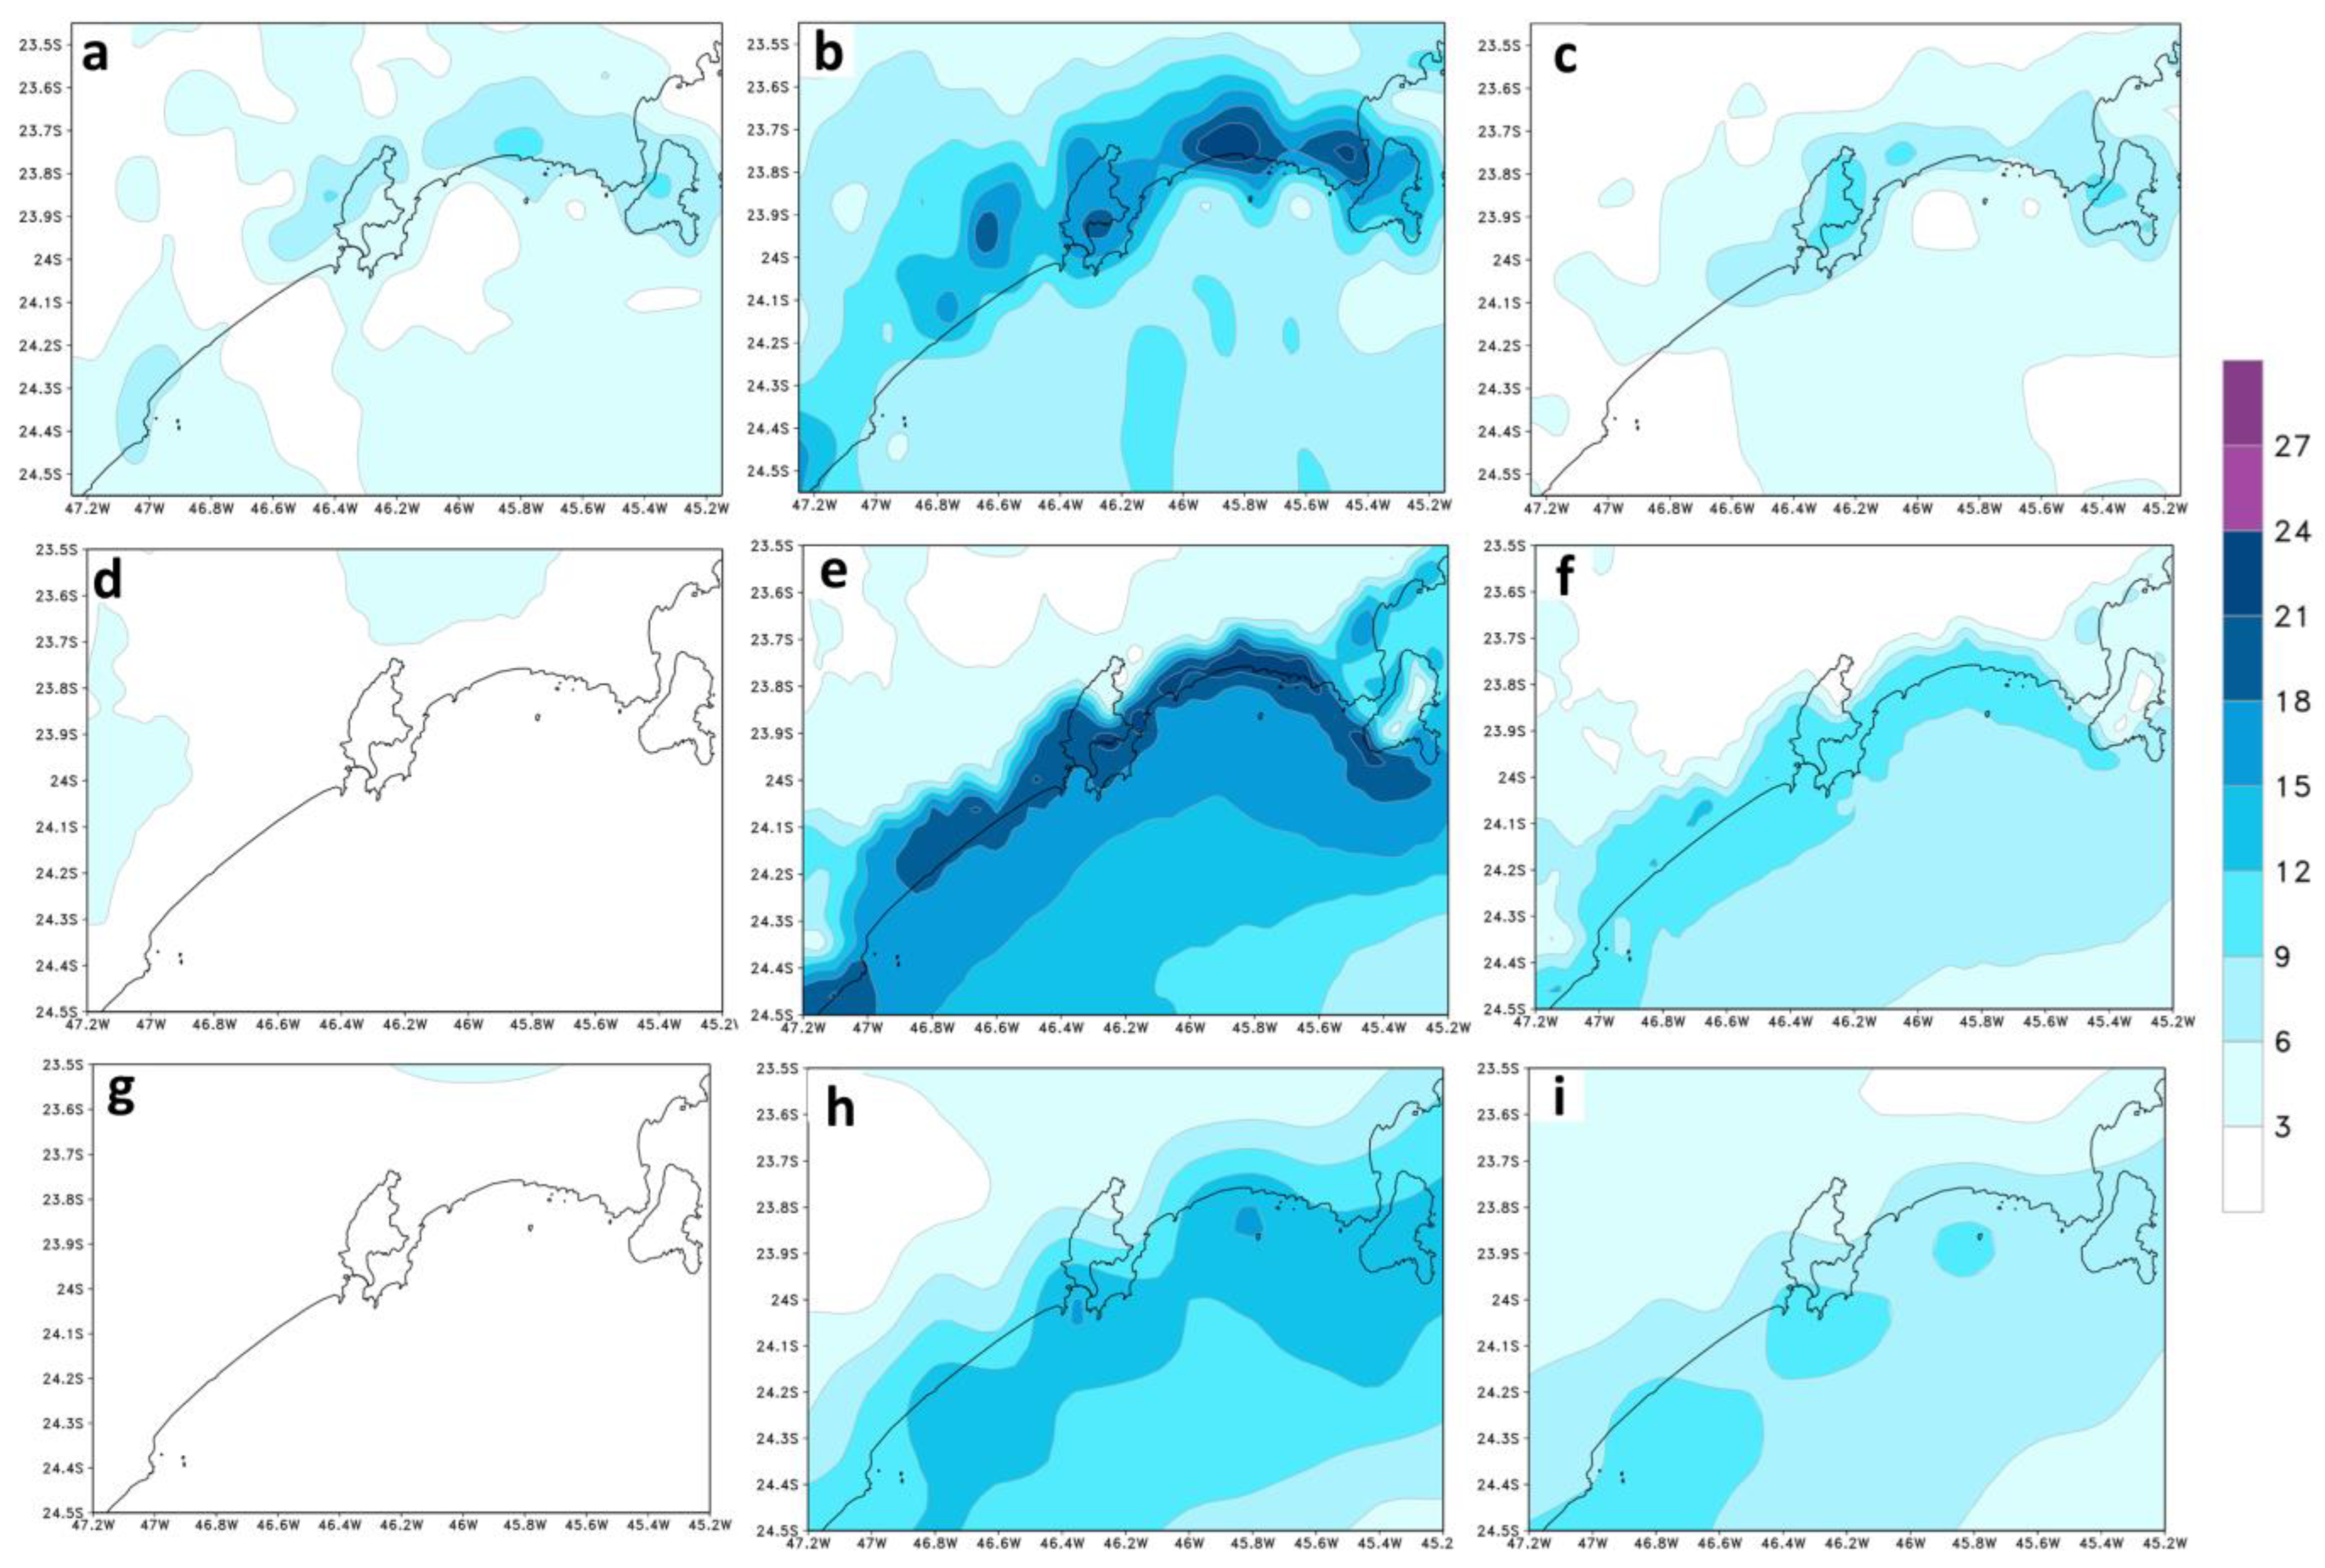
3.2. Local Impacts Simulated by 5 km Eta Model
3.2.1. Reference Climate
Mean Sea Level Pressure and 10 m Wind
Precipitation
3.2.2. Future Climate
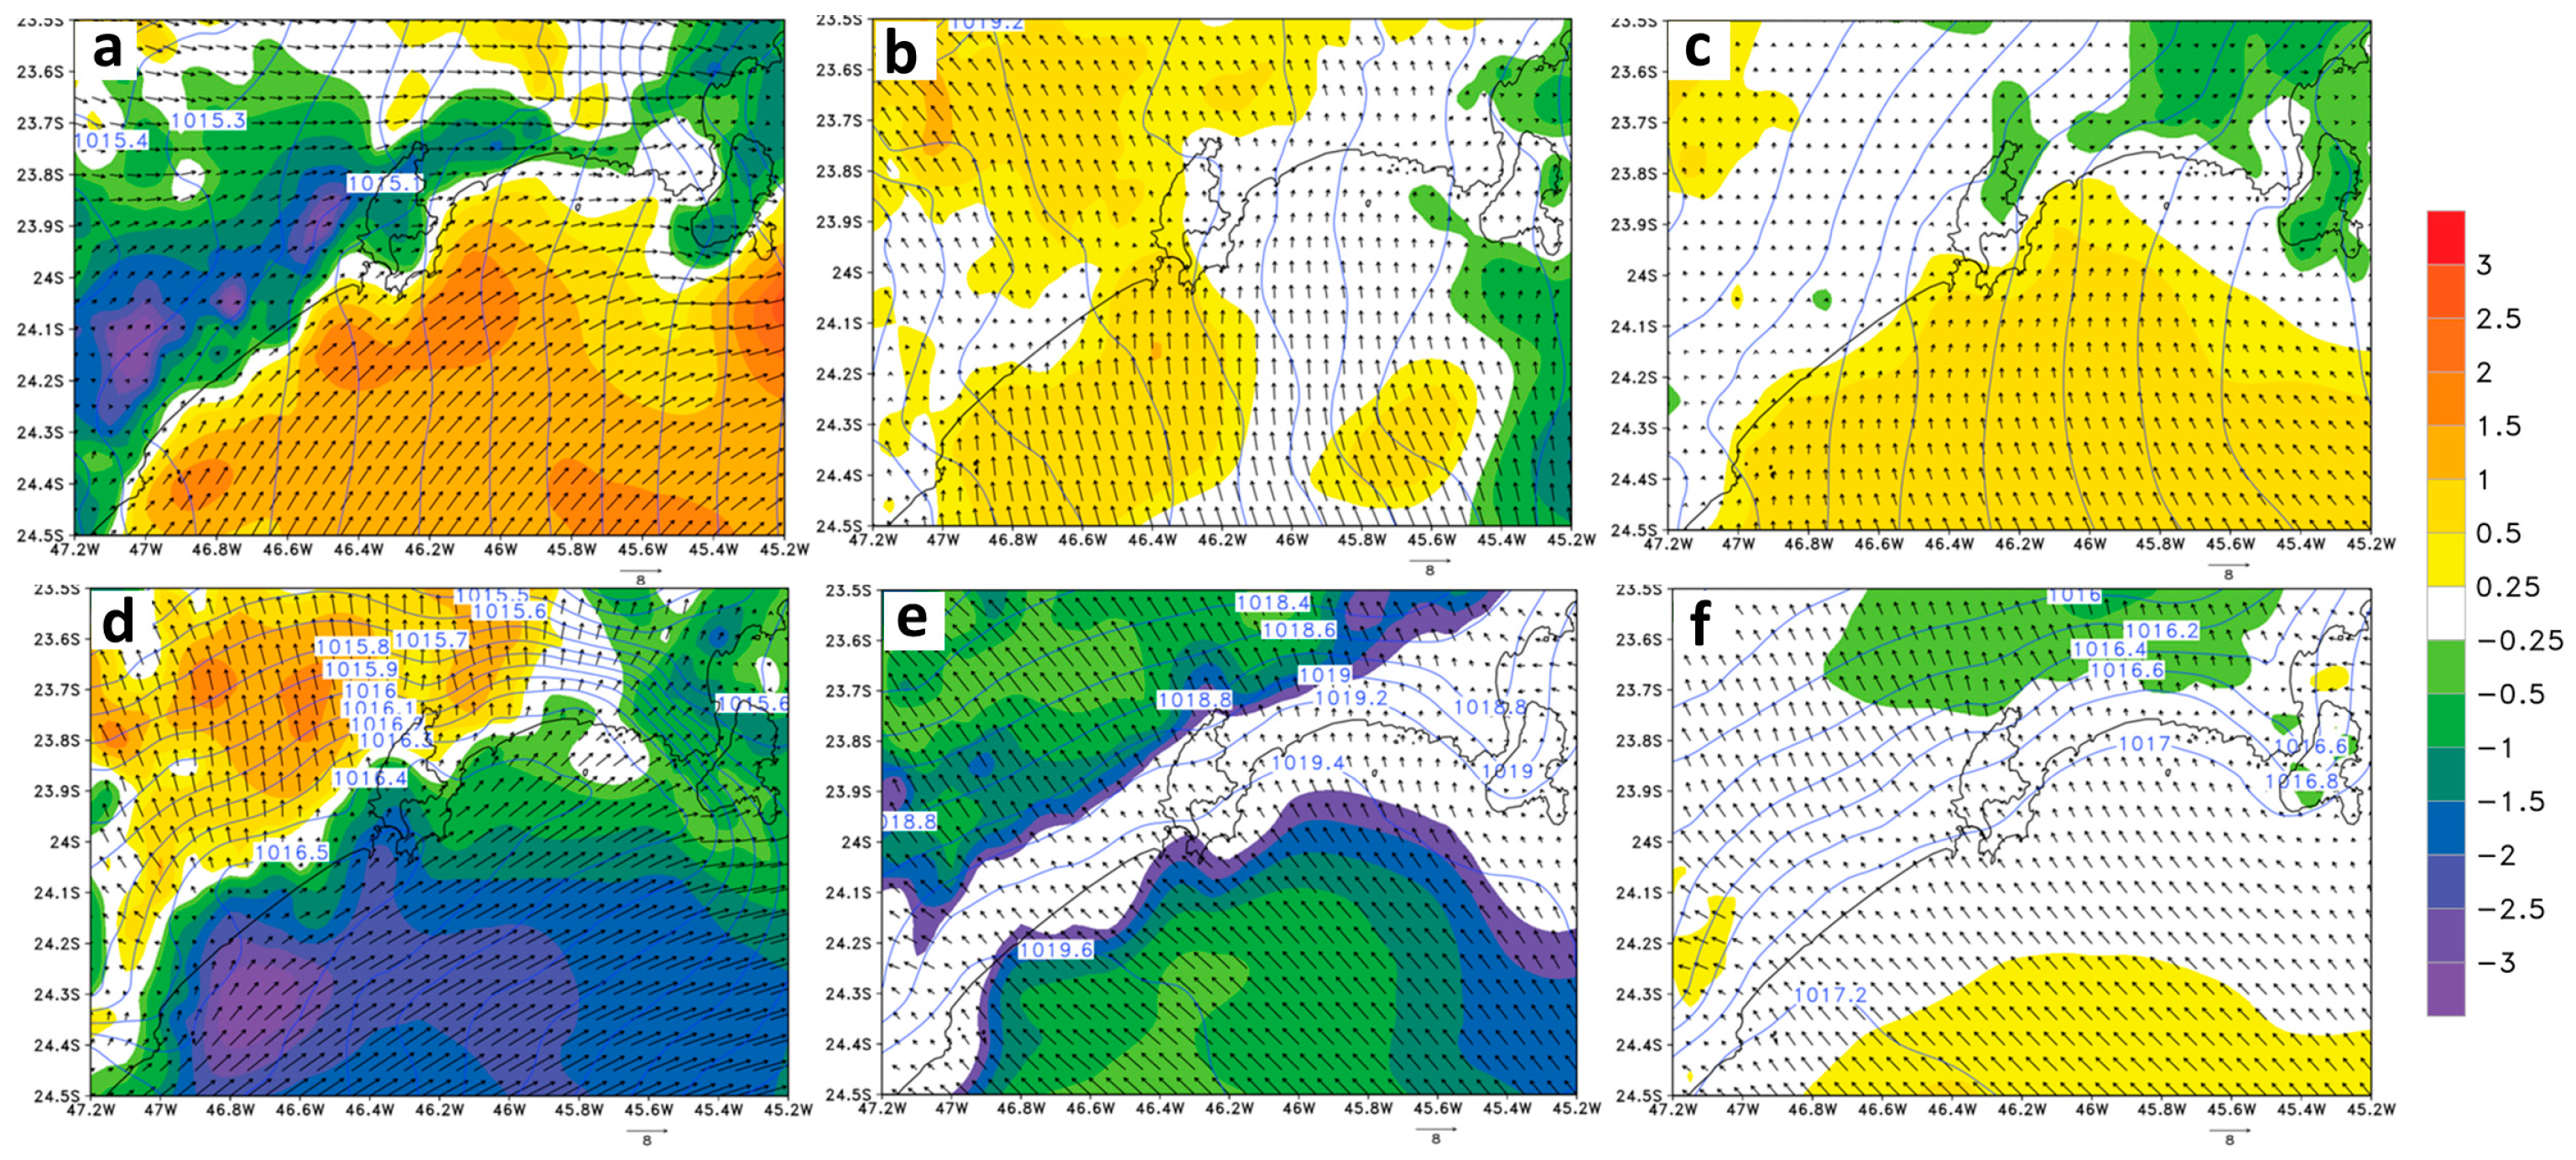
Mean Sea Level Pressure and 10 m Wind
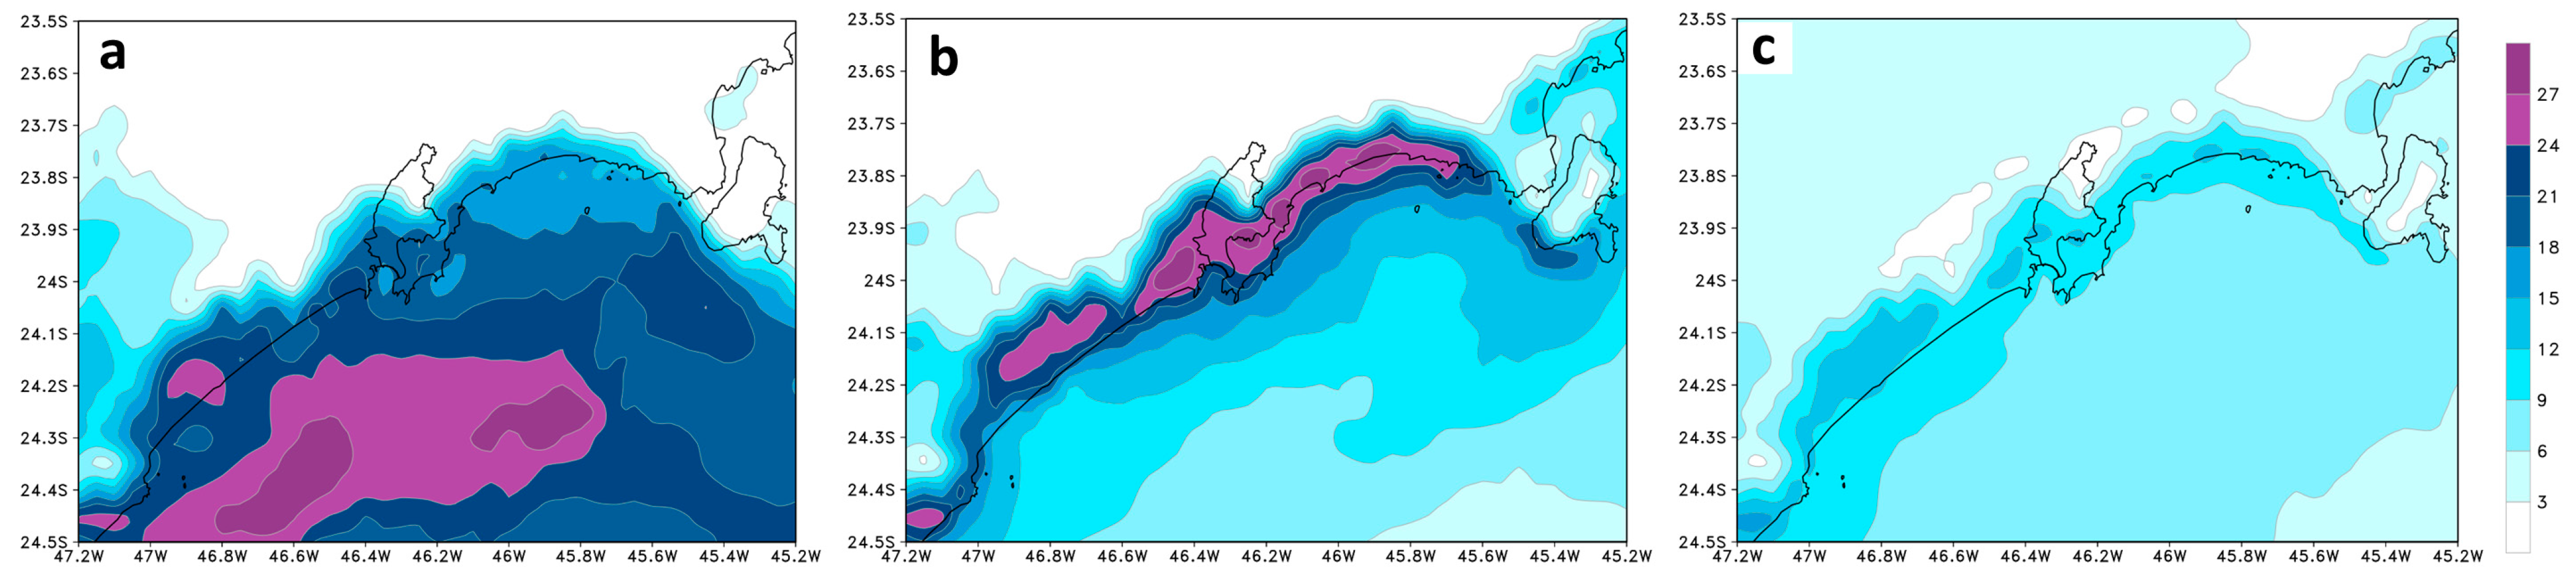
Precipitation
4. Discussion
5. Conclusions
Author Contributions
Funding
Data Availability Statement
Acknowledgments
Conflicts of Interest
References
- Muis, S.; Verlaan, M.; Winsemius, H.C.; Aerts, J.C.J.H.; Ward, P.J. A Global Reanalysis of Storm Surges and Extreme Sea Levels. Nat. Commun. 2016, 7, 11969. [Google Scholar] [CrossRef] [PubMed]
- Pugh, D.T. Tides, Surges and Mean Sea-Level (Reprinted with Corrections); John Wiley & Sons Ltd.: Hoboken, NJ, USA, 1996; Volume 5. [Google Scholar]
- Alfredini, P.; Arasaki, E.; Pezzoli, A.; Arcorace, M.; Cristofori, E.; de Sousa, W.C. Exposure of Santos Harbor Metropolitan Area (Brazil) to Wave and Storm Surge Climate Changes. Water Qual. Expo. Health 2014, 6, 73–88. [Google Scholar] [CrossRef]
- Reboita, M.S.; da Rocha, R.P.; de Souza, M.R.; Llopart, M. Extratropical Cyclones over the Southwestern South Atlantic Ocean: HadGEM2-ES and RegCM4 Projections. Int. J. Climatol. 2018, 38, 2866–2879. [Google Scholar] [CrossRef]
- Ji, T.; Li, G.; Liu, R. Historical Reconstruction of Storm Surge Activity in the Southeastern Coastal Area of China for the Past 60 Years. Earth Space Sci. 2020, 7, e2019EA001056. [Google Scholar] [CrossRef]
- Lai, Y.; Li, Q.; Li, J.; Zhou, Q.; Zhang, X.; Wu, G. Evolution of Frequency and Intensity of Concurrent Heavy Precipitation and Storm Surge at the Global Scale: Implications for Compound Floods. Front. Earth. Sci. 2021, 9, 660359. [Google Scholar] [CrossRef]
- Sondermann, M.; Chou, S.C.; Souza, C.R.d.G.; Rodrigues, J.; Caprace, J.D. Atmospheric Patterns Favourable to Storm Surge Events on the Coast of São Paulo State, Brazil. Nat. Hazards 2023, 117, 93–111. [Google Scholar] [CrossRef]
- Hersbach, H.; Bell, B.; Berrisford, P.; Hirahara, S.; Horányi, A.; Muñoz-Sabater, J.; Nicolas, J.; Peubey, C.; Radu, R.; Schepers, D.; et al. The ERA5 Global Reanalysis. Q. J. R. Meteorol. Soc. 2020, 146, 1999–2049. [Google Scholar] [CrossRef]
- Souza, C.R.d.G.; Souza, A.P.; Harari, J. Long Term Analysis of Meteorological-Oceanographic Extreme Events for the Baixada Santista Region. In Climate Change in Santos Brazil: Projections, Impacts and Adaptation Options; Springer International Publishing: Cham, Switzerland, 2019; pp. 97–134. [Google Scholar]
- Campos, R.M.; De Camargo, R.; Harari, J. Caracterização de Eventos Extremos Do Nível Do Mar Em Santos e Sua Correspondência Com as Reanálises Do Modelo Do NCEP No Sudoeste Do Atlântico Sul. Rev. Bras. Meteorol. 2010, 25, 175–184. [Google Scholar] [CrossRef]
- Bashmakov, I.; Nilsson, L.; Acquaye, A.; Bataille, C.; Cullen, J.; de la Rue du Can, S.; Fischedick, M.; Geng, Y.; Tanaka, K. Climate Change 2022: Mitigation of Climate Change. In Contribution of Working Group III to the Sixth Assessment Report of the Intergovernmental Panel on Climate Change; Chapter 11; E-Scholarship Repository: Berkeley, CA USA, 2022. [Google Scholar]
- Chou, S.-C.; Marengo, J.A.; Silva, A.J.; Lyra, A.A.; Tavares, P.; Souza, C.R.D.G.; Harari, J.; Nunes, L.H.; Greco, R.; Hosokawa, E.K.; et al. Projections of Climate Change in the Coastal Area of Santos. In Climate Change in Santos Brazil: Projections, Impacts and Adaptation Options; Springer International Publishing: Cham, Switzerland, 2019; pp. 59–73. [Google Scholar]
- Veiga, S.F.; Nobre, P.; Giarolla, E.; Capistrano, V.; Baptista, M., Jr.; Marquez, A.L.; Figueroa, S.N.; Bonatti, J.P.; Kubota, P.; Nobre, C.A. The Brazilian Earth System Model Ocean–Atmosphere (BESM-OA) Version 2.5: Evaluation of Its CMIP5 Historical Simulation. Geosci. Model Dev. 2019, 12, 1613–1642. [Google Scholar] [CrossRef]
- Chou, S.C.; Lyra, A.; Mourão, C.; Dereczynski, C.; Pilotto, I.; Gomes, J.; Bustamante, J.; Tavares, P.; Silva, A.; Rodrigues, D.; et al. Evaluation of the Eta Simulations Nested in Three Global Climate Models. Am. J. Clim. Chang. 2014, 3, 438–454. [Google Scholar] [CrossRef]
- Lyra, A.; Tavares, P.; Chou, S.C.; Sueiro, G.; Dereczynski, C.; Sondermann, M.; Silva, A.; Marengo, J.; Giarolla, A. Erratum to: Climate Change Projections over Three Metropolitan Regions in Southeast Brazil Using the Non-Hydrostatic Eta Regional Climate Model at 5-Km Resolution. Theor. Appl. Climatol. 2018, 132, 663–682. [Google Scholar] [CrossRef]
- Zanetti, V.B.; Júnior, W.C.d.S.; Hosokawa, E.K. Vulnerability of Critical Infrastructure Under Climate Change Scenarios: The Case of Santos. In Climate Change in Santos Brazil: Projections, Impacts and Adaptation Options; Springer International Publishing: Cham, Switzerland, 2019; pp. 245–251. [Google Scholar]
- Santos, B.B.d.O.; Nunes, L.H.; Bandini, M.P. Rainfall Episodes and Local Stability Thresholds in Santos. In Climate Change in Santos Brazil: Projections, Impacts and Adaptation Options; Springer International Publishing: Cham, Switzerland, 2019; pp. 161–175. [Google Scholar]
- Mesinger, F. A Blocking Technique for Representation of Mountains in Atmospheric Models. Riv. Meteorol. Aeronaut. 1984, 44, 195–202. [Google Scholar]
- Mesinger, F.; Chou, S.C.; Gomes, J.L.; Jovic, D.; Bastos, P.; Bustamante, J.F.; Lazic, L.; Lyra, A.A.; Morelli, S.; Ristic, I.; et al. An Upgraded Version of the Eta Model. Meteorol. Atmos. Phys. 2012, 116, 63–79. [Google Scholar] [CrossRef]
- Mesinger, F.; Veljovic, K.; Chou, S.C.; Gomes, J.; Lyra, A. The Eta Model: Design, Use, and Added Value. In Topics in Climate Modeling; InTech: New Delhi, India, 2016. [Google Scholar]
- Marengo, J.A.; Chou, S.C.; Kay, G.; Alves, L.M.; Pesquero, J.F.; Soares, W.R.; Santos, D.C.; Lyra, A.A.; Sueiro, G.; Betts, R.; et al. Development of Regional Future Climate Change Scenarios in South America Using the Eta CPTEC/HadCM3 Climate Change Projections: Climatology and Regional Analyses for the Amazon, São Francisco and the Paraná River Basins. Clim. Dyn. 2012, 38, 1829–1848. [Google Scholar] [CrossRef]
- Chou, S.C.; Marengo, J.A.; Lyra, A.A.; Sueiro, G.; Pesquero, J.F.; Alves, L.M.; Kay, G.; Betts, R.; Chagas, D.J.; Gomes, J.L.; et al. Downscaling of South America Present Climate Driven by 4-Member HadCM3 Runs. Clim. Dyn. 2012, 38, 635–653. [Google Scholar] [CrossRef]
- Pesquero, J.F.; Chou, S.C.; Nobre, C.A.; Marengo, J.A. Climate Downscaling over South America for 1961-1970 Using the Eta Model. Theor. Appl. Climatol. 2010, 99, 75–93. [Google Scholar] [CrossRef]
- Janjic, Z.I.; Gerrity, J.; Nickovic, S. An Alternative Approach to Nonhydrostatic Modeling. Mon. Weather Rev. 2001, 129, 1164–1178. [Google Scholar] [CrossRef]
- Janjic, Z.I. Forward-Backward Scheme Modified to Prevent Two-Grid-Interval Noise and Its Application in Sigma Coordinate Models. Contrib. Atmos. Phys 1979, 52, 69–84. [Google Scholar]
- Janjic, Z.I. Nonlinear Advection Schemes and Energy Cascade on Semi-Staggered Grids. Mon. Weather Rev. 1984, 112, 1234–1245. [Google Scholar] [CrossRef]
- Betts, A.K.; Miller, M.J. A New Convective Adjustment Scheme. Part II: Single Column Tests Using GATE Wave, BOMEX, ATEX and Arctic Air-mass Data Sets. Q. J. R. Meteorol. Soc. 1986, 112, 693–709. [Google Scholar] [CrossRef]
- Zhao, Q.; Carr, F.H. A Prognostic Cloud Scheme for Operational NWP Models. Mon. Weather Rev. 1997, 125, 1931–1953. [Google Scholar] [CrossRef]
- Schwarzkopf, M.D.; Fels, S.B. The Simplified Exchange Method Revisited: An Accurate, Rapid Method for Computation of Infrared Cooling Rates and Fluxes. J. Geophys. Res. 1991, 96, 9075. [Google Scholar] [CrossRef]
- Lacis, A.A.; Hansen, J. A Parameterization for the Absorption of Solar Radiation in the Earth’s Atmosphere. J. Atmos. Sci. 1974, 31, 118–133. [Google Scholar] [CrossRef]
- Paulson, C.A. The Mathematical Representation of Wind Speed and Temperature Profiles in the Unstable Atmospheric Surface Layer. J. Appl. Meteorol. 1970, 9, 857–861. [Google Scholar] [CrossRef]
- Ek, M.B.; Mitchell, K.E.; Lin, Y.; Rogers, E.; Grunmann, P.; Koren, V.; Gayno, G.; Tarpley, J.D. Implementation of Noah Land Surface Model Advances in the National Centers for Environmental Prediction Operational Mesoscale Eta Model. J. Geophys. Res. Atmos. 2003, 108, 2002JD003296. [Google Scholar] [CrossRef]
- Nakanishi, M.; Niino, H. Development of an Improved Turbulence Closure Model for the Atmospheric Boundary Layer. J. Meteorol. Soc. Jpn. 2009, 87, 895–912. [Google Scholar] [CrossRef]
- Nobre, P.; Siqueira, L.S.P.; de Almeida, R.A.F.; Malagutti, M.; Giarolla, E.; Castelão, G.P.; Bottino, M.J.; Kubota, P.; Figueroa, S.N.; Costa, M.C.; et al. Climate Simulation and Change in the Brazilian Climate Model. J. Clim. 2013, 26, 6716–6732. [Google Scholar] [CrossRef]
- Reboita, M.S.; Gan, M.A.; da Rocha, R.P.; Ambrizzi, T. Regimes de Precipitação Na América Do Sul: Uma Revisão Bibliográfica. Rev. Bras. De Meteorol. 2010, 25, 185–204. [Google Scholar] [CrossRef]
- Beck, H.E.; van Dijk, A.I.J.M.; Levizzani, V.; Schellekens, J.; Miralles, D.G.; Martens, B.; de Roo, A. MSWEP: 3-Hourly 0.25° Global Gridded Precipitation (1979–2015) by Merging Gauge, Satellite, and Reanalysis Data. Hydrol. Earth Syst. Sci. 2017, 21, 589–615. [Google Scholar] [CrossRef]
- Zheng, F.; Westra, S.; Sisson, S.A. Quantifying the Dependence between Extreme Rainfall and Storm Surge in the Coastal Zone. J. Hydrol. 2013, 505, 172–187. [Google Scholar] [CrossRef]
- Dragani, W.C.; Cerne, B.S.; Campetella, C.M.; Possia, N.E.; Campos, M.I. Synoptic Patterns Associated with the Highest Wind-Waves at the Mouth of the Río de La Plata Estuary. Dyn. Atmos. Ocean. 2013, 61, 1–13. [Google Scholar] [CrossRef]
- Gramcianinov, C.B.; Campos, R.M.; Guedes Soares, C.; de Camargo, R. Extreme Waves Generated by Cyclonic Winds in the Western Portion of the South Atlantic Ocean. Ocean Eng. 2020, 213, 107745. [Google Scholar] [CrossRef]

Disclaimer/Publisher’s Note: The statements, opinions and data contained in all publications are solely those of the individual author(s) and contributor(s) and not of MDPI and/or the editor(s). MDPI and/or the editor(s) disclaim responsibility for any injury to people or property resulting from any ideas, methods, instructions or products referred to in the content. |
© 2023 by the authors. Licensee MDPI, Basel, Switzerland. This article is an open access article distributed under the terms and conditions of the Creative Commons Attribution (CC BY) license (https://creativecommons.org/licenses/by/4.0/).
Share and Cite
Sondermann, M.; Chou, S.C.; Tavares, P.; Lyra, A.; Marengo, J.A.; Souza, C.R.d.G. Projections of Changes in Atmospheric Conditions Leading to Storm Surges along the Coast of Santos, Brazil. Climate 2023, 11, 176. https://doi.org/10.3390/cli11090176
Sondermann M, Chou SC, Tavares P, Lyra A, Marengo JA, Souza CRdG. Projections of Changes in Atmospheric Conditions Leading to Storm Surges along the Coast of Santos, Brazil. Climate. 2023; 11(9):176. https://doi.org/10.3390/cli11090176
Chicago/Turabian StyleSondermann, Marcely, Sin Chan Chou, Priscila Tavares, André Lyra, José A. Marengo, and Celia Regina de Gouveia Souza. 2023. "Projections of Changes in Atmospheric Conditions Leading to Storm Surges along the Coast of Santos, Brazil" Climate 11, no. 9: 176. https://doi.org/10.3390/cli11090176