
Use of a Hybrid Approach to Estimate Greenhouse Gas Emissions from the Transport Sector in Palestine


The Laboratory of Civil Engineering and geo-Environment (LGCgE), University of Lille, 59000 Lille, France
*
Author to whom correspondence should be addressed.
Climate 2023, 11(8), 170; https://doi.org/10.3390/cli11080170
Submission received: 11 July 2023
/
Revised: 5 August 2023
/
Accepted: 8 August 2023
/
Published: 10 August 2023
Abstract
:The transport sector is the second leading emitter of greenhouse gas emissions (GHGEs) from fuel combustion activities on a global scale. Reducing emissions related to this sector requires detailed data about the emissions by vehicle type and traveled distance. Generally, these data are missing in developing countries, which makes difficult the establishment of effective policies for the reduction of these emissions. This paper presents a hybrid method to estimate these emissions using the IPCC 2006 guidelines. The method combines bottom-up and top-down approaches to estimate vehicular emissions using data about the vehicle type, vehicle kilometers traveled, and fuel consumption. This method is applied for the first time for the Palestinian territory. Data have been collected from the administration, official reports, and papers. The results show a significant increase in the total vehicles in Palestine, particularly diesel vehicles. Emissions from the on-road transport system were approximately 2,207,834 tons of CO2eq in 2019. Diesel vehicles were responsible for about 75% of these emissions. Private cars were the most significant contributor to these emissions, with a share exceeding 50% of the total emissions, followed by commercial vehicles and light trucks (20%), public taxis (9%), and buses (7%). These results show clearly that the GHGEs reduction policies in Palestine should focus on diesel and private vehicles by developing the public transport systems and replacing diesel and gasoline vehicles with more environmentally friendly vehicles, such as hybrid and electric cars.
1. Introduction
The transport sector is one of the main emitters of greenhouse gas emissions (GHGEs) from the energy sector [1,2,3]. World Resources Institute (WRI) data showed that the transport sector is the second largest contributor to GHGEs after electricity production [4]. This is also true on a country scale, as the transport sector is considered a significant emitter of GHGEs in many countries, including but not limited to the United States, United Kingdoms, France, Belgium, Italy, Lebanon, Jordan, Palestine, Egypt, United Arab Emirates, Saudi Arabia, and Kuwait [2,5,6,7,8,9,10,11,12,13,14]. The reduction of the emissions related to this sector requires policies, which should be guided by detailed data about the emissions of this sector, mainly by vehicle type and traveled distance.
Vehicular emissions can be estimated using either a bottom-up or a top-down approaches, depending on the data availability and geographical scope [15]. Top-down approaches are based on fuel consumption data. In contrast, bottom-up approaches require higher levels of detailed data such as the number of vehicles, total kilometers traveled, characterization of vehicles, etc. [16,17]. The combination of the two approaches creates the so-called hybrid methodology or approach [18].
Scholars used the top-down approach to estimate GHGEs on large geographical scales, such as national and country scales, which could be downscaled to finer scales based on proxy data [19,20,21,22,23,24]. Charabi et al. (2020) assessed the emissions from the transport sector in Oman by transportation categories based on the Intergovernmental Panel on Climate Change (IPCC) 2006 Guidelines, using the default emission factors and fuel consumption data [24]. Engo (2019) applied a top-down approach to perform a decoupling analysis of GHGEs from the transport sector in Cameroon [22]. On a local level, Sówka and Bezyk (2018) used the territorial principle to account for GHGEs from the major sectors in Wroclaw, Poland. Concerning the transport sector, carbon accounting was based on the average fuel consumption values for each vehicle category and the average vehicle kilometers traveled (VKT) values derived from data available on a country scale [23].
The bottom-up approach was applied on lower scales (e.g., city scale). Mateo Pla et al. (2021) applied a bottom-up approach to quantify spatial urban traffic emissions in Valencia City based on information gathered from traffic management and control systems [25]. Using these traffic monitoring systems has allowed the researchers to estimate the emissions in the city at a high temporal and spatial resolution. However, the applicability of this novel approach is subject to the availability of traffic monitoring sensors. Some bottom-up approaches consider the operational environment and transportation modes for higher accuracy in terms of GHGEs accounting [17]. For instance, a study carried out in Korea proposed a methodology that analyzes the emissions for each transport mode, taking into account the transportation environments, which requires more detailed activity data [17]. Other bottom-up models used vehicle ownership and VKT data in carbon accounting, such as Zeng et al. (2016), who used this approach to estimate vehicular emissions from four major Chinese cities [26].
Hybrid models were used to estimate emissions on different spatial scales [20,27,28]. For example, Baayoun et al. (2019) estimated GHGEs from light-duty vehicles in Lebanon according to the Tier 2 methodology in the European Monitoring and Evaluation Programme/European Environmental Agency (EMEP/EEA) air pollutant emission inventory guidebook [15]. In this study, the emission factors reported by the manufacturer for each vehicle model were used to estimate the emissions besides the VKT (as activity data) [28]. The distance traveled was estimated from the fuel consumed, where the fuel efficiency of a vehicle was considered constant and equal to the value reported by the manufacturer.
Despite the variety in vehicular emissions estimation methods, some countries, particularly developing countries, face difficulties estimating these emissions at a higher classification level (by vehicle and fuel type) due to a lack of required data. This paper presents a hybrid approach to estimating these GHGEs in these countries. The capacity of this method is illustrated through its application for the first time in the Palestinian territory.
The contribution of this research stems from estimating the GHGEs related to fuel combustion in mobile sources at a higher level of detail using limited data. It provides policymakers with detailed information to help establish policies to reduce vehicular emissions. Data availability in Palestine constitutes a significant barrier to the use of the previous models to estimate detailed vehicular emissions. The published literature on GHGEs from the transport sector in Palestine is very limited. Few articles used the top-down approaches to estimate the GHGEs related to the transport sector on a national scale. Some scholars [29,30] estimated the emissions from the entire vehicle fleet in Palestine by the type of fuel (diesel and gasoline), while [31,32,33] assessed the environmental impact of introducing hybrid and electric vehicles to the vehicle fleet in Palestine. Qureitem et al. (2020) investigated the GHGEs from on-road vehicles based on the IPCC 2006 guidelines and using the default emission factors, the emissions were estimated as the national totals from diesel and gasoline vehicles [29]. Aburas, H., and Shahrour, I. (2021) analyzed the impact of mobility restrictions in Palestine on the environment and public health in terms of energy consumption and GHGEs [30]. A study by Hassouna, F. M. A., and Al-Sahili, K. (2020) assessed the environmental impact of introducing hybrid vehicles to the vehicle fleet in the West Bank [31]. The predicted emissions in this study for 2020 were double the actual emissions estimated by the Palestinian Central Bureau of Statistics (PCBS) from the transport sector [34], which could be attributed to the accuracy of the model used to predict the number of vehicles and kilometers traveled [35] and to the use of emission factors [36] different from the default in the IPCC guidelines. A second study by Hassouna, F. M. A., and Al-Sahili, K. (2020) investigated another alternative to reduce the environmental impact of the transport sector; this time, they assessed the implication of replacing 10% of traditional vehicles with electric vehicles by 2030 [32]. In estimating the GHGEs from electric vehicles in 2030, they assumed the emission factors of electricity generation to be constant for the next 10 years. This is inaccurate, as the electricity generation mix varies from one year to another [37]. Another study tried to introduce a sustainable public transportation system by replacing the traditional taxi fleet (entirely composed of diesel vehicles) with hybrid ones under two scenarios: 10% and 50% hybrid taxi penetration [33]. A similar methodology and emission factors to the previously presented studies were used.
Since road transport constitutes a significant contributor to the GHGEs in Palestine, it is necessary to analyze these emissions by type of vehicle (private cars, taxis, buses, trucks, etc.) and fuel to establish more targeted policies to reduce the national GHGEs. This research contributes to this goal by estimating the GHGEs by type of vehicle and fuel. The proposed hybrid approach based on the 2006 IPCC guidelines is used for this estimation using data collected for the transport sector in Palestine over the period 2011–2021.
This paper presents successively (i) a description of the research methodology and data collection and analysis, (ii) a presentation and discussion of the GHGEs related to road transport in Palestine, and finally, (iii) a presentation of the main findings and research limitations.
2. Materials and Methods
2.1. Overview
This study aims at estimating GHGEs from the transport sector in Palestine, which suffers from a lack of detailed data about this sector. The GHGEs are estimated using a hybrid method combining bottom-up and top-down approaches.
The transport system in Palestine is based on the use of road vehicles. It is one of the main sources of GHGEs in the country [13]. The Tier 1 method is used to estimate the vehicular emissions. It combines two methodologies presented in the IPCC guidelines: (i) the fuel consumption method representing a top-down approach, and (ii) vehicles’ kilometers traveled, which is a bottom-up approach.
To estimate the GHGEs by the type of vehicle and fuel, which has not been estimated before for Palestine, it was necessary to collect the data according to the IPCC guidelines. The following section presents the data collection.
Table 1 summarizes the characteristics of the vehicle fleet in Palestine in 2019 as provided by the administration.
2.2. Data Collection
The data required to estimate the GHGEs from on-road vehicles include (i) activity data (fuel sale, VKT, etc.) and (ii) emission factors of GHGEs from the combustion of fuel. Other proxy data were used to fill the gaps and estimate the VKT and fuel sales by the type of vehicle and fuel. Table 1 and Table 2 summarize the data used in this research and the sources, respectively.
The vehicle statistics (number of registered/licensed vehicles, type of vehicle by fuel) were obtained from the official statistical reports published by the Ministry of Transport (MoT) annually. The report provides information on the transport fleet in Palestine regarding the vehicle fleet composition, number of registered and licensed vehicles, driving licenses, and car rental and sale companies [38,44]. The data quality is high because the data are collected from vehicles’ registration and license offices, official units, and the Palestinian Central Bureau of Statistics (PCBS).
Data on the VKT were available separately by type of fuel (diesel, gasoline, etc.) and type of vehicle (private car, taxi, truck, bus, etc.). The data on the VKT by type of fuel were obtained from the PCBS through a survey that used to be carried out annually until the year 2015. The report of this survey is available under the name ‘Energy consumption in the transport sector and fuel economy in Palestine’ [40]. The report also provides data on fuel economy by type of vehicle in Palestine. On the other hand, the VKT by type of vehicle was obtained from [39]. The data are considered accurate since representative sample sizes were used.
Fuel sales data were collected from the Palestinian Energy and Natural Resources Authority (PENRA) and PCBS [41,42]. These data are highly accurate because they are collected on a country scale from imports and local and national suppliers. The fuel quality in gas stations was obtained from [39,43], where representative fuel samples from different gas stations in Palestine were tested for quality and characteristics. Concerning the GHGEs emission factors, the default emission factors for mobile sources in the IPCC guidelines were used due to the unavailability of country-specific emission factors [18].
2.3. Trend Analysis
The Mann–Kendall non-parametric test (M–K test) was applied using R-4.3.1 software to check the consistently increasing or decreasing trends in the total number of vehicles and the number of diesel and gasoline vehicles in the West Bank from 2011–2021. The restriction to the West Bank was due to the lack of data on the vehicle fleet in the Gaza Strip. However, the data from the West Bank could be considered representative of the national scale because the vehicle fleet in Gaza Strip accounts for only 15% of the national fleet [44].
2.4. Estimation of GHGEs
Since this study aims to estimate the emissions from the transportation sector by the type of vehicle and fuel, it is necessary to know the amount of fuel consumed by each type of vehicle. A hybrid approach combining the two methodologies mentioned in the 2006 IPCC guidelines for emissions estimation from the transport sector was used in this study. This approach is based on fuel consumption and the distance traveled by vehicles. For the first method, the fuel sold is a good approach to estimating road traffic’s emissions on a national or country scale, whereas the vehicles’ kilometers traveled could be applied at smaller scales but requires more data regarding the number and characteristics of the vehicles, distance traveled, etc. Both approaches were combined together to estimate the GHGEs from on-road vehicles in Palestine by the type of vehicle and fuel. Figure 1 explains the methodology for estimating GHGEs in this study.
The data collected included the vehicle fleet composition by the type of vehicle and fuel (private car, taxi, bus, motorcycle, truck, trailer and semi-trailer, and other vehicle) and the total fuel consumption by type of fuel (diesel, gasoline) [45]. The vehicles’ distance traveled in Palestine was collected from the survey on energy consumption in transport by the PCBS [40]. The survey included 6947 vehicles in Palestine. In this survey, vehicles were classified based on the type of vehicle and fuel. Three categories of vehicles were identified:
- Passenger vehicles, including private cars, taxis, motorcycles, and buses.
- Goods vehicles, including trucks and commercial cars.
- Other vehicles, including ambulances, mobile cranes, self-propelled rollers, bulldozers with metallic wheels, etc.
The results of a survey carried out by the Palestine Polytechnic University in 2017 were used [39] to estimate the average distance traveled by different types of vehicles. The estimation of the amount of fuel consumed by each type of vehicle was based on data collected in 2017. After obtaining the total driven distance by type of vehicle in Palestine in 2019 (km/year), the result was compared to those in the 2014 survey and the published literature [29,31,32,33,39,40] for verification. This result and other information obtained from the 2014 survey and data on the vehicle fleet in 2019 by type of vehicle and fuel were used to estimate the total driven distance by type of vehicle and fuel. The result was verified using the total diesel and gasoline sold in 2019, as reported by PENRA [45]. The GHGEs were estimated according to Tier 1 as follows:
where:
- Emissions GHG, Fuel, Vehicle: emissions of a GHG by type of fuel (diesel, gasoline, etc.) and vehicle (private cars, taxis, etc.).
- Fuel consumption fuel, vehicle: the amount of a specific fuel consumed by a specific type of vehicle.
- EF GHG, fuel: emission factor of a GHG due to combustion of a specific fuel type in a specific vehicle category.
The density of diesel and gasoline used in this research to convert the fuel from physical units into energy units to estimate the GHGEs was adapted from a published article that examines the gasoline and diesel characteristics at nine gas stations in Palestine. The used densities of diesel and gasoline were 0.748 kg/L and 0.833 kg/L, respectively [43].
3. Results and Discussion
3.1. Trend of Vehicle Fleet and GHGEs from the Transport Sector 2011–2021
The results show a significant increasing trend in the vehicle fleet in Palestine during the study period of about 18,260 vehicles/year, as illustrated in Figure 2. This increase is significant at the 0.001 level. The growing number of vehicles is a result of demographic growth and the weak public transportation system in the country [31].
Figure 3 shows a decreasing trend in the number of gasoline vehicles in Palestine by about 1.05%/year. This result is significant at the 0.001 level. The number of diesel vehicles grew over the same period by 0.95%/year. The increase in diesel vehicles could be attributed to the fact that diesel vehicles provide better mileage than gasoline ones and the lower diesel prices in Palestine than gasoline prices.
The GHGEs from the transport sector for the period 2011–2021 were estimated using the IPCC 2016 guidelines, as explained in Section 2. Figure 4 illustrates the variation in the GHGEs during the study period. The highest GHGEs were recorded in 2021. As the emissions are not showing a clear trend at first glance, the Mann–Kendall test was also used to check significant trends in vehicular emissions. Figure 5 shows an increasing trend of about 135,737 tons of CO2eq/year. However, this trend is statistically not significant.
3.2. GHGEs from the Transport Sector in Palestine, 2019
The total emissions from the transport sector in 2019 in Palestine were 2,207,834 tons of CO2eq, where CO2 accounts for 98% of these emissions (Figure 6). Diesel vehicles contributed to around 75% of the total GHGEs, as shown in Figure 7. This result is reasonable because about 55% of the fleet in 2019 was diesel vehicles. Additionally, the amount of diesel fuel consumed by on-road transport in 2019 was twice that of gasoline fuel, which is not only attributed to the larger number of diesel vehicles. Indeed, public taxis, buses, and most commercial vehicles and trucks are diesel-based vehicles [46]. The fuel consumption of these vehicles is usually higher than gasoline vehicles [40].
The vehicular emissions were estimated and classified by the type of vehicle for 2019, as presented in Figure 8. Private cars are the biggest contributor to the GHGEs from the transport sector, with a share exceeding half of the total on-road emissions (1,207,169 tons of CO2eq/year, equivalent to 55% of the transport sector emissions). This result is expected, as the private cars category has the highest vehicle population. The second top emitter is the commercial vehicles and light trucks, with a share of about 20% of the total vehicular emissions (437,138 tons of CO2eq/year). Public taxis come in third place, with around 9% (203,703 tons of CO2eq/year) of the total emissions, followed by buses, with 7% (161,917 tons of CO2eq/year) of the total transport emissions.
Figure 9 shows the GHGEs by the type of vehicle and fuel. The largest share of GHGEs is attributed to private cars for both the diesel and gasoline-based vehicles (593,447 and 613,721 tons of CO2eq/year, respectively). The gasoline emissions are higher due to the larger number of private gasoline cars. Modest amounts of gasoline-related emissions are released from commercial vehicles, trucks, gasoline, and other vehicles (this category includes tractors, motorcycles, ambulances, etc.).
The estimated GHGEs from the transport system were compared to the National Greenhouse Gas Inventory for 2019, and the result is presented in Figure 10. Unfortunately, the comparison was only possible for the total GHGEs because the National Greenhouse Gas Inventory does not provide any information on emissions from different types of vehicles. The relative differences between the results in this study and the National Greenhouse Gas Inventory in terms of the total GHGEs (CO2eq) and CO2 emissions were approximately 3.00% and 2.61%, respectively, while the differences in N2O and CH4 emissions were higher: around 36% for N2O and 16% for CH4. This difference could be attributed to (i) the use of fuel characteristics in Palestine instead of standard values and (ii) the use of default emission factors for N2O and CH4, as two values are available for gasoline vehicles based on control technology (motor gasoline uncontrolled and oxidation catalyst), which directly affects the N2O and CH4 but not the CO2 emissions. According to the IPCC guidelines, in the case of motor gasoline-uncontrolled vehicles, the default emissions factors of N2O and CH4 are 3.2 kg/TJ and 33 kg/TJ, respectively, while for motor gasoline vehicles with oxidation catalysts, the emission factors are 8.0 kg/TJ for N2O and 25 kg/TJ for CH4.
The emissions from passenger cars are equal to 4.84 tons CO2eq, which is slightly higher than the value for a typical passenger car, which is 4.60 tons CO2eq [47]. This result could be attributed to the poor fuel quality and the aged vehicle fleet in Palestine.
4. Conclusions
The transport sector is considered a major contributor to the GHGEs from fuel combustion activities in the energy sector. This paper presented a hybrid method to estimate the GHGEs from the on-road transport system with application in Palestine, which constitutes a study area with limited data availability. This method combines bottom-up and top-down approaches to estimate GHGEs using detailed vehicle data, including vehicle type, fuel consumption, and traveled distance. It provides information that helps policymakers to establish more targeted environmental policies that help the country to reduce its GHGEs and achieve the goals set concerning the country’s nationally determined contribution.
The vehicle fleet was assessed for the period 2011–2021. The data analysis indicates a significant increase in vehicles in the country of about 18,260 vehicle/year, with a clear preference for diesel vehicles, since the share of diesel vehicles is growing by 0.95%/year on the account of gasoline vehicles. In terms of the GHGEs over the same period, the emissions showed an increasing trend; however, this trend was statistically insignificant.
The GHGEs from vehicles were approximately 2,207,834 tons of CO2eq in 2019. About 75% of these emissions were due to diesel vehicles. Private cars constituted the biggest contributor to the GHGEs in the transport sector, with a share exceeding 50% of the total vehicle emissions, followed by commercial vehicles and light trucks (20%), public taxis (9%), and buses (7%).
These results show clearly that the GHGEs reduction policy should focus on diesel and private vehicles by developing public transport systems and replacing diesel and gasoline vehicles with environmentally friendly vehicles, such as electric and hybrid cars.
The main limitation of this study is the absence of country-specific emission factors and some data for the Gaza Strip.
Author Contributions
Conceptualization, H.A.J. and I.S.; methodology, H.A.J., I.S. and H.M.; data collection and analysis, H.A.J.; visualization, H.A.J.; writing, H.A.J. and I.S.; review, H.M. All authors have read and agreed to the published version of the manuscript.
Funding
This research received no external funding.
Data Availability Statement
Data were obtained from the official websites of the Palestinian Central Bureau of Statistics (BCBS), the Palestinian Energy and Natural Resources Authority (PENRA), and the Palestinian Ministry of Transport in the West Bank and Gaza Strip (MoT). These data are available online to everyone, and the exact references can be found in Table 2 in the main text.
Conflicts of Interest
The authors declare no conflict of interest.
References
- Ministry of Ecological Transition and Territorial Cohesion. The Seventh National Communication of France; Ministry of Ecological Transition and Territorial Cohesion: Paris, France, 2017. Available online: https://unfccc.int/documents/64738 (accessed on 10 June 2023).
- U.S. Environmental Protection Agency. A Review of Sustained Climate Action through 2020 7th National Communication 3rd and 4th Biennial Report; U.S. Environmental Protection Agency: Washington, DC, USA, 2020. Available online: https://unfccc.int/sites/default/files/resource/United%20States%207th%20NC%203rd%204th%20BR%20final.pdf (accessed on 15 March 2023).
- Wang, C.; Wood, J.; Wang, Y.; Geng, X.; Long, X. CO2 Emission in Transportation Sector across 51 Countries along the Belt and Road from 2000 to 2014. J. Clean. Prod. 2020, 266, 122000. [Google Scholar] [CrossRef]
- World Resources Institute. World Greenhouse Gas Emissions. 2019. Available online: https://www.wri.org/data/world-greenhouse-gas-emissions-2019 (accessed on 5 March 2023).
- Department for Energy Security & Net Zero. 2022 UK Greenhouse Gas Emissions: Provisional Figures—Statistical Release; Department for Energy Security & Net Zero: London, UK, 2023. Available online: https://assets.publishing.service.gov.uk/government/uploads/system/uploads/attachment_data/file/1147372/2022_Provisional_emissions_statistics_report.pdf (accessed on 6 February 2023).
- Ministry of Ecological Transition and Territorial Cohesion. Rapport National d’Inventaire pour la France au Titre de la Convention Cadre des Nations Unies sur les Changements Climatiques et Du Protocole de Kyoto; Ministry of Ecological Transition and Territorial Cohesion: Paris, France, 2022. Available online: https://www.citepa.org/wp-content/uploads/publications/ccnucc/CCNUCC_france_2023.pdf (accessed on 17 February 2023).
- Belgian Interregional Environment Agency. Belgium’s Greenhouse Gas Inventory (1990–2020). National Inventory Report Submitted under the United Nations Framework Convention on Climate Change; Belgian Interregional Environment Agency: Brussels, Belgium, 2022; Available online: https://klimaat.be/doc/nir-2023-15042023-final.pdf (accessed on 11 May 2023).
- Designated National Authority (DNA). Fourth National Communication Kingdom of Saudi Arabia. 2022. Available online: https://unfccc.int/documents/461529 (accessed on 24 May 2023).
- Egyptian Environmental Affairs Agency. Biennial Update Report to the United Nations Framework Convention on Climate Change. 2018. Available online: https://unfccc.int/sites/default/files/resource/BUR%20Egypt%20EN.pdf (accessed on 16 June 2023).
- Jordan Ministry of Environment. Updated Submission of Jordan’s 1st Nationally Determined Contribution (NDC). 2021. Available online: https://unfccc.int/sites/default/files/NDC/2022-06/UPDATED%20SUBMISSION%20OF%20JORDANS.pdf (accessed on 25 June 2023).
- Kuwait Environment Public Authority. State of Kuwait Second National Communication. 2019. Available online: https://unfccc.int/sites/default/files/resource/94235106_Kuwait-NC2-2-KUWAIT%20SNC%20%20final%20v2.pdf (accessed on 17 July 2023).
- Ministry of Energy and Industry UAE United Arab Emirates 4th National Communication Reports. 2018. Available online: https://unfccc.int/documents/192549 (accessed on 1 August 2023).
- Palestine Environment Quality Authority. Initial National Communication Report to the United Nation Convention on Climate Change. 2016. Available online: https://unfccc.int/sites/default/files/resource/Initial%20National%20Communication%20Report_%20State%20of%20Palestine.pdf (accessed on 15 May 2023).
- The Ministry of Environment—Lebanon. Lebanon’s Second Biennial Update Report to the UNFCCC; Ministry of Environment: Beirut, Lebanon, 2017. Available online: https://unfccc.int/files/national_reports/non-annex_i_parties/biennial_update_reports/application/pdf/3490185_lebanon-bur2-1-lebanon_burii_2017.pdf (accessed on 1 August 2023).
- European Environment Agency. EMEP/EEA Air Pollutant Emission Inventory Guidebook 2019: Technical Guidance to Prepare National Emission Inventories; Publications Office of the European Union: Luxembourg, 2019; ISBN 9789294800985.
- Arioli, M.S.; D’Agosto, M.D.A.; Amaral, F.G.; Cybis, H.B.B. The Evolution of City-Scale GHG Emissions Inventory Methods: A Systematic Review. Environ. Impact Assess. Rev. 2020, 80, 106316. [Google Scholar] [CrossRef]
- Sim, S.; Oh, J.; Jeong, B. Measuring Greenhouse Gas Emissions for the Transportation Sector in Korea. Ann. Oper. Res. 2015, 230, 129–151. [Google Scholar] [CrossRef]
- Intergovernmental Panel on Climate Change. 2006 IPCC Guidelines for National Greenhouse Gas Inventories. Available online: https://www.ipcc-nggip.iges.or.jp/public/2006gl/index.html (accessed on 15 March 2022).
- Huo, H.; Zhang, Q.; He, K.; Yao, Z.; Wang, M. Vehicle-Use Intensity in China: Current Status and Future Trend. Energy Policy 2012, 43, 6–16. [Google Scholar] [CrossRef]
- Ma, L.; Liang, J.; Gao, D.; Sun, J.; Li, Z. The Future Demand of Transportation in China: 2030 Scenario Based on a Hybrid Model. Procedia Soc. Behav. Sci. 2012, 54, 428–437. [Google Scholar] [CrossRef] [Green Version]
- Pulselli, R.M.; Marchi, M.; Neri, E.; Marchettini, N.; Bastianoni, S. Carbon Accounting Framework for Decarbonisation of European City Neighbourhoods. J. Clean. Prod. 2019, 208, 850–868. [Google Scholar] [CrossRef]
- Engo, J. Decoupling Analysis of CO2 Emissions from Transport Sector in Cameroon. Sustain. Cities Soc. 2019, 51, 101732. [Google Scholar] [CrossRef]
- Sówka, I.; Bezyk, Y. Greenhouse Gas Emission Accounting at Urban Level: A Case Study of the City of Wroclaw (Poland). Atmos. Pollut. Res. 2018, 9, 289–298. [Google Scholar] [CrossRef]
- Charabi, Y.; Al Nasiri, N.; Al Awadhi, T.; Choudri, B.S.; Al Bimani, A. GHG Emissions from the Transport Sector in Oman: Trends and Potential Decarbonization Pathways. Energy Strategy Rev. 2020, 32, 100548. [Google Scholar] [CrossRef]
- Mateo Pla, M.A.; Lorenzo-Sáez, E.; Luzuriaga, J.E.; Mira Prats, S.; Moreno-Pérez, J.A.; Urchueguía, J.F.; Oliver-Villanueva, J.V.; Lemus, L.G. From Traffic Data to GHG Emissions: A Novel Bottom-up Methodology and Its Application to Valencia City. Sustain. Cities Soc. 2021, 66, 102643. [Google Scholar] [CrossRef]
- Zeng, Y.; Tan, X.; Gu, B.; Wang, Y.; Xu, B. Greenhouse Gas Emissions of Motor Vehicles in Chinese Cities and the Implication for China’s Mitigation Targets. Appl. Energy 2016, 184, 1016–1025. [Google Scholar] [CrossRef]
- Cai, M.; Shi, Y.; Ren, C. Developing a High-Resolution Emission Inventory Tool for Low-Carbon City Management Using Hybrid Method—A Pilot Test in High-Density Hong Kong. Energy Build 2020, 226, 110376. [Google Scholar] [CrossRef]
- Baayoun, A.; Itani, W.; El Helou, J.; Halabi, L.; Medlej, S.; El Malki, M.; Moukhadder, A.; Aboujaoude, L.K.; Kabakian, V.; Mounajed, H.; et al. Emission Inventory of Key Sources of Air Pollution in Lebanon. Atmos. Environ. 2019, 215, 116871. [Google Scholar] [CrossRef]
- Qureitem, G.; Al-Khatib, I.A.; Anayah, F. Inventory of Main Greenhouse Gas Emissions from Energy Sector in Palestine. Environ. Monit. Assess. 2020, 192, 63. [Google Scholar] [CrossRef] [PubMed]
- Aburas, H.; Shahrour, I. Impact of the Mobility Restrictions in the Palestinian Territory on the Population and the Environment. Sustainability 2021, 13, 13457. [Google Scholar] [CrossRef]
- Hassouna, F.M.A.; Al-Sahili, K. Environmental Impact Assessment of the Transportation Sector and Hybrid Vehicle Implications in Palestine. Sustainability 2020, 12, 7878. [Google Scholar] [CrossRef]
- Hassouna, F.M.A.; Al-Sahili, K. Future Energy and Environmental Implications of Electric Vehicles in Palestine. Sustainability 2020, 12, 5515. [Google Scholar] [CrossRef]
- Hassouna, F.M.A.; Assad, M. Towards a Sustainable Public Transportation: Replacing the Conventional Taxis by a Hybrid Taxi Fleet in the West Bank, Palestine. Int. J. Environ. Res. Public Health 2020, 17, 8940. [Google Scholar] [CrossRef] [PubMed]
- Palestinian Central Bureau of Statistics. Emissions to Air Tables 2020. 2022. Available online: https://www.pcbs.gov.ps/site/lang__en/745/default.aspx (accessed on 15 June 2022).
- Hassouna, F.M.A.; Pringle, I. Analysis and Prediction of Crash Fatalities in Australia. Open Transp. J. 2019, 13, 134–140. [Google Scholar] [CrossRef] [Green Version]
- Razif, M.; Santoso, I.B. Prediction of CO, CO2, CH4, and N2O Vehicle Emissions from Environmental Impact Assessment (EIA) at Toll Road of Krian-Legundi-Bunder in East Java of Indonesia. Int. J. ChemTech Res. 2016, 9, 653–664. [Google Scholar]
- Gutglick, I.; Nehenia, L.; Mekonen, S.; Aran, M.; Semah, S. Israeli Electricity Sector ANNUAL REPORT 2021; The Electricity Authority: Israel, 2021.
- Palestinian Ministry of Transport. Palestinian Ministry of Transport: Statistics. 2023. Available online: http://www.mot.gov.ps/statistics-2/ (accessed on 3 January 2023).
- Shalabe, B.; Hoshia, A.; Khraiwesh, I.; Salhab, Z. Estimation of Emitted Vehicles Emissions in Palestine; Palestine Polytechnic University: Hebron, Palestine, 2017. [Google Scholar]
- Palestinian Central Bureau of Statistics. Energy Consumption in Transport Survey 2014: Main Results; Palestinian Central Bureau of Statistics: Ramallah, Palestine, 2015.
- Palestinian Energy and Natural Resources Authority. Palestinian Energy and Natural Resources Authority Website. 2023. Available online: http://penra.gov.ps/ (accessed on 3 January 2023).
- Palestinian Central Bureau of Statistics. Annual Energy Tables and Energy Balance 2007–2021. Available online: https://www.pcbs.gov.ps/site/lang__en/1030/Default.aspx (accessed on 9 February 2023).
- Karaeen, M.; El-Khateeb, I.; Jaradat, A.; Samara, M.; Bannoura, M. Fuel Quality Implications on Combustion Engines in the West Bank Area of Palestine. In Proceedings of the Palestine Polytechnic University Third International Conference on Energy and Environmental Protection in Sustainable Development (ICEEP III), Hebron, Palestine, 9–10 October 2013. [Google Scholar]
- Gaza Ministry of Transport. Report on the Achievements of the Ministry of Transport in Gaza Strip 2019. 2023. Available online: https://www.mot.ps/site/2020/02/26/%d8%aa%d9%82%d8%b1%d9%8a%d8%b1-%d8%a5%d9%86%d8%ac%d8%a7%d8%b2%d8%a7%d8%aa-%d9%88%d8%b2%d8%a7%d8%b1%d8%a9-%d8%a7%d9%84%d9%86%d9%82%d9%84-%d9%88%d8%a7%d9%84%d9%85%d9%88%d8%a7%d8%b5%d9%84%d8%a7%d8%aa-2/ (accessed on 11 December 2022).
- Palestinian Central Bureau of Statistics. Energy Tables and Energy Balance 2019. 2020. Available online: https://www.pcbs.gov.ps/Portals/_Rainbow/Documents/energy2019ArEn.pdf (accessed on 18 December 2022).
- Ministry of Transport. Transport Sector: Annual Statistical Report 2019. 2020. Available online: http://www.mot.gov.ps/wp-content/uploads/Portals/_Rainbow/Documents/Stats/Annual_Repoert2019.pdf (accessed on 5 October 2022).
- U.S. Environmental Protection Agency. Greenhouse Gas Emissions from a Typical Passenger Vehicle; U.S. Environmental Protection Agency: Washington, DC, USA, 2018.
Figure 1.
Methodology for estimating GHGEs from on-road vehicles in Palestine by type of vehicle and fuel.
Figure 1.
Methodology for estimating GHGEs from on-road vehicles in Palestine by type of vehicle and fuel.
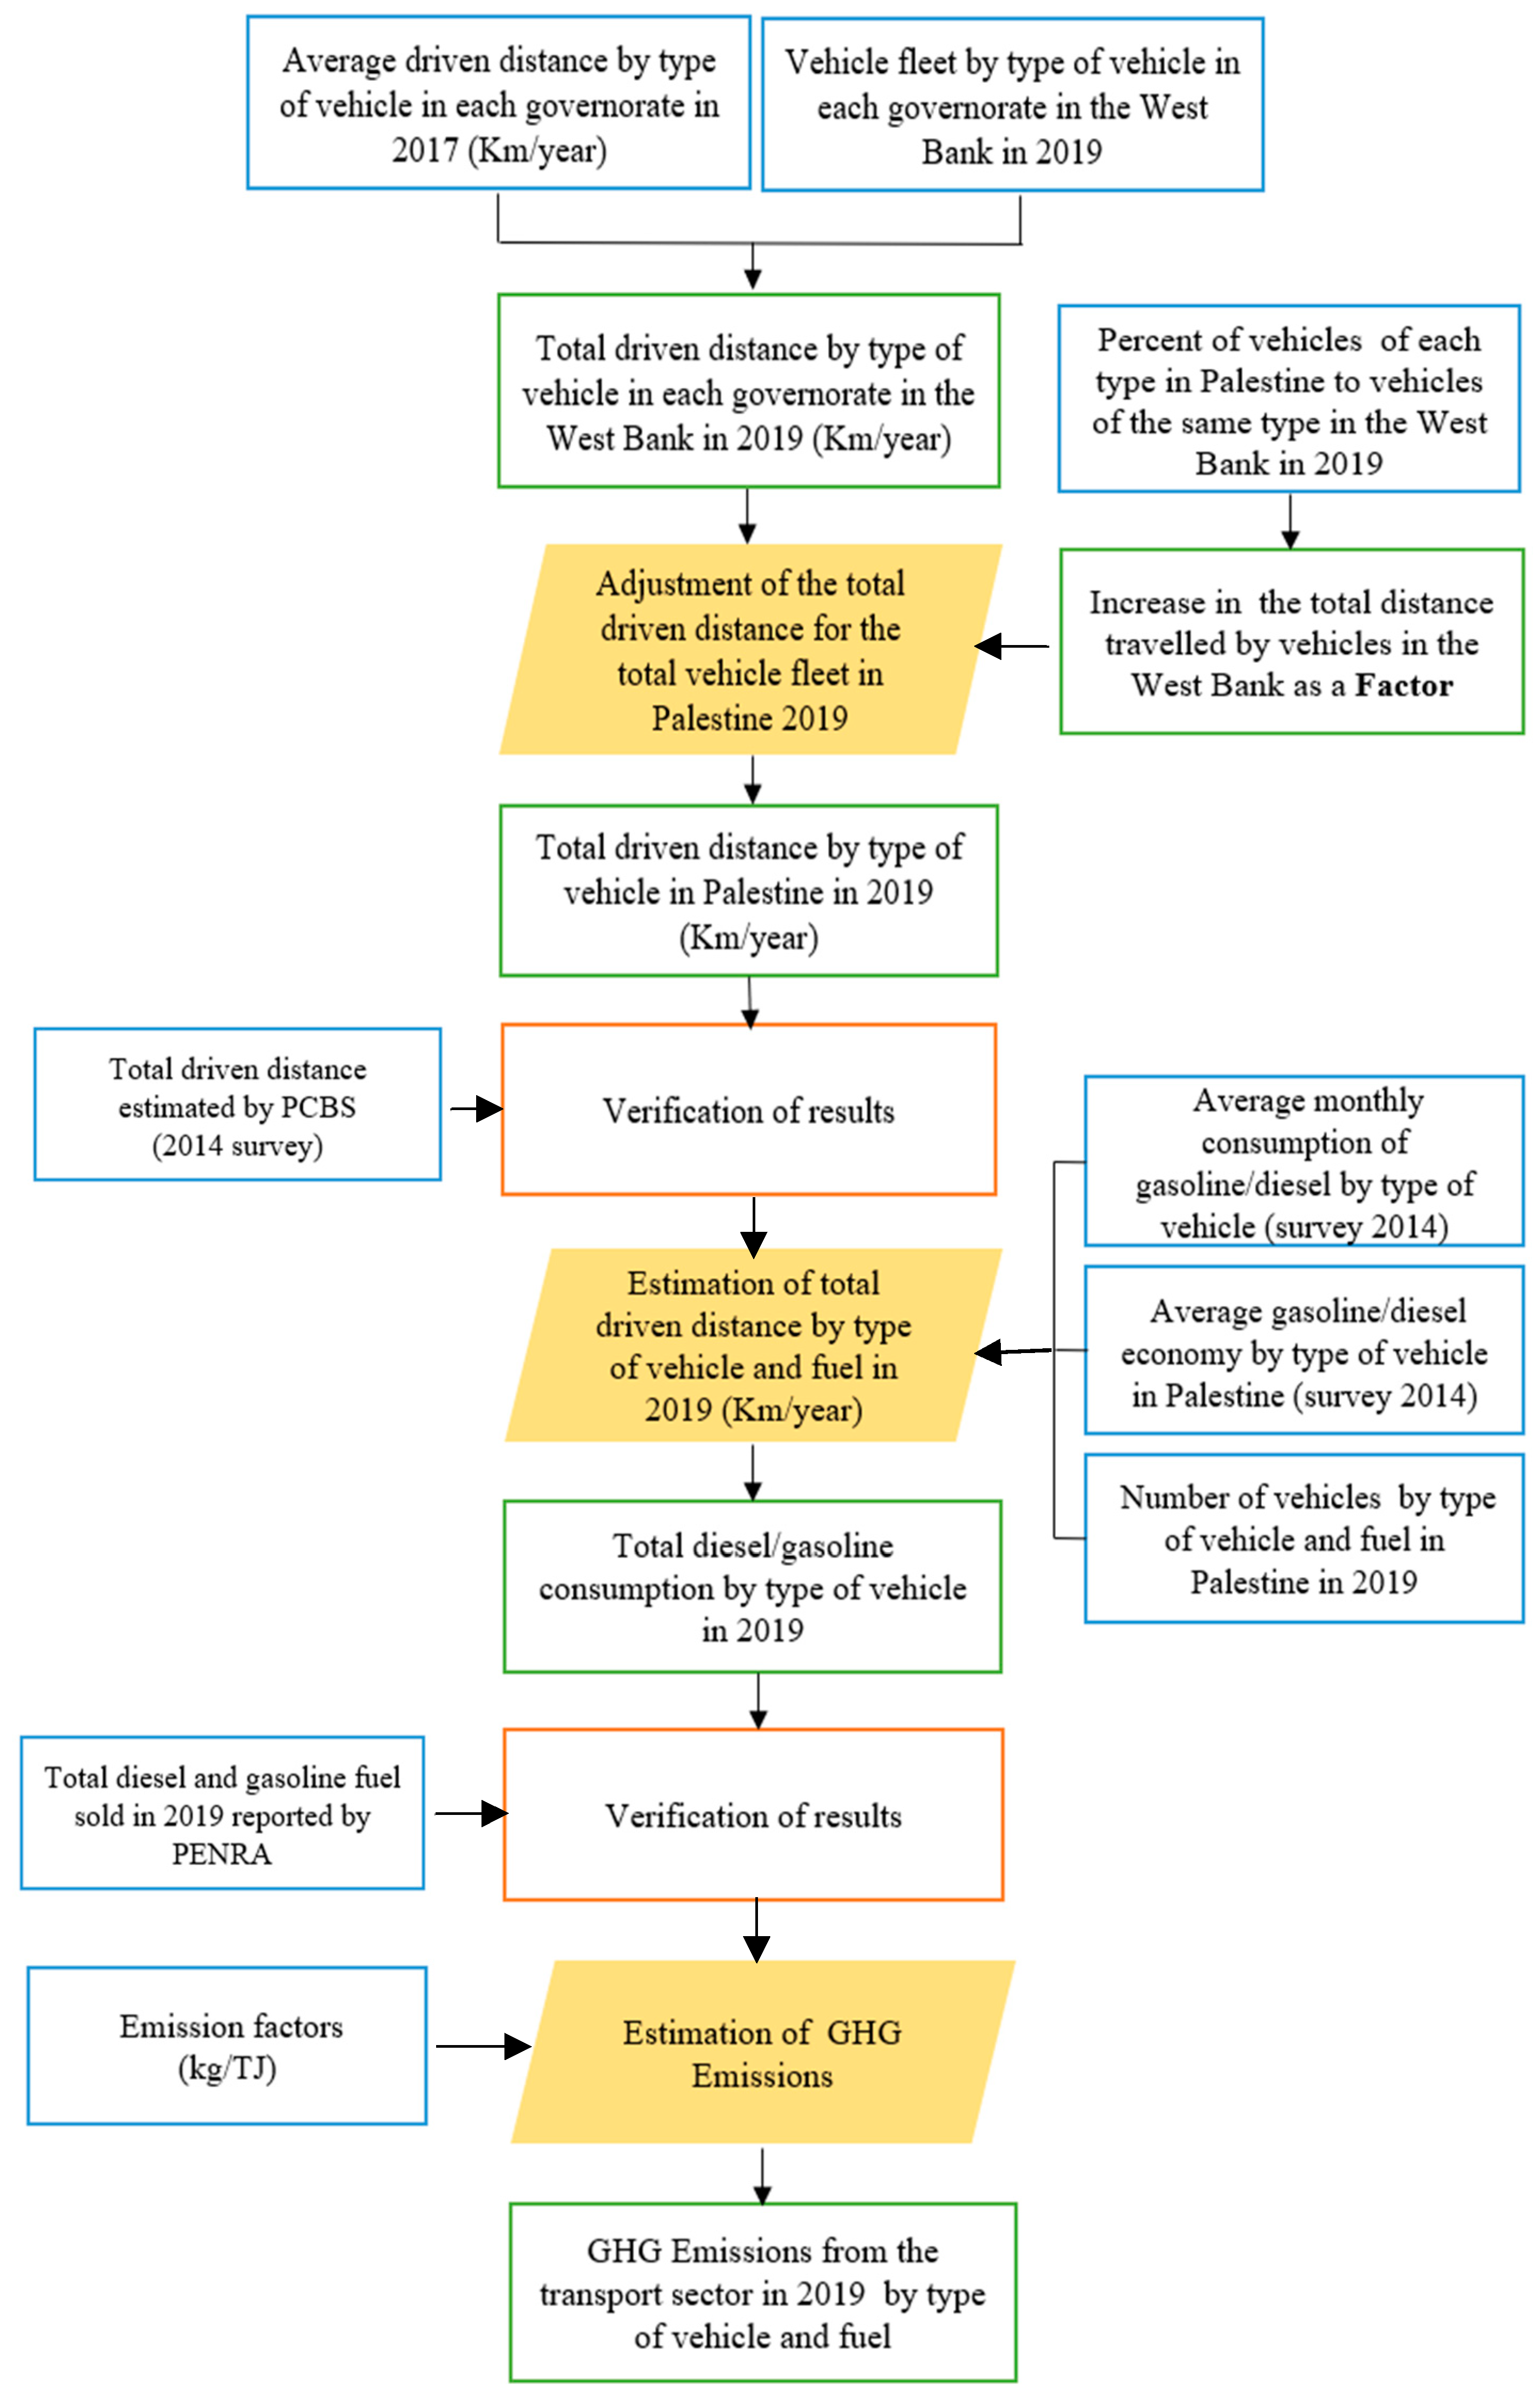
Figure 2.
Trend in the total number of vehicles in Palestine during the period 2011–2021. The solid red line represents the mean trend and the dashed lines represent the 95% confidence interval. The trend and confidence interval are shown at the top as vehicle/year. The *** show that the trend is significant at the 0.001 level.

Figure 3.
Trend in the percent of (A) diesel and (B) gasoline vehicles in the total fleet in Palestine during the period 2011–2021. The solid red line represents the mean trend and the dashed lines represent the 95% confidence interval. The trend and confidence interval are shown at the top as percent/year. The *** show that the trend is significant to 0.001 level.
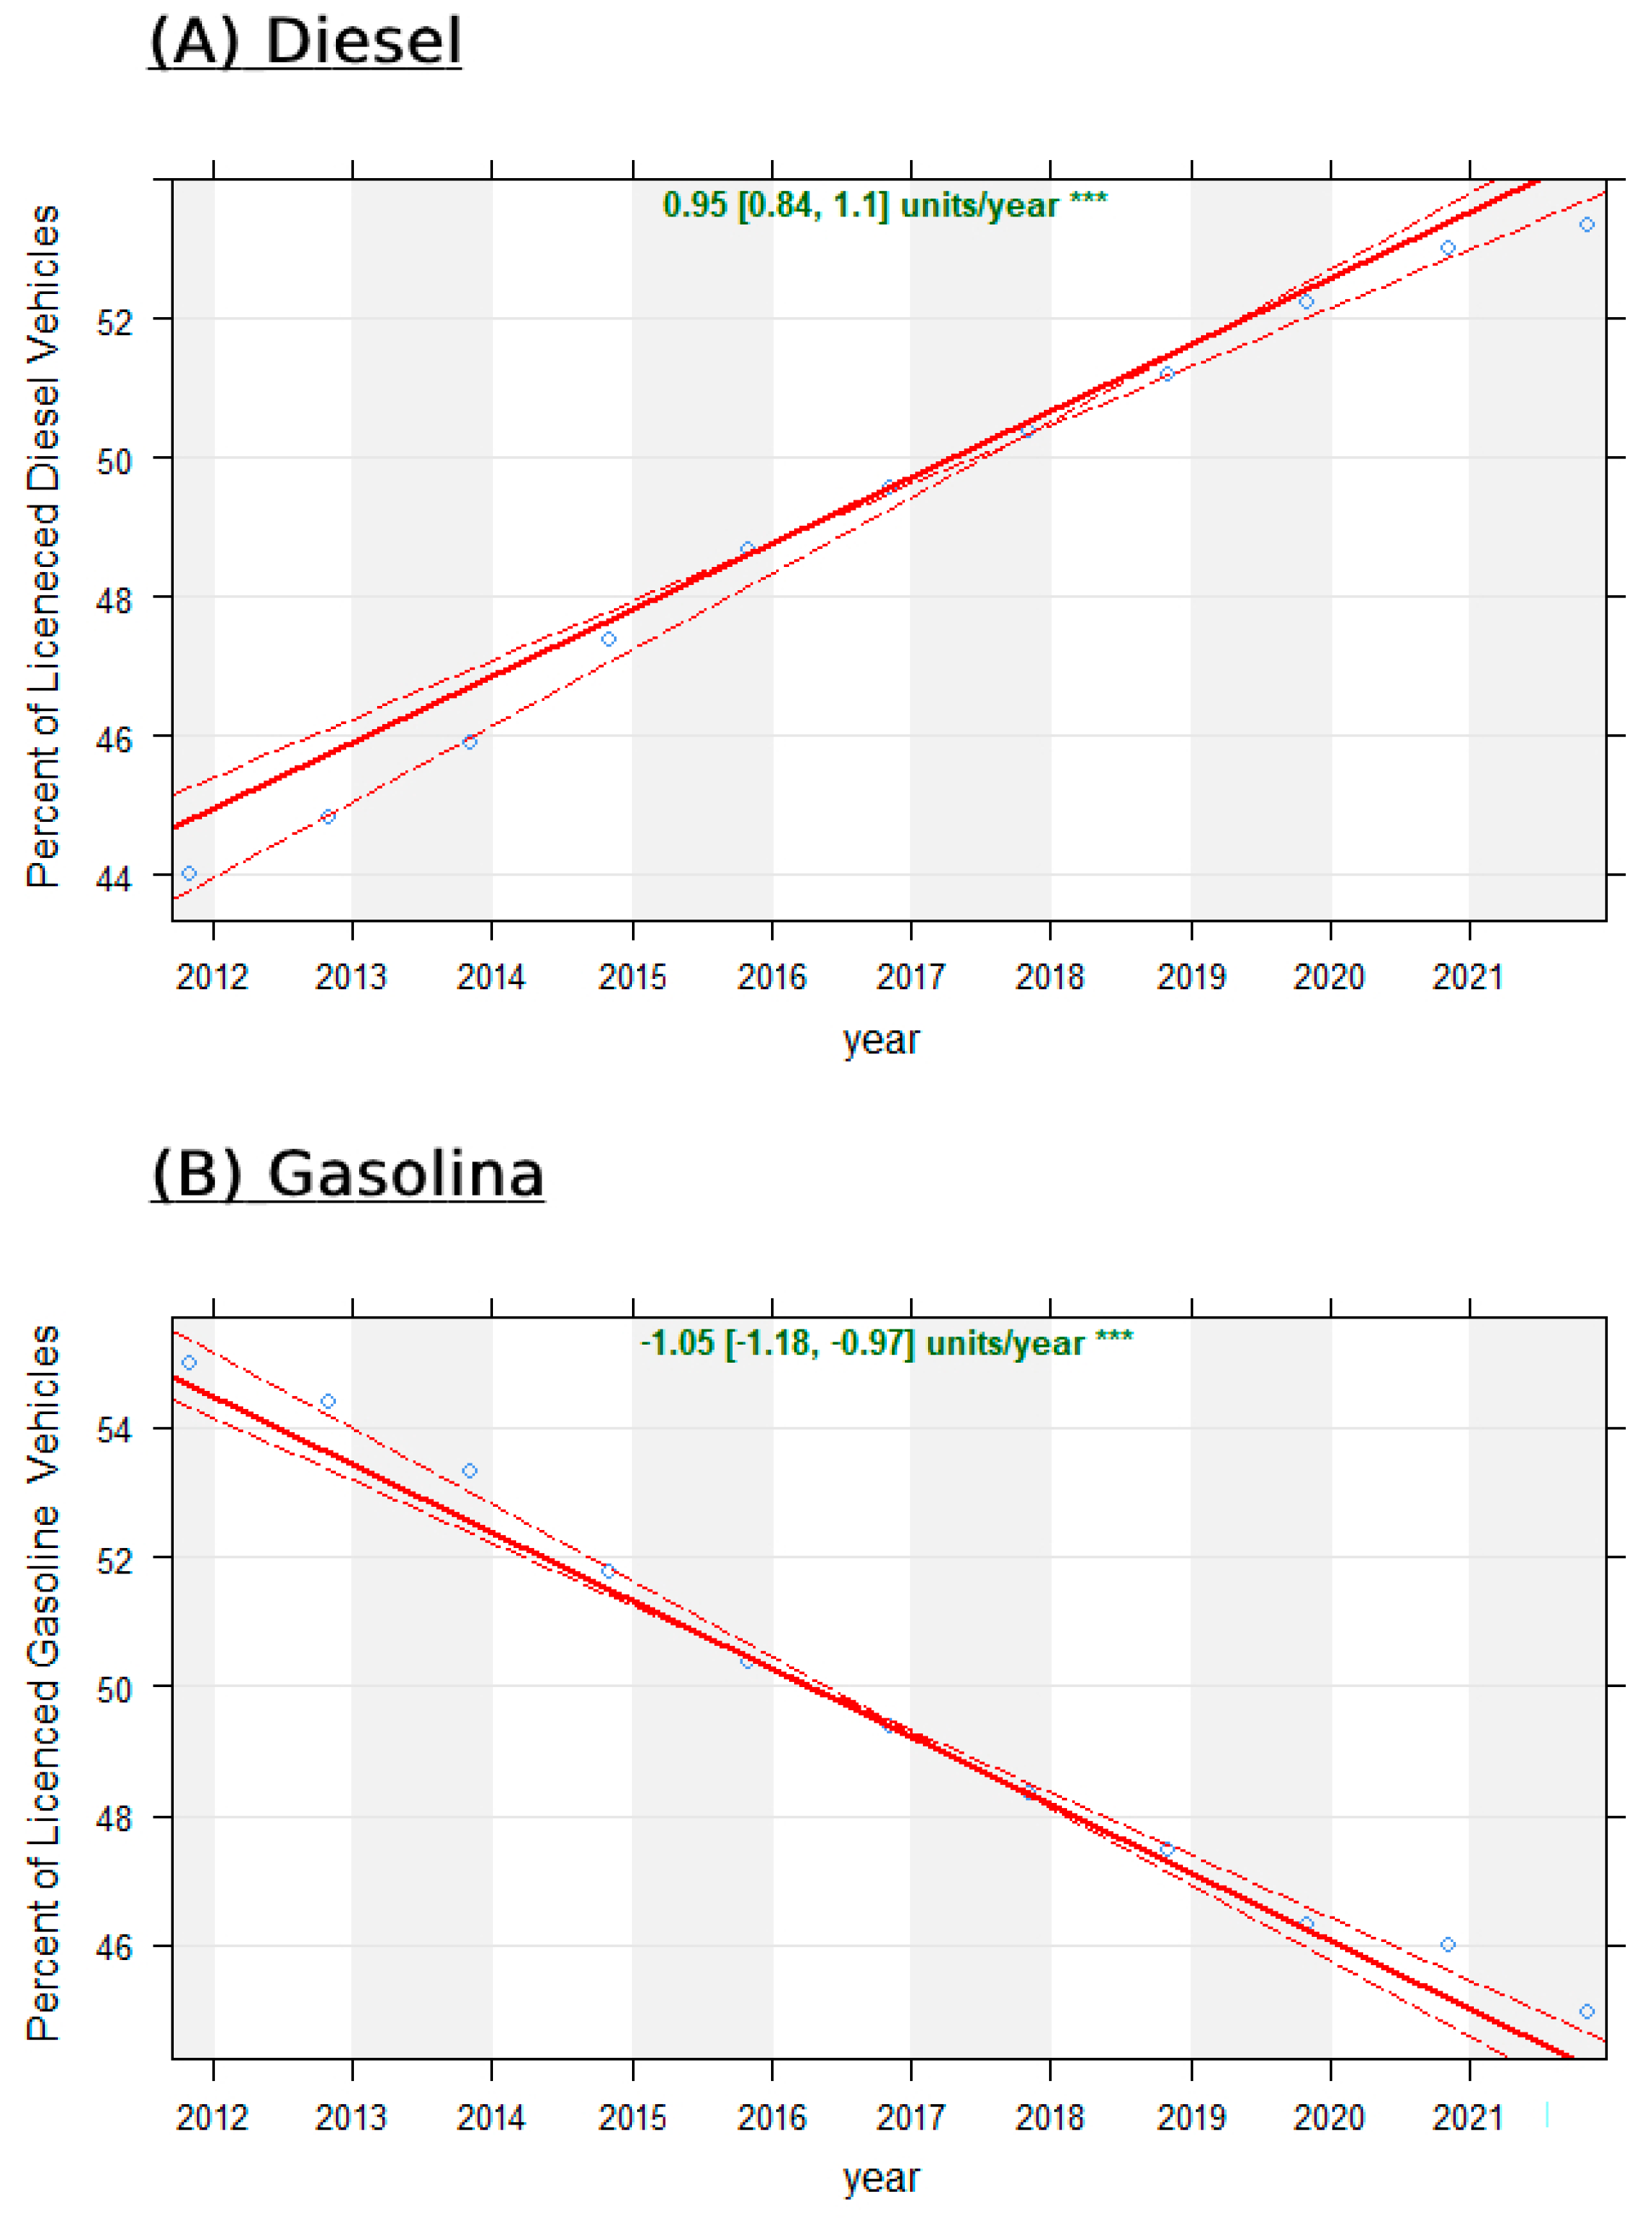
Figure 4.
GHGEs from the transport sector and the vehicle fleet in the West Bank during the period 2011–2021.
Figure 4.
GHGEs from the transport sector and the vehicle fleet in the West Bank during the period 2011–2021.
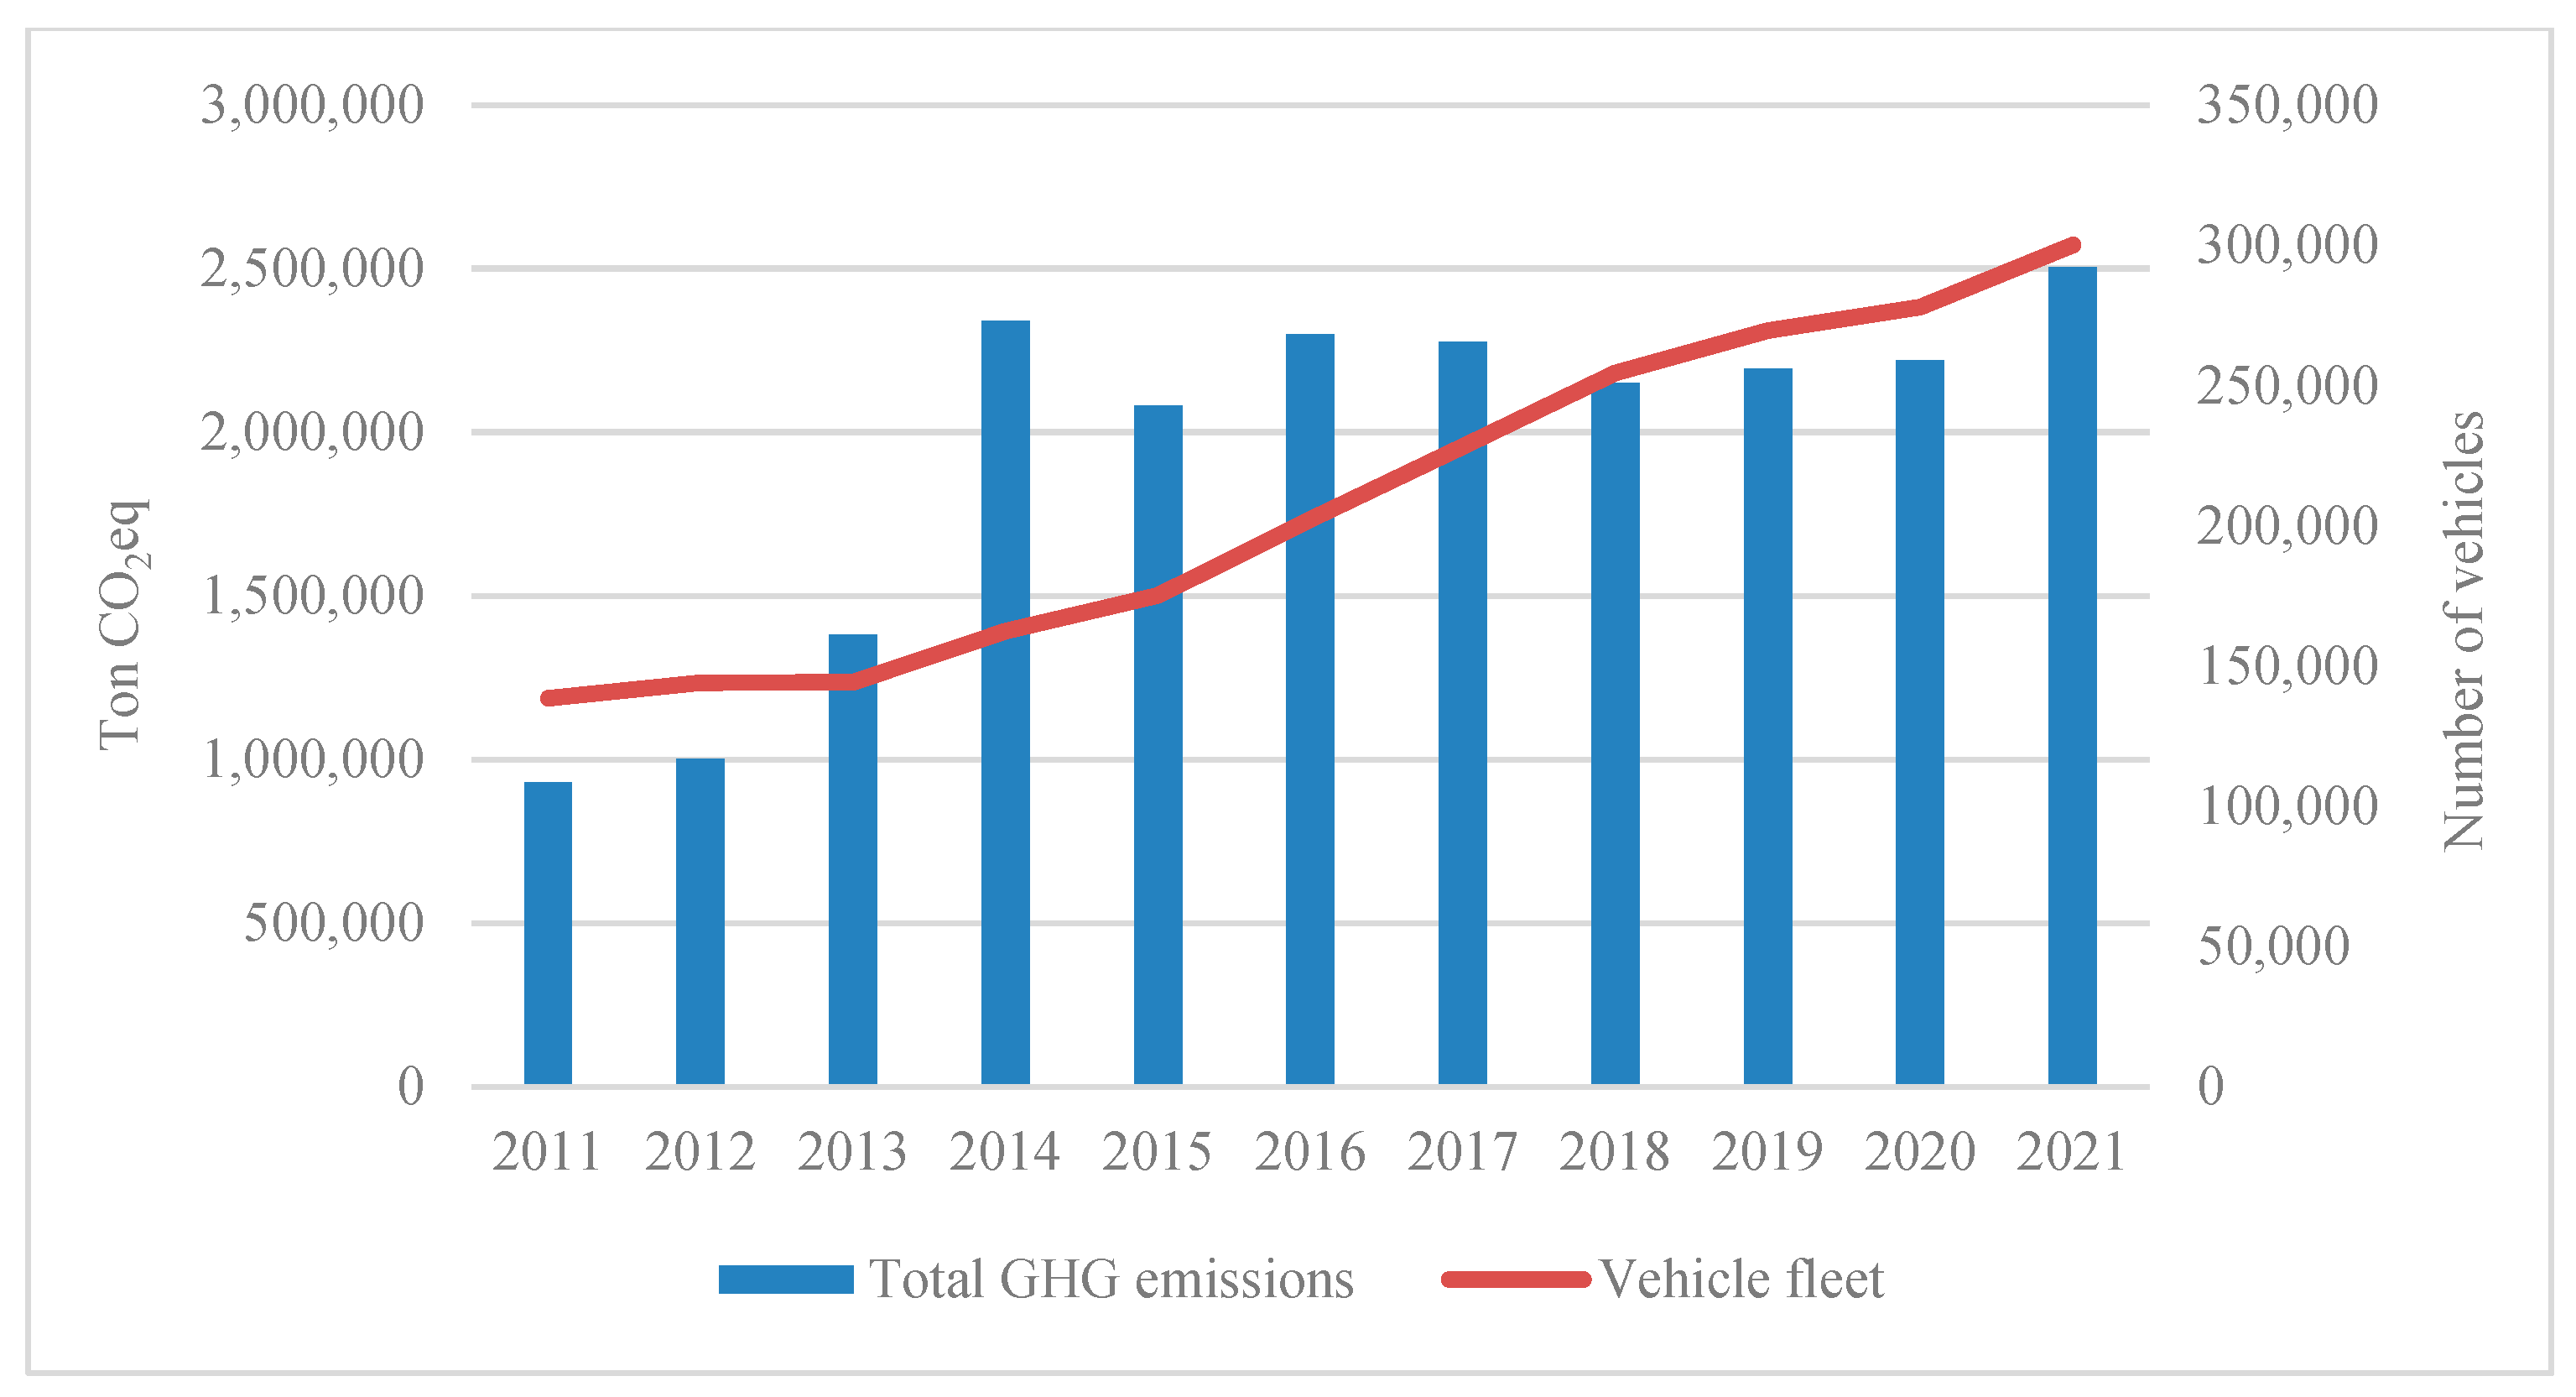
Figure 5.
Trend in road transport GHGEs in the West Bank during the period 2011–2021. The solid red line represents the mean trend and the dashed lines represent the 95% confidence interval. The trend and confidence interval are shown at the top as tons of CO2eq/year.
Figure 5.
Trend in road transport GHGEs in the West Bank during the period 2011–2021. The solid red line represents the mean trend and the dashed lines represent the 95% confidence interval. The trend and confidence interval are shown at the top as tons of CO2eq/year.
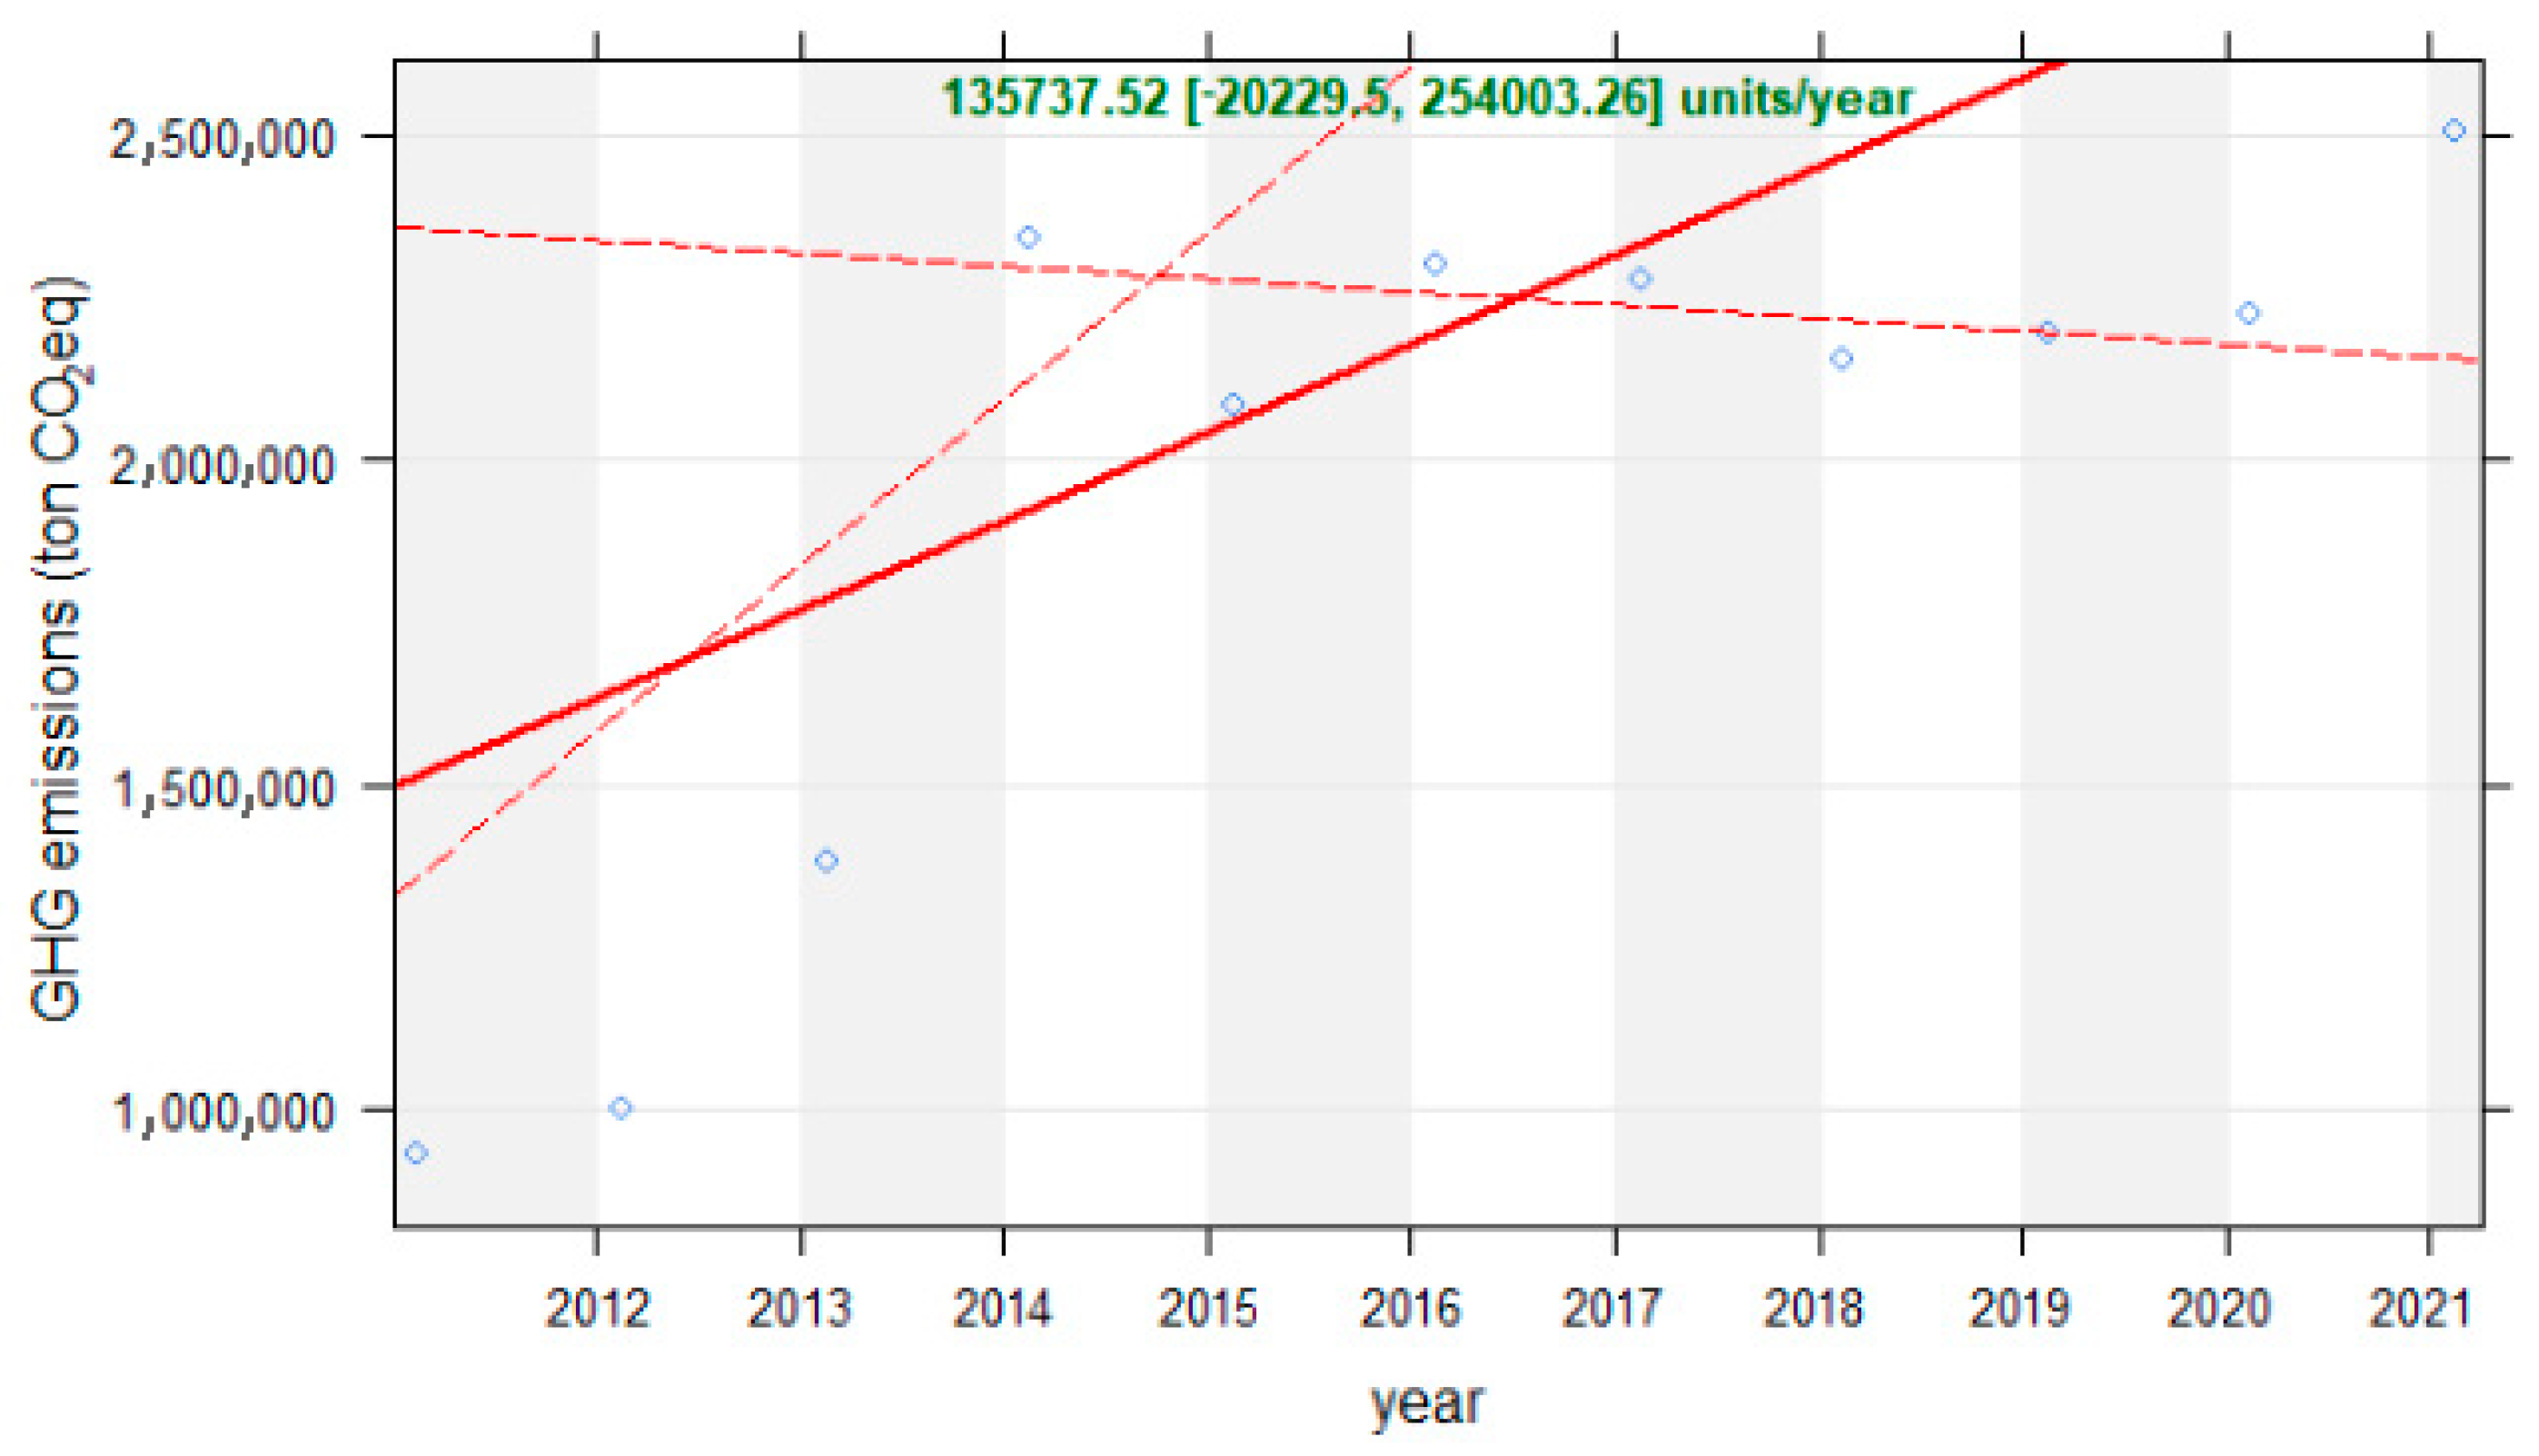
Figure 6.
GHGEs from the transportation sector in Palestine in 2019 by type of GHGEs.
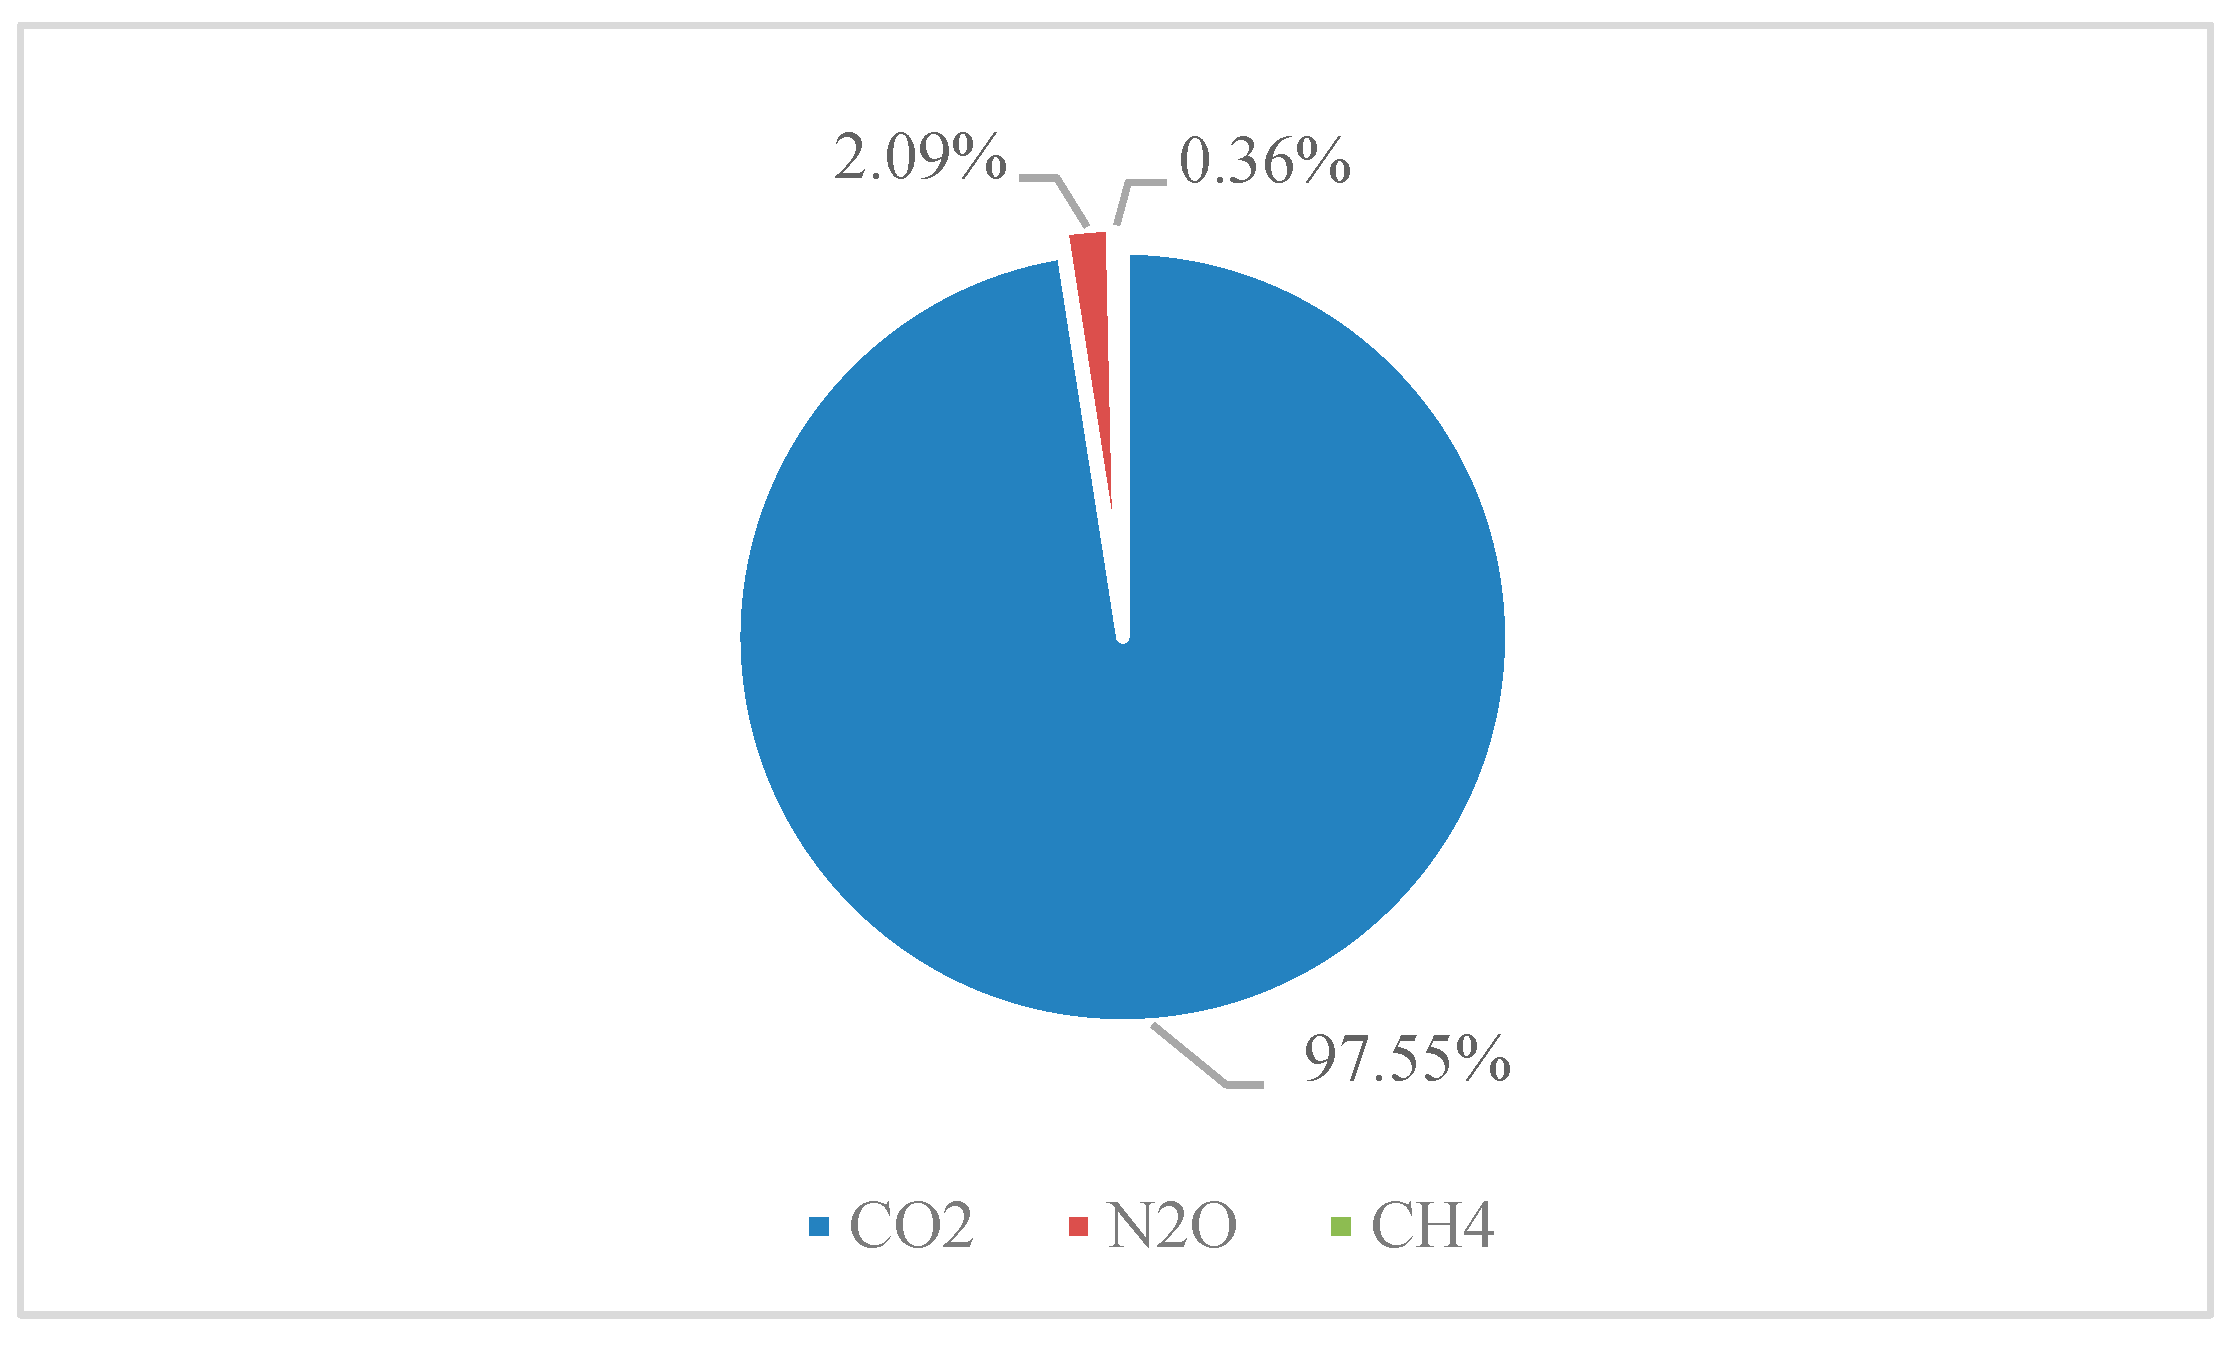
Figure 7.
Total GHGEs from the transport sector in Palestine by type of fuel in 2019 (in tons of CO2eq).
Figure 7.
Total GHGEs from the transport sector in Palestine by type of fuel in 2019 (in tons of CO2eq).
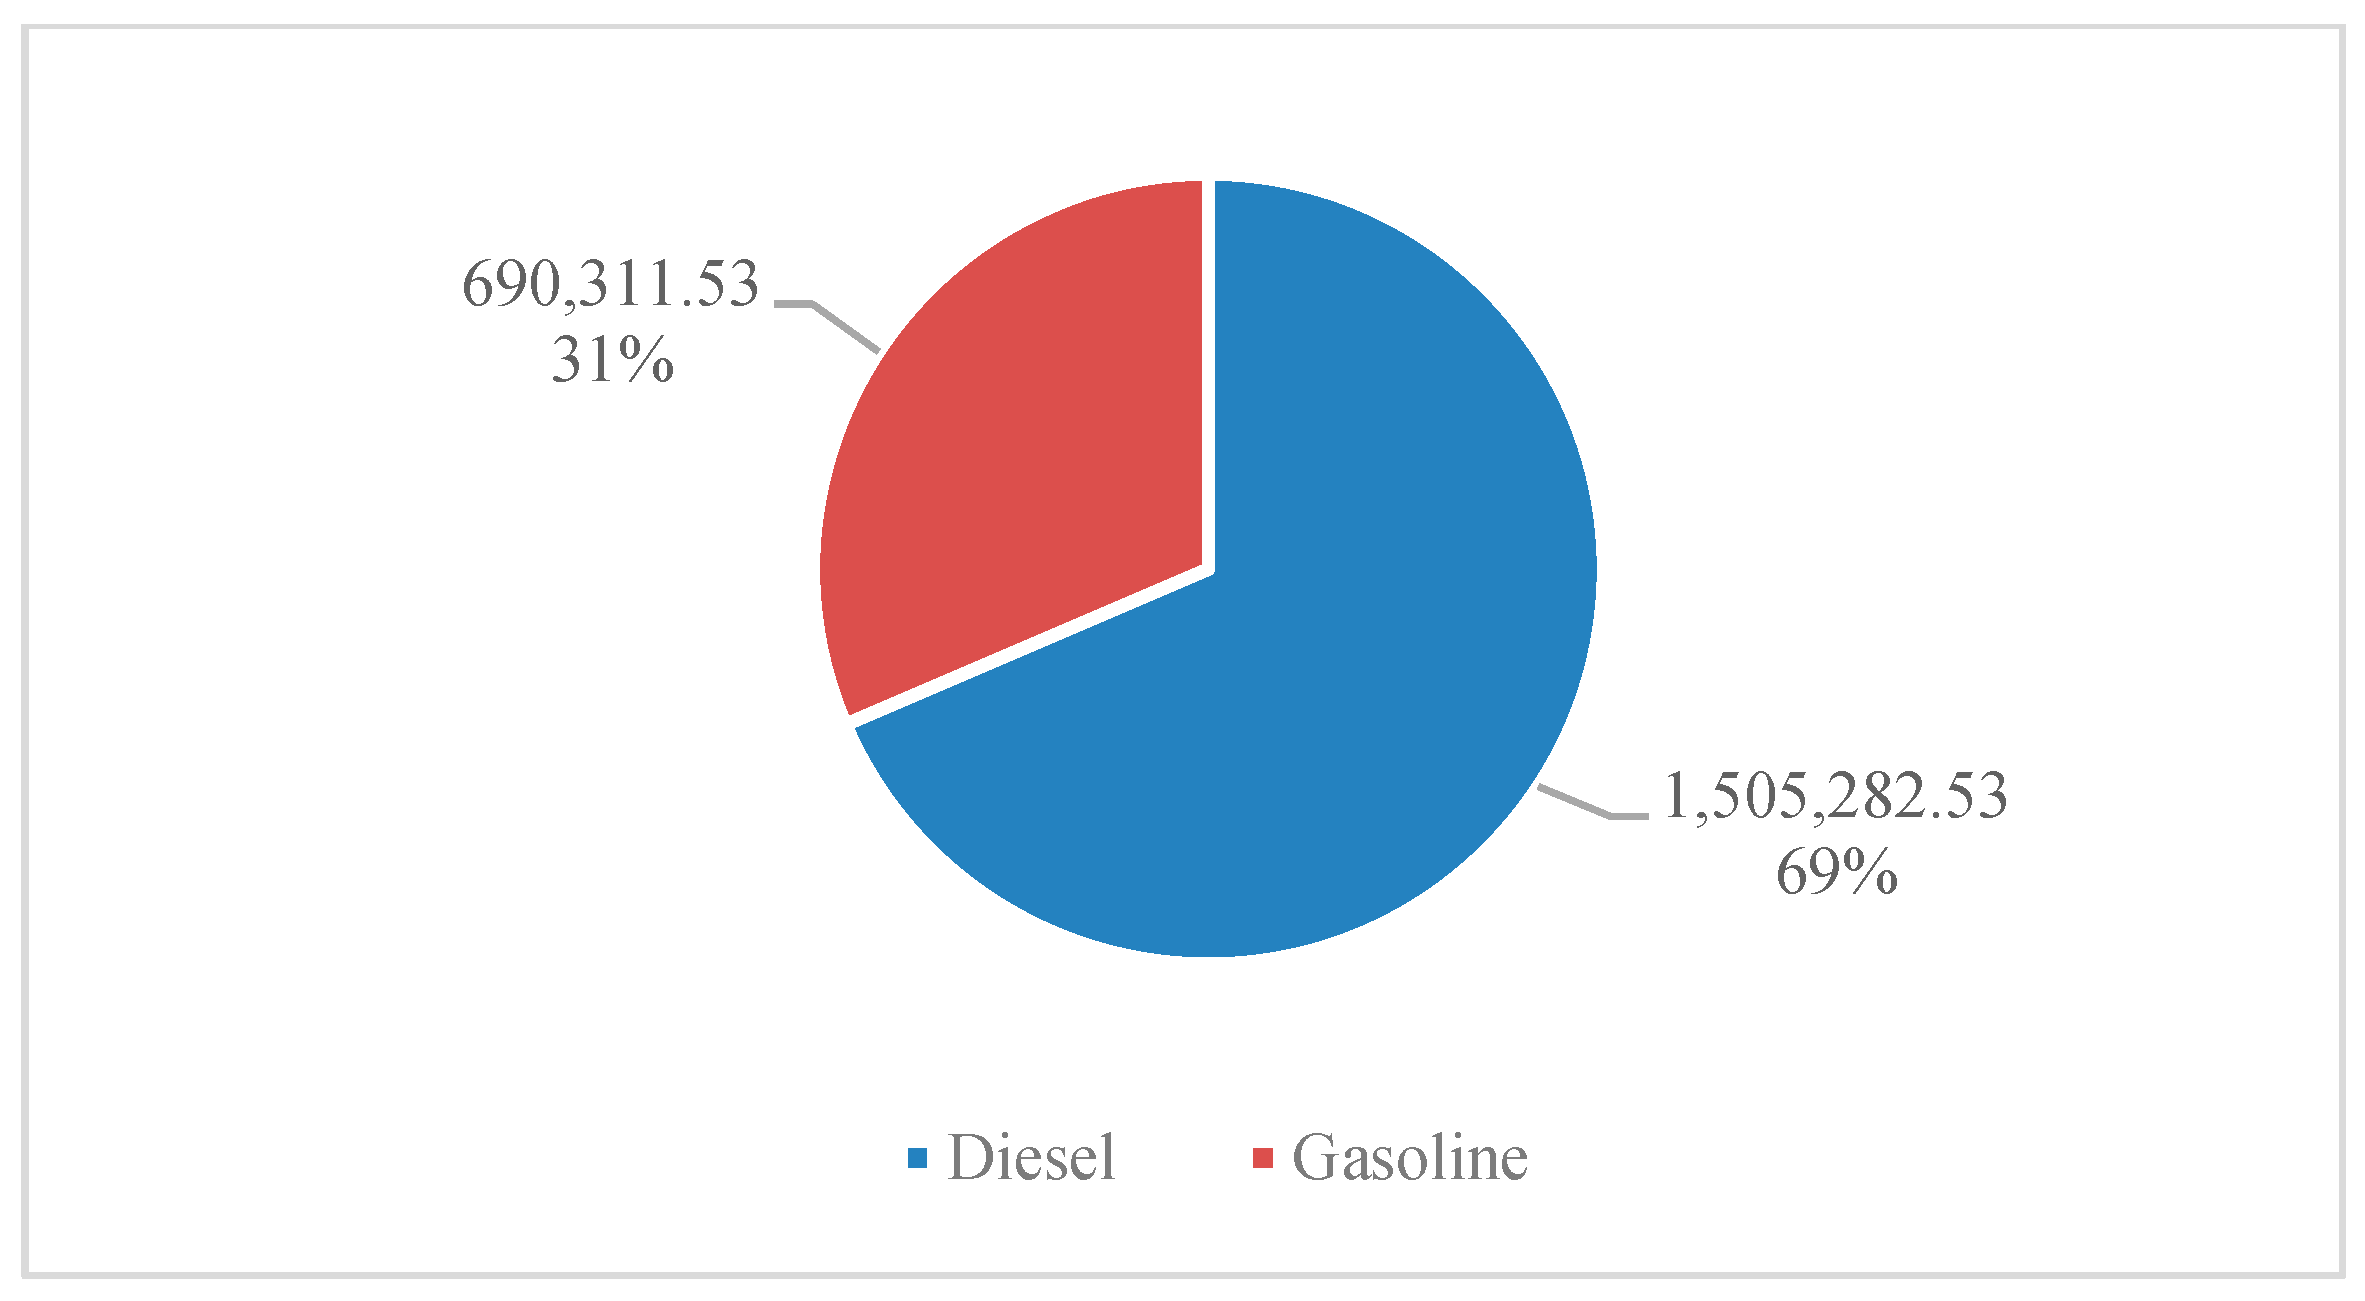
Figure 8.
GHGEs from the transportation sector in Palestine by the type of vehicle in 2019 (tons of CO2eq).
Figure 8.
GHGEs from the transportation sector in Palestine by the type of vehicle in 2019 (tons of CO2eq).
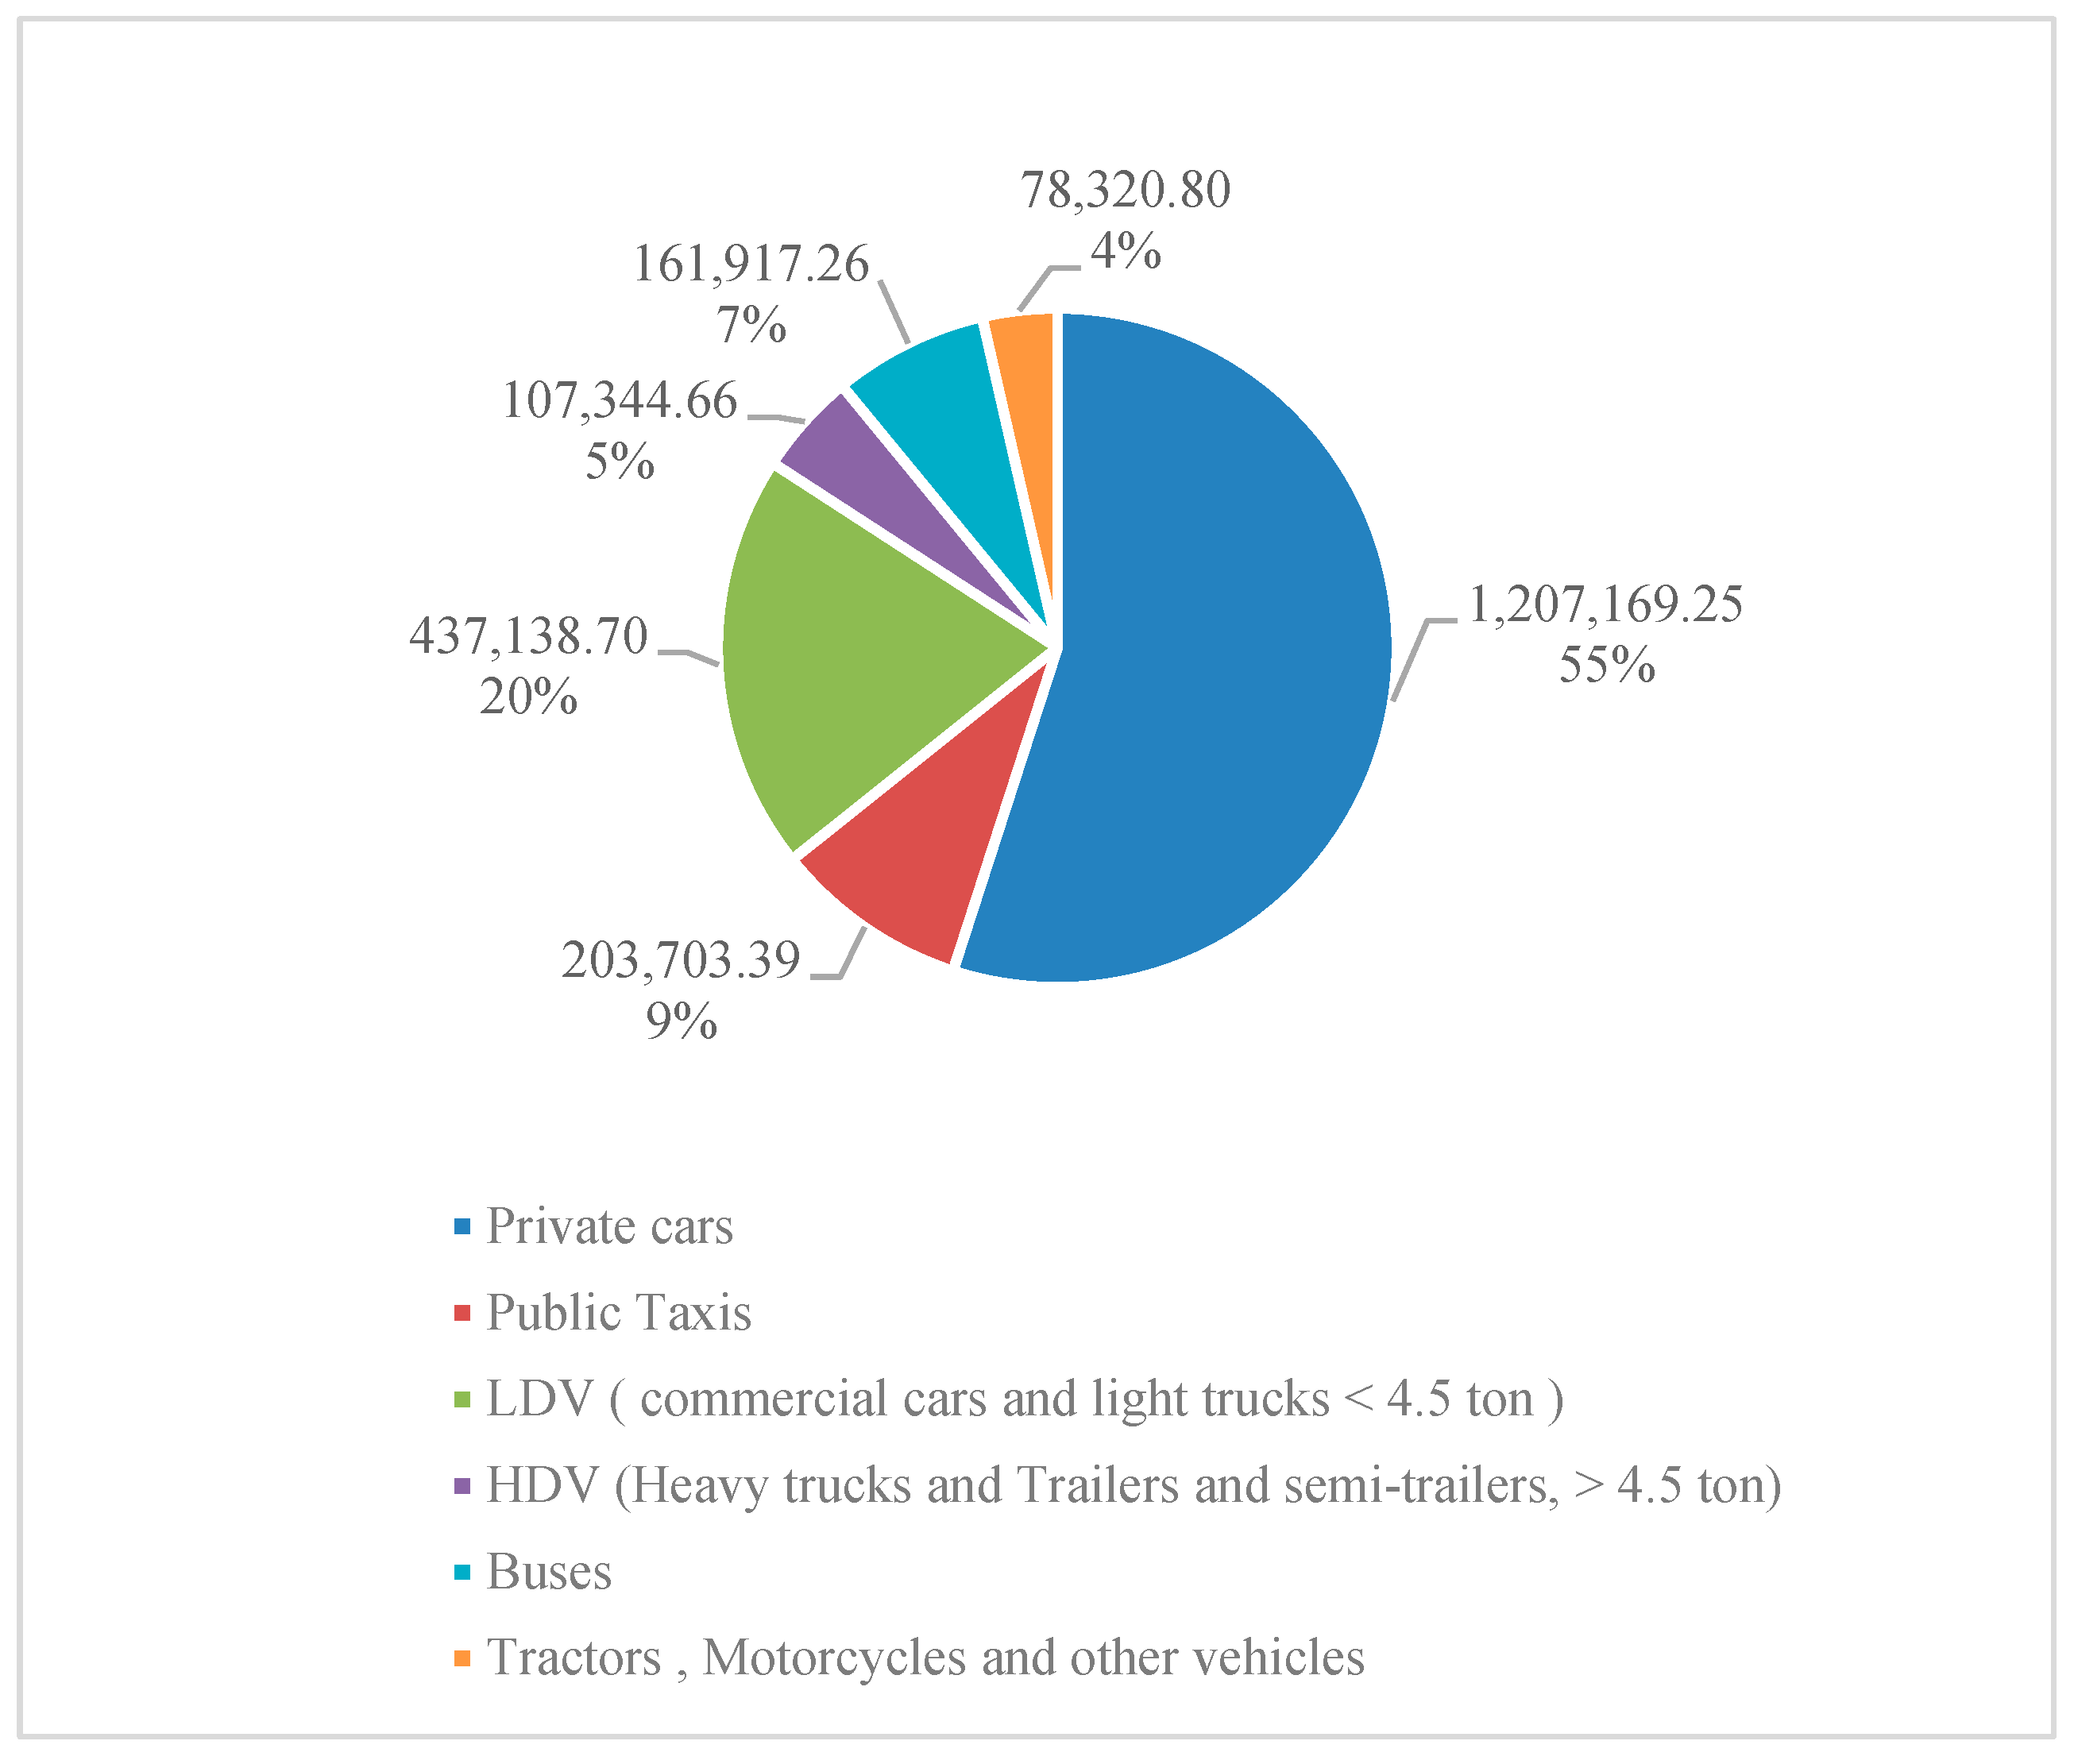
Figure 9.
GHGEs from the transportation sector in Palestine by the type of vehicle and fuel in 2019 (tons of CO2eq).
Figure 9.
GHGEs from the transportation sector in Palestine by the type of vehicle and fuel in 2019 (tons of CO2eq).

Figure 10.
Difference between emissions from the transport sector in this study and the National Greenhouse Gas Inventory of Palestine for the same study year, 2019.
Figure 10.
Difference between emissions from the transport sector in this study and the National Greenhouse Gas Inventory of Palestine for the same study year, 2019.


Table 1.
Classification of the vehicle fleet in Palestine in 2019 by type of vehicle and fuel.
| Type of Vehicle | Total Number | Fuel | |||||
|---|---|---|---|---|---|---|---|
| Diesel | Gasoline | Electric | Hybrid Diesel | Hybrid Gasoline | Unclassified | ||
| Bus | 2912 | 2912 | |||||
| Tractor | 703 | 703 | |||||
| Public Taxi | 12,219 | 12,157 | 29 | 32 | |||
| Private Car | 249,637 | 115,083 | 131,758 | 66 | 624 | 1947 | |
| Commercial Vehicle | 15,921 | 15,380 | 541 | ||||
| Commercial Truck < 4.5 ton | 10,807 | 10,685 | 16 | ||||
| Other Truck > 4.5 ton | 4127 | 4122 | |||||
| Motorcycle | 1212 | 1212 | |||||
| Trailer and Semi-Trailer | 3757 | 601 | |||||
| Other Vehicle | 820 | 820 | |||||
| Grand Total | 302,115 | 162,463 | 133,556 | 66 | 656 | 1947 | |
Table 2.
Data collected by its source.
| Data | Source | Reference |
|---|---|---|
| Number of vehicles by the type of vehicle and fleet | Palestinian Ministry of Transport in the West Bank and Gaza Strip (MoT) | [38] |
| Vehicles’ kilometers travelled by type of vehicle | Published literature | [39] |
| Vehicles’ kilometers travelled by type of fuel | Energy consumption in the transport sector and fuel economy in Palestine from PCBS | [40] |
| Fuel sales by type of fuel | Palestinian Energy and Natural Resources Authority (PENRA) and Palestinian Central Bureau of Statistics (PCBS) | [41,42] |
| Typical fuel consumption figures, per km, by category of vehicle | European Environment Agency (EEA) | [15] |
| Fuel economy by type of vehicle in Palestine | Energy consumption in the transport sector and fuel economy in Palestine from PCBS | [40] |
| Fuel quality in gas stations in Palestine | Published literature | [39,43] |
Disclaimer/Publisher’s Note: The statements, opinions and data contained in all publications are solely those of the individual author(s) and contributor(s) and not of MDPI and/or the editor(s). MDPI and/or the editor(s) disclaim responsibility for any injury to people or property resulting from any ideas, methods, instructions or products referred to in the content. |
© 2023 by the authors. Licensee MDPI, Basel, Switzerland. This article is an open access article distributed under the terms and conditions of the Creative Commons Attribution (CC BY) license (https://creativecommons.org/licenses/by/4.0/).
Share and Cite
MDPI and ACS Style
Jafar, H.A.; Shahrour, I.; Mroueh, H. Use of a Hybrid Approach to Estimate Greenhouse Gas Emissions from the Transport Sector in Palestine. Climate 2023, 11, 170. https://doi.org/10.3390/cli11080170
AMA Style
Jafar HA, Shahrour I, Mroueh H. Use of a Hybrid Approach to Estimate Greenhouse Gas Emissions from the Transport Sector in Palestine. Climate. 2023; 11(8):170. https://doi.org/10.3390/cli11080170
Chicago/Turabian StyleJafar, Hanan A., Isam Shahrour, and Hussein Mroueh. 2023. "Use of a Hybrid Approach to Estimate Greenhouse Gas Emissions from the Transport Sector in Palestine" Climate 11, no. 8: 170. https://doi.org/10.3390/cli11080170
Note that from the first issue of 2016, this journal uses article numbers instead of page numbers. See further details here.