Article

Heatwave Variability and Structure in South Africa during Summer Drought

by
Innocent L. Mbokodo
1,*,
Mary-Jane M. Bopape
2,
Thando Ndarana
3,
Sifiso M. S. Mbatha
1,
Tshimbiluni P. Muofhe
4,
Mukovhe V. Singo
5,
Nkosinathi G. Xulu
6,
Tumelo Mohomi
7,
Kingsley K. Ayisi
8 and
Hector Chikoore
7,8
1
Climate Service, South African Weather Service, Private Bag X097, Pretoria 0001, South Africa
2
South African Environmental Observation Network, National Research Foundation, Pretoria 0083, South Africa
3
Department of Geography, Geo-Informatics and Meteorology, University of Pretoria, Hatfield 0028, South Africa
4
Global Change Institute, University of the Witwatersrand, Johannesburg 2000, South Africa
5
Departmental of Geography and Environmental Sciences, University of Venda, Thohoyandou 0950, South Africa
6
Department of Geography and Environmental Studies, University of Zululand, KwaDlangezwa 3886, South Africa
7
Department of Geography and Environmental Studies, University of Limpopo, Sovenga 0727, South Africa
8
Risk and Vulnerability Science Center, University of Limpopo, Sovenga 0727, South Africa
*
Author to whom correspondence should be addressed.
Climate 2023, 11(2), 38; https://doi.org/10.3390/cli11020038
Submission received: 19 December 2022 / Revised: 2 February 2023 / Accepted: 3 February 2023 / Published: 5 February 2023

Abstract

:
Pronounced subsidence leading to summer drought over southern Africa causes warmer than average surface air temperatures or even heatwave (HW) conditions. We investigated the occurrence of HWs during the summer drought over South Africa based on station data and the ECMWF ERA5 reanalyses. Temperature observations from the South African Weather Service were analyzed for seasonality and long-term trends (1981–2020) as background to the occurrence and variability of HWs. We focused on three severe El Niño Southern Oscillation (ENSO)-induced drought seasons, i.e., 1982/83, 1991/92, and 2015/16, to investigate HW characteristics. While 1997/98 was among the strongest El Niño seasons, the impacts were not as severe because it coincided with an intense Angola low, which allowed for rain-bearing cloud bands to form. Results showed that the hottest months were spread across the austral summer season from December to February. Regions experiencing high mean maximum temperatures and high HW frequencies exhibited a strong ENSO signal, with record HWs occurring during 2015/16. The establishment and persistence of a middle-level high-pressure system over Botswana/Namibia (Botswana High) appears to trigger the longest-lasting HWs during drought seasons. The Botswana high is usually coupled with a near-surface continental heat low and/or tropical warm air advection towards the affected region. It was also found that intense ENSO-induced drought events coincided with high HW frequency over South Africa, such as during 1982/83, 1991/92, and the recent 2015/16 events. The results of this study contribute to understanding drought and heat wave dynamics in a region experiencing rapid warming as a result of climate change.

1. Introduction

Weather and climate extremes have adverse effects on the environment, biodiversity, the economy, and society in general. They may hamper the attainment of sustainable development goals and national development plans [1]. Climate change is increasing the frequency and intensity of some extreme events, including heat waves and heavy rainfall events [2,3,4,5,6,7,8]. Vulnerability to these extreme weather and climate events is highly variable across the globe, depending on exposure, socio-economic status, and other factors, with the poorest likely to be most adversely impacted by them [9,10]. Climate extremes such as floods, droughts, and heatwaves (HWs) have become a topical issue [2,11,12,13] because they triggered the majority of natural disasters over the past few decades [6,14].
Previous studies based on observations indicate that there is a positive temperature trend due to increasing anthropogenic greenhouse gas emissions [15,16,17,18]. The temperature signal is the most robust of climate trends and projections over southern Africa [16]. For some time during the past century, surface air temperature trends over South Africa had been alternating between negative and positive, consistent with global trends [19]. The balancing effect of aerosols on greenhouse gas emissions was thought to moderate global temperature trends between the 1940s and late 1970s [19]. Aerosols, due to industrialization, tend to moderate temperatures via Mie scattering of solar radiation, whereas greenhouse gases promote warming through the absorption of terrestrial radiation. Jones (1994) [20] suggested that from 1885 to 1915, the country was cooling, but an increasing temperature trend was observed for a 30-year period between 1915 and 1945. Cooling of the atmosphere was observed again until 1970, when rapid warming occurred. [21] also found a positive trend in mean daily maximum and minimum temperatures between 1950 and 1993. However, other studies (e.g., [22]) found negative trends over South Africa’s coastal regions, with warming occurring in the central interior of the country, particularly from 1901 to 1995.
A positive global general trend of temperatures is observed owing to global warming of the earth’s atmosphere, with a narrowing DTR (e.g., [23]), but that may not necessarily be the case with regional temperature trends as microclimates vary from place to place. Differential increases in both maximum and minimum temperatures were observed in South Africa from 1961 to 2000, with steeper increases in maximum temperatures [24]. However, while also suggesting an increase in daily maximum and minimum temperatures, a study by [25] found decreases in the diurnal temperature range (DTR) in South Africa, suggesting minimum temperatures were increasing faster. These findings were in contrast to earlier findings of the study [26], which reported an increase in minimum temperature but a decrease in maximum temperature. Studies by [27] and [28] also showed increases in maximum and minimum temperatures over most of South Africa, increasing the chances of warm extreme temperature events such as HWs. While these studies [24,25,26,27,28] used ground-station data, they focused on different study periods, hence the different trends. More recently, rising temperature trends have become more robust and statistically significant across much of South(ern) Africa [6,16].
HW occurrences can lead to negative impacts in different sectors across South Africa, from water resources to the energy sector [29], including human wellbeing and livelihoods. HWs can increase illnesses or even mortality and morbidity rates [30] because some populations are more vulnerable to heat stress [31]. The young and older population age groups tend to be more vulnerable to HW impacts via cardio-vascular complications. The urban heat island effect may exacerbate HWs in cities or semi-urban areas. Several studies suggest that HWs are projected to last longer, become more frequent, and be more intense on a global scale (e.g., [6,12,16,24,32,33]). Understanding the historical nature of HWs in South Africa can assist in formulating mitigation strategies that seek to minimize the negative impacts resulting from these events in the country.
As with HWs, meteorological droughts can also produce severe socio-economic impacts, and these events have been extensively studied over different decades (e.g., [13,34,35,36]). Drought is a phenomenon that is not easily defined or measured [37], but is best represented by quantitative parameters that indicate the imbalance between water demand and supply or the total environmental moisture status of a particular region. Droughts tend to occur over large areas due to precipitation deficits and high evaporation, which are often caused by persistent anticyclonic circulations in the atmosphere. Soil moisture is a key contributor to the relationship between HW occurrences and droughts [38] because negative soil moisture anomalies are associated with droughts [39]. The negative soil moisture anomalies increase the Bowen ratio, resulting in hotter land surfaces, which then increase atmospheric temperatures [40]. The conditions that favor droughts, such as anticyclonic circulations and subsidence, also promote the occurrence of high temperatures and HWs. Subsiding air during a summer drought warms adiabatically, leading to high temperatures at the surface. The study by [41] demonstrated this link in southern Africa.
Droughts and HWs are usually treated as two distinct phenomena because both duration and spatial extent differ [34]. Droughts are often defined over timescales of months or seasons, whereas HWs can occur over a few days. Several studies have investigated droughts (e.g., [13,36,42,43]) and HWs (e.g., [12,38,44,45]) in isolation. Individually, these events may cause environmental and socioeconomic impacts [46]. However, studies by [41] and [38] suggest that their co-occurrence causes more severe adverse impacts.
The co-occurrence of HWs and droughts is also known to contribute to the occurrence of wildfires [47,48], which in turn affect agricultural yields and rangelands for livestock. Several studies have indicated that compound extreme events are becoming more frequent and more severe worldwide (e.g., [49,50]), elevating the resulting impacts. Compound extremes can be defined as a combination of multiple hazards that contribute to environmental and societal risks [51]. While HWs occur in southern Africa even during seasons of good rainfall, when they coincide with drought seasons, they tend to exacerbate the impacts [41].
Thus, the aim of this study is to investigate the occurrence and nature of HW variability in South Africa during the summer drought. We begin by investigating surface air temperature trends over South Africa during the period from 1981 to 2020. Spatial variability of HWs, average duration, and changes in frequency and intensity over time are analyzed, and ultimately, we examine the occurrence of HW events during a summer drought season over the country. Only seasons of strong El Nino-induced drought conditions were analyzed.

2. Data and Methods

Daily maximum and minimum temperatures were obtained from the South African Weather Service (SAWS) for the period from 1981 to 2020. The data are recorded at a uniform time at all stations as per the World Meteorological Organization (WMO) standards. This study selected stations of different altitudes that have at least 95% data available during the study period. Selected stations are well distributed across South Africa so that all thermal regions (Clusters) discussed in [28] are well represented (Figure 1). The altitude of a station’s location is of utmost importance because temperature is influenced by elevation [52], and therefore South Africa’s complex topography contributes to temperature variability.
RClimDex version 1.0 software [53] was used to quality control the data. The RClimDex is an R-based statistical tool which is freely downloadable from the Expert Team on Climate Change Detection and Indices (ETCCDI) website (http://etccdi.pacificclimate.org/software.shtml, (accessed on 20 November 2022)). This software detects minimum temperature values greater than maximum temperatures and outliers on the dataset by 3.5 times the standard deviation from the climatology of the day. This standard deviation of 3.5 has been used in the past by [24]. This tool also checks for duplicates and computes 27 core indices recommended by the World Meteorological Organization Expert Team on Climate Change Detection and Indices (WMO ETCCDI). The RClimDex version 1.0 software was also used to calculate trends of selected temperature indices (Table 1) relevant to this study. TN10P and TN90P represent cold and warm nights, respectively, while cool and hot days are represented by TX10P and TX90P, respectively, consistent with Kruger et al. 2019 [54].
Several definitions of HWs may be found in the global literature [55]. This work adopted the SAWS definition that a HW occurs “when for at least three consecutive days the maximum temperature of a certain region is five degrees Celsius higher than the mean maximum for the hottest month for a particular station”, which is also similar to the one used by [32]. Fischer and Schär (2010) [5] defined HWs as events lasting at least six consecutive days. It is evident that different studies have used different thresholds when defining a HW, based on factors such as the weather conditions of the region of interest being considered. In this study, the 3-day duration is adopted because it does not exclude the possibility of detecting shorter-lasting HWs. HWs are also defined in terms of the 3-day period in the American Meteorological Society (AMS).
This paper also investigates a meteorological drought, which can be defined as an event where there is a scarcity or lack of precipitation for prolonged episodes [36]. Southern Africa’s climate is characterized by summer drought events that occur about 25% of the time and sometimes as multi-year droughts [13]. There are several phenomena that can contribute to the occurrence of meteorological drought in southern Africa, such as the Indian Ocean Dipole [13,56,57], the Subtropical Indian Ocean Dipole [58,59], the Quasi-Biennal Oscillation [60], and changes in the lower stratosphere [61,62,63]. However, it is the El Nino Southern Oscillation (ENSO) that is a dominant regulator of the seasonal climate over southern Africa [64]; hence, we analyzed droughts that are strongly ENSO-induced. A total of 3 severe drought seasons that coincided with the strongest El Niño episodes were selected, namely 1982/83, 1991/92, and 2015/16. While 1997/98 was among the strongest El Niño seasons [65], the impacts were not as severe because it coincided with an intense Angola low, which allowed for rain-bearing cloud bands to form [66]. HW characteristics such as frequency, duration, and intensity were analyzed during these drought seasons. A case study approach was then adopted where the most intense HW events during each drought season were analyzed to assess the atmospheric structures.
The ERA5 reanalysis data, which have a spatial resolution of 0.25° [67], were analyzed in this study. It is the latest reanalysis data produced by the European Centre for Medium-Range Weather Forecasting (ECMWF). ERA5 has 137 hybrid sigma/pressure levels in the vertical, with the top level at 0.01 hPa. Hourly data were downloaded from the Copernicus Climate Change Service website (https://climate.copernicus.eu/ (accessed on 20 November 2022)). Variables discussed are geopotential height, outgoing longwave radiation, wind vectors, relative humidity, vertical velocity, and precipitation.
The Niño3.4 sea surface temperature (SST) from the National Oceanic and Atmospheric Administration (NOAA) Climate Prediction Center (CPC) obtained via the Royal Netherlands Meteorological Institute (KNMI) Climate Explorer was used in this study. Spatial correlation analysis was then employed to investigate the austral summer maximum temperature and the Niño3.4 sea surface temperature. The Climatic Research Unit (CRU) temperature data with a 0.5° resolution [68] were used to correlate the maximum temperature with Niño3.4. This analysis was performed on the KNMI Climate Explorer platform, which does not provide ERA5 maximum temperature as a variable, but instead provides the average temperature. This was necessary to determine the influence of ENSO cycles on extreme high temperatures during HW occurrences.

3. Results

3.1. Mean Maximum Temperature

Figure 2 presents the 40-year maximum temperature climatology of South Africa. It is evident that the country is characterized by highly variable spatiotemporal maximum temperatures. As expected, high mean maximum temperatures are observed during austral summer (December to February (DJF)), ranging from 22 to 38 °C while the winter period (June to August (JJA)) has a range from 13 to 27 °C. The western interior, particularly the northern parts of the Northern Cape province, experiences high maximum temperatures in all seasons. This region of persistently high temperatures corresponds with the semi-arid Kalahari Desert, which supports a savanna vegetation biome [69]. This was also found to be the case in the northeastern lowveld region, whose altitude lies below 500 m. High-lying areas along the Drakensberg mountains experience generally low temperatures throughout the year, particularly in midwinter. While snowfalls are rare over South Africa, they sometimes occur over the Drakensberg, particularly during deep cutoff low pressure systems and intense cold fronts [70].
Table 2 shows that the hottest months are not concurrent for the 24 selected stations distributed across the country. Previously, it was thought that January was the hottest month across the southern African region. However, it was found that during the 40-year period under investigation, the hottest months were confined to the mid-austral summer season (DJF). The southern coastal region stations (Cape Agulhas and Cape St. Francis stations) recorded the hottest monthly average temperatures in January, while the hottest month for stations on the southeast coast (Mount Edgecombe and Richards Bay) was February. Most stations on the interior had their hottest months in January, except for Lephalale (February), Punda Maria (December), Skukuza (February), and Vryburg (February). It must be noted that three of these stations are in the northeastern part of the country, with both Skukuza and Punda Maria located in the northeastern lowveld. These three stations experience monthly average temperatures well above 30 °C during the hottest months. A most significant finding is that the hottest temperatures do not occur in the same month in different areas of South Africa. The values indicated in Table 2 are thresholds used to calculate the occurrence of HWs.

3.2. Daily Extreme Temperature Trends

The daily extreme trend analysis in cold nights (TN10P) (Figure 3a) indicated that decreasing trends in cold nights per decade were significantly pronounced in the western part of South Africa at a 95% significance level. Most parts of the interior and eastern half of the country did not show any well-defined pattern in the trends of TN10P. An increasing trend in cold nights per decade is also observed, but it is less than 50% of the selected stations, and largely statistically insignificant and weaker in magnitude. Overall, only two stations showed a statistically significant positive trend (95% significance level) for an increase in cold nights per decade. On the other hand, 14 of 24 stations show an increasing trend in warm nights (TN90P) per decade, of which seven are statistically significant with higher magnitudes. The remaining stations showed a decreasing trend, although it was not statistically significant.
There is a noticeable decrease observed in the number of cool days (TX10P), with 18 stations showing a decreasing trend while only 6 stations show a positive trend in the number of cool days per decade. Conversely, all selected stations indicated a positive trend in hot days per decade (TX90P), with 20 stations showing statistically significant upward trends in the number of hot days. This suggests an observed general increase in the number of hot days all over the region, consistent with recent studies (e.g., [71,72]). Overall, ETCCDI analyses suggest an increase in daily temperature extremes, which further necessitates the need to robustly investigate extreme hot temperature events such as heatwaves.

3.3. Heatwave Variability

Over most thermal regions of South Africa, HWs are most common during the austral summer (Figure 4). However, the western coast (thermal region A) proved to be an exception and recorded most of its HWs during the austral winter season (Table 3). This can be linked to the establishment of a semi-permanent high-pressure system over land during winter, which persistently drives warm inland air down the escarpment during this season and results in berg winds around the region that warms adiabatically [73]. Berg winds are a foehn type of wind that occur along the coast of South Africa when continental air descends a steep escarpment toward the coast, usually in the presence of a coastal low [73]. The winter season over South Africa is also the rainy season along the west and south coasts, due to the passage of cold fronts from the South Atlantic [73]. Coastal lows often precede cold fronts, resulting in berg winds, high temperatures, or HWs, which may lead to wild forest fires.
Table 3 presents the monthly HW frequency of the selected stations, while Table 4 and Table 5 present the monthly average duration and intensity, respectively. It is observed that HWs are a common feature of the climate of South Africa, with almost half of the selected stations experiencing an average of at least one HW event per season over the 40-year period. Stations experiencing high total HW frequency are those that are more equatorward, such as Port Nolloth (29.23° S, 16.87° E) and Punda Maria (22.68° S, 31.02° E), which have 104 and 79 events, respectively. Thermal region F bordering Botswana in the north also recorded the most total number of heatwaves (325). These events last for more than four days and are the second most intense. Not many HW occurrences are observed on the southwestern coast, and the few that occur tend to last for a few days, i.e., an average of 3 days. No significant HW activity was observed on the southeast coast. The Mount Edgecombe station in the thermal region B on the southeast coast did not record any HW events during the 40-year study period. This can be attributed to the regular cooling effect of the adjacent oceans as well as temperature changes along the coast due to perturbations from traveling weather systems such as cold fronts and ridging highs.
Region C experiences most HWs from early to mid-summer, and they have an average duration of more than 3 days. Region D recorded a total of 121 HW occurrences during mid-summer, and they were the most intense over the entire country. This is the dry region of the country, which experiences higher maximum temperatures than the rest of the country, as indicated earlier on in Section 3. Region E, which is the southeastern interior where temperatures are highly influenced by conditions of the warm Indian Ocean, recorded 93 HWs that lasted an average of about 4 days and were intense (35.72 °C) when compared to the adjacent coastal region, which had an average intensity of 25.49 °C.

3.4. Heatwave and Droughts

Meteorological droughts in South Africa have been linked to the ENSO phenomenon [13], and therefore this study focuses on ENSO-linked droughts. South(ern) Africa typically experiences droughts during the positive phase of ENSO (El Niño), while above-normal rainfall prevails during La Niña. The relationship and co-occurrence of drought and heat waves in southern Africa were first detailed in [41]. Both spatial and temporal correlations of Niño 3.4 and CRU 0.5° maximum temperatures were investigated. The Niño 3.4 index is preferred in this study because it was found that the region (5° N–5° S, 170° W–120° W) where the index is defined is key when it comes to coupled ocean-atmosphere interactions for ENSO [74]. The ENSO signal is strongest over the northern interior and eastern parts of South Africa during DJF, with statistically significant (p < 5%) and positive correlations above 0.6 (Figure 5).
We further investigated the ENSO factor in temperature variability by focusing on the region of greatest impact in the northeast, covering thermal regions C and F. Considering the temporal correlation, strong correlations were observed during 1983, 1991, 1997, and 2015 (Figure 6). These years coincide with strong El Niño induced drought seasons in 1982/83, 1991/92, 1997/98, and 2015/16 (red annotate) which led to severe droughts over South Africa, except for 1997/98 (grey annotate). While 1997/98 was among the strongest El Niño seasons [65], the impacts were not as severe because it coincided with an intense Angola low, which allowed for rain-bearing cloud bands to form [66], averting severe drought. It is for this reason that only the 1982/83, 1991/92, and 2015/16 seasons were selected for synoptic analysis.
The regions with a strong ENSO signal recorded more HW events (Figure 7a) during El Niño seasons (Figure 8). Drought causes the circulation over southern Africa to become predominantly anticyclonic and subsident, resulting in warmer-than-normal conditions [13]. It must be noted that while drought influences HWs, the spatial extent of these two events differs considerably. Droughts are usually widespread and long-lasting, while HWs over South Africa tend to be more localized and of shorter duration, according to the SAWS definition.
The total number of HWs across all stations was the highest (110) during the 2015/16 season, while the 1997/98 season had only 21 events. While rainfall was below normal in all three seasons, what characterized the 2015/16 season were the extremely high temperatures, coinciding with the hottest year since observations began in South Africa in 1860 [75]. The 2015/16 summer also had the highest average duration (i.e., 4.4 days) for the entire 40-year period and an average HW intensity of 37.14 °C. It was found that intense ENSO-induced drought events coincided with high HW frequency over South Africa, such as during 1982/83, 1991/92, and the recent 2015/16 events.
The longest-lasting HWs in each of these seasons were selected for further investigation to understand the nature of circulation patterns inducing extreme heat. The stations that recorded the longest-lasting HWs in each of these seasons were within areas of strong ENSO signals. The longest-lasting HW during the 1982/1983 summer drought was between 17 and 27 February 1983, recorded by the Marico station in thermal region F. The longest-lasting HW during the 1991/1992 summer drought (23 February–2 March 1992) was recorded by Punda Maria station (thermal region C), while Marico also recorded the longest-lasting HW during the recent 2015/2016 summer drought from 28 December 2015 to 9 January 2016.

3.5. Circulations during Heatwaves

3.5.1. 17–27 February 1983 Case

The longest-lasting HW of the 1982/83 drought season lasted for 7 days, from 17–23 February, and was recorded by the Marico station on the interior plateau. The maximum temperatures during this period were significantly above normal (∼+6 °C) in much of the eastern half of the country (Figure 9a), reaching the highest positive anomaly of ~8 °C around Marico and eastern parts of the Free State province.
A middle-level high-pressure system extending over the northern interior of the country was observed (Figure 10a) associated with sinking air masses that warm adiabatically, resulting in clear skies and hot weather (Figure 11b). This was also supported by positive values of the vertical velocity (omega) at 500 hPa (Figure 11a) over most of the central and northern interior. Vertical velocity, also known as omega, is a useful parameter that assists in understanding large-scale atmospheric dynamics. Negative values of the vertical velocity indicate areas where air is ascending, while subsidence is indicated by positive values. The high-tilted southeastwards had decreasing height towards the surface. There was also advection of tropical air toward the northern interior near the surface. Both relative humidity and precipitation anomalies during the HW period were consistent with temperature anomalies showing that the eastern half was not only significantly hot but also very dry (Figure 12a,b).

3.5.2. 23 February–2 March 1992 Case

The ENSO induced drought season of 1991/92 coincided with many HW occurrences, particularly over the eastern interior. The longest-lasting HW during this season was recorded over the northeastern lowveld by the Punda Maria station in the Limpopo Province from 23 February to 2 March 1992. Whilst the western part of South Africa experienced negative temperature anomalies, above-normal temperatures (∼+8 °C) were pronounced over the northern interior of the country, with the northern tip reaching about +10 °C (Figure 9b). Even larger temperature anomalies were observed in the lowveld of neighboring Zimbabwe in the northeast. This event suggests that whilst HW conditions persist in one region of South Africa, cooler weather can also prevail elsewhere.
A high-pressure system in the middle levels was apparent on 23 February 1992, over Namibia, extending towards the northwestern regions of the country and tilting south-eastward with decreasing height (Figure 10a,b). The anticyclonic circulation associated with a localized high near the surface driving continental winds towards the northeast may have triggered the HW occurrence towards Punda Maria and the surroundings. This region was also characterized by positive vertical velocity (Figure 11c), hence little to no clouds were observed (Figure 11d), as shown by the total cloud cover (TCC), with fractions that vary from 0 to 1. The relative humidity anomalies (Figure 11c) showed similar characteristics as the 1982/83 longest-lasting HW; however, the extent of the dry conditions was not as widespread (Figure 12d).

3.5.3. 28 December 2015–9 January 2016 Case

The 2015/16 season had the highest number of HW occurrences (110) over the 40-year study period. The longest-lasting HW event during the entire study period was observed in this drought season with a span of 13 days, i.e., 28 December 2015 to 9 January 2016. This event was also recorded by the Marico station on the northern plateau of the country. Almost the entire country experienced positive temperature anomalies (Figure 9c), with the central interior recording the highest anomalies between 8 and 10 °C. Figure 9c also shows that HW events over South Africa are not independent of the neighboring countries, as the entire subcontinent was experiencing extreme hot conditions. Such is the nature of drought in southern Africa, which tends to be widespread and characterized by high temperatures [41,76].
A large-scale high-pressure system at 500 hPa was observed over Namibia, Botswana, and northern parts of South Africa during this HW event on 28 December 2015 (Figure 10e). This mid-tropospheric anticyclone in this location is typically referred to as the Botswana High [77] and is considered the triggering mechanism for dry spells and drought in southern Africa [13,76]. This high, together with near-surface tropical warm air advection towards the northern interior, may have led to high temperatures over the region. A surface heat low-pressure system was also observed over the central interior of South Africa, driving cyclonic continental horizontal winds towards the north of the country (Figure 10f). The vertical velocity and total cloud cover during this period were consistent (Figure 11e,f); such regions that experience sinking airmasses also had clear skies. Anomalies of relative humidity and precipitation during the 28 December 2015–9 January 2016 HW event were spatially consistent and significantly below normal (Figure 12e,f).

4. Discussion and Conclusions

This study investigated the variability and structure of HW occurrences in South Africa during the summer drought. A 40-year study period (1981–2020) was considered with a background analysis of maximum temperatures across the country. It was found that the country experiences significant spatial differences in temperature patterns, where the northwestern part and the tropical latitudes experience high maximum and minimum temperatures in all seasons, whereas the high-lying areas along the Drakensburg recorded lower values, reaching average minimums of ~13 °C during the austral winter. The highest mean maximum temperatures (>36 °C) over the study period were observed during the DJF season, particularly over much of the Northern Cape province and northeastern lowveld. It was also found that all 24 selected stations experience the hottest months during DJF despite being in different thermal regions [28] and at different elevations. However, whilst the majority experience January peaks, a few stations on the northeast reach a maximum in early summer (December), with a few coastal stations having late summer (February) maxima. This is a most significant finding, as it was previously thought that the whole country experiences a January maximum in daytime surface air temperatures.
When investigating trends in daily extreme temperatures, it was found that all stations indicated a positive trend in hot days per decade over the 40-year period, with ∼83% of selected stations showing a positive significant trend at the 95% level of confidence. Maximum temperature also had a positive correlation with Niño 3.4. Several studies (e.g., [13,78,79]) have established that a positive ENSO phase usually results in below-normal rainfall over South Africa, and this study investigated the occurrence and characteristics of HWs during ENSO-induced droughts. A focus on the most intense ENSO droughts during 1983, 1992, and 2016 revealed clear similarities, with the 2016 event being distinct due to the climate change factor. The year 2016 remains the hottest year since instrumental records began in South Africa in 1860. Previously, it was also found that the 2015/2016 season was characterized by anomalously high temperatures and HW events (e.g., [80,81]). Temperature extremes of this nature exacerbate the intensity of drought events [82,83], and at the time, this 2015/16 drought was also found to be the most intense over southern Africa [84]. Extreme temperatures lead to high evaporation rates, low water levels in surface water bodies, and soil moisture deficits, causing a variety of socio-economic and environmental impacts.
HW occurrences are mainly due to the persistence of a middle-level high-pressure system, which is often located over Botswana and Namibia and commonly referred to as the Botswana High. This Botswana High typically strengthens and is at its most southward position during summer [77], a season where most HWs occur in South Africa. [77] also found that this anticyclone is typically stronger during El Niño events and weaker during La Niña events. Most HW events, which also last longer and are more intense, are observed equatorward, decreasing with latitude. This is consistent with the climatology of maximum temperatures over the 40-year period. While HWs are a common feature of the South African climate, with interior regions experiencing more heatwaves, some regions, such as the southwestern and southern coasts, are less vulnerable to HW occurrences. This can be due to the cooling brought by traveling perturbations such as cold fronts and ridging highs. Most observed HWs in much of the country have an average duration of three days, which is the minimum threshold according to the SAWS definition. Several studies have found increasing trends in HWs in Africa, despite the several definitions that exist in the literature.
Regions that recorded a strong ENSO signal also recorded the most HW occurrences, demonstrating the link between HWs and droughts over the subcontinent, as determined earlier by [41]. Studies in other regions, such as [46] in the United States and [85] in India, suggested substantial increases in the co-occurrence of these events. A case study approach was applied to study selected HWs during South African summer drought seasons, indicating that high pressure systems at 500 hPa together with advection of warm continental and/or tropical air led to high temperatures that triggered the occurrence of HWs. Positive vertical velocities were also observed and associated with clear skies, below-normal relative humidity, and precipitation over the affected regions. Our study contributes to understanding temperature trends and heat wave occurrences during the summer drought in subtropical southern Africa—a region projected to experience rapid warming in the future climate.

Author Contributions

I.L.M. and H.C. conceptualized the study; T.P.M., I.L.M., M.V.S., and T.M. performed the investigation and data analysis; I.L.M., S.M.S.M., and H.C. wrote the initial draft; M.-J.M.B., T.N., T.M., K.K.A., N.G.X., and H.C. revised and edited the manuscript. All authors have read and agreed to the published version of the manuscript.

Funding

This research received no external funding.

Data Availability Statement

The data used in this study was obtained from the South African Weather Service and can be made available upon request. The ERA5 reanalysis data can be obtained online via the web portal (https://climate.copernicus.eu/, accessed on 18 December 2022) while the CRU data was obtained from the University of East Anglia via their online web portal (https://crudata.uea.ac.uk/cru/data/hrg/, accessed on 18 December 2022).

Acknowledgments

Several data sources are recognized for making this study possible. SAWS provided temperature data while other climatological data were obtained from the National Center for Environmental Prediction (NCEP). The Niño 3.4 sea surface temperature (SST) from the National Oceanic-Atmospheric Administration (NOAA) Climate Prediction Center (CPC) was obtained via the Royal Netherlands Meteorological Institute (KNMI) Climate Explorer. The RClimDex (1.0) software package was used to conduct a trend analysis of temperature indices.

Conflicts of Interest

The authors declare no conflict of interest.

References

  1. World Meteorological Organization. State of the Climate in Africa. 2021. Available online: https://library.wmo.int/?lvl=notice_display&id=22125#.Y5xRx3ZBy3A (accessed on 15 December 2022).
  2. Shongwe, M.E.; Van Oldenborgh, G.J.; van den Hurk, B.; Van Aalst, M. Projected Changes in Mean and Extreme Precipitation in Africa under Global Warming. Part II: East Africa. J. Clim. 2011, 24, 3718–3733. [Google Scholar] [CrossRef]
  3. MacKellar, N.; New, M.; Jack, C. Observed and modelled trends in rainfall and temperature for South Africa: 1960–2010. S. Afr. J. Sci. 2014, 110, 13. [Google Scholar] [CrossRef]
  4. Clark, R.T.; Brown, S.J.; Murphy, J.M. Modeling Northern Hemisphere Summer Heat Extreme Changes and Their Uncertainties Using a Physics Ensemble of Climate Sensitivity Experiments. J. Clim. 2006, 19, 4418–4435. [Google Scholar] [CrossRef]
  5. Fischer, E.M.; Schär, C. Consistent geographical patterns of changes in high-impact European heat waves. Nat. Geosci. 2010, 3, 398–403. [Google Scholar] [CrossRef]
  6. IPCC. Climate Change 2021: The Physical Science Basis. Contribution of Working Group I to the Sixth Assessment Report of the Intergovernmental Panel on Climate Change, Masson-Delmotte, V., Zhai, P., Pirani, A., Connors, S., Péan, C., Berger, S., Caud, N., Chen, Y., Goldfarb, L., Gomis, M., et al., Eds.; Cambridge University Press: Cambridge, UK; New York, NY, USA, In press.
  7. Robinson, A.; Lehmann, J.; Barriopedro, D.; Rahmstorf, S.; Coumou, D. Increasing heat and rainfall extremes now far outside the historical climate. npj Clim. Atmospheric Sci. 2021, 4, 45. [Google Scholar] [CrossRef]
  8. Ryan, S.J.; Lippi, C.A.; Zermoglio, F. Shifting transmission risk for malaria in Africa with climate change: A framework for planning and intervention. Malar. J. 2020, 19, 170. [Google Scholar] [CrossRef]
  9. IPCC. Managing the Risks of Extreme Events and Disasters to Advance Climate Change Adaptation. A Special Report of Working Groups I and II of the Intergovernmental Panel on Climate Change; Field, C.B., Barros, V., Stocker, T., Qin, D., Dokken, D., Ebi, K., Mastrandrea, M., Mach, K., Plattner, G.-K., Allen, S., et al., Eds.; Cambridge University Press: Cambridge, UK; New York, NY, USA, 2012; 582p. [Google Scholar]
  10. Pörtner, H.O.; Roberts, D.C.; Adams, H.; Adler, C.; Aldunce, P.; Ali, E.; Begum, R.A.; Betts, R.; Kerr, R.B.; Biesbroek, R.; et al. Climate change 2022: Impacts, adaptation and vulnerability; IPCC: Geneva, Switzerland, 2022; p. 3056. [Google Scholar]
  11. Schiermeier, Q. Droughts, heatwaves and floods: How to tell when climate change is to blame. Nature 2018, 560, 20–22. [Google Scholar] [CrossRef]
  12. Mbokodo, I.; Bopape, M.-J.; Chikoore, H.; Engelbrecht, F.; Nethengwe, N. Heatwaves in the Future Warmer Climate of South Africa. Atmosphere 2020, 11, 712. [Google Scholar] [CrossRef]
  13. Chikoore, H.; Jury, M.R. South African drought, deconstructed. Weather. Clim. Extremes 2021, 33, 100334. [Google Scholar] [CrossRef]
  14. Lukamba, M.T. Natural disasters in African countries: What can we learn about them? J. Transdiscipl. Res. South. Afr. 2010, 6, 478–495. Available online: https://hdl.handle.net/10520/EJC111907 (accessed on 23 November 2022). [CrossRef] [Green Version]
  15. Solomon, S.; Qin, D.; Manning, M.; Averyt, K.; Marquis, M. (Eds.) Climate Change 2007—The Physical Science Basis: Working Group I Contribution to the Fourth Assessment Report of the IPCC (Vol. 4); Cambridge University Press: Cambridge, UK; New York, NY, USA, 2007. [Google Scholar]
  16. Engelbrecht, F.; Adegoke, J.; Bopape, M.-J.; Naidoo, M.; Garland, R.; Thatcher, M.; McGregor, J.; Katzfey, J.; Werner, M.; Ichoku, C.; et al. Projections of rapidly rising surface temperatures over Africa under low mitigation. Environ. Res. Lett. 2015, 10, 085004. [Google Scholar] [CrossRef]
  17. Kruger, A.; Nxumalo, M. Historical rainfall trends in South Africa: 1921–2015. Water SA 2017, 43, 285–297. [Google Scholar] [CrossRef]
  18. van der Walt, A.J.; Fitchett, J.M. Exploring extreme warm temperature trends in South Africa: 1960–2016. Theor. Appl. Clim. 2021, 143, 1341–1360. [Google Scholar] [CrossRef]
  19. NASA. 2021 Continued Earth’s Warming Trend. 2022. Available online: https://earthobservatory.nasa.gov/images/149321/2021-continued-earths-warming-trend (accessed on 12 December 2022).
  20. Jones, P.D. Hemispheric Surface Air Temperature Variations: A Reanalysis and an Update to 1993. J. Clim. 1994, 7, 1794–1802. [Google Scholar] [CrossRef]
  21. Easterling, D.R.; Horton, B.; Jones, P.D.; Peterson, T.C.; Karl, T.R.; Parker, D.E.; Salinger, M.J.; Razuvayev, V.; Plummer, N.; Jamason, P.; et al. Maximum and minimum temperature trends for the globe. Science 1997, 277, 364–367. [Google Scholar] [CrossRef]
  22. Hulme, M.; Doherty, R.; Ngara, T.; New, M.; Lister, D. African climate change: 1900-2100. Clim. Res. 2001, 17, 145–168. [Google Scholar] [CrossRef]
  23. Makowski, K.; Wild, M.; Ohmura, A. Diurnal temperature range over Europe between 1950 and 2005. Atmospheric Meas. Tech. 2008, 8, 6483–6498. [Google Scholar] [CrossRef]
  24. New, M.; Hewitson, B.; Stephenson, D.B.; Tsiga, A.; Kruger, A.; Manhique, A.; Gomez, B.; Coelho, C.A.S.; Masisi, D.N.; Kululanga, E.; et al. Evidence of trends in daily climate extremes over southern and west Africa. J. Geophys. Res. Atmos. 2006, 111, D14102. [Google Scholar] [CrossRef]
  25. Karl, T.R.; Jones, P.D.; Knight, R.W.; Kukla, G.; Plummer, N.; Razuvayev, V.; Gallo, K.P.; Lindseay, J.; Charlson, R.J.; Peterson, T.C. Asymmetric Trends of Daily Maximum and Minimum Temperature. Papers in Natural Resources, p. 185. 1993. Available online: https://digitalcommons.unl.edu/natrespapers/185?utm_source=digitalcommons.unl.edu%2Fnatrespapers%2F185&utm_medium=PDF&utm_campaign=PDFCoverPages (accessed on 23 November 2022).
  26. Muhlenbruch-Tegen, A. Long-term surface temperature variations in South Africa. South Afr. J. Sci. 1992, 88, 197–205. [Google Scholar]
  27. Kruger, A.C.; Shongwe, S. Temperature trends in South Africa: 1960-2003. Int. J. Clim. 2004, 24, 1929–1945. [Google Scholar] [CrossRef]
  28. Kruger, A.C.; Sekele, S.S. Trends in extreme temperature indices in South Africa: 1962-2009. Int. J. Clim. 2012, 33, 661–676. [Google Scholar] [CrossRef]
  29. Zuo, J.; Pullen, S.; Palmer, J.; Bennetts, H.; Chileshe, N.; Ma, T. Impacts of heat waves and corresponding measures: A review. J. Clean. Prod. 2015, 92, 1–12. [Google Scholar] [CrossRef]
  30. Bi, P.; Williams, S.; Loughnan, M.; Lloyd, G.; Hansen, A.; Kjellstrom, T.; Dear, K.; Saniotis, A. The Effects of Extreme Heat on Human Mortality and Morbidity in Australia: Implications for Public Health. Asia Pac. J. Public Health 2011, 23 (Suppl. S2), 27S–36S. [Google Scholar] [CrossRef] [PubMed]
  31. Peng, R.D.; Bobb, J.F.; Tebaldi, C.; McDaniel, L.; Bell, M.; Dominici, F. Toward a Quantitative Estimate of Future Heat Wave Mortality under Global Climate Change. Environ. Health Perspect. 2011, 119, 701–706. [Google Scholar] [CrossRef]
  32. Meehl, G.A.; Tebaldi, C. More Intense, More Frequent, and Longer Lasting Heat Waves in the 21st Century. Science 2004, 305, 994–997. [Google Scholar] [CrossRef] [PubMed]
  33. Cowan, T.; Purich, A.; Perkins-Kirkpatrick, S.; Pezza, A.; Boschat, G.; Sadler, K. More Frequent, Longer, and Hotter Heat Waves for Australia in the Twenty-First Century. J. Clim. 2014, 27, 5851–5871. [Google Scholar] [CrossRef]
  34. Chang, F.-C.; Wallace, J.M. Meteorological Conditions during Heat Waves and Droughts in the United States Great Plains. Mon. Weather. Rev. 1987, 115, 1253–1269. [Google Scholar] [CrossRef]
  35. McKee, T.B.; Doesken, N.J.; Kliest, J. The relationship of drought frequency and duration to time scales. In Proceedings of the 8th Conference of Applied Climatology, Anaheim, CA, USA, 17–22 January 1993; American Meteorological Society: Boston, MA, USA; pp. 179–184. [Google Scholar]
  36. Nembilwi, N.; Chikoore, H.; Kori, E.; Munyai, R.; Manyanya, T. The Occurrence of Drought in Mopani District Municipality, South Africa: Impacts, Vulnerability and Adaptation. Climate 2021, 9, 61. [Google Scholar] [CrossRef]
  37. Thomas, D.S.K.; Wilhelmi, O.V.; Finnessey, T.N.; Deheza, V. A comprehensive framework for tourism and recreation drought vulnerability reduction. Environ. Res. Lett. 2013, 8, 044004. [Google Scholar] [CrossRef]
  38. Albright, T.P.; Pidgeon, A.M.; Rittenhouse, C.D.; Clayton, M.K.; Wardlow, B.D.; Flather, C.H.; Culbert, P.D.; Radeloff, V.C. Combined effects of heat waves and droughts on avian communities across the conterminous United States. Ecosphere 2010, 1, 12–22. [Google Scholar] [CrossRef]
  39. Trenberth, K.E.; Shea, D.J. Relationships between precipitation and surface temperature. Geophys. Res. Lett. 2005, 32. [Google Scholar] [CrossRef]
  40. Fischer, E.M.; Seneviratne, S.I.; Lüthi, D.; Schär, C. Contribution of land-atmosphere coupling to recent European summer heat waves. Geophys. Res. Lett. 2007, 34. [Google Scholar] [CrossRef]
  41. Lyon, B. Southern Africa Summer Drought and Heat Waves: Observations and Coupled Model Behavior. J. Clim. 2009, 22, 6033–6046. [Google Scholar] [CrossRef]
  42. Rouault, M.; Richard, Y. Intensity and spatial extension of drought in South Africa at different time scales. Water SA 2004, 29, 489–500. [Google Scholar] [CrossRef]
  43. Rouault, M. Intensity and spatial extent of droughts in southern Africa. Geophys. Res. Lett. 2005, 32. [Google Scholar] [CrossRef]
  44. Beniston, M. Climatic Change in Mountain Regions: A Review of Possible Impacts. In Climate Variability and Change in High Elevation Regions: Past, Present & Future; Diaz, H.F., Beniston, M., Bradley, R.S., Eds.; Springer Netherlands: Dordrecht, The Netherlands, 2003; Volume 15, pp. 5–31. [Google Scholar] [CrossRef]
  45. Basara, J.; Basara, H.G.; Illston, B.G.; Crawford, K.C. The Impact of the Urban Heat Island during an Intense Heat Wave in Oklahoma City. Adv. Meteorol. 2010, 2010, 230365. [Google Scholar] [CrossRef]
  46. Mazdiyasni, O.; AghaKouchak, A. Substantial increase in concurrent droughts and heatwaves in the United States. Proc. Natl. Acad. Sci. USA 2015, 112, 11484–11489. [Google Scholar] [CrossRef]
  47. Sutanto, F.; Konstantinidou, M.; Dömling, A. Covalent inhibitors: A rational approach to drug discovery. RSC Med. Chem. 2020, 11, 876–884. [Google Scholar] [CrossRef] [PubMed]
  48. Libonati, R.; Geirinhas, J.L.; Silva, P.S.; Russo, A.; A Rodrigues, J.; Belém, L.B.C.; Nogueira, J.; O Roque, F.; DaCamara, C.C.; Nunes, A.M.B.; et al. Assessing the role of compound drought and heatwave events on unprecedented 2020 wildfires in the Pantanal. Environ. Res. Lett. 2022, 17, 015005. [Google Scholar] [CrossRef]
  49. Mechler, R.; Bouwer, L.M. Understanding trends and projections of disaster losses and climate change: Is vulnerability the missing link? Clim. Chang. 2014, 133, 23–35. [Google Scholar] [CrossRef]
  50. Kopp, R.; Easterling, D.; Hall, T.; Hayhoe, K.; Horton, R.; Kunkel, K.; LeGrande, A. Chapter 15: Potential Surprises: Compound Extremes and Tipping Elements. In Climate Science Special Report: Fourth National Climate Assessment; U.S. Global Change Research Program: Washington, DC, USA, 2017; Volume I, pp. 1–470. [Google Scholar] [CrossRef]
  51. Zscheischler, J.; Westra, S.; Van Den Hurk, B.J.J.M.; Seneviratne, S.I.; Ward, P.J.; Pitman, A.; AghaKouchak, A.; Bresch, D.N.; Leonard, M.; Wahl, T.; et al. Future climate risk from compound events. Nat. Clim. Chang. 2018, 8, 469–477. [Google Scholar] [CrossRef]
  52. Archer, E.; Engelbrecht, F.; Landman, W.; Le Roux, A.; van Huyssteen, E.; Fatti, C.; Vogel, C.; Aloom, I.; Maserumule, R.; Colvin, C.; et al. South African Risk and Vulnerability Atlas, CSIR and DST, Pretoria. 2010. Available online: http://hdl.handle.net/10204/4974 (accessed on 23 November 2022).
  53. Zhang, X.; Yang, F. RClimDex (1.0), User Manual, Climate Research Branch, Environment Canada, Downsview, Ontario, Canada. 2004. Available online: http://cccma.seos.uvic.ca/ETCCDMI (accessed on 20 November 2022).
  54. Kruger, A.C.; Rautenbach, H.; Mbatha, S.; Ngwenya, S.; Makgoale, T.E. Historical and projected trends in near-surface temperature indices for 22 locations in South Africa. South Afr. J. Sci. 2019, 115, 1–9. [Google Scholar] [CrossRef] [PubMed]
  55. Mulovhedzi, P.T. Towards a Heat-Watch Warning System for South Africa for the Benefit of the Health Sector. Ph.D. Thesis, University of Pretoria, Pretoria, South Africa, 2017. Available online: http://hdl.handle.net/2263/65921 (accessed on 23 November 2022).
  56. Saji, N.H.; Goswami, B.N.; Vinayachandran, P.N.; Yamagata, T. A dipole mode in the tropical Indian Ocean. Nature 1999, 401, 360–363. [Google Scholar] [CrossRef] [PubMed]
  57. Manatsa, D.; Chingombe, W.; Matarira, C.H. The impact of the positive Indian Ocean dipole on Zimbabwe droughts. Int. J. Clim. 2008, 28, 2011–2029. [Google Scholar] [CrossRef]
  58. Reason, C.J.C. Subtropical Indian Ocean SST dipole events and southern African rainfall. Geophys. Res. Lett. 2001, 28, 2225–2227. [Google Scholar] [CrossRef]
  59. Hoell, A.; Funk, C.; Zinke, J.; Harrison, L. Modulation of the Southern Africa precipitation response to the El Niño Southern Oscillation by the subtropical Indian Ocean Dipole. Clim. Dyn. 2016, 48, 2529–2540. [Google Scholar] [CrossRef]
  60. Jury, M.R.; Mc Queen, C.; Levey, K. SOI and QBO signals in the African region. Theor. Appl. Clim. 1994, 50, 103–115. [Google Scholar] [CrossRef]
  61. Simpson, I.R.; Hitchcock, P.; Shepherd, T.G.; Scinocca, J.F. Stratospheric variability and tropospheric annular-mode timescales. Geophys. Res. Lett. 2011, 38. [Google Scholar] [CrossRef]
  62. Fogt, R.L.; Marshall, G.J. The Southern Annular Mode: Variability, trends, and climate impacts across the Southern Hemisphere. WIREs Clim. Chang. 2020, 11, e652. [Google Scholar] [CrossRef]
  63. Ibebuchi, C. On the Relationship between Circulation Patterns, the Southern Annular Mode, and Rainfall Variability in Western Cape. Atmosphere 2021, 12, 753. [Google Scholar] [CrossRef]
  64. Chikoore, H.; Bopape, M.-J.M.; Ndarana, T.; Muofhe, T.P.; Gijben, M.; Munyai, R.B.; Manyanya, T.C.; Maisha, R. Synoptic structure of a sub-daily extreme precipitation and flood event in Thohoyandou, north-eastern South Africa. Weather. Clim. Extremes 2021, 33, 100327. [Google Scholar] [CrossRef]
  65. Dong, X.; He, C. Zonal displacement of the Western North Pacific subtropical high from early to late summer. Int. J. Clim. 2020, 40, 5029–5041. [Google Scholar] [CrossRef]
  66. Reason, C.J.C.; Jagadheesha, D. A model investigation of recent ENSO impacts over southern Africa. Meteorol. Atmospheric Phys. 2005, 89, 181–205. [Google Scholar] [CrossRef]
  67. Hersbach, H.; Bell, B.; Berrisford, P.; Hirahara, S.; Horanyi, A.; Muñoz-Sabater, J.; Nicolas, J.; Peubey, C.; Radu, R.; Schepers, D.; et al. The ERA5 global reanalysis. Q. J. R. Meteorol. Soc. 2020, 146, 1999–2049. [Google Scholar] [CrossRef]
  68. Harris, I.; Osborn, T.J.; Jones, P.; Lister, D. Version 4 of the CRU TS monthly high-resolution gridded multivariate climate dataset. Sci. Data 2020, 7, 109. [Google Scholar] [CrossRef] [PubMed]
  69. Finch, J.M.; Meadows, M.E. South African biomes and their changes over time. In The Geography of South Africa; Springer: Cham, Switzerland, 2019; pp. 57–69. [Google Scholar] [CrossRef]
  70. Stander, J.H.; Dyson, L.; Engelbrecht, C.J. snow forecasting decision tree for significant snowfall over the interior of South Africa. South Afr. J. Sci. 2016, 112, 1–10. [Google Scholar] [CrossRef]
  71. van Wilgen, N.J.; Goodall, V.; Holness, S.; Chown, S.L.; McGeoch, M.A. Rising temperatures and changing rainfall patterns in South Africa’s national parks. Int. J. Clim. 2015, 36, 706–721. [Google Scholar] [CrossRef]
  72. Ncongwane, K.P.; Botai, J.O.; Sivakumar, V.; Botai, C.M.; Adeola, A.M. Characteristics and Long-Term Trends of Heat Stress for South Africa. Sustainability 2021, 13, 13249. [Google Scholar] [CrossRef]
  73. Tyson, P.D.; Preston-Whyte, R.A. Weather and Climate of Southern Africa; Oxford University Press: Oxford, UK, 2000. [Google Scholar]
  74. Trenberth, K.E. The definition of El Niño. Bull. Am. Meteorol. Soc. 1997, 78, 2771–2778. [Google Scholar] [CrossRef]
  75. SAWS. South African Weather Service. 2022. Annual State of the Climate of South Africa 2021. Pretoria. South Africa. Available online: https://www.weathersa.co.za/Documents/Corporate/Annual%20State%20of%20the%20Climate%202021_04042022114230.pdf (accessed on 23 November 2022).
  76. Chikoore, H. Drought in Southern Africa: Structure, Characteristics and Impacts. Ph.D. Thesis, University of Zululand, Richards Bay, South Africa, 2017. Available online: http://hdl.handle.net/10530/1547 (accessed on 23 November 2022).
  77. Driver, P.; Reason, C.J.C. Variability in the Botswana High and its relationships with rainfall and temperature characteristics over southern Africa. Int. J. Clim. 2017, 37, 570–581. [Google Scholar] [CrossRef]
  78. Philippon, N.; Rouault, M.; Richard, Y.; Favre, A. The influence of ENSO on winter rainfall in South Africa. Int. J. Clim. 2011, 32, 2333–2347. [Google Scholar] [CrossRef]
  79. Dieppois, B.; Rouault, M.; New, M. The impact of ENSO on Southern African rainfall in CMIP5 ocean atmosphere coupled climate models. Clim. Dyn. 2015, 45, 2425–2442. [Google Scholar] [CrossRef]
  80. Malherbe, J.; Durand, W. How would current advice benefit maize farmers with respect to historical associations with El Niño events? In Proceedings of the 32nd Annual Conference of the South African Society for Atmospheric Sciences, Potchefstroom, South Africa, 31 October–1 November 2016; ISBN 978-0-620-72974-1. [Google Scholar]
  81. Engelbrecht, C.E. Exploring sub seasonal dynamic predictability of extreme events: A case study of the January and February 2016 heat waves. In Proceedings of the 34th Annual Conference of the South African Society for Atmospheric Sciences, Ballito, South African, 20–21 September 2018; ISBN 978-0-620-80825-5. [Google Scholar]
  82. Yuan, Z.; Xu, J.; Chen, J.; Huo, J.; Yu, Y.; Locher, P.; Xu, B. Drought Assessment and Projection under Climate Change: A Case Study in the Middle and Lower Jinsha River Basin. Adv. Meteorol. 2017, 2017, 5757238. [Google Scholar] [CrossRef]
  83. Malherbe, J.; Smit, I.P.; Wessels, K.J.; Beukes, P.J. Recent droughts in the Kruger National Park as reflected in the extreme climate index. Afr. J. Range Forage Sci. 2020, 37, 1–17. [Google Scholar] [CrossRef]
  84. Blamey, R.C.; Kolusu, S.R.; Mahlalela, P.; Todd, M.C.; Reason, C.J.C. The role of regional circulation features in regulating El Niño climate impacts over southern Africa: A comparison of the 2015/2016 drought with previous events. Int. J. Clim. 2018, 38, 4276–4295. [Google Scholar] [CrossRef]
  85. Sharma, S.; Mujumdar, P. Increasing frequency and spatial extent of concurrent meteorological droughts and heatwaves in India. Sci. Rep. 2017, 7, 15582. [Google Scholar] [CrossRef] [PubMed] [Green Version]
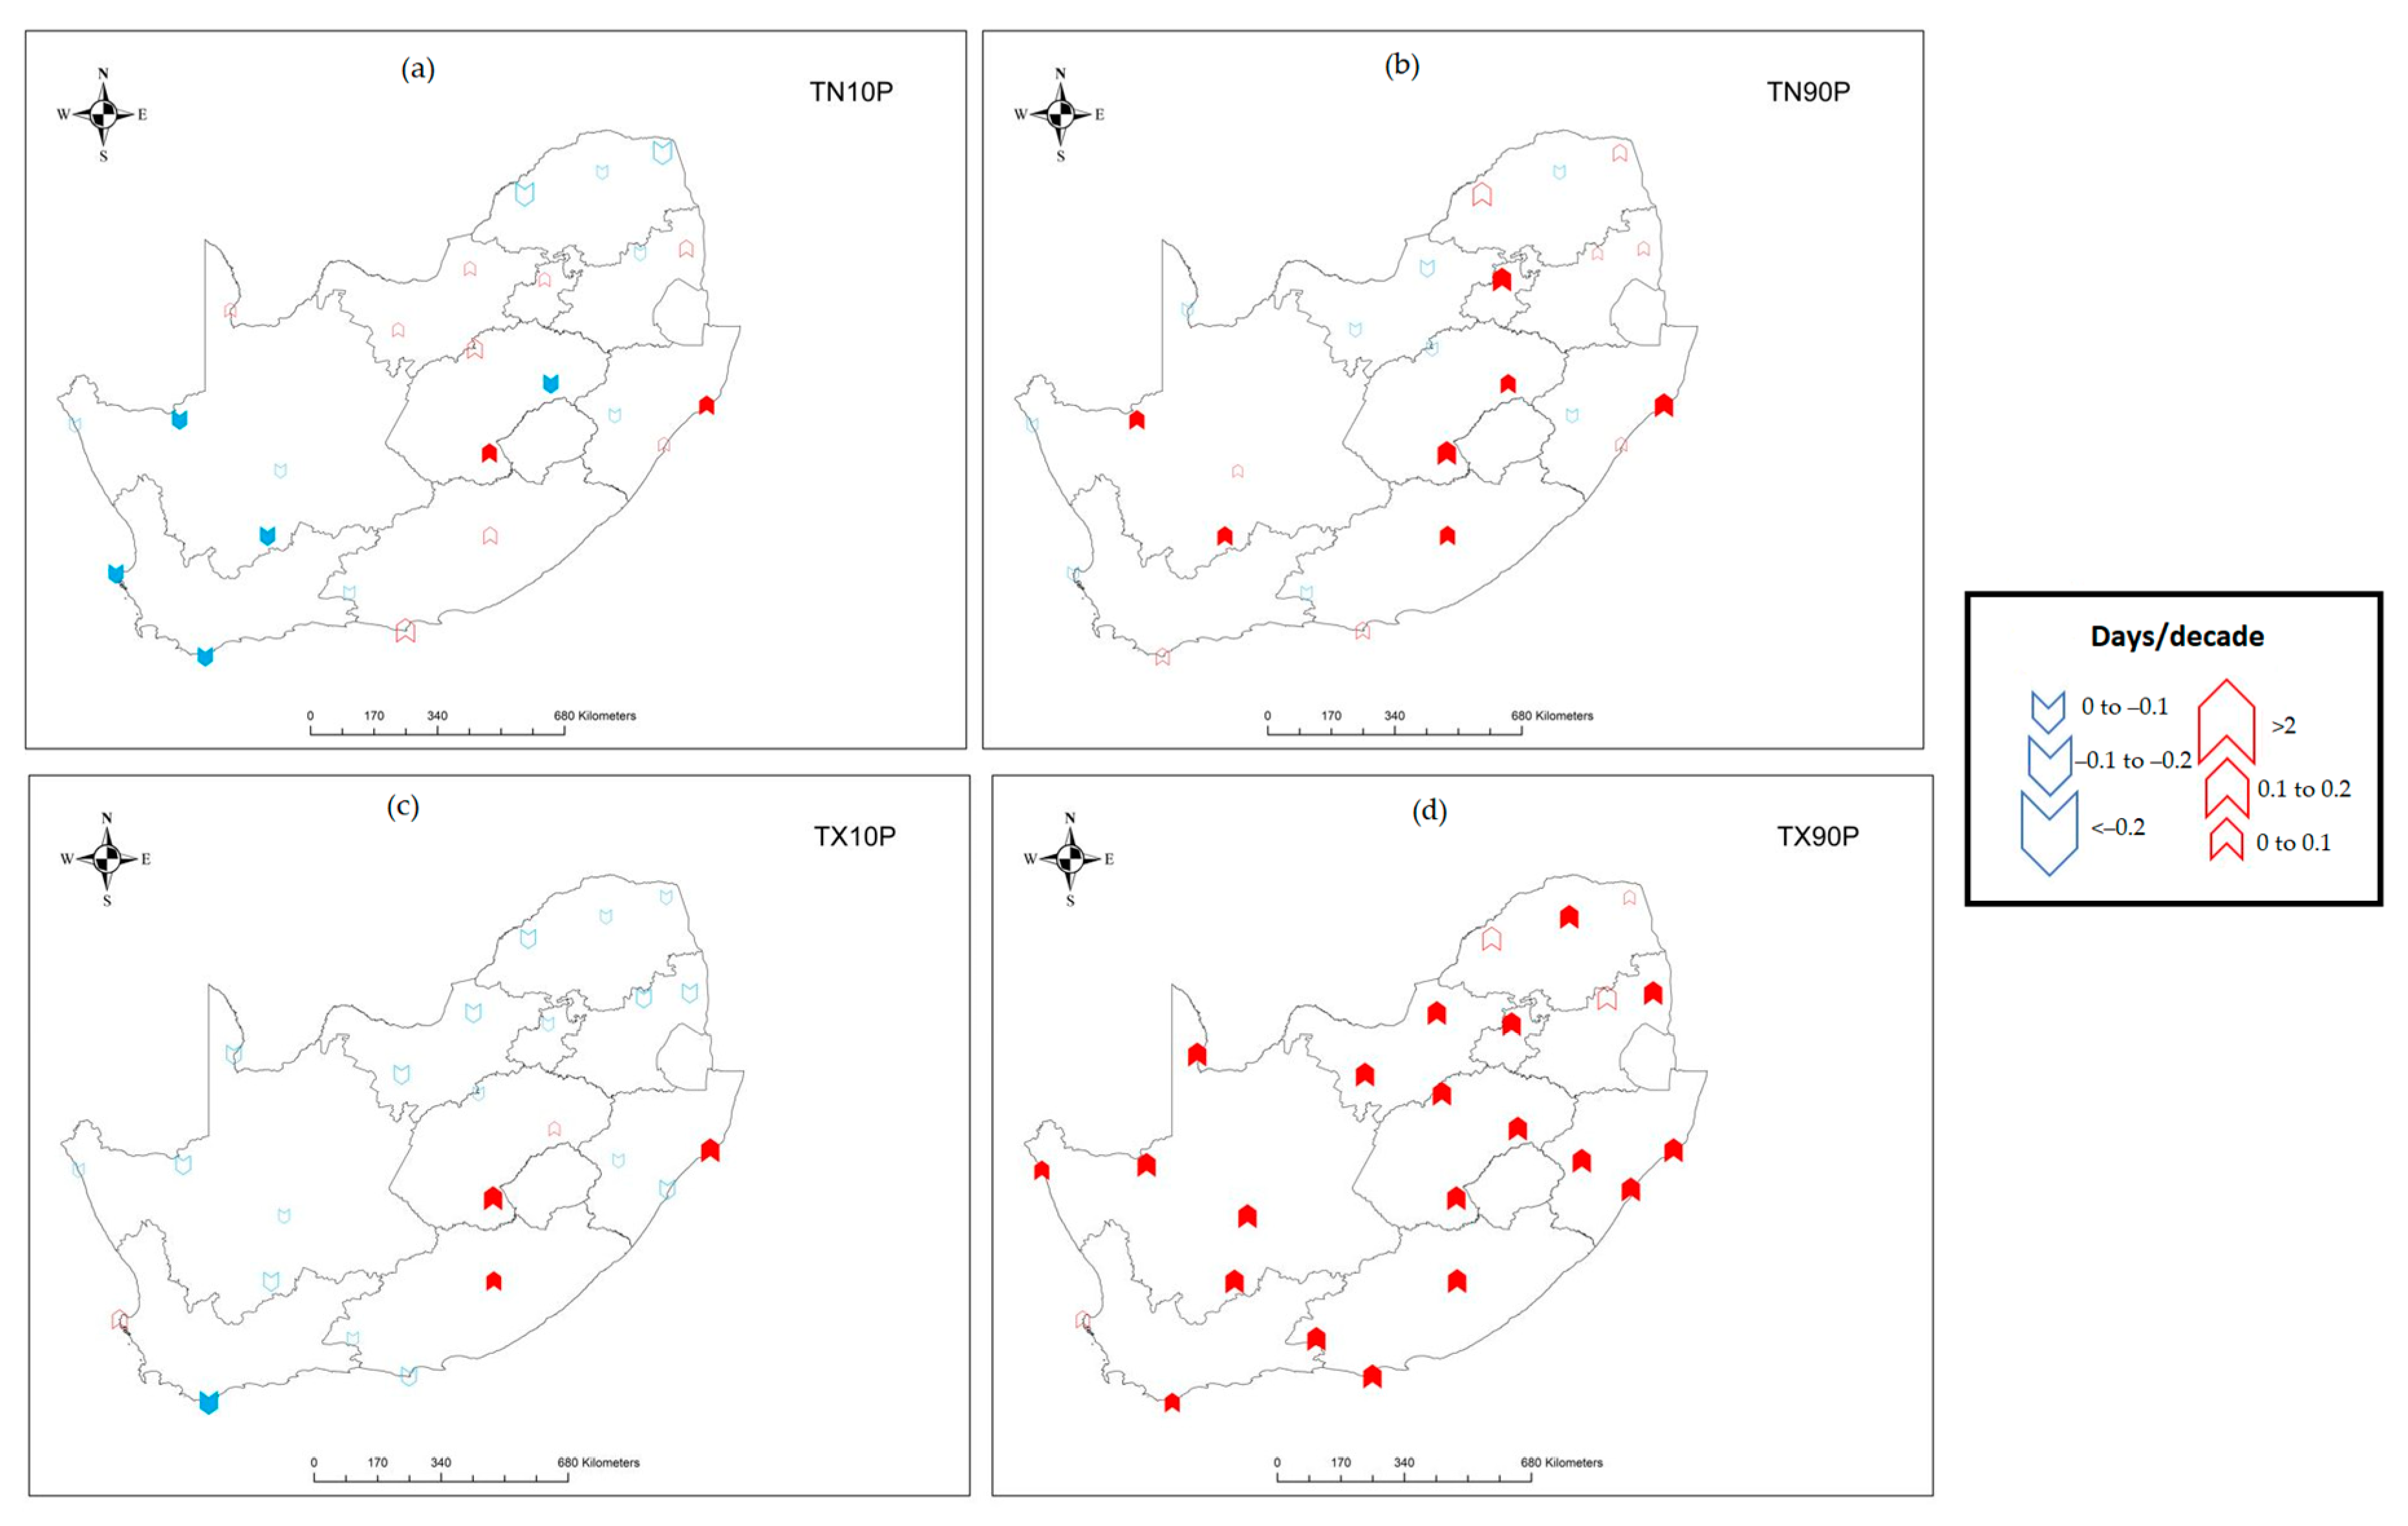
Figure 1. Topographical map of South Africa showing thermal regions and SAWS point station names (in black) with at least 95% data availability from 1981 to 2020 (after [27]). The abbreviations in yellow represent provincial names: Western Cape (WC), Northern Cape (NC), Eastern Cape (EC), Free State (FS), KwaZulu-Natal (KZN), North West (NW), Gauteng (GP), Mpumalanga (MP), and Limpopo (LIM).
Climate 11 00038 g001
Figure 2. The seasonal mean maximum temperatures (°C) from 1981 to 2020 in South Africa for (a) DJF, (b) MAM, (c) JJA, and (d) SON.
Climate 11 00038 g002
Figure 3. Temperature trends for (a) TN10P, (b) TN90P, (c) TX10P, and (d) TX90P for selected stations from 1981 to 2020 (bold arrows indicates significance at the 95% level of confidence).
Climate 11 00038 g003
Figure 4. Monthly totals of HW frequency (red line) over South Africa from 1981 to 2020 from the 24 selected stations. The peak in January is clearly discernible.
Climate 11 00038 g004
Figure 5. Seasonal correlation of the December–February (Dec–Feb) Niño 3.4 sea surface temperature and maximum temperature at a 95% significance level over South Africa from 1981 to 2020.
Climate 11 00038 g005
Figure 6. Austral summer, December–February (Dec–Feb), correlation of the Niño 3.4 sea surface temperature and maximum temperature over South Africa from 1981 to 2020.
Climate 11 00038 g006
Figure 7. Seasonal variability of (a) HW frequency (red line), (b) average duration (red line, days), and (c) average intensity (red line, °C) over South Africa from 1981 to 2020 from all 24 selected stations. The shades of red and gray represent intense El Niño seasons of 1982/83 (red), 1991/92 (red), 1997/98 (gray) and 2015/16 (red).
Climate 11 00038 g007
Figure 8. Seasonal cycles of Niño 3.4 from 1981 to 2020. The SST Anomalies were normalized to 1981–2010. The shades of red and gray represent intense El Niño seasons of 1982/83 (red), 1991/92 (red), 1997/98 (gray) and 2015/16 (red).
Climate 11 00038 g008
Figure 9. Temperature anomalies for the (a) 17–27 February (Feb) 1983 HW, (b) 23 February (Feb) 1991 to 2 March 1992 HW, and (c) 28 December 2015–9 January (Jan) 2016 HW.
Climate 11 00038 g009
Figure 10. Geopotential height (GPH) x 10m and vector winds (m/s) at 500 hPa for the (a) 17–27 February 1983 HW, (b) 23 February 1991 to 2 March 1992 HW, and (c) 28 December 2015–9 January 2016 HW; and at 850 hPa for the (d) 17–27 February 1983 HW, (e) 1991 to 2 March 1992 HW, and (f) 28 December 2015–9 January 2016 HW. The arrows represent wind direction and strength.
Climate 11 00038 g010
Figure 11. Vertical velocity (Pa/s) at 500 hPa for the (a) 17–27 February 1983 HW, (b) 23 February 1991 to 2 March 1992 HW, and (c) 28 December 2015–9 January 2016 HW; and total cloud cover (TCC) for the (d) 17–27 February 1983 HW, (e) 1991 to 2 March 1992 HW, and (f) 28 December 2015–9 January 2016 HW.
Climate 11 00038 g011
Figure 12. Relative humidity (RH) anomalies (%) at 500 hPa for the (a) 17–27 February (Feb) 1983 HW, (b) 23 February (Feb) 1991 to 2 March 1992 HW, and (c) 28 December (Dec) 2015–9 January (Jan) 2016 HW; and precipitation anomalies (mm) for the (d) 17–27 February (Feb) 1983 HW, (e) 1991 to 2 March 1992 HW, and (f) 28 December (Dec) 2015–9 January (Jan) 2016 HW.
Climate 11 00038 g012
Table 1. List of relevant ETCCDI indices utilized in this study.
IndexDescriptionUnits
TN10PAnnual number of days when TN < 10th percentiledays
TN90PAnnual number of days when TN > 90th percentiledays
TX10PAnnual number of days when TX < 10th percentiledays
TX90PAnnual number of days when TX > 90th percentiledays
Table 2. Hottest month per station and its average maximum temperatures.
Station NameHottest MonthAverage TX (°C)
BethlehemJanuary26.53
BothavilleJanuary30.67
Cape AgulhasJanuary24.46
Cape ColumbineFebruary21.96
Cape St. FrancisJanuary23.00
EscourtJanuary27.96
FraserburgJanuary31.47
LephalaleFebruary32.65
LydenburgJanuary26.25
MaraJanuary30.58
MaricoJanuary31.37
Mount EdgecombeFebruary28.05
PofadderJanuary34.08
Port NollothFebruary20.71
PretoriaFebruary28.84
Punda MariaDecember32.30
QueenstownJanuary28.91
Richards BayFebruary29.23
SkukuzaFebruary32.57
Twee RivierenJanuary36.58
VanwyksvleiJanuary35.32
VryburgDecember31.94
WepenerJanuary30.28
WillowmoreJanuary30.22
Table 3. The monthly HW frequency from 1981–2020 from the 24 selected stations.
Thermal Region (Cluster)Station Name1981–2020 Heatwave Frequency
JulyAugustSeptemberOctoberNovemberDecemberJanuaryFebruaryMarchAprilMayJune
ACape Agulhas000000000000
Cape Columbine002113422710
Port Nolloth22146410015161817
BCape St. Francis100000101052
Mount Edgecombe000000000000
Richards bay000010231100
CPunda Maria0111316211043000
Skukuza0068613836000
DFraserburg0000029130000
Pofadder000010600000
Twee Rivieren000037820000
Vanwyksvlei000001710000
Bethlehem000146740000
Willowmore00034613112000
EEscourt00571291330100
Queenstown0003346104000
Wepener000002911000
FBothaville00068131491000
Lephalale0026109673000
Lydenburg002330000000
Mara006171312964000
Marico0009181219142000
Pretoria0008105761000
Vryburg00044151480000
Table 4. The monthly HW average duration from 1981–2020 from the 24 selected stations.
Thermal Region (Cluster)Station Name1981–2020 Heatwave Average Duration (Days)
JulyAugustSeptemberOctoberNovemberDecemberJanuaryFebruaryMarchAprilMayJune
ACape Agulhas0.00.00.00.00.00.00.00.00.00.00.00.0
Cape Columbine0.00.03.54.03.03.04.03.33.53.93.00.0
Port Nolloth4.13.43.33.03.00.00.03.03.63.63.43.6
BCape St. Francis3.00.00.00.00.00.03.00.03.03.03.03.0
Mount Edgecombe0.00.00.00.00.00.00.00.00.00.00.00.0
Richards bay0.00.00.00.03.00.03.04.06.04.00.00.0
CPunda Maria0.03.03.03.43.83.43.23.83.00.00.00.0
Skukuza0.00.03.33.63.93.33.44.03.30.00.00.0
DFraserburg0.00.00.00.00.03.03.43.00.00.00.00.0
Pofadder0.00.00.00.03.00.03.30.00.00.00.00.0
Twee Rivieren0.00.00.00.03.33.34.63.00.00.00.00.0
Vanwyksvlei0.00.00.00.00.03.03.33.00.00.00.00.0
Bethlehem0.00.00.04.05.04.53.33.50.00.00.00.0
Willowmore0.00.00.03.53.03.33.63.53.00.00.00.0
EEscourt0.00.03.03.34.13.63.73.00.03.00.00.0
Queenstown0.00.00.03.03.33.33.94.23.00.00.00.0
Wepener0.00.00.00.00.06.04.13.03.00.00.00.0
FBothaville0.00.00.04.33.74.34.83.93.00.00.00.0
Lephalale0.00.03.04.04.33.44.74.14.00.00.00.0
Lydenburg0.00.03.03.03.00.00.00.00.00.00.00.0
Mara0.00.03.33.43.63.73.83.03.30.00.00.0
Marico0.00.00.04.94.33.94.44.43.00.00.00.0
Pretoria0.00.00.05.84.66.04.25.94.00.00.00.0
Vryburg0.00.00.06.04.04.44.73.50.00.00.00.0
Table 5. The monthly HW average intensity from 1981–2020 from the 24 selected stations.
Thermal Region (Cluster)Station Name1981 - 2020 Heatwave Average Intensity (Average Maximum Temperature °C)
JulyAugustSeptemberOctoberNovemberDecemberJanuaryFebruaryMarchAprilMayJune
ACape Agulhas0.00.00.00.00.00.00.00.00.00.00.00.0
Cape Columbine0.00.029.830.429.831.431.329.630.630.528.60.0
Port Nolloth29.830.632.331.234.70.00.028.233.033.131.329.6
BCape St. Francis30.80.00.00.00.00.028.20.030.731.032.229.6
Mount Edgecombe0.00.00.00.00.00.00.00.00.00.00.00.0
Richards bay0.00.00.00.036.50.036.235.935.335.00.00.0
CPunda Maria0.038.639.439.239.639.138.939.338.70.00.00.0
Skukuza0.00.039.640.039.940.239.640.939.00.00.00.0
DFraserburg0.00.00.00.00.038.738.338.00.00.00.00.0
Pofadder0.00.00.00.039.40.040.50.00.00.00.00.0
Twee Rivieren0.00.00.00.043.042.942.90.00.00.00.00.0
Vanwyksvlei0.00.00.00.00.041.141.941.50.00.00.00.0
Bethlehem0.00.00.032.332.933.333.132.70.00.00.00.0
Willowmore0.00.00.036.637.537.637.937.036.40.00.00.0
EEscourt0.00.034.035.035.234.935.034.20.033.70.00.0
Queenstown0.00.00.035.536.436.836.936.136.30.00.00.0
Wepener0.00.00.00.00.036.437.037.135.90.00.00.0
FBothaville0.00.00.036.336.637.336.936.736.90.00.00.0
Lephalale0.00.038.939.339.639.239.540.139.50.00.00.0
Lydenburg0.00.032.632.832.40.00.00.00.00.00.00.0
Mara0.00.037.137.837.737.437.238.436.60.00.00.0
Marico0.00.00.037.938.037.838.033.037.30.00.00.0
Pretoria0.00.00.036.035.236.835.635.334.50.00.00.0
Vryburg0.00.00.038.238.738.038.338.00.00.00.00.0
Disclaimer/Publisher’s Note: The statements, opinions and data contained in all publications are solely those of the individual author(s) and contributor(s) and not of MDPI and/or the editor(s). MDPI and/or the editor(s) disclaim responsibility for any injury to people or property resulting from any ideas, methods, instructions or products referred to in the content.

