
Tropical Cyclonic Energy Variability in North Indian Ocean: Insights from ENSO
by
 ,
,
Debanjana Das
1,2,*, 
Sen Chiao
1,
Chayan Roychoudhury
3,
Fatema Khan
4,
Sutapa Chaudhuri
4 and
Sayantika Mukherjee
5 1
NOAA Cooperative Science Center in Atmospheric Sciences and Meteorology, Howard University, Washington, DC 20009, USA
2
Center for Ocean-Land Atmosphere Studies, George Mason University (GMU), Fairfax, VA 22030, USA
3
Department of Hydrology and Atmospheric Sciences, University of Arizona, Tucson, AZ 85721, USA
4
Department of Atmospheric Sciences, University of Calcutta, Kolkata 700019, India
5
Department of Environmental Science, Amity University, Kolkata 700135, India
*
Author to whom correspondence should be addressed.
Climate 2023, 11(12), 232; https://doi.org/10.3390/cli11120232
Submission received: 30 September 2023
/
Revised: 30 October 2023
/
Accepted: 10 November 2023
/
Published: 21 November 2023
(This article belongs to the Special Issue Tropical Cyclones Dynamics and Forecast System)
Abstract
:Tropical cyclones (TC) are one of the deadliest natural meteorological hazards with destructive winds and heavy rains, resulting losses often reach billions of dollars, imposing a substantial and long-lasting burden on both local and national economies. The El-Niño Southern Oscillation (ENSO), a tropical ocean–atmosphere interaction, is known to significantly impact cyclonic systems over global ocean basins. This study investigates the variability of TC activity in the presence of ENSO over the North Indian Ocean (NIO), comprising the Arabian Sea (ARB) and the Bay of Bengal (BOB) basins during the pre- and post-monsoon season, using accumulated cyclone energy (ACE) over the last 29 years. Our analysis reveals a significant rise in tropical cyclone energy intensity over the past two decades, with eight of the ten most active years occurring since the 2000s. Total ACE over the NIO is found to be higher in La-Niña. Higher ACE observed over ARB is strongly associated with a combination of elevated sea surface height (SSH) anomaly and low vertical wind shear during the El-Niño episodes, with higher sea surface temperatures (SST) during the post-monsoon season. Whereas in the BOB, El Niño not only reduces ACE, but also decreases basin-wide variability, and more pronounced effects during the post-monsoon season, coinciding with warmer SST and higher SSH along the coast during La-Niña.
1. Introduction
Tropical cyclones (TCs) are among the most devastating tropical weather phenomena causing a huge loss of lives and damage to property. Around 7% of global tropical cyclones occur in the north Indian Ocean (NIO). The number of cyclones occurring over the Bay of Bengal (BOB) is greater than the Arabian Sea (ARB), approximately four times higher [1]. Identification of the trends in their frequency and intensity over the NIO are very important for the coastal regions as 5–6 tropical cyclones form over this basin every year on average [2]. Generally, more TCs occur in the NIO in the post-monsoon season (primary TC peak season) and premonsoon season (secondary TC peak season). A few cyclones develop during monsoon months as well. The atmospheric and oceanic conditions and the variation in TC activity in the BOB were studied extensively earlier [3,4,5,6,7,8]. A relationship between Madden–Julian Oscillation (MJO) and tropical cyclones over the Indian Ocean and western Pacific was also identified [9]. The El-Niño Southern Oscillations (ENSO) have a significant impact on the cyclonic activity over different ocean basins [10,11,12]. During ENSO, sea surface temperatures (SST) were observed to change over the tropical eastern Pacific, which affects the atmospheric circulation in the equatorial Pacific, and at the same time, the Walker circulation also changes, which greatly influences the oceanic and atmospheric conditions globally [13,14,15]. The ENSO events have a substantial influence on TCs by modulating large-scale circulation [16,17,18]. Intensity forecasts of tropical cyclones were a major focus of the NIO region. Chaudhuri et al., in 2015, estimated the predictability of severe tropical cyclones over the NIO by observing features of cyclonic depression with a condition decision support system based on rough set theory [19]. Earlier studies investigated the relationship between ENSO and seasonal TC activity in different tropical basins [20]. In a study, the impact of ENSO and MJO on TC activity over the south Indian Ocean was analyzed as well [21]. Trends in TC activity in relation to ENSO in the Sothern hemisphere were also investigated [22]. ENSO events also have significant impacts on the locations of the tropical cyclogenesis and hurricane intensity [23,24,25]. In the Atlantic basin during the El-Niño (La-Niña) years, less (more) cyclones were observed. The El-Niño phase of ENSO suppresses the formation of TCs in the north Atlantic basin. Artificial neural networks were also developed for medium-range forecasts of cyclogenesis [26]. Comparatively, less research was conducted over the NIO in relation to ENSO and TC activity. Past research shows a decline in TC activity over BOB in the months of May and November during the warm phases of ENSO, and it was observed that the TC frequency in the NIO has a prominent ENSO cycle (2–5 years) during May–November. Studies also showed that TCs are relatively more pronounced over the BOB during La-Niña and negative Indian Ocean Dipole (IOD) years [27,28]. TC activity was studied using different metrics, which include annual storm counts, hurricane categories, power dissipation index (PDI), and the accumulated cyclone energy (ACE) index. The ACE combines the intensity and duration of tropical cyclones into a single metric, reflecting their potential for damage and impact, and is used as a tool for cyclone monitoring and forecasting [29]. Some research indicates that changes in PDI correlate with increased sea surface temperatures (SST) in the Atlantic [30]. While some studies suggested a decline in ACE, others reported an increase, particularly in the context of global warming scenarios [31,32,33,34].
The purpose of this study is to investigate the connection between the El Niño Southern Oscillation (ENSO) signals to TC activity in the basins of NIO and identify the possible oceanic and atmospheric processes that modulate them using the ACE index. By conducting separate analyses for the ARB and BOB regions, we aim to enhance our understanding of TC variability in this complex, climate-sensitive zone.
This research paper has four sections. In Section 2, we describe the datasets and the methods used. Section 3 discusses the main findings, including the statistics of TC activity and ACE and provides an analysis of the impacts of ENSO on TCs. In Section 4, we discuss the implications and summarize our findings.
2. Data and Methods
2.1. Data
Different types of satellites and ocean analysis products were used in this study. The best track data for cyclonic disturbances over the north Indian Ocean, generated by the Regional Specialised Meteorological Centre (RSMC), IMD, India (https://rsmcnewdelhi.imd.gov.in/report.php?internal_menu=MzM=, accessed on 14 July 2020) are used. The India Meteorological Department’s best track data were chosen for their historical use in past literature, particularly in studies focusing on this region. This selection ensures consistency with existing research, and it is a dataset that was well-established for this specific area with limited reported bias. The period of study is 1990–2018. The daily sea surface temperature (SST) and GODAS sea surface height (SSH) data are obtained from the National Oceanic and Atmospheric Administration (NOAA).
2.2. Methodology
The cyclonic systems were classified with respect to wind speed according to IMD India Meteorological Department (IMD) criteria as follows; depression (D) (17–27 kt), deep depression (DD) (28–33 kt), cyclonic storm (CS) (34–47 kt), severe cyclonic storm (SCS) (48–63 kt), very severe cyclonic storm (VSCS) (64–119 kt), and super cyclonic storm (SUCS) (>120 kt). In this study, the focus is only on the TCs of CS and higher categories. The definition of El-Niño and La-Niña events are based on the analysis of the Oceanic Niño Index (ONI) according to world meteorological organization (WMO). The El-Niño years are defined when ONI is above 0.5 °C for a minimum of 5 consecutive months and the La-Niña years are defined when ONI is below −0.5 °C for minimum of 5 consecutive months according to WMO. The same criterion was used in this study to categorize El-Niño and La-Niña years. The present investigation focuses on the variability of the ACE index with respect to El-Niño and La-Niña during the pre- (March–May) and post- monsoon (Oct–Dec) season in order to understand the TC activity over NIO and its link with the El-Niño and La-Niña events. Values of ACE for the pre- and post-monsoon season are obtained by computing the sum of the squares of the estimated 6 hourly maximum sustained wind speed (kt2) over the lifetime of a TC as it reaches the CS and higher category, subsequently adding them for all TCs over the entire season under consideration. The annual ACE values are also computed by summing the values of ACE for all the TCs occurring in a year. The unit of ACE is 104 kt2, and for use as an index the unit is assumed. The values of ACE used in the present study are computed as:
where vmax is the estimated sustained wind speed of the system in knots.
ACE = 104 Σv2max
The conventional statistical method of box and whisker plots used in this study [35]. These plots include the median, interquartile range (box), and outer range (whiskers). The whiskers signify the data’s outer range, extending from the box ends. The median’s advantage lies in its resistance to outliers when n ≥ 3. The box represents the middle 50% of ranked data, spanning from the lower to upper quartile values (25th to 75th percentile). These methods were already used to study variability over the North Indian Ocean basins [35,36].
In this study, vertical wind shear (VWS) is computed as the vector wind difference between the upper troposphere at 200 hPa and the lower troposphere at 850 hPa using NCEP-DOE Reanalysis 2 [37].
3. Results
3.1. ACE Variability across the North Indian Ocean, Arabian Sea, and Bay of Bengal Basins
The duration of different categories of cyclonic systems forming over BOB and ARB was estimated for both pre-monsoon and post-monsoon season during El-Niño and La-Niña years (Table 1). It is observed that during the pre-monsoon season, the duration of the CS category of cyclones is maximum over BOB and ARB in the El-Niño years. However, in the La-Niña years the duration of the D category of cyclones is more over BOB followed by the CS categories, while the duration of the ESCS category is more over ARB.
The observation suggests that either the occurrence of CS categories of cyclones increased, or the lifetime of such cyclones became more over BOB. Conversely, during the post-monsoon season, the duration of the CS category of cyclones is observed to be more in the El-Niño years and the duration of the DD category of cyclones is more in the La-Niña years. It is observed that during the pre-monsoon season in the El-Niño years the cyclones of higher categories than CS are more over BOB. However, during the post-monsoon season in the El-Niño years, the maximum cyclones over BOB are of the CS category, whereas cyclones of CS and higher categories are more over ARB. Likewise, the number of cyclones occurring in the La-Niña years during the pre- and post-monsoon season is estimated (Table 2). It is observed that the cyclones of the CS category are more and just one case of SCS category prevails during the pre-monsoon season over BOB, while one case each of CS and ESCS categories is observed over ARB. During the post-monsoon season, the cyclones of CS and higher categories are more over BOB in the La-Niña years.
The total ACE values during the El-Niño and La-Niña years are estimated (Figure 1). It is observed that during the El-Niño years, the ACE of ARB and BOB is comparable while for the La-Niña years and BOB has higher ACE than ARB. Nevertheless, during El-Niño, the ACE values of the BOB basins and NIO are less than the La-Niña years. The result further shows that the ACE increases during the cold regime, emphasizing the correlation between ENSO and TC activity in the NIO.
During El Niño, ACE is 129.06 × 10⁴ knots2, while in La-Niña, it jumps to 195.28 × 10⁴ knots2. Notably, the ACE increase is more pronounced over the Bay of Bengal than the Arabian Sea during the transition from El Niño to La-Niña. This distinctive ACE fluctuation is profoundly shaped by the unique physio-chemical attributes intrinsic to each ocean basin. This, in turn, affects ACE through changes in the strength of winds [38].
Figure 2 illustrates the average ACE values for the pre-monsoon and post-monsoon seasons during El-Niño and La-Niña phases. The data covers the years 1990–2015 and is segmented for both for the Bay of Bengal (BOB) and Arabian Sea (ARB). This depiction provides a comprehensive view of how ACE behaves in response to El-Niño and La-Niña events across these specific regions during different seasons. The blue bars represent La-Niña, and the red bars represent El-Niño. Notably, the average maximum ACE is higher (15.88) over the Arabian Sea during El-Niño, specifically during post-monsoon months. Conversely, over the Bay of Bengal, the maximum ACE is observed during La-Niña’s post-monsoon phase. Figure 2 effectively showcases how El Niño and La-Niña events not only impact the North Indian Ocean, but also exhibit detectable differences in their basin-wide effects. These climatic phases influence seasonal ACE variations distinctively, not only across ocean basins, but also within them. Remarkably, the basin-wide cyclonic energy pattern undergoes a reversal during El-Niño and La-Niña phases, emphasizing their complex influence.
A comprehensive box-whisker plot of accumulated cyclone energy (ACE) for all years is presented (Figure 3), specifically differentiating between the El-Niño and La-Niña years. The analysis focuses on post-monsoon, monsoon, pre-monsoon, and annual periods across the Arabian Sea (ARB), Bay of Bengal (BOB), and the entire North Indian Ocean (NIO) region. Figure 3 employs a color scheme where blue designates the Arabian Sea, orange corresponds to the North Indian Ocean, and green is utilized for the Bay of Bengal. Importantly, we observe that the average and range of ACE values tend to be higher across all years, compared to only El-Niño years. Conversely, during La-Niña years, ACE’s variability and average are notably higher across all years, and this distinction is more pronounced during both El-Niño and La-Niña occurrences.
The ACE index for the Arabian Sea (ARB) and the Bay of Bengal (BOB) from 1990 to 2018 indicates an increasing trend in both basins, with a more pronounced increase observed in the ARB. ACE values in the BOB exhibit less variability, while the ARB shows significant fluctuations, with some years experiencing notably higher or negligible ACE values. Moreover, ACE values in the BOB are consistently higher than those in the ARB (Figure 4).
Regarding sea surface temperature (SST), both the ARB and BOB show rising trends over the study period, aligning with global tropical cyclone trends associated with increasing temperatures. The ARB experiences a more substantial SST increase compared to the BOB. The observed R2 values for SST trends are 0.409 (ARB) and 0.349 (BOB) (Figure 4).
3.2. Spatio-Temporal Variability of Atmospheric and Oceanic Modulation during ENSO Phases
SST is an important parameter that plays an important role in the development of tropical cyclones. The SST anomaly during the post monsoon and pre-monsoon season of the El-Niño and La-Niña years is depicted (Figure 5). In panels corresponding to El-Niño conditions, SST anomalies are observed to exhibit distinctive patterns during both the post-monsoon and pre-monsoon seasons. In panels (b) and (d), representing La-Niña phases, the SST anomalies portray contrasting characteristics in the two respective seasons. These variations highlight the pronounced influence of El-Niño and La-Niña events on regional sea surface temperature dynamics, accentuated across different temporal segments.
For the post-monsoon season during the El-Niño years, the SST shows positive anomaly for both ARB and BOB with higher values over the ARB. For the La-Niña years, negative anomaly is observed for both ARB and BOB. The positive anomalies in SST over ARB and BOB in the post-monsoon season are observed to be directly correlated with El-Niño, which aids in warming the water of the ocean. For the pre-monsoon season, the BOB has negative and greater SST anomaly, while ARB has less SST anomaly during El-Niño years. During La-Niña years, ARB has positive SST anomaly and positive anomaly is observed in the upper BOB and negative SST anomaly is observed in the lower regions of BOB; however, ARB has higher positive anomaly. From the above results, it can be inferred that the effect of ENSO is greater during post-monsoon season as the peak of ENSO phenomena occurs around November–January [38]. Furthermore, the effect of ENSO during post-monsoon and pre-monsoon seasons is contradictory.
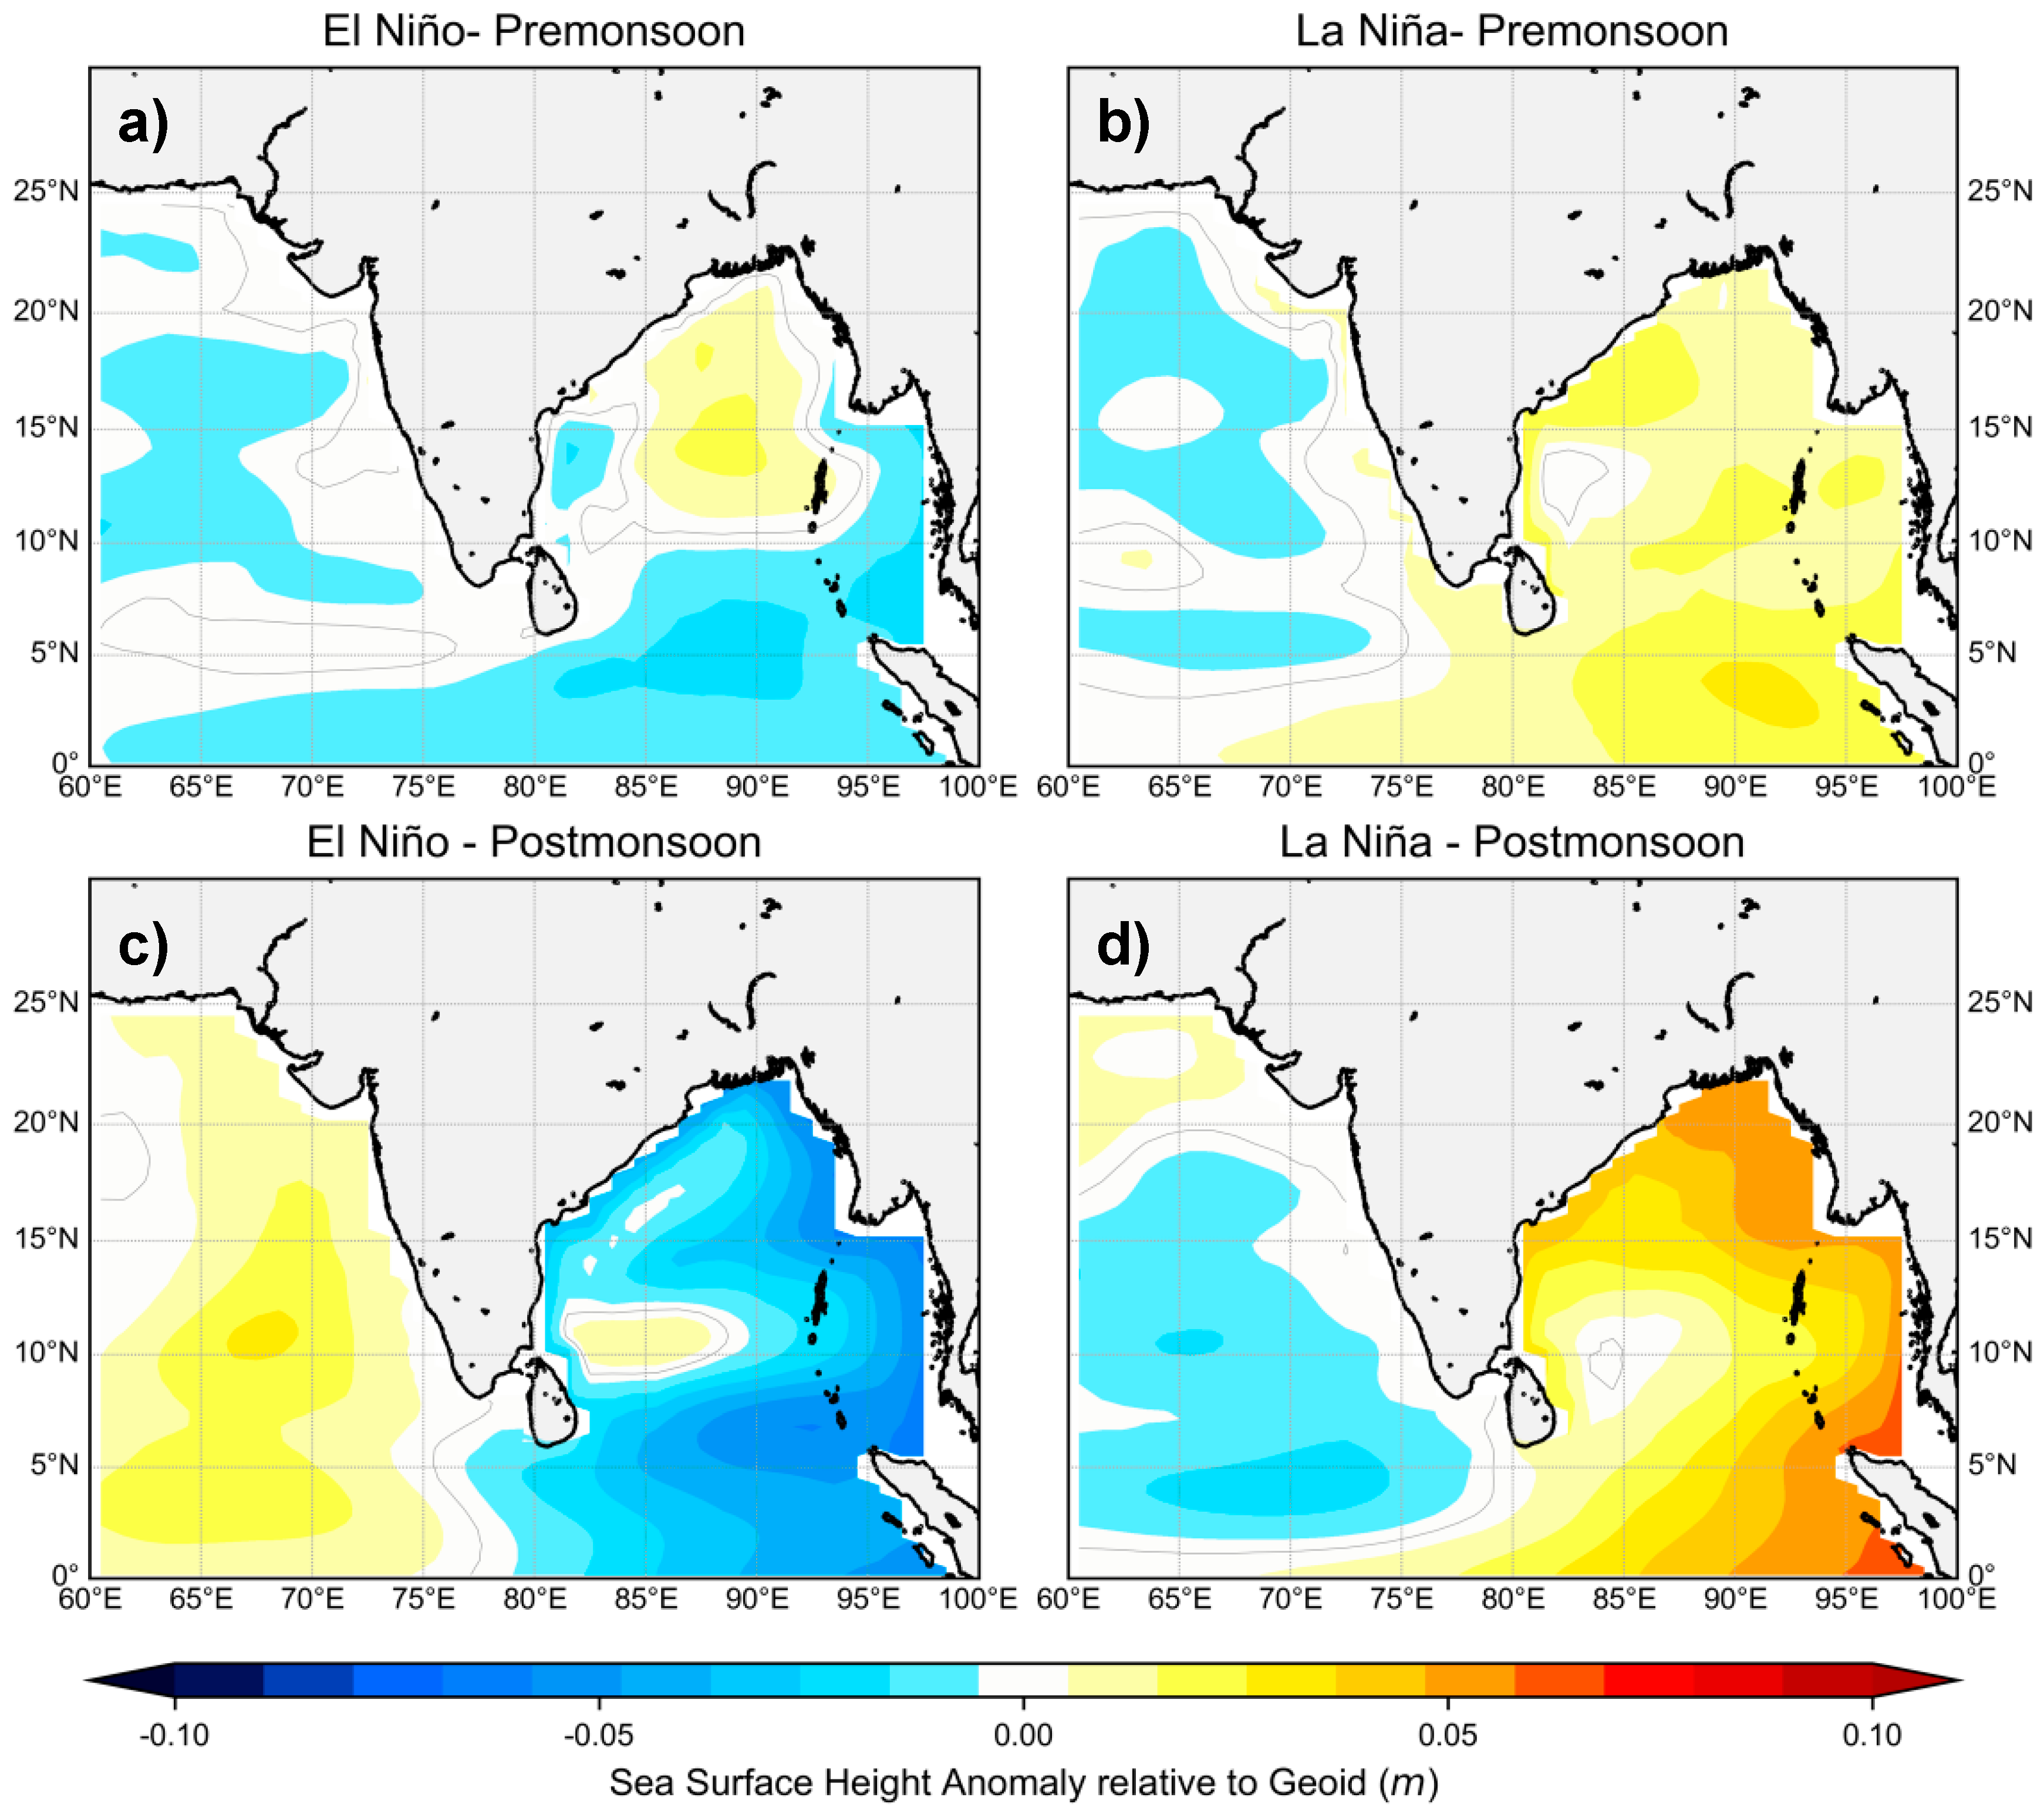
Weak vertical shear of horizontal wind between the lower (850 hPa) and upper troposphere (200 hPa) also assists in the formation of cyclones. The average vertical wind shear for post-monsoon and pre-monsoon seasons during the El-Niño, neutral, and La-Niña years was estimated (Figure 6). It is evident that the wind shear over both ARB and BOB is low and almost the same in both EL-Niño and La-Niña years for the pre monsoon period as it is in the normal case, and it is lowest in southern portions of ARB. The wind shear for post-monsoon season in the La-Niña years is slightly greater in the BOB than ARB, whereas, for El-Niño years and normal years, the wind shear is low, and it is similar in BOB and ARB. Figure 7 displays sea surface height (SSH) anomalies distinctly portraying divergent oceanic characteristics corresponding to these phases. Significantly, the magnitudes exhibit substantial variability across the two seasons. Notably, the anomalies exhibit a strengthening trend during La-Niña’s pre-monsoon to post-monsoon transition. Furthermore, the SSH gradient between the Arabian Sea and the Bay of Bengal becomes pronounced.
In conducting this analysis, we made every effort to minimize assumptions, placing a primary reliance on statistical techniques. Potential inaccuracies in the dataset are among the main sources of error that we considered. Improved observations would undoubtedly enhance our capacity to reduce these errors. Importantly, we would like to emphasize that, in our view, these potential inaccuracies do not substantially affect the core findings or the robustness of the results. Additionally, the assumptions made in statistical techniques could introduce some uncertainty. Please note that we only categorized the data based on ENSO phases. Therefore, factors influencing variability other than ENSO and seasonal variances were not addressed, as they fall outside the scope of the present study.
4. Conclusions
ENSO and its relation to TC activity in the ARB and BOB during the pre-monsoon and post-monsoon season are studied for the period of 1990–2018. This study shows that ENSO significantly and differently affects the tropical cyclone activity over BOB and ARB during the El-Niño and La-Niña years. During La-Niña (El-Niño) phases, the TC activity is observed to be relatively more (less) pronounced in the NIO. The ACE values do not show much difference from El-Niño years to La Niña years over ARB, whereas this difference is much higher over BOB. Higher SST is observed in the post-monsoon season, which, along with high SSH and low wind shear, leads to higher ACE values in ARB during El-Niño years. In the La-Niña phase, ACE is more in BOB in post-monsoon season, but SST is not higher in BOB. So, SST may not be a factor for higher ACE values in BOB. SSH is greater in the post-monsoon season in BOB, which, along with low wind shear, may be responsible for greater ACE values in BOB. The result shows that during the post-monsoon season, tropical cyclone activity measured in terms of ACE is more over ARB during the El-Niño phase, while ACE is more over BOB during the La-Niña phase.
During La Niña, cooler sea surface temperatures in the central and eastern equatorial Pacific Ocean can impact tropical cyclone activity. This is not solely due to cooler waters; it’s also connected to alterations in atmospheric circulation patterns. These changes in atmospheric circulation patterns perhaps associated with La Niña can lead to increased accumulated cyclone energy (ACE) in the North Indian Ocean. These shifts can lead to favorable conditions for tropical cyclone development in certain regions, including the North Indian Ocean. While La-Niña brings cooler waters to the equatorial Pacific, it can lead to warmer-than-average sea surface temperatures in other areas, such as the western Indian Ocean, which can support cyclone formation. La-Niña tends to reduce wind shear in the North Indian Ocean. Wind shear, which is the change in wind speed and direction with altitude, can inhibit cyclone development. When wind shear is low, it allows cyclones to form and intensify more easily, contributing to higher ACE values. La-Niña can enhance atmospheric instability, which is a key factor for cyclone development. The presence of unstable air encourages the rising motion necessary for cyclone formation. This increased instability can lead to more frequent and stronger cyclones during La-Niña. La-Niña or El-Niño do not act in isolation; they interact with other climate patterns such as the Indian Ocean Dipole (IOD). A positive IOD phase, which often coincides with La-Niña, can lead to warmer waters in the western Indian Ocean, further supporting cyclone development. While La-Niña does bring cooler waters to some regions, its impact on cyclone activity is influenced by a combination of factors, including atmospheric circulation changes, wind shear, atmospheric instability, and interactions with other climate patterns. These factors can create conditions conducive to increased cyclone activity and higher ACE values in the North Indian Ocean despite the cooling effect of La-Niña in the Pacific.
To address the novelty of the present research, we will emphasis that in this study, we not only analyze the annual ACE variability for both ocean basins, but also conduct an analysis for each cyclone season (both pre and post monsoon) within ARB and BOB ocean basins, as well as across the entire North Indian Ocean (NIO). Simply, this study is important because it helps us understand how El Niño and La Niña affect cyclone seasons in the North Indian Ocean. These cyclones often bring extreme weather and can be highly destructive. This approach provides a more comprehensive understanding of the variability. This study is the first of its kind to not only address basin-wise variability for each cyclone occurrence season, but also simultaneously study the variability due to the presence of ENSO. Given the distinct behavior of cyclonic activity in different ocean basins, treating them separately rather than using a larger geographical domain such as the North Indian Ocean can indeed lead to better predictability of tropical cyclone activity. In summary, a basin-specific approach, rather than a broader geographical domain, can enhance the precision and reliability of tropical cyclone predictions, ultimately contributing to better preparedness and response strategies for vulnerable regions.
Author Contributions
Conceptualization, D.D. and S.C. (Sutapa Chaudhuri); methodology, D.D., F.K. and C.R.; analysis, D.D., F.K. and C.R.; data curation, F.K., D.D. and S.C. (Sutapa Chaudhuri); writing—original draft, D.D.; writing—review and editing, D.D., F.K., S.C. (Sen Chiao), C.R. and S.M.; funding acquisition, S.C. (Sen Chiao), S.C. (Sutapa Chaudhuri) and D.D. All authors have read and agreed to the published version of the manuscript.
Funding
This research was partially supported by NASA (grant NNX14AM19G) and the U.S. Department of Commerce, National Oceanic and Atmospheric Administration (NOAA), Educational Partnership Program under Agreement No. NA22SEC4810015. We all thank the National Center for Atmospheric Research (NCAR) supercomputer.
Data Availability Statement
The data presented in this study are openly available via the links provided in the data section. More detailed information can be obtained upon request to the corresponding authors.
Conflicts of Interest
The authors declare no conflict of interest.
References
- Lin, I.-I.; Chen, C.-H.; Pun, I.-F.; Liu, W.T.; Wu, C.-C. Warm Ocean Anomaly, Air Sea Fluxes, and the Rapid Intensification of Tropical Cyclone Nargis (2008). Geophys. Res. Lett. 2009, 36. [Google Scholar] [CrossRef]
- Tiwari, G.; Kumar, P.; Javed, A.; Mishra, A.K.; Routray, A. Assessing Tropical Cyclones Characteristics over the Arabian Sea and Bay of Bengal in the Recent Decades. Meteorol. Atmos. Phys. 2022, 134, 44. [Google Scholar] [CrossRef]
- Vecchi, G.A.; Soden, B.J. Effect of Remote Sea Surface Temperature Change on Tropical Cyclone Potential Intensity. Nature 2007, 450, 1066–1070. [Google Scholar] [CrossRef] [PubMed]
- Simpson, R.H. The Hurricane Disaster—Potential Scale. Weatherwise 1974, 27, 169–186. [Google Scholar] [CrossRef]
- Thiébaux, J.; Rogers, E.; Wang, W.; Katz, B. A New High-Resolution Blended Real-Time Global Sea Surface Temperature Analysis. Bull. Am. Meteorol. Soc. 2003, 84, 645–656. [Google Scholar] [CrossRef]
- Klotzbach, P.J. Trends in Global Tropical Cyclone Activity over the Past Twenty Years (1986–2005). Geophys. Res. Lett. 2006, 33. [Google Scholar] [CrossRef]
- Gray, M.W. Hurricanes: Their Formation, Structure and Likely Role in the General Circulation. Meteorology over the tropical oceans. Roy. Meteor. Soc. 1979, 155–218, CRID.1570291224529162496. NII Article ID:10006708334. [Google Scholar]
- Webster, P.J.; Holland, G.J.; Curry, J.A.; Chang, H.-R. Changes in Tropical Cyclone Number, Duration, and Intensity in a Warming Environment. Science 2005, 309, 1844–1846. [Google Scholar] [CrossRef]
- Lakshani, W.A.E.; Zhou, W. Observed Decadal Shifts and Trends in Global Tropical Cyclone Activities from 1980 to 2021. Atmos. Ocean. Sci. Lett. 2023, 16, 100321. [Google Scholar] [CrossRef]
- Gray, W.M. Tropical Cyclone Genesis. Ph.D. Thesis, Colorado State University, Fort Collins, CO, USA, March 1975. Atmospheric Science Paper No. 234. [Google Scholar]
- Ho, C.-H.; Kim, J.-H.; Jeong, J.-H.; Kim, H.-S.; Chen, D. Variation of Tropical Cyclone Activity in the South Indian Ocean: El Niño–Southern Oscillation and Madden-Julian Oscillation Effects. J. Geophys. Res. Atmos. 2006, 111, D22. [Google Scholar] [CrossRef]
- Chia, H.H.; Ropelewski, C.F. The Interannual Variability in the Genesis Location of Tropical Cyclones in the Northwest Pacific. J. Clim. 2002, 15, 2934–2944. [Google Scholar] [CrossRef]
- Goswami, B.N.; Ajayamohan, R.S.; Xavier, P.K.; Sengupta, D. Clustering of Synoptic Activity by Indian Summer Monsoon Intraseasonal Oscillations. Geophys. Res. Lett. 2003, 30. [Google Scholar] [CrossRef]
- Ali, M.M.; Swain, D.; Kashyap, T.; McCreary, J.P.; Nagamani, P.V. Relationship Between Cyclone Intensities and Sea Surface Temperature in the Tropical Indian Ocean. IEEE Geosci. Remote Sens. Lett. 2013, 10, 841–844. [Google Scholar] [CrossRef]
- Gray, W.M. Atlantic Seasonal Hurricane Frequency. Part I: El Niño and 30 Mb Quasi-Biennial Oscillation Influences. Mon. Weather Rev. 1984, 112, 1649–1668. [Google Scholar] [CrossRef]
- Goldenberg, S.B.; Shapiro, L.J. Physical Mechanisms for the Association of El Niño and West African Rainfall with Atlantic Major Hurricane Activity. J. Clim. 1996, 9, 1169–1187. [Google Scholar] [CrossRef]
- Villarini, G.; Vecchi, G.A. North Atlantic Power Dissipation Index (PDI) and Accumulated Cyclone Energy (ACE): Statistical Modeling and Sensitivity to Sea Surface Temperature Changes. J. Clim. 2012, 25, 625–637. [Google Scholar] [CrossRef]
- Wang, B.; Chan, J.C.L. How Strong ENSO Events Affect Tropical Storm Activity over the Western North Pacific. J. Clim. 2002, 15, 1643–1658. [Google Scholar] [CrossRef]
- Franzke, C.L.E.; Torelló i Sentelles, H. Risk of Extreme High Fatalities Due to Weather and Climate Hazards and Its Connection to Large-Scale Climate Variability. Clim. Chang. 2020, 162, 507–525. [Google Scholar] [CrossRef]
- Chaudhuri, S.; Basu, D.; Das, D.; Goswami, S.; Varshney, S. Swarm Intelligence and Neural Nets in Forecasting the Maximum Sustained Wind Speed along the Track of Tropical Cyclones over Bay of Bengal. Nat. Hazards 2017, 87, 1413–1433. [Google Scholar] [CrossRef]
- Chaudhuri, S.; Dutta, D.; Goswami, S.; Middey, A. Track and Intensity Forecast of Tropical Cyclones over the North Indian Ocean with Multilayer Feed Forward Neural Nets. Meteorol. Appl. 2015, 22, 563–575. [Google Scholar] [CrossRef]
- Bessafi, M.; Wheeler, M.C. Modulation of south Indian Ocean tropical cyclones by the Madden-Julian Oscillation and convectively-coupled equatorial waves, Mon. Weather Rev. 2006, 134, 638–656. [Google Scholar] [CrossRef]
- Ogata, T. Seasonality of Relationship between Tropical Cyclone Frequency over the Southern Hemisphere and Tropical Climate Modes. Atmosphere 2023, 14, 546. [Google Scholar] [CrossRef]
- Ke, M.; Wang, Z.; Pan, W.; Luo, H.; Yang, S.; Guo, R. Extremely Strong Western Pacific Subtropical High in May 2021 Following a La Niña Event: Role of the Persistent Convective Forcing over the Indian Ocean. Asia-Pac. J. Atmos. Sci. 2023, 59, 47–58. [Google Scholar] [CrossRef]
- Landsea, C.W.; Pielke, R.A.; Mestas-Nuñez, A.M.; Knaff, J.A. Atlantic Basin Hurricanes: Indices of Climatic Changes. Clim. Chang. 1999, 42, 89–129. [Google Scholar] [CrossRef]
- Lin, I.-I.; Camargo, S.J.; Patricola, C.M.; Boucharel, J.; Chand, S.; Klotzbach, P.; Chan, J.C.L.; Wang, B.; Chang, P.; Li, T.; et al. ENSO and Tropical Cyclones. In El Niño Southern Oscillation in a Changing Climate; American Geophysical Union (AGU): Washington, DC, USA, 2020; pp. 377–408. ISBN 978-1-119-54816-4. [Google Scholar]
- Kikuchi, K.; Wang, B.; Fudeyasu, H. Genesis of Tropical Cyclone Nargis Revealed by Multiple Satellite Observations. Geophys. Res. Lett. 2009, 36. [Google Scholar] [CrossRef]
- Albert, J.; Krishnan, A.; Bhaskaran, P.K.; Singh, K.S. Role and Influence of Key Atmospheric Parameters in Large-Scale Environmental Flow Associated with Tropical Cyclogenesis and ENSO in the North Indian Ocean Basin. Clim. Dyn. 2022, 58, 17–34. [Google Scholar] [CrossRef]
- Waple, A.M.; Lawrimore, J.H.; Halpert, M.S.; Bell, G.D.; Higgins, W.; Lyon, B.; Menne, M.J.; Gleason, K.L.; Schnell, R.C.; Christy, J.R.; et al. Climate Assessment for 2001. Bull. Am. Meteorol. Soc. 2002, 83, S1–S62. [Google Scholar] [CrossRef]
- Bell, G.; Halpert, M.; Schnell, R.; Higgins, R.; Lawrimore, J.; Kousky, V.; Tinker, R.; Thiaw, W.; Chelliah, M.; Artusa, A. The 1999 North Atlantic and Eastern North Pacific Hurricane Seasons [in “Climate Assessment for 1999”]. Bull. Am. Meteorol. Soc. 2000, 81, S19–S22. [Google Scholar]
- Maue, R.N. Recent Historically Low Global Tropical Cyclone Activity. Geophys. Res. Lett. 2011, 38. [Google Scholar] [CrossRef]
- Bamston, A.G.; Chelliah, M.; Goldenberg, S.B. Documentation of a Highly ENSO-related Sst Region in the Equatorial Pacific: Research Note. Atmos. Ocean 1997, 35, 367–383. [Google Scholar] [CrossRef]
- Fahad, A.A.; Reale, O.; Molod, A.; Sany, T.A.; Ahammad, M.T.; Menemenlis, D. The Role of Tropical Easterly Jet on the Bay of Bengal’s Tropical Cyclones: Observed Climatology and Future Projection. J. Clim. 2023, 36, 5825–5840. [Google Scholar] [CrossRef]
- Klotzbach, P.J.; Wood, K.M.; Schreck III, C.J.; Bowen, S.G.; Patricola, C.M.; Bell, M.M. Trends in Global Tropical Cyclone Activity: 1990–2021. Geophys. Res. Lett. 2022, 49, e2021GL095774. [Google Scholar] [CrossRef]
- Banacos, P.C. Box and Whisker Plots for Local Climate Datasets: Interpretation and Creation Using Excel 2007/2010.2011. Eastern Region Technical Attachment No. 2011-01. Available online: https://repository.library.noaa.gov/view/noaa/6605.12.11.23 (accessed on 1 November 2023).
- Das, D.; Chakrabarty, M.; Goswami, S.; Basu, D.; Chaudhuri, S. Impact of Intra-Seasonal Oscillations of Indian Summer Monsoon on Biogeochemical Constituents of North Indian Ocean. Theor. Appl. Climatol. 2019, 136, 839–848. [Google Scholar] [CrossRef]
- Kanamitsu, M.; Ebisuzaki, W.; Woollen, J.; Yang, S.-K.; Hnilo, J.J.; Fiorino, M.; Potter, G.L. NCEP–DOE AMIP-II Reanalysis (R-2). Bull. Am. Meteorol. Soc. 2002, 83, 1631–1644. [Google Scholar] [CrossRef]
- Tziperman, E.; Cane, M.A.; Zebiak, S.E.; Xue, Y.; Blumenthal, B. Locking of El Nino’s Peak Time to the End of the Calendar Year in the Delayed Oscillator Picture of ENSO. J. Clim. 1998, 11, 2191–2199. [Google Scholar] [CrossRef]
Figure 1.
Total ACE values for (a) El-Niño and (b) La-Niña years over the ARB Sea, BOB, and North Indian Ocean.
Figure 1.
Total ACE values for (a) El-Niño and (b) La-Niña years over the ARB Sea, BOB, and North Indian Ocean.
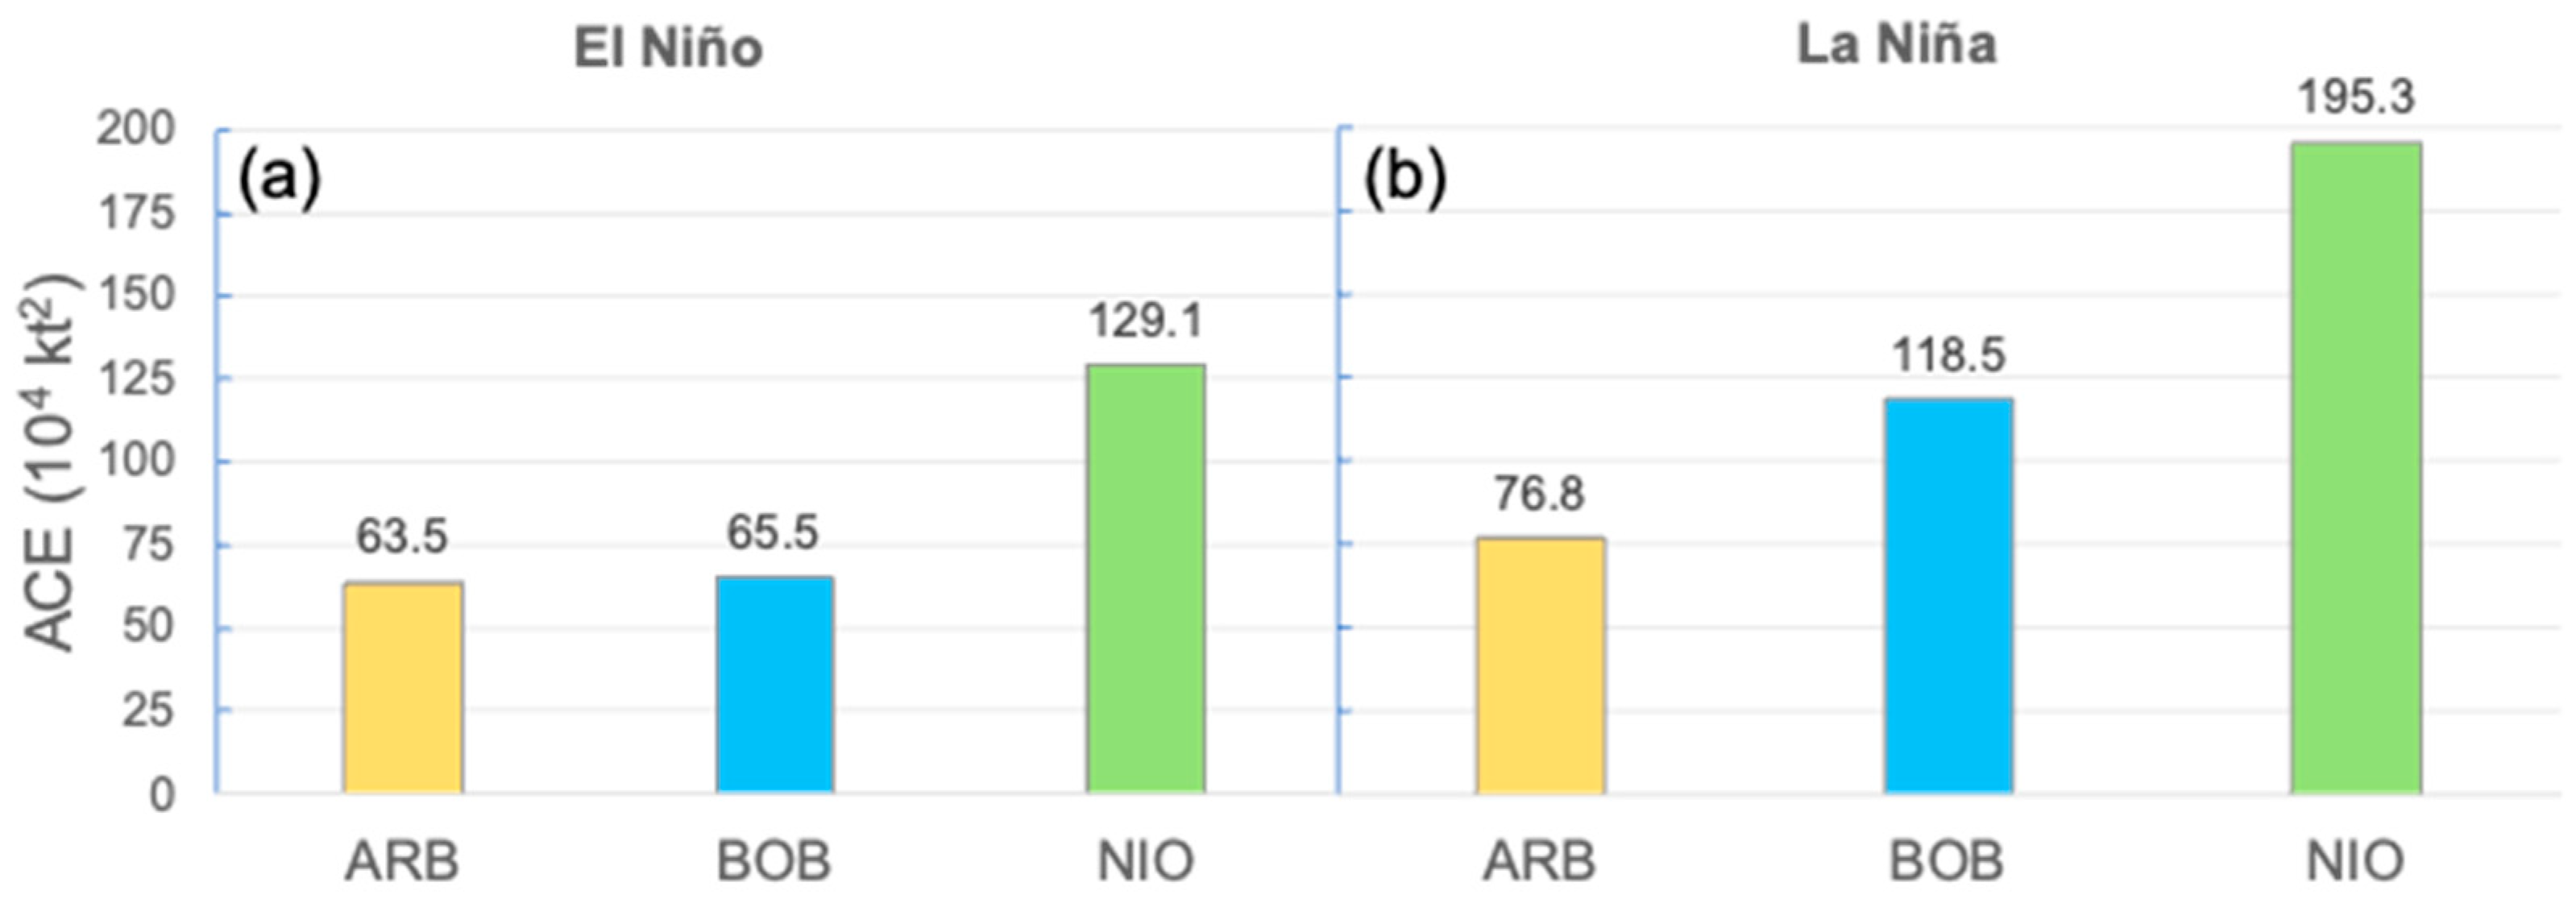
Figure 2.
Average ACE values for the premonsoon (a) and postmonsoon season (b) during El-Niño and La-Niña phase, respectively, during the period 1990–2018.
Figure 2.
Average ACE values for the premonsoon (a) and postmonsoon season (b) during El-Niño and La-Niña phase, respectively, during the period 1990–2018.

Figure 3.
Box-whisker plots over 1982–2020: post-monsoon, monsoon, pre-monsoon, and annual analysis of accumulated cyclone energy (ACE) across the ARB, Bay of BOB, and the North Indian Ocean for all years (a), El-Niño (b), and La-Niña (c) years, and the boxes show the 25th and 75th percentiles.
Figure 3.
Box-whisker plots over 1982–2020: post-monsoon, monsoon, pre-monsoon, and annual analysis of accumulated cyclone energy (ACE) across the ARB, Bay of BOB, and the North Indian Ocean for all years (a), El-Niño (b), and La-Niña (c) years, and the boxes show the 25th and 75th percentiles.
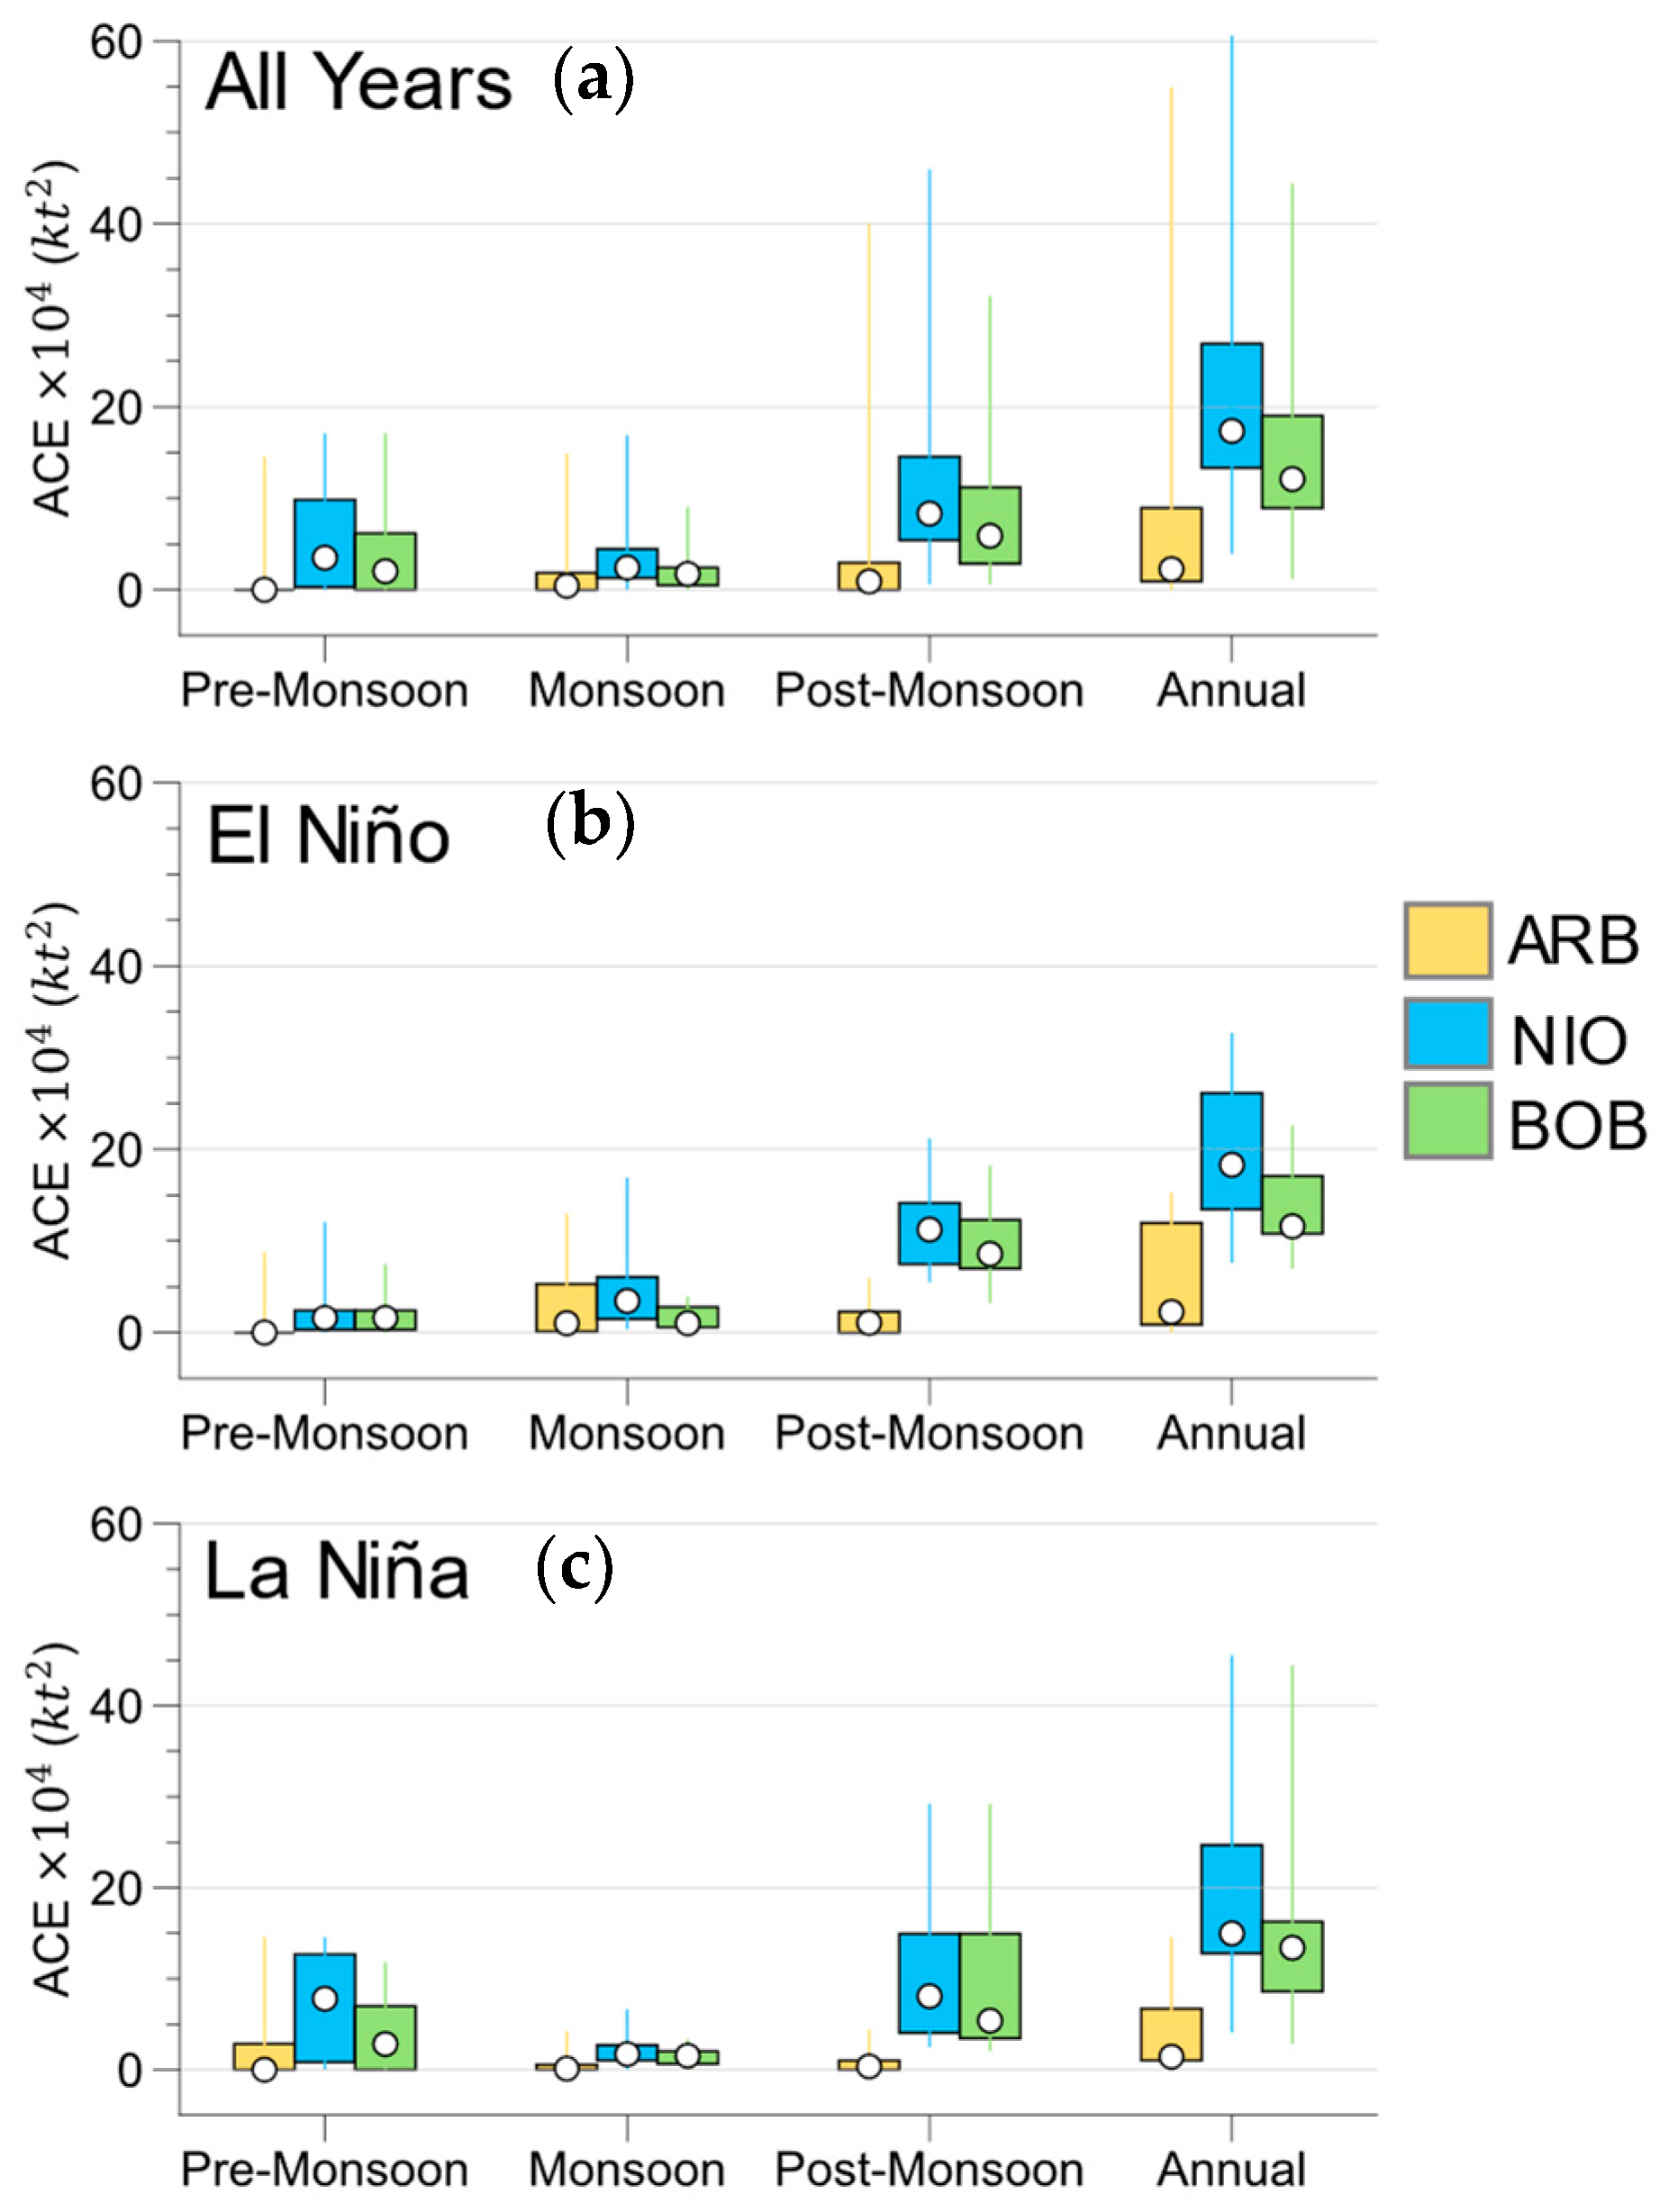
Figure 4.
Time series of mean ACE and SST over ARB (a,c) and BOB (b,d) for the years 1990–2015. Shaded areas represent ±1 standard deviation of ACE and SST.
Figure 4.
Time series of mean ACE and SST over ARB (a,c) and BOB (b,d) for the years 1990–2015. Shaded areas represent ±1 standard deviation of ACE and SST.

Figure 5.
Sea surface temperature (SST) anomaly for (a,c) El-Niño and (b,d) La-Niña phase during (a,b) post-monsoon season and (c,d) pre-monsoon season.
Figure 5.
Sea surface temperature (SST) anomaly for (a,c) El-Niño and (b,d) La-Niña phase during (a,b) post-monsoon season and (c,d) pre-monsoon season.
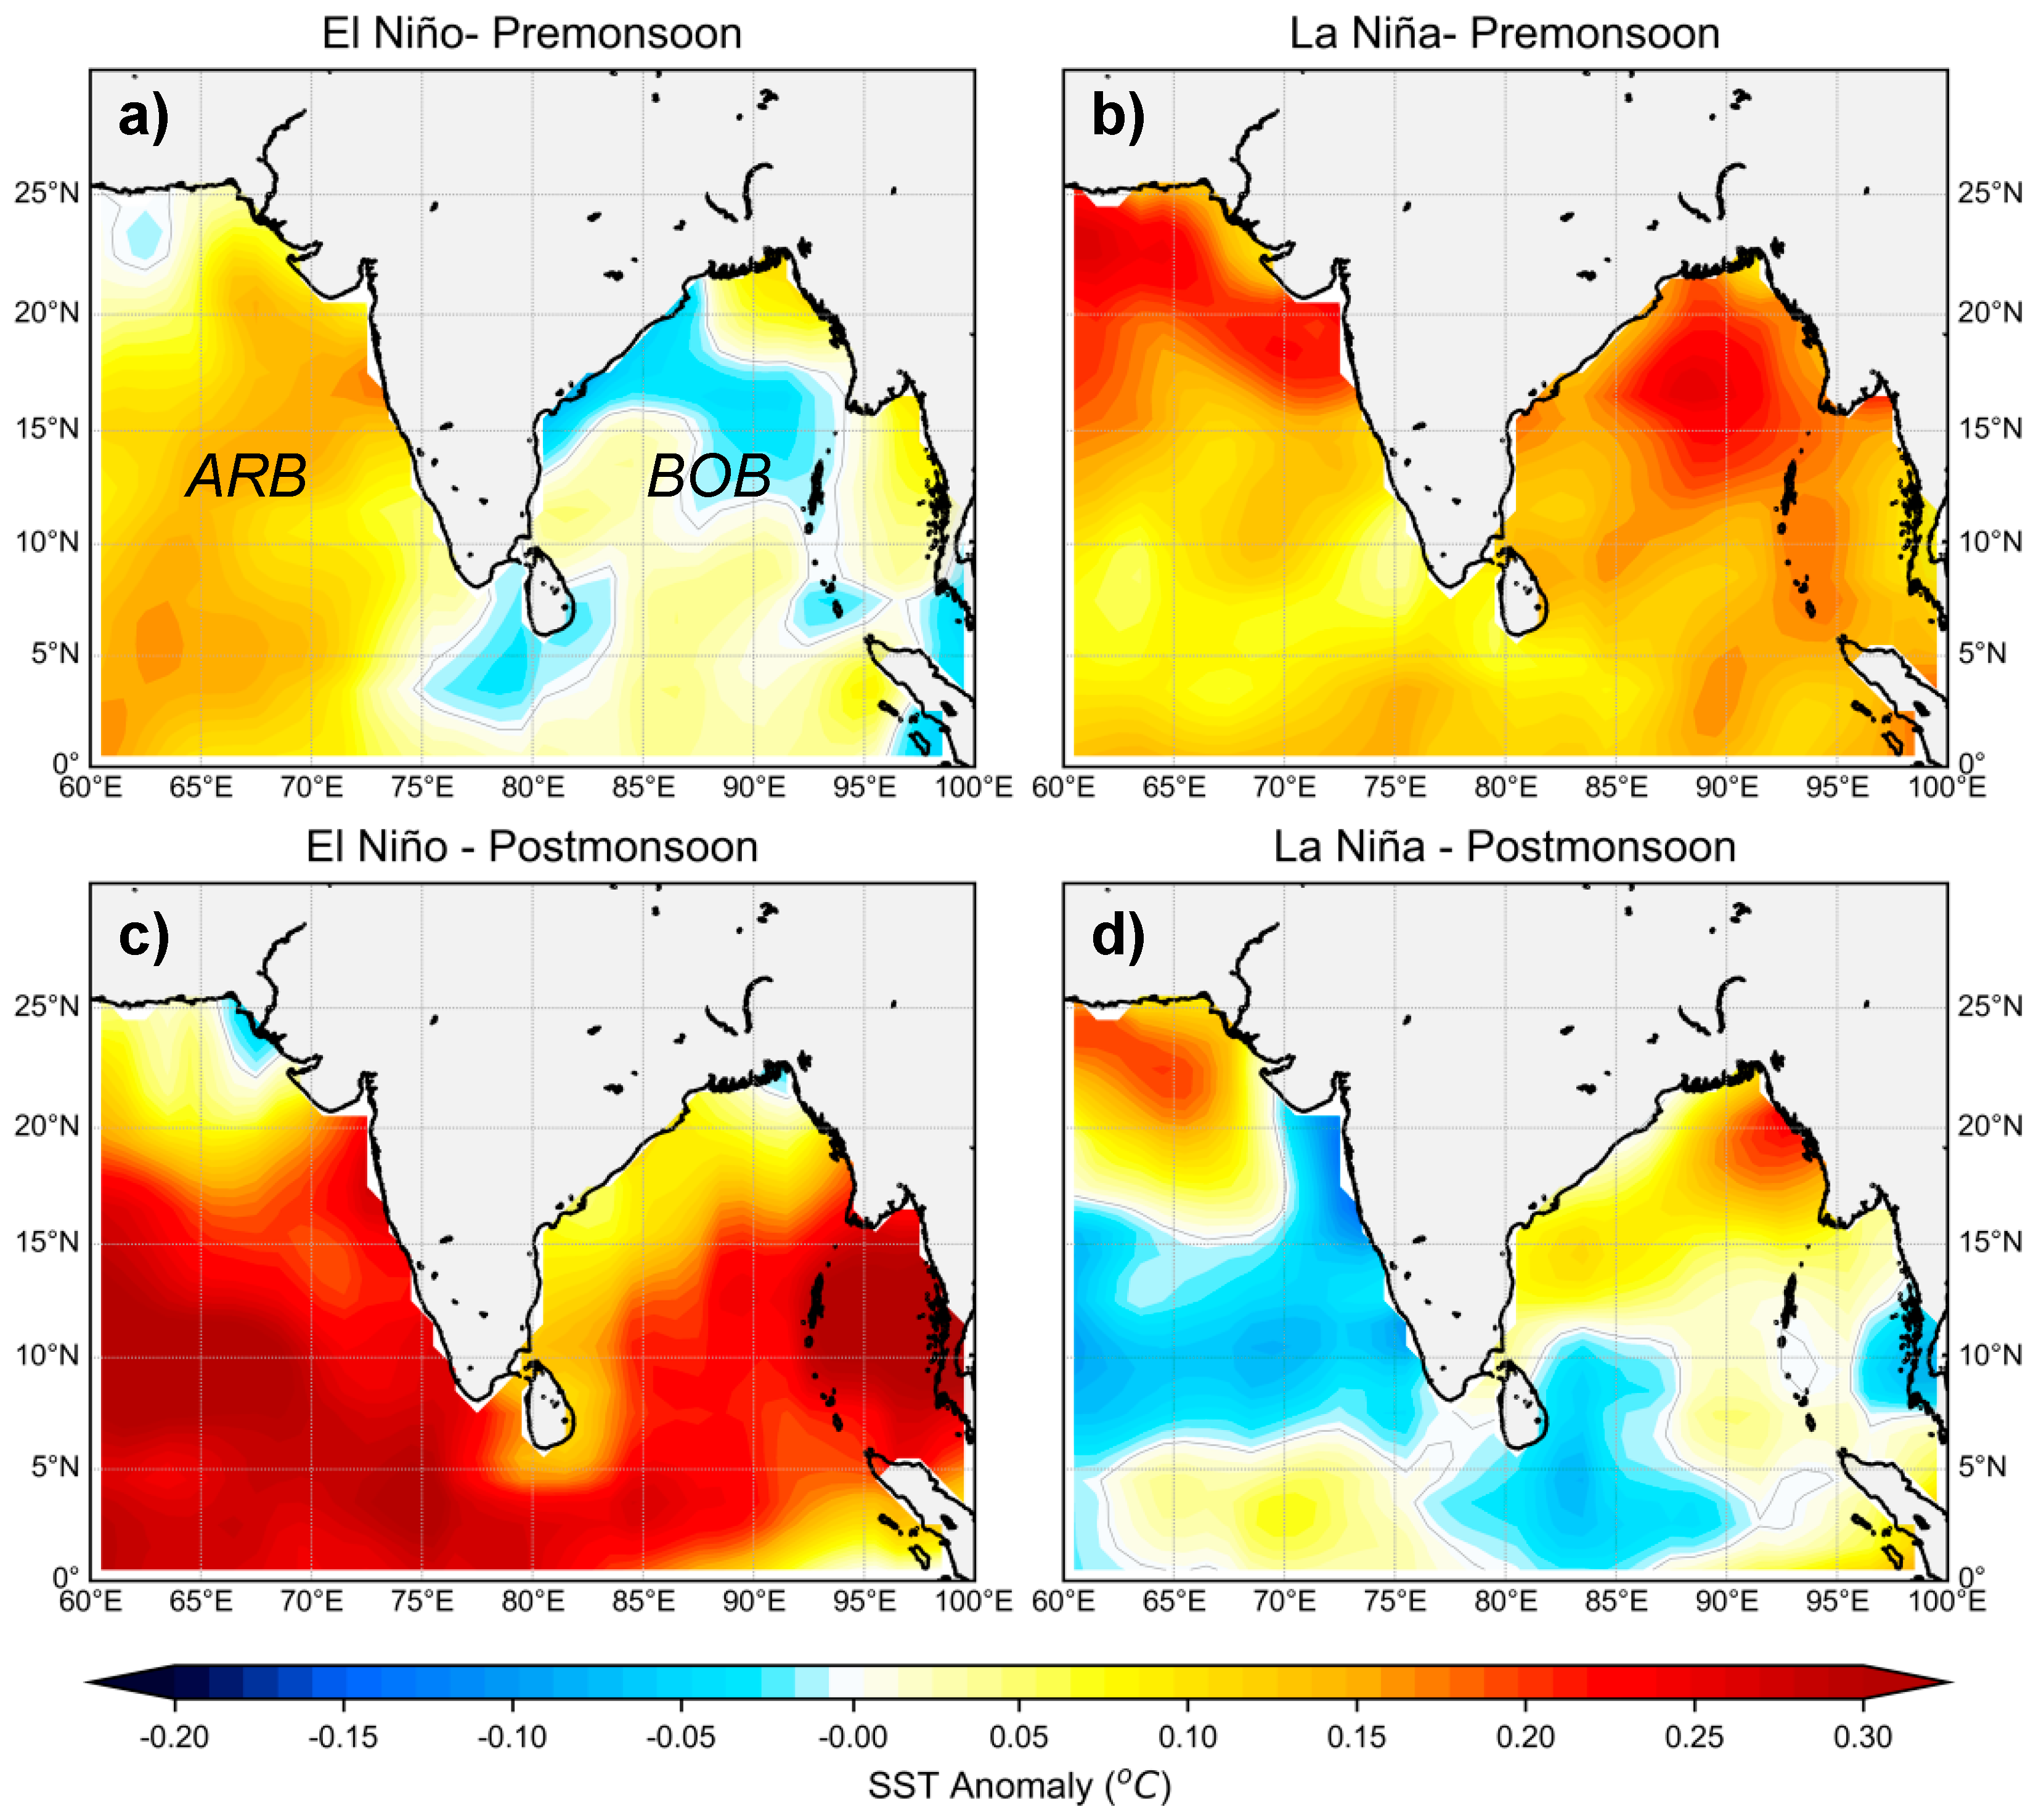
Figure 6.
Vertical wind shear between 200 hPa and 850 hPa for the (a) El-Nino-premonsoon and (b) La Nina-premonsoon, (c) El-Nino- postmonsoon season and (d) La-Nina postmonsoon.
Figure 6.
Vertical wind shear between 200 hPa and 850 hPa for the (a) El-Nino-premonsoon and (b) La Nina-premonsoon, (c) El-Nino- postmonsoon season and (d) La-Nina postmonsoon.

Figure 7.
Sea surface height (SSH) anomaly for (a,c) El-Niño and (b,d) La-Niña phase during (a,b) postmonsoon season and (c,d) premonsoon season.
Figure 7.
Sea surface height (SSH) anomaly for (a,c) El-Niño and (b,d) La-Niña phase during (a,b) postmonsoon season and (c,d) premonsoon season.

Table 1.
Duration in hours for cyclonic systems occurring during pre-monsoon and post-monsoon seasons in El Niño and La-Niña years (1990–2018) over BOB and ARB.
Table 1.
Duration in hours for cyclonic systems occurring during pre-monsoon and post-monsoon seasons in El Niño and La-Niña years (1990–2018) over BOB and ARB.
| Season | ENSO | Basin | D | DD | CS | SCS | VSCS | ESCS | SUCS |
|---|---|---|---|---|---|---|---|---|---|
| Pre-Monsoon | El Nino | AS | 78 | 54 | 216 | 66 | 0 | 0 | 0 |
| BOB | 138 | 108 | 330 | 102 | 90 | 102 | 24 | ||
| La-Nina | AS | 60 | 108 | 90 | 12 | 48 | 102 | 0 | |
| BOB | 282 | 132 | 162 | 84 | 0 | 0 | 0 | ||
| Post-Monsoon | El Nino | AS | 258 | 252 | 384 | 186 | 120 | 210 | 0 |
| BOB | 564 | 264 | 570 | 30 | 0 | 0 | 0 | ||
| La-Nina | AS | 528 | 564 | 174 | 60 | 0 | 0 | 0 | |
| BOB | 570 | 462 | 456 | 234 | 288 | 216 | 0 |
Table 2.
Number of TC cases during pre-monsoon and post-monsoon seasons in El Niño and La-Niña years (1990–2018) over BOB and ARB.
Table 2.
Number of TC cases during pre-monsoon and post-monsoon seasons in El Niño and La-Niña years (1990–2018) over BOB and ARB.
| Season | ENSO | Basin | CS | SCS | VSCS | ESCS | SUCS | Total |
|---|---|---|---|---|---|---|---|---|
| Pre-Monsoon | El Nino | ARB | 1 | 1 | 0 | 0 | 0 | 2 |
| BOB | 1 | 1 | 0 | 3 | 0 | 5 | ||
| La-Nina | ARB | 1 | 0 | 0 | 1 | 0 | 2 | |
| BOB | 2 | 2 | 0 | 0 | 0 | 4 | ||
| Post-Monsoon | El Nino | ARB | 2 | 3 | 2 | 4 | 0 | 11 |
| BOB | 7 | 0 | 0 | 0 | 0 | 7 | ||
| La-Nina | ARB | 1 | 0 | 0 | 1 | 0 | 2 | |
| BOB | 2 | 2 | 0 | 0 | 0 | 4 |
Disclaimer/Publisher’s Note: The statements, opinions and data contained in all publications are solely those of the individual author(s) and contributor(s) and not of MDPI and/or the editor(s). MDPI and/or the editor(s) disclaim responsibility for any injury to people or property resulting from any ideas, methods, instructions or products referred to in the content. |
© 2023 by the authors. Licensee MDPI, Basel, Switzerland. This article is an open access article distributed under the terms and conditions of the Creative Commons Attribution (CC BY) license (https://creativecommons.org/licenses/by/4.0/).
Share and Cite
MDPI and ACS Style
Das, D.; Chiao, S.; Roychoudhury, C.; Khan, F.; Chaudhuri, S.; Mukherjee, S. Tropical Cyclonic Energy Variability in North Indian Ocean: Insights from ENSO. Climate 2023, 11, 232. https://doi.org/10.3390/cli11120232
AMA Style
Das D, Chiao S, Roychoudhury C, Khan F, Chaudhuri S, Mukherjee S. Tropical Cyclonic Energy Variability in North Indian Ocean: Insights from ENSO. Climate. 2023; 11(12):232. https://doi.org/10.3390/cli11120232
Chicago/Turabian StyleDas, Debanjana, Sen Chiao, Chayan Roychoudhury, Fatema Khan, Sutapa Chaudhuri, and Sayantika Mukherjee. 2023. "Tropical Cyclonic Energy Variability in North Indian Ocean: Insights from ENSO" Climate 11, no. 12: 232. https://doi.org/10.3390/cli11120232
Note that from the first issue of 2016, this journal uses article numbers instead of page numbers. See further details here.