
Temporal Changes in Tourists’ Climate-Based Comfort in the Southeastern Coastal Region of Spain


1
Geography Department, University of Murcia, 30001 Murcia, Spain
2
Regional Geographic Analysis and Physical Geography Department, University of Alicante, 03690 San Vicente del Raspeig, Spain
*
Author to whom correspondence should be addressed.
Climate 2023, 11(11), 230; https://doi.org/10.3390/cli11110230
Submission received: 16 October 2023
/
Revised: 9 November 2023
/
Accepted: 14 November 2023
/
Published: 17 November 2023
(This article belongs to the Section Climate Change and Urban Ecosystems)
Abstract
:In the context of climate change, where the average temperature has risen in recent decades on the Mediterranean coast of the Iberian Peninsula, bioclimatic indicators show an increase in thermal discomfort. This is especially relevant in regions with a clear focus on mass and seasonal sun and beach tourism, with a large number of tourists experiencing discomfort in hot and humid summer environments. The research analyses the temporal evolution (1967–2022) of the coasts of the provinces of Alicante and Murcia (Spain) using the Climate Comfort Index (CCI), divided into four different regions. Used are 14 coastal meteorological observatories divided into four regions. Trend analysis was performed using the Mann–Kendall (MKT) and Theil–Sen (TSE) tests. The results revealed a loss of climate comfort during the summer season (−0.3 to −0.4/decade), as well as an expansion of the warm period toward June and early September, with an increase of 38.7 days in “hot” thermal comfort. The increase in thermal discomfort in the summer is influenced by an increase in average temperature (0.5 to 0.7 °C/decade) and a reduction in the average relative humidity (−1.0 to −2.1%/decade) and wind speed (−0.2 to −0.9 km/h/decade). In the last 22 years (2000–2022), decreases (p ≤ 0.05) have been recorded in July and September (−0.2 to −0.4/decade), reaching “excessive heat” climatic comfort thresholds for the first time. Finally, there has been an increase in thermal comfort in winter, especially during December in recent years (2000–2022).
1. Introduction
Bioclimatology has been extensively developed in recent years due to the close relationship existing between climate, health and certain economic activities related to the human enjoyment of the outdoors, such as tourism. With respect to this sector, a lot of research has been carried out to analyse the development of bioclimatic comfort and its relationship with suitability for tourism. Some studies provide necessary information on the perception of external microclimatic conditions in a coastal environment and differentiate tourists from everyday users of urban spaces [1]. Furthermore, Lopes et al. (2021) conclude that the influence of microclimatic conditions on the thermal comfort of tourists was evident [2]. It is a concept which, despite its usefulness in the current context of climate change, has not been sufficiently managed in urban planning, particularly with the recent intensification of heat islands in large urban nuclei and the impact of extreme events related to high temperatures in the city.
On the other hand, studies have been conducted that apply comfort indices to tourism activity, due to its high degree of exposure to climate conditions and the high share of Growth Domestic Product (GDP) that it represents in the regions and destinations that develop this economic activity. Hence, the effect that the current climate change process could have on the future evolution of tourism activity, particularly the sun and beach model, is concerning. Therefore, in recent years, the comfort conditions in different parts of the world with a clear tourism vocation or significant tourism potential have been analysed so as to be used in planning and decision-making at different scales. From the 1970s, coinciding with a moment of accelerated economic growth in many western economies and with the development of the first tourism wave after the Second World War [3], the field of study of tourism climatology was developed, and since its establishment, has evolved, addressing the climate–tourism binomial in the 1990s, and currently analysing the factors that limit the practice of tourism [4,5,6]. Thermal comfort has been the object of many studies in recent years within the context of global thermal warming [7,8]. In this respect, different studies have confirmed the loss of thermal comfort recorded due to the considerable increase in “tropical nights” over the last few decades in different regions of the world, with a notable incidence in the coastal areas of the Mediterranean basin, related to the warming of seawater [9].
In order to assess the impact of climate variables on the human organism, the concept of thermal comfort was developed [10], defined by the environmental conditions (air humidity, wind speed, radiation and temperature) that maintain the losses and gains of the human organism to achieve the minimum thermoregulatory balance, without cold or heat stress [11,12]. In the 1970s some cold indices emerged [13]. Subsequently, so-called “comfort indices” appeared, classified as quantitative, qualitative and hybrid [14]. Initially, the quantitative indices were based on theoretical models to calculate the thermal balance of a person, including, among others, the comfort index [15].
Currently, thermal comfort is defined from an international point of view using the ISO 2005 or ANSI/ASHRAE [16], which, in addition to physical or physiological factors, establishes psychological or emotional factors as part of cold or heat sensations, that is, subjective perceptions that form part of the cognitive process. This idea has led to many debates in the scientific community in order to arrive at a consensus in defining human thermal comfort, although currently efforts are complex due to the component of human perception [17].
Over the last few years, several bioclimatic indices and climate–tourism indices have been consolidated to quantify thermal sensations and define comfort thresholds. They are widely used today and have provided a basis for more recent comfort indices. They include the apparent temperature index [18], the equivalent temperature index [19], the Universal Thermal Climate Index (UTCI) [20] and the comfort index (CI) [21]. Furthermore, recent studies have shown discrepancies between the predictions of the indices and predicted and real thermal sensations [22]. Today, studies prefer to estimate the thermal sensation using thermophysiological indices such as the Physiological Equivalent Temperature (PET) and the UTCI [23,24].
The current context of change and global warming forebodes a greater frequency of hot days throughout the year, giving rise to increasingly severe summers in tropical and sub-tropical countries, leading to a loss of thermal comfort for visitors [25]. This aspect could be particularly relevant in a city climate, where bioclimatic urbanism is attempting to adapt to these new realities [26].
The most recent studies have been carried out in different cities around the world, focusing mainly on the thermal perception of the local residents and foreign visitors [27], where acclimatisation leads to differences in thermal perception in several climate zones [28,29,30]. Lin conducted an analysis in the city of Taichung (Taiwan), finding that the acceptable thermal range is greater than in European cities [31]. Therefore, foreign visitors experience different climate perceptions from residents. This is a fundamental aspect in the climate planning of tourism [25].
The perceived control defined by Nikolopoulou and Lykoudis concludes that people with a greater freedom of movement in hot conditions have greater thermal satisfaction than those with stricter timetables and a low level of autonomy [32,33]. Thorsson et al. find that with a higher level of thermal comfort, tourists remain outdoors for longer [34]. Analyses have been carried out in several thermal studies for different cities, mainly in Europe [35,36], and have generated interesting conclusions. In Australia (Sydney), no differences were found with respect to gender in the perception of heat [37]. Kenawy and Elkadi affirmed that the inhabitants of America, north-east Europe and Australia had a higher average thermal sensation than Asian inhabitants in the summer, which implies that this latter group had greater difficulty withstanding the heat [38].
Pantavou evaluated the performance of a large number of thermal indices to quantify the thermal sensation in the area of Athens (Greece) [39]. The ASV index, the subjective temperature index (STI) and the universal thermal climate index (UTCI), based on calibrated scales, better predicted the thermal sensation compared to the rest of the indices studied.
Picone and Campo analysed the regional conditions in Tandil (Argentina) using three summer indices and one winter index, finding that cities with a warm climate generate less comfort in the summer than in the winter [40]. The following year, the seasonal characteristics of the tourist flow were analysed using the Temperature-Humidity Index (THI) using data from Weather Underground’s network of personal weather stations [41].
In Spain, studies analysed the thermal evolution in Barcelona are noteworthy [42,43] due to the importance of the size of cities in local changes in temperatures [44,45] and their negative effects on mortality during hot nights [46]. These studies draw from the classical contributions of the concept of “heat islands” developed in this field [47,48].
There are different indices for the study of thermal comfort, such as the effective temperature index, the Hill index, the bioclimatic diagrams of Olgyay and Givoni and the PMV and PPD indexes, which are adapted for different research objectives: human comfort and urban and building design [10,49]. Due to the availability of climate data with a high spatial resolution, some studies use the Climate Comfort Index of Mieczkowski to assess the current situation and make forecasts until the end of the century [50]. The use of this index has been tested in previous studies with adequate results and has been shown to be ideal for tourist suitability estimates for a territory [51,52].
In recent years, the climate–tourism index (ICTI) proposed by Mieczkowski has been used for the interior of the Iberian Peninsula (Madrid) and the province of Alicante in order to confirm the possibilities and limitations for evaluating climate and its influence on this type of tourism and the climate–tourist aptitude for future decades [51]. In the field of the impact of climate change on tourist destinations (region of Valencia), the Mieczkowski index has been modelled to analyse the modifications predicted until the end of this century, with a view to develop measures for the adaptation of tourism activity [53,54]. Meanwhile, within the framework of climate change regulations (state and regional), plans have been developed for adapting to climate change in tourist destinations that include the analysis of thermal comfort and the future projection of comfort indices [55].
The most recent studies on climate comfort have been developed in Andalusia (Spain), applying the discomfort index of Thom [56] and the associated weather types to the eight provincial capitals [57]. Moreover, Colón Lasierra analyses the climate comfort in the Spanish peninsula and its coast–inland variations, also using Thom’s discomfort index. This study generates daily calendars of the probability of surpassing certain discomfort thresholds in the different observatories [58].
The objective of this research is to analyse climate comfort in the territory of the southeast of the Iberian Peninsula. The conclusions will be relevant in the scientific community to address future tourism planning on the coast of SE Spain. The policies applied during the coming years must take into account the changes experienced in thermal comfort in recent decades, and especially during the last few years in a region with great tourist pressure in summer. To this end, previous studies on the subject conducted for the chosen area of study have been analysed and, based on the knowledge of the evidence of climate change recorded in the Spanish Mediterranean region, the following objectives have been established: to conduct a comparative analysis of different climatic comfort indices in order to evaluate the results and the suitability of their application to the study area; to study the recent evolution of climatic comfort indicators in the context of climate warming, highlighting the loss of comfort produced in recent decades; to also evaluate the temporal evolution of climatic comfort in the areas analysed throughout the year, with a view to the future establishment of more favorable tourist seasons; to use two different time periods, a longer-term one (1967–2023) with the aim of identifying the changes occurring in recent decades and a more recent one (2000–2022), analysing the most recent changes with a greater density of meteorological stations used and finally, to verify the data used via quality controls, particularly according to less used climatic elements (wind speed, relative humidity and solar radiation).
2. Materials and Methods
2.1. Study Area
The analysis of the climate comfort indices used and their associated meteorological variables were obtained from 14 weather observatories located in coastal and pre-coastal areas of the provinces of Alicante and Murcia (Figure 1). Of these, three observatories of the principal network of the Agencia Estatal de Meteorología (AEMET) were used with a daily period of data between 1967–2022, together with 11 meteorological observatories belonging to the Sistema de Información Agroclimática para el Regadío (SIAR) attached to the Ministry of Agriculture, Fishing and Food of the Government of Spain (2000–2022) (Table 1).
2.2. Dataset Description and Preprocessing
Meteorological variables on a daily scale of temperature (T), relative humidity (RH) and wind speed (Vm) were used. Statistical characterisation enabled the calculation of different climate comfort indices, which we will see later, and in which the monthly and annual time trend has been analysed in two intervals, a more extensive one (1967–2022) and a more recent one (2000–2022).
The meteorological variables analysed from the 14 observatories underwent quality control processes using the Climatol statistical package. For the homogenisation and subsequent reconstruction of the meteorological series, a second procedure was carried out using R Studio’s Climatol 3.1.1 package [59] (https://CRAN.R-project.org/package=climatol) (accessed on 12 April 2023). It contains functions for quality control, homogenisation and the filling of missing data in a group of series of any climate variable. The function of the homogenisation process includes the filling of missing data, the detection and correction of atypical values and changes in the mean of the series. With the “homogen” function of the Climatol package, a large amount of information is generated related to the first exploratory examination, and subsequently, in the homogenisation process:
where Ttest is the daily data file, dz.max is the standard deviation threshold in the analysis of outliers or abnormal data, snht1 is the rejection threshold of the homogeneity test when it is applied to the whole period and snht2 when it is applied to time windows.
homogen (‘Ttest’, año inicio, año final, dz.max, snht1, snht2)
The homogenisation process generates different parameters that reflect the quality of the process and the new meteorological series generated:
- ▪
- ACmx: Absolute maximum autocorrelation of abnormalities by station.
- ▪
- SNHT: Standard normal homogeneity test in series of abnormalities.
- ▪
- RMSE: Mean squared error of the estimated data.
- ▪
- N° of ruptures or inhomogeneities of each weather station.
- ▪
- POD: Percentage of original data of the series that has been homogenised. To analyse time trends, the series with the highest percentage of original data (POD) is chosen for each homogenised observatory.
2.3. Trend Analysis
The time trend analysis was calculated using the Mann–Kendall test (MKT) [60,61]. In order to quantify the rate of temporal change, a trend line slope and Theil–Sen analysis (TSE) is used [62,63]. All trends were evaluated at a statistical significance of 0.05 (confidence level of 95%).
The MKT statistic S is that which has a mean of zero and a variance computed by Equation (3). Is calculated using Equations (1) and (2) and is asymptotically normal:
where S is the number of positive differences less the number of negative differences, n is the number of data points, m is the number of tied groups (a tied group is a set of sample data having the same value), and ti is the number of data points in the group. In cases where the sample size n > 10, the standard normal variable Z is computed by using Equation (4).
S = ∑k = 1n − 1∑j = k + 1nsgn (xj − xk)
sgn(xj − xk) = {+1 if (xj − xk) > 00 if (xj − xk) = 0 − 1 if (xj − xk) < 0}
Var(S) = [n(n − 1)(2n + 5) − ∑i = 1m ti(ti − 1)(2ti + 5)]18
Z = {S − 1Var(S)if S > 00 if S = 0S + 1Var(S)if S < 0}
Positive values of Z indicate increasing trends, while negative values of Z show decreasing trends. When testing either increasing or decreasing monotonic trends at an α significance level, the null hypothesis was rejected for an absolute value of Z greater than Z1−α/2, obtained from the standard normal cumulative distribution tables.
The TSE model for the trend magnitude is conducted by calculating the slopes of all possible combinations of data pairs (Equation (5))
The final slope βˆ1 is then defined as the median of all slopes (Equation (6)):
Because the TSE computes the trend line’s slope alone, the model “intercept βˆ0” can be given by (Equation (7)):
where Xmedian and Ymedian are the medians of the measurements and of the response variables, correspondingly.
β0 = Ymedian − ˆβ1 × Xmedian,
This study analyses climate comfort via the use of the Climate Comfort Index (CCI). The indices described below have been subjected to a time trend analysis for each of the 14 meteorological observatories, divided into four different regions using a clustering process (Table 2). The Marina Alta of Alicante (C1) is characterised by a very rugged orographic coastline, with a very close mountain system that influences a more humid and less warm climate. Further south, the Vega Baja del Segura (C2) is a wide pre-coastal and coastal plain with very low altitudes and few mountain systems. This is an area with very high maximum temperatures in summer. For its part, Campo de Cartagena (C3) is a large low-altitude hydrographic basin characterised by less hot minimum temperatures in summer. Finally, on the southern coast of the study area (C4), its steeper coast and nearby mountain systems to the north stand out. It has very high average temperatures and low to average relative humidity.
2.4. Climate Comfort Index (CCI)
This study analyses climate comfort through the use of the CCI. The indices described below have been subjected to a time trend analysis for each of the 14 meteorological observatories, divided into four different regions using a clustering process (Table 2).
The CCI proposed by González [19] is adapted and adjusted from the Cooling Power of Leonardo Hill and Morikofer-Davos with some modifications: first, a comfort index IC is obtained instead of a cooling power; second, the humidity parameter is included and third, the base values for each of the parameters are modified so that the results are more appropriate for our conditions, taking into account the change in temperature with altitude, as the relief in the country is an important factor (Table 3).
The CCI is a function of the air temperature, relative humidity and wind speed measured at 10 m. In this case, the geographical coordinates of each weather station influence the results. Therefore, there are three variants of each of the formulas, depending on the altitude of the place: one for those with altitudes of under 1000 m, another for those at altitudes of between 1000 and 2000 and a final one for those higher than 2000 m.
All the observatories used in the analysis are located at an altitude of less than 1000 m, as they are coastal areas (Table 1). The following equation is used (8):
CCI = (36.5 − TM) (0.05 + 0.04 √WS10m + HR250)
TM = Average daily temperature (%)
WS10m = Average daily wind speed (%)
RH = Average daily relative humidity (%)
3. Results and Discussion
3.1. Climate Comfort Index (CCI)
3.1.1. Characterisation and Time Trend (1967–2022)
The CCI incorporates the average temperature, average relative humidity and the variable of average wind speed for the analysis of climate comfort. The lower the average daily wind speed, the higher the thermal sensation or discomfort. With a reduction in its speed, the wind does not exercise its thermoregulating role. In the same way, in this case, the CCI index reflects that the lower the average relative humidity and wind speed, the higher the discomfort sensation. In other words, with a constant temperature, the thermal heat sensation is higher with a weak and dry wind flow. Therefore, a faster and humid wind flow is more cooling.
On this occasion, the lowest IC indices reflect the conditions of greater climate discomfort in the summer season. The observatory recording the lowest values is that of Alicante Airport, mainly due to the lower average relative humidity and a wind speed that is generally weak during the summer period. Meanwhile, the observatory of the San Javier Aerodrome has the highest indices, due to an average relative humidity that is higher by almost 10 points and a much higher average wind speed during the summer months.
Only the observatory of Alicante Airport is close to the threshold of excessive heat during the summer months (>3.0), although the rest of the observatories record a long period of heat (5.0–3.0) for a large part of the central months of the year (Figure 2).
With respect to the changes experienced by the CCI between the two time periods analysed (1967–1994 and 1995–2022), the greatest decreases (more climate discomfort) occurred in the first half of March, between the third week of April and the first week of July and finally between the last week of October and the second week of November and the last week of December (Figure 3).
On the other hand, the month of January, the second half of March and the first half of April and the second half of November and the first half of December obtained results with few significant changes, even with slight occasional increases.
Table 4 shows the changes in the different thresholds throughout the year in time windows of 30 years. The “warm” threshold period increased by 36 days in Alicante, 32 in Alicante Airport and 31 in San Javier. Furthermore, changes occurred in the annual distribution with the period from 15 May being brought forward to 23 April in Alicante, from 23 to 8 May in Alicante Airport and from 7 June to 13 May in San Javier. Similarly, the warm period lasted longer, with a change from 30 October to 3 November in Alicante, from 8 to 25 October in Alicante Airport and from 8 to 14 October in San Javier.
Meanwhile, the “hot” threshold period (the highest thermal sensation of the year) has also increased significantly (Figure 4). It increased by 28 days in Alicante, 42 in Alicante Airport and 46 in San Javier (Figure 5). These increases are considerable due to the change in the beginning of the period, being brought forward from 26 to 10 June in Alicante, from 6 July to 11 June in Alicante Airport and from 24 July to 26 June in San Javier. The change at the end of the period is also relevant, being extended from 13 to 25 September in Alicante, from 29 August to 15 September in Alicante Airport and from 26 August to 13 September in San Javier (Table 4).
A considerable increase (p ≤ 0.05) in the average monthly temperature was recorded in the observatories analysed, particularly during the months of June (0.6 °C/decade) and July/August (0.5 to 0.6 °C/decade) (Table 5). There was also a decrease in the average relative humidity in the summer season (decreases between −2.1 and −0.6%/decade between June and August). Here, it should be added that the average wind speed decreased in the period of study (1967–2022), particularly in the months of October, November and December (−0.8 to −0.5 km/h/decade), but also in the summer season (−0.1 to −0.9 km/h/decade), particularly in Alicante Airport. This explains the conditions that are leading to an increasingly higher heat thermal sensation during the summer months.
The lowest absolute records of the CCI index were made on 13 August 2022, with values of 0.56 in San Javier, 0.34 in Alicante and 0.18 in Alicante Airport (13 August 2022). On this day, the average daily temperature was recorded as 35.3 °C and the average relative humidity was 7.0%, while the average wind speed was only 4.2 km/h in Alicante Airport, which gave rise to conditions that were within the excessive heat threshold (0–3). These conditions are potentially dangerous for the human body.
Figure 6 shows the temporal evolution of the summer average of the CCI index during the period of study (1967–2022). There has been a noteworthy increase in recent decades. The top part of the figure shows the average trend of the summer quarter, which was between −0.3 and −0.4 °C/decade (p ≤ 0.05). Summers have an increasing incidence of greater climate discomfort in the observatories analysed. Furthermore, the highest thermal sensation during each summer has risen over the last few decades, particularly in recent years.
3.1.2. Characterisation and Time Trend (2000–2022)
The CCI indicates the most important heat thermal sensations for the period of study 2000–2022 in the C4 region (southern coast of the region of Murcia), which recorded the only average values in the summer season to reach threshold 3 (excessive heat) (Figure 7). The rest of the regions recorded values within the “heat” threshold (between 5 and 3). The records of the coastal and pre-coastal spaces analysed vary between the pleasant and warm thresholds during a good part of the year. Specifically, the conditions are pleasant from the end of October until the start of May.
Figure 8 reflects the changes experienced in the CCI index in the period of the last 22 years (2000–2022). The greatest decreases (toward more comfort) have occurred during the months of January, February and the first half of March, the first half of May and, particularly, the first week of November and the month of December.
Table 6 shows the variation in the time periods of the “warm” and “hot” thresholds in the intervals 2001–2011 and 2012–2022. The time period with a “warm” threshold was shortened by a total of 3 days in C1, by 4 days in C2, increased by 3 days in C3 and finally increased by 13 days in C4. In general, the period was delayed from 23 April to 1 May in C1 and C2 and was brought forward from 4 to 5 of May in C3 and from 18 to 6 April in C4. The final part of the period has extended from 1 to 6 November in C1, from 12 to 16 November in C2, from 1 to 5 of November in C3 and from 16 to 17 November in C4.
The number of days with the highest thermal discomfort in the period 2012–2022 appearing within the “hot” threshold also experienced a significant increase (Figure 9). Increases of 6 days were recorded in C1, of 8 days in C2, of 9 days in C3 and finally of 11 days in C4. The beginning of the period was brought forward from 12 to 10 June in C1, from 8 to 16 June in C2, from 13 to 10 of June in C3 and finally from 5 June to 28 May in C4. On the other hand, the final part of the period was prolonged from 14 to 18 September in C1, from 25 September to 5 October in C2, from 19 to 25 September in C3 and from 4 to 7 October in C4.
The time trends reflect the greater increases during the months of March and April (0.2 to 0.4/decade) as a whole, with June and October also being relevant (p ≤ 0.05). Meanwhile, greater decreases throughout the year (more discomfort) have occurred during the summer months (particularly between the second week of July and the second week of August) and December (−0.1 to −0.2/decade). It is important to note that the average wind speed is reducing (statistically significant) for much of the year in the recent period of study, particularly during the summer months (−0.1 to −1.0 km/h/decade) (Table 7). This point is highly relevant for explaining the increase in discomfort during the summer season.
Figure 10 shows the changes occurring in the CCI index during the period 2000–2022 in the summer season. Slight decreases can be observed in the four clusters analysed, particularly the southern coast of the region of Murcia (C3) with a statistically significant decrease of −0.2/decade (p ≤ 0.05). The most striking aspect is the sharp decrease in more recent years, particularly in the summer of 2022, with averages lower than 3.5. Meanwhile, on the days with the highest level of discomfort throughout the year, the most relevant decreases recorded were from −0.1 to −0.4/decade (p ≤ 0.05). In the last few summers, there has been a considerable decrease in days with a high thermal sensation score, with values lower than 1.0 being recorded in most regions during the summer of 2022. These values are close to the 0 °C threshold, which constitutes extreme heat thermal sensations.
It is recognised that climate is a transcendental environmental resource for the development of tourist activity, playing a fundamental role in the duration, quality and location of activity and even the health of tourists [53]. In recent years, the influence of the summer climate on tourist development on the southeastern coast of the Iberian Peninsula has begun to be studied.
The results obtained in the CCI analysis show a notable decrease in climatic comfort throughout the year, but especially in the warm season (JJA). “Hot” threshold thermal sensations have increased over the past 6 decades, with a change from 7 weeks (1967–1987) to 11 weeks (2002–2022). In short, the most stifling summer heat characteristics have increased in 1 month. These results are homogeneous with the conclusions obtained from the different analyses of other authors in the Iberian Peninsula and Europe.
Nastos and Matzarakis affirm that the decision to travel is associated, on the one hand, with the physical and economic potential of individuals and, on the other hand, with their preferences, shaped by many elements, including the climate of their place of residence and the characteristics of the chosen destination (landscape, climate and culture) [64]. Therefore, some population groups may be more sensitive to thermal stress than others [65]. After analysing the CCI index used in two different time periods, one which is longer term (1967–2022) and another that analyses the changes in the last 22 years (2000–2022), the conclusion can be drawn that the different comfort thresholds are experiencing significant changes in terms of intensity and occurrence throughout the year.
The results obtained in the annual characterisation of the different locations analysed corroborate the conclusions of other studies. The comfort index (CCI) is exceeded in a time period spanning from 1 May to 1 October on the Almería coast, the interior of Seville and Jaén, while this study concludes that this time period ranges from 23 April to 3 November in the city of Alicante. Colón Lasierra [58] finds that in the cities analysed in Spain (La Coruña, San Sebastián, Zaragoza, Madrid Alicante and Cádiz), comfort “has worsened” (significantly increasing) over the last 50 years, fundamentally due to the overall increase in temperature. The author concludes that the time trend in Alicante corresponds to an increase of 0.3 °C/decade, similarly to the annual average temperature (1968 to 2017). The research also concludes a trend of 0.3 °C/decade in the three observatories analysed and increases of 0.3 to 0.4 °C in the average temperature (1950–2022).
In the same way, Amezúa Arranz [66] determines that the “excessive heat” sensation does not occur in Central Europe, although the warm to hot threshold does exist in the most southern sector of Europe. This author also affirms that the variation in the value of the CCI for Eastern Europe, Central Europe and the Balkans does not exceed 0.4/decade. A change in the index of between 0.2 and 0.3 predominates in the time period 1961–2010 with values very similar to those obtained in this research.
The importance of the study of climatic discomfort in coastal areas is demonstrated by the combination of high average temperatures (T) and very high values of relative humidity (RH). In summer (JJA), the resulting indices can become even more important than in interior territories of extreme heat (Spain). Martín González determines that the highest values of Thom’s IC reach 29.81 in the city of Seville and 28.10 °C in Córdoba during the summer. For their part, coastal territories in southern Spain such as Cádiz or Almería reach 29.15 and 29.60, respectively [57]. This reinforces the thesis of the extremely unfavorable conditions that occur on the coast during the summer period.
Miró Pérez et al. conclude that there is a clear loss of comfort in the summer in the Spanish Mediterranean region, essentially due to an increase in the heat episodes associated with a low level of comfort [52]. However, the opposite is true for winter. In this case, there is an improvement in comfort throughout the whole province. The changes in autumn are very small. These conclusions are similar to those obtained in this research, with a considerable increase in comfort during the winter, particularly during December. All of this determines changes in the annual distribution of the different thermal thresholds, extending the summer high season of July/August to June and September. Furthermore, the highest mountainous areas, which decades before had strong seasonality in winter for snow tourism, could expand their offer to the rest of the year, as they have less suffocating summers than coastal and pre-coastal areas.
4. Conclusions
The research aimed to analyse and corroborate the increasingly warmer thermal conditions on the southeastern coast of Spain, especially in summer. The following conclusions were drawn, highlighting the notable increase in thermal discomfort in the study area.
On the coast of the provinces of Murcia and Alicante, the “heat” threshold is reached but not the “excessive heat” threshold (1967–2023). However, in the most recent time period (2012–2022), the threshold of the greatest discomfort due to heat was reached for the first time in the second week of July within the southern coast cluster of the region of Murcia. The greatest losses of comfort in the CCI index (1967–2022) occurred between mid-April and the first week of July, constituting an advance in time of 3 weeks for the “heat” threshold. Furthermore, over the last few decades, there has been an increase of 38.7 days throughout the year. In the period 1967–2022, there was a statistically significant decrease in the CCI in every month of the year, particularly May and June (−0.3 to −0.4/decade). During these months, the greatest (statistically significant) increase in the average temperature occurred (0.5 to 0.7 °C/decade), together with the greatest reduction in relative humidity (−1.0 to −2.1%/decade) and wind speed (−0.2 to −0.9 km/h).
In the most recent time period (2000–2022), the greatest decreases in the CCI occurred in the winter quarter (DJF), specifically between the second week of December and the second week of February, obtaining less cold and more comfortable thresholds. In the summer quarter (JJA), the changes have not been so significant in the last few years (2000–2022). Even so, in barely 22 years, statistically significant decreases have occurred in July and September in the regions C2 and C4 (−0.2 to −0.4/decade), reaching “excessive heat” thresholds for the first time. This is principally due to the statistically significant increase in the average temperature between July and September (0.4 to 0.7 °C/decade) and to the reduction (also statistically significant) in wind speed (−0.3 to −0.9 km/h/decade). Therefore, there has been an average increase of 8.5 days on which the “heat” threshold was reached throughout the year.
The research now opens to a broader analysis, including the rest of Spain’s coastline (and the two archipelagos of the Canary Islands and the Balearic Islands). A future line of research would work with data from the ERA-5 reanalysis of the Copernicus Project (1940–2022), mainly due to the limitation of surface observational data (very limited daily meteorological series for the decades of the 50s, 60s and 70s). This type of tourism based on visiting beaches, museums, shows, family attractions, parks and gardens, old towns, shopping, gastronomy on terraces, nightlife, etc. delimits tourism by activity schedules. Introducing a time scale will allow planning, taking into account the climate–tourism time suitability based on comfort scenarios, extending or reducing tourist days.
Author Contributions
Each author contributed to the reported research: D.E.-S. carried out the methodological development, consequence of results and writing of the discussion. J.O.-C. wrote the information related to the state of the art, scientific background, bibliography, as well as the review of the methodology used. C.C.-G. participated in the review of the results and formal aspects of the manuscript, related to the writing, the structure and translation into English. All authors have read and agreed to the published version of the manuscript.
Funding
This research received no external funding.
Data Availability Statement
The data presented in this study are available on request from the corresponding author. The data are not publicly available because they have been obtained from the Spanish State Meteorological Agency (AEMET).
Acknowledgments
Within the framework of the Program for the Requalification of the Spanish University System during the 2021–2023 triennium (Margarita Salas Scholarship), this work was “financed by the European Union—NextGenerationEU”.
Conflicts of Interest
The authors declare no conflict of interest.
References
- Lopes, H.S.; Remoaldo, P.C.; Ribeiro, V.; Martin-Vide, J. Perceptions of human thermal comfort in an urban tourism destination—A case study of Porto (Portugal). Build. Environ. 2021, 205, 108246. [Google Scholar] [CrossRef]
- Rutty, M.; Scott, D. Bioclimatic comfort and the thermal perceptions and preferences of beach tourists. Int. J. Biometeorol. 2015, 59, 37–45. [Google Scholar] [CrossRef]
- Besancenot, J.P. Clima y Turismo; Masson: Barcelona, Spain, 1991. [Google Scholar]
- Millán López, A. Propuesta de adaptación del índice turístico de Mieczkowski al turismo de interior de la Península Ibérica: El caso de Madrid. In Proceedings of the X Congreso AEC, Alicante, Spain, 5–8 October 2016. [Google Scholar] [CrossRef]
- De Freitas, C.R.; Grigorieva, E.A. A comparison and appraisal of a comprehensive range of human thermal climate indices. Int. J. Biometeorol. 2017, 61, 487–512. [Google Scholar] [CrossRef]
- Tanana, A.B.; Ramos, M.B.; Gil, V.; Campo, A.M. Confort climático y turismo. Estudio aplicado a diferentes niveles de resolución temporal en Puerto Iguazú, Argentina. Estud. Geográficos 2021, 82, e064. [Google Scholar] [CrossRef]
- Vardoulakis, E.; Karamanis, D.; Fotiadi, A.; Mihalakakou, G. The urban heat island effect in a small Mediterranean city of high summer temperatures and cooling energy demands. Sol. Energy 2013, 94, 128–144. [Google Scholar] [CrossRef]
- Royé, D.; Martí Ezpeleta, A. Análisis de las noches tropicales en la fachada atlántica de la península ibérica. Una propuesta metodológica. BAGE 2015, 69, 351–368. [Google Scholar]
- Olcina Cantos, J.; Serrano-Notivoli, R.; Miró, J.; Meseguer-Ruiz, O. Tropical nights on the Spanish Mediterranean coast, 1950−2014. Clim. Res. 2019, 78, 225–236. [Google Scholar] [CrossRef]
- Fernández García, F. Clima y confortabilidad humana. Aspectos metodológicos. Ser. Geográfica 1994, 4, 109–125. [Google Scholar]
- Matzarakis, A. Assessment method for climate and tourism based on daily data. Dev. Tour. Climatol. 2007, 1, 1–7. [Google Scholar]
- De Freitas, C.R.; Scott, D.; McBoyle, G. A second generation climate index for tourism (CIT): Specification and verification. Int. J. Biometeorol. 2008, 52, 399–407. [Google Scholar] [CrossRef]
- Oliver, J.E. Climate and Man’s Environment: An Introduction to Applied Climatology; John Wiley & Sons Inc.: Hoboken, NJ, USA, 1973. [Google Scholar]
- Fernández García, F. Fundamentos físicos y métodos de evaluación del confort climático en los estudios de Bioclimatología humana. In Proceedings of the VI Reunión Nacional de Climatologia, Santiago de Compostela, Spain, 14–16 September 2000; Asociación de Geógrafos Españoles: Santiago de Compostela, Spain, 2003; pp. 135–170. [Google Scholar]
- Houghton, D. Handbook of Applied Meteorology; John Wiley & Sons Inc.: New York, NY, USA, 1985. [Google Scholar]
- ASHRAE. Thermal Environmental Conditions for Human Occupancy; American Society of Heating, Refrigerating and Air-Conditioning Engineers, Inc.: Atlanta, GA, USA, 1992. [Google Scholar]
- Shashua-Bar, L.; Pearlmutter, D.; Erell, E. The influence of trees and grass on outdoor thermal comfort in a hot-arid environment. Int. J. Climatol. 2011, 31, 1498–1506. [Google Scholar] [CrossRef]
- Steadman, R.G. A universal scale of apparent temperature. J. Appl. Meteorol. Climatol. 1984, 23, 1674–1687. [Google Scholar] [CrossRef]
- Quayle, R.G.; Steadman, R.G. The Steadman wind chill: An improvement over present scales. Weather. Forecast. 1998, 13, 1187–1193. [Google Scholar] [CrossRef]
- Bröde, P.; Krüger, E.; Rossi, F. Assessment of urban outdoor thermal comfort by the Universal Thermal Climate Index UTCI. In Proceedings of the 14th International Conference on Environmental Ergonomics, Nafplio, Greece, 10–15 July 2011. [Google Scholar]
- González, O.C. Metodología Para el Cálculo del Confort Climático en Colombia; IDEAM; Instituto de Hidrología, Meteorología y Estudios Ambientales: Santa Fe de Bogotá, Colombia, 1998. Available online: http://documentacion.ideam.gov.co/openbiblio/bvirtual/007574/Metodologiaconfort.pdf (accessed on 15 May 2022).
- Monteiro, L.; Alucci, M.P. Outdoor Thermal Comfort: Comparison of Results of Empirical Field Research and Predictive Models Simulation; Comfort and Energy Use in Buildings; Nceub: Windsor, ON, Canada, 2006. [Google Scholar]
- Blazejczyk, K.; Epstein, Y.; Jendritzky, G.; Staiger, H.; Tinz, B. Comparison of UTCI to selected thermal indices. Int. J. BioMeteorol. 2012, 56, 515–535. [Google Scholar] [CrossRef] [PubMed]
- Lai, D.; Guo, D.; Hou, Y.; Lin, C.; Chen, Q. Studies of outdoor thermal comfort in northern China. Build. Environ. 2014, 77, 110–118. [Google Scholar] [CrossRef]
- De Freitas, C.R. Tourism climatology: Evaluating environmental information for decision making and business planning in the recreation and tourism sector. Int. J. Biometeorol. 2003, 48, 45–54. [Google Scholar] [CrossRef]
- Nikolopoulou, M. Designing Open Spaces in the Urban Environment: A Bioclimatic Approach; Centre for Renewable Energy Sources, EESD, FP5: Bath, UK, 2004. [Google Scholar]
- Ochoa de la Torre, J.M.; Marincic Lovriha, I.; Alpuche Cruz, M.G. Análisis del confort climático para la planeación de sitios turísticos. In Proceedings of the 5th International Conference Virtual City and Territory, Barcelona, Spain, 2–4 June 2009; pp. 481–488. [Google Scholar] [CrossRef]
- Oliveira, A.V.; Gaspar, A.R.; Quintela, D.A. Dynamic clothing insulation. Measurements with a thermal manikin operating under the thermal comfort regulation mode. Appl. Ergon. 2011, 42, 890–899. [Google Scholar] [CrossRef]
- Andrade, H.; Alcoforado, M.J.; Oliveira, S. Perception of temperature and wind by users of public outdoor spaces: Relationships with weather parameters and personal characteristics. Int. J. Biometeorol. 2011, 55, 665–680. [Google Scholar] [CrossRef]
- Solorzano Dávila, A. Validación del Índice de Confort Térmico Universal en Mexicali, BC, México. Master’s Thesis, Universidad Autónoma de Baja California, Mexicali, Mexico, 2015. Available online: https://hdl.handle.net/20.500.12930/3048 (accessed on 15 May 2022).
- Lin, T.P. Thermal perception, adaptation and attendance in a public square in hot and humid regions. Build. Environ. 2009, 44, 2017–2026. [Google Scholar] [CrossRef]
- Nikolopoulou, M.; Lykoudis, S. Thermal comfort in outdoor urban spaces: Analysis across different European countries. Build. Environ. 2006, 41, 1455–1470. [Google Scholar] [CrossRef]
- Lin, T.P.; Tsai, K.T.; Liao, C.C.; Huang, Y.C. Effects of thermal comfort and adaptation on park attendance regarding different shading levels and activity types. Build. Environ. 2013, 59, 599–611. [Google Scholar] [CrossRef]
- Thorsson, S.; Honjo, T.; Lindberg, F.; Eliasson, I.; Lim, E.M. Thermal comfort and outdoor activity in Japanese urban public places. Environ. Behav. 2007, 39, 660–684. [Google Scholar] [CrossRef]
- Bacci, L.; Morabito, M.; Raschi, A.; Ugolini, F. Thermohygrometric conditions of some urban parks of Florence (Italy) and their effects on human well-being. Trees 2003, 6, 49. [Google Scholar]
- Zoulia, I.; Santamouris, M.; Dimoudi, A. Monitoring the effect of urban green areas on the heat island in Athens. Environ. Monit. Assess 2009, 156, 275–292. [Google Scholar] [CrossRef] [PubMed]
- Spagnolo, J.; De Dear, R. A field study of thermal comfort in outdoor and semi-outdoor environments in subtropical Sydney Australia. Build. Environ. 2003, 38, 721–738. [Google Scholar] [CrossRef]
- Kenawy, I.; Elkadi, H. The impact of cultural and climatic background on thermal sensation votes. In Proceedings of the Sustainable Architecture for a Renewable Future Conference, Munich, Germany, 10–12 September 2013; Available online: https://hdl.handle.net/10536/DRO/DU:30061646 (accessed on 15 May 2022).
- Pantavou, K.; Santamouris, M.; Asimakopoulos, D.; Theoharatos, G. Empirical calibration of thermal indices in an urban outdoor Mediterranean environment. Build. Environ. 2014, 80, 283–292. [Google Scholar] [CrossRef]
- Picone, N.; Campo, A.M. Análisis del confort climático en la ciudad de Tandil, Argentina. Rev. Geográfica Venez. 2016, 57, 114–127. [Google Scholar]
- Liang, C.; Bi, W. Seasonal variation analysis and SVR forecast of tourist flows during the year: A case study of Huangshan mountain. In Proceedings of the 2017 IEEE 2nd International Conference on Big Data Analysis (ICBDA), Beijing, China, 10–12 March 2017; IEEE: New York, NY, USA, 2017; pp. 921–927. [Google Scholar]
- Martín-Vide, J.; Sarricolea, P.; Moreno-García, M.C. On the definition of urban hear island intensity: The “rural” reference. Front. Earth Sci. 2015, 34, 24. [Google Scholar]
- Moreno García, M.C.; Serra Pardo, J.A. El estudio de la isla de calor urbana en el ámbito mediterráneo: Una revisión bibliográfica. Biblio 3w Rev. Bibliográfica Geogr. Y Cienc. Soc. 2016, 21, 1–32. [Google Scholar]
- Salvati, A.; Roura, H.C.; Cecere, C. Assessing the urban heat island and its energy impact on residential buildings in Mediterranean climate: Barcelona case study. Energy Build. 2017, 146, 38–54. [Google Scholar] [CrossRef]
- Barros, P.M.; Martín Vide, J. Influencia térmica antrópica local y global en el observatorio Fabra para el periodo 1924–2016. BAGE Boletín Asoc. Geógrafos Españoles 2018, 79, 1–23. [Google Scholar] [CrossRef]
- Royé, D. The effects of hot nights on mortality in Barcelona, Spain. Int. J. Biometeorol. 2017, 61, 2127–2140. [Google Scholar] [CrossRef] [PubMed]
- Carreras, C.; Marín, M.; Martín Vide, J.; Moreno, C.; Sabi, J. Modificaciones térmicas en las ciudades. Avance sobre la isla de calor en Barcelona. Doc. D’Anal. Geográfica 1990, 17, 51–77. [Google Scholar]
- Moreno García, M.C. Estudio del Clima Urbano de Barcelona; La Isla de Calor; Universidad de Barcelona: Barcelona, Spain, 1993. [Google Scholar]
- Blasco Laffón, B.; Blasco Laffón, E.; Fernández Valdés, J.M.; Viñas Arrebola, C. Cálculo de índices de confort térmico en recintos cerrados con transferencia de calor. In Proceedings of the I Jornada Nacional de Investigación en Edificación, Madrid, Spain, 10–11 May 2007. [Google Scholar]
- Mieczkowski, Z. The tourism climatic index: A method of evaluating world climates for tourism. Can. Geogr. 1985, 29, 220–233. [Google Scholar] [CrossRef]
- Millán López, A.; Fernández García, F. Propuesta de un índice climático-turístico adaptado al turismo de interior en la Península Ibérica: Aplicación a la ciudad de Madrid. Investig. Geográficas 2018, 70, 31–46. [Google Scholar] [CrossRef]
- Miró Pérez, J.; Olcina Cantos, J.; Estrela Navarro, M.J.; Caselles Miralles, V. Confort climático, cambio climático y actividad turística en Alicante. In Proceedings of the X Congreso Internacional AEC: Clima, Sociedad, Riesgos y Ordenación del Territorio, Alicante, Spain, 5–8 October 2016; Publicaciones AEC: Alicante, Spain, 2016. [Google Scholar] [CrossRef]
- Olcina Cantos, J.; Miró Pérez, J.J. Actividad Turística y Cambio Climático en la Comunidad Valenciana; Universidad de Alicante, Instituto Universitario de Investigaciones Turísticas: Alicante, Spain; Agència Valenciana del Turisme: Valencia, Spain, 2017; Volume 130. [Google Scholar] [CrossRef]
- Miró Pérez, J.J.; Olcina Cantos, J. Cambio climático y confort térmico. Efectos en el turismo de la Comunidad Valenciana. Investig. Turísticas 2020, 20, 1–30. [Google Scholar] [CrossRef]
- Ayuntamiento de Benidorm. Plan de Adaptación Ante el Cambio Climático; Ayuntamiento de Benidorm: Benidorm, Spain, 2022; Available online: https://benidorm.org/es/ayuntamiento/concejalias/obras/ingenieria/proyectos-ingenieria/plan-de-adaptacion-ante-el-cambio-climatico-de-benidorm (accessed on 15 May 2022).
- Thom, E.C. The discomfort index. Weatherwise 1959, 12, 57–61. [Google Scholar] [CrossRef]
- Martín González, A.F. Análisis del Confort Climático en la Región de Andalucía, 1973–2017: Indice de Disconfort y Tipos de Tiempo. Trabajo Fin de Grado. Master’s Thesis, Universidad de Zaragoza, Zaragoza, Spain, 2018. Available online: https://zaguan.unizar.es/record/76163 (accessed on 15 May 2022).
- Colón Lasierra, A. Análisis del Confort Climático en la España Peninsular: Contrastes Costa-Interior. Trabajo Fin de Grado. Master’s Thesis, Universidad de Zaragoza, Zaragoza, Spain, 2019. Available online: https://zaguan.unizar.es/record/85371 (accessed on 15 May 2022).
- Guijarro, J.A. User’s Guide to Climatol. An R Contributed Package for Homogenization of Climatological Series; State Meteorological Agency (AEMET), Balearic Islands Office: Palma, Spain, 2011. [Google Scholar]
- Mann, H.B. Nonparametric tests against trend. Econometrica 1945, 13, 245–259. [Google Scholar] [CrossRef]
- Kendall, M.G. Rank Correlation Methods, 4th ed.; Charles Griffin: London, UK, 1975. [Google Scholar]
- Theil, H. A Rank-Invariant Method of Linear and Polynomial Regression Analysis. Indag. Math. 1950, 12, 173. [Google Scholar]
- Sen, P.K. Estimates of the regression coefficient based on Kendall’s tau. J. Am. Stat. Assoc. 1968, 63, 1379–1389. [Google Scholar] [CrossRef]
- Nastos, P.T.; Matzarakis, A. Present and future climate—Tourism conditions in Milos Island, Greece. Atmosphere 2019, 10, 145. [Google Scholar] [CrossRef]
- Salata, F.; Golasi, I.; Proietti, R.; de Lieto Vollaro, A. Implications of climate and outdoor thermal comfort on tourism: The case of Italy. Int. J. Biometeorol. 2017, 61, 2229–2244. [Google Scholar] [CrossRef] [PubMed]
- Amezúa, C. Estudio del Índice de Confort. Trabajo Fin de Grado. Master’s Thesis, University of Valladolid, Valladolid, Spain, 2020. Available online: https://uvadoc.uva.es/handle/10324/44441 (accessed on 15 May 2022).
Figure 1.
Location of the meteorological observatories grouped in clusters. The ID of the observatories is described in Table 1, while the description of the clusters in Table 1.
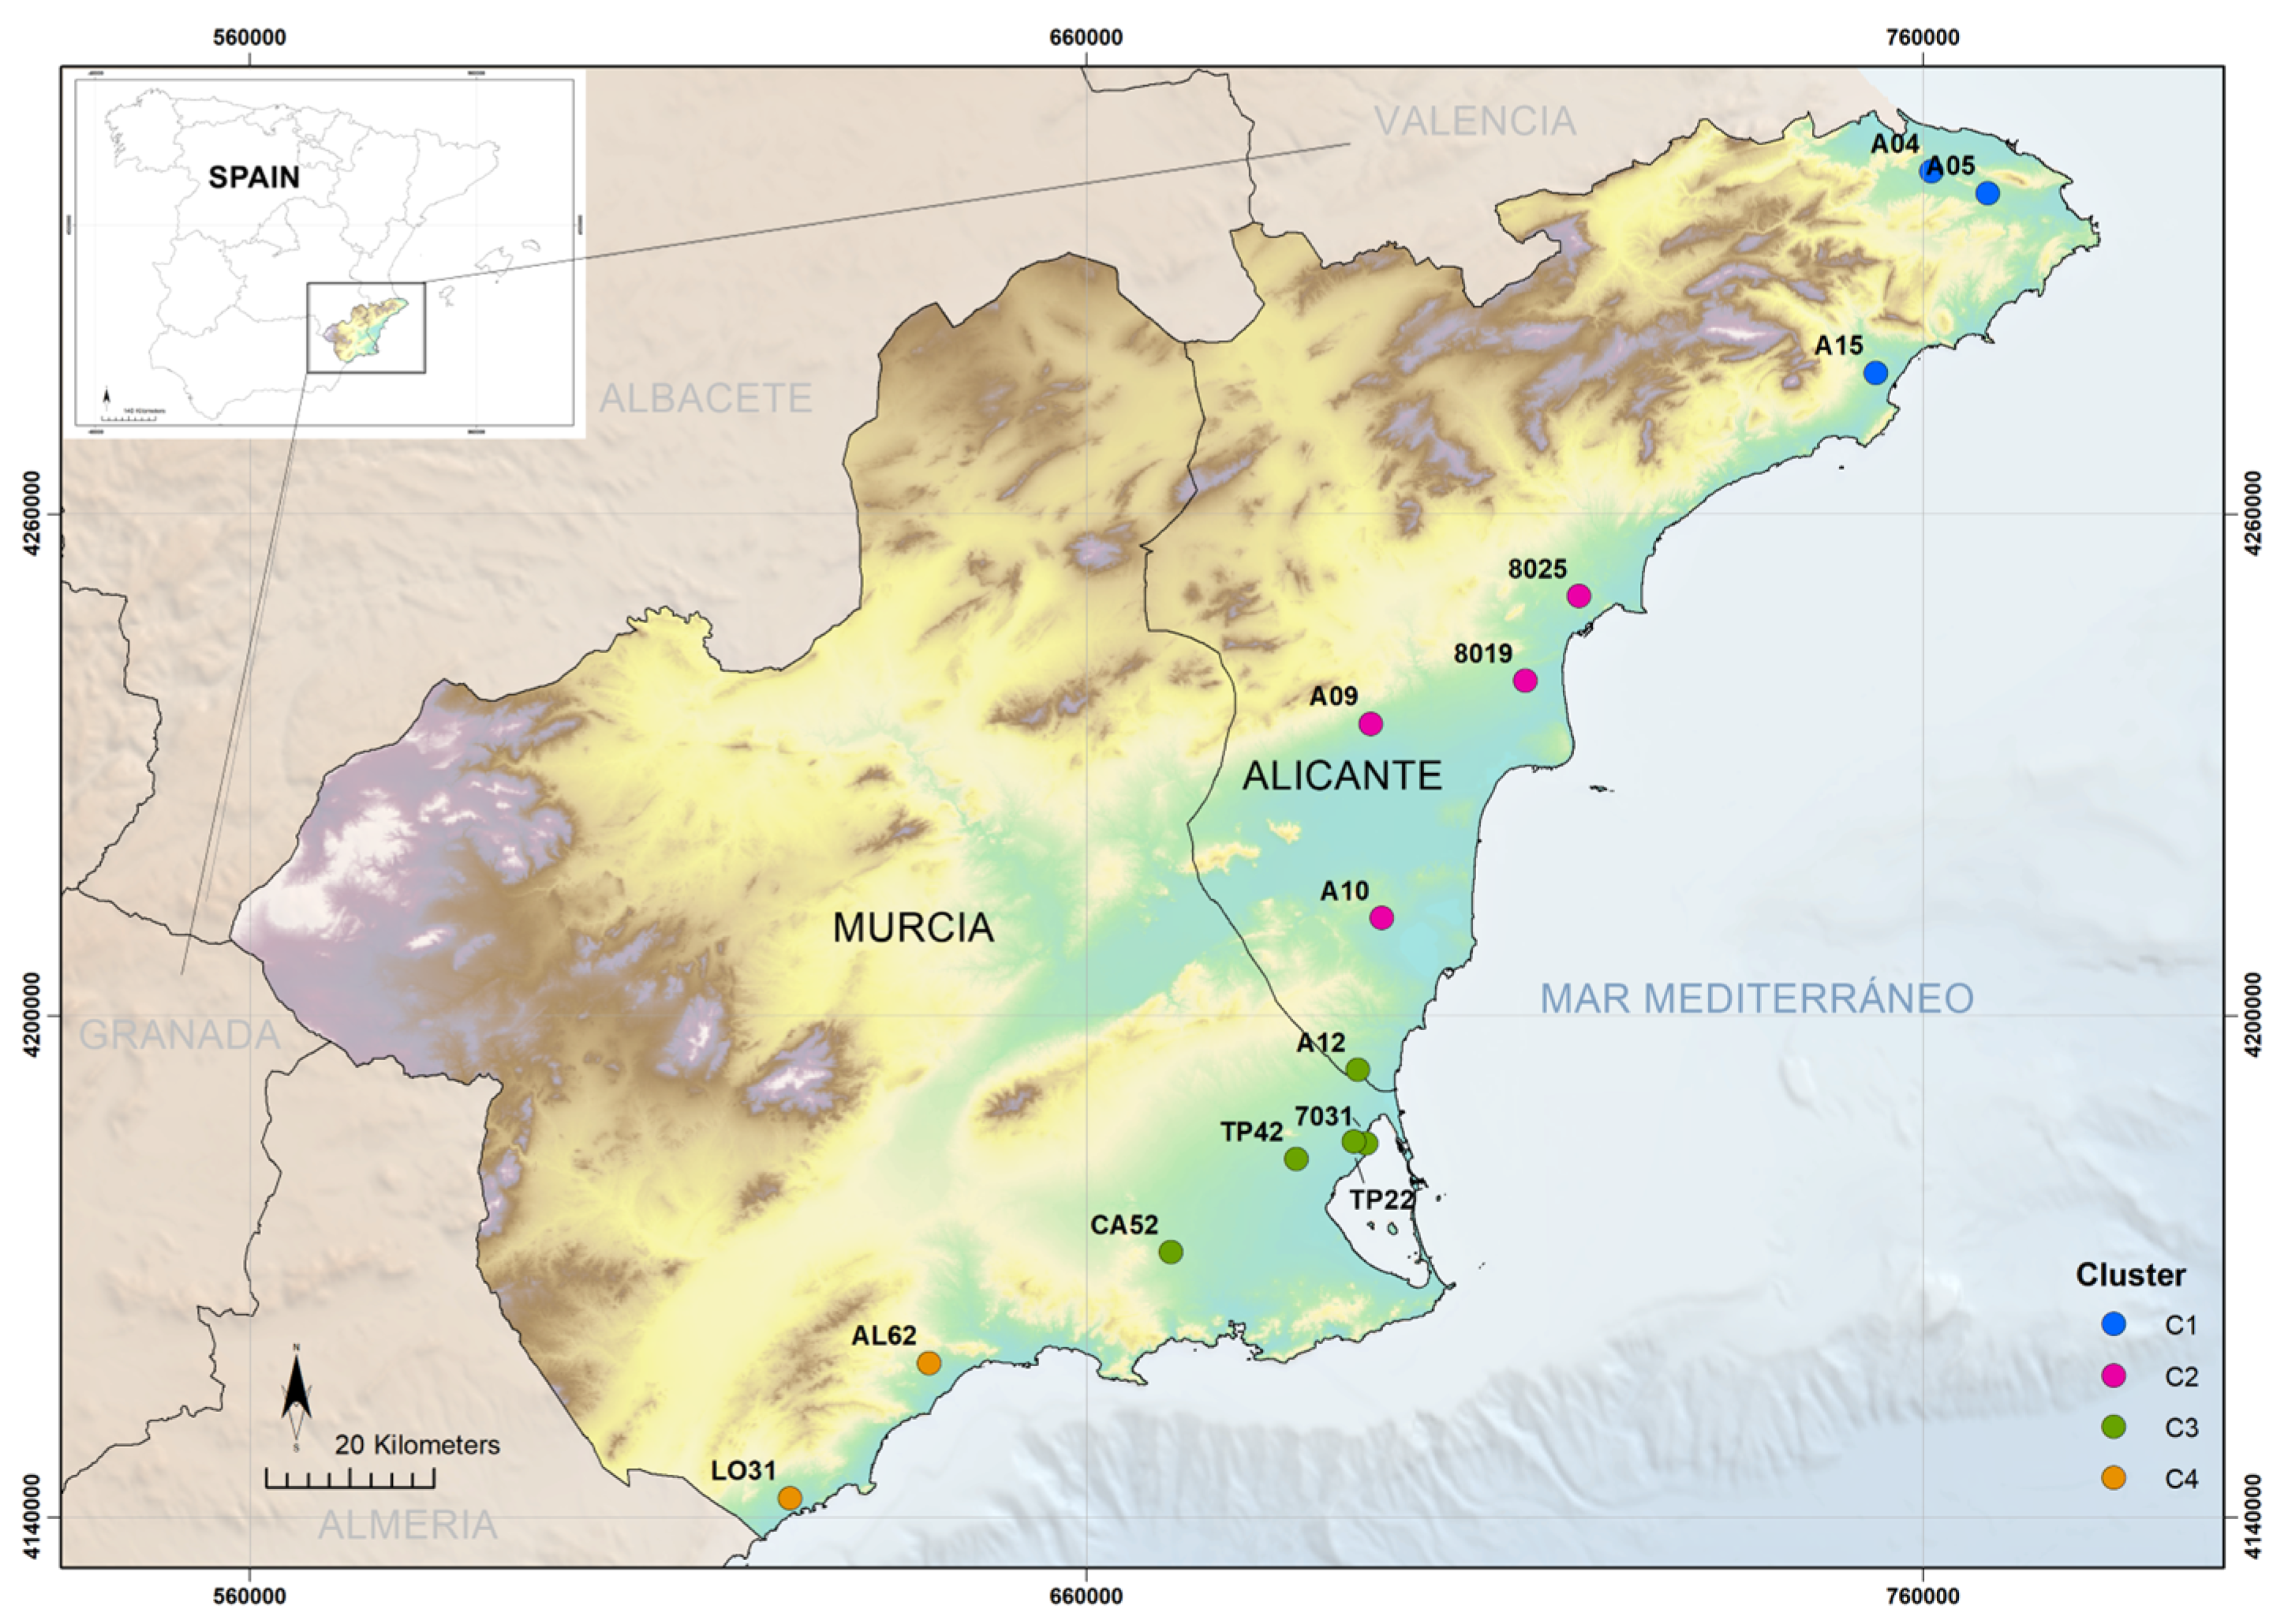
Figure 2.
Evolution of the average CCI throughout the year in the observatories of Alicante, Alicante Airport and San Javier Aerodrome.
Figure 2.
Evolution of the average CCI throughout the year in the observatories of Alicante, Alicante Airport and San Javier Aerodrome.

Figure 3.
Change in the CCI between the time periods 1967–1994 and 1995–2022 in the meteorological observatories with the availability of long series (1967–2022) (The black line is a low-pass smoothed trend line).
Figure 3.
Change in the CCI between the time periods 1967–1994 and 1995–2022 in the meteorological observatories with the availability of long series (1967–2022) (The black line is a low-pass smoothed trend line).
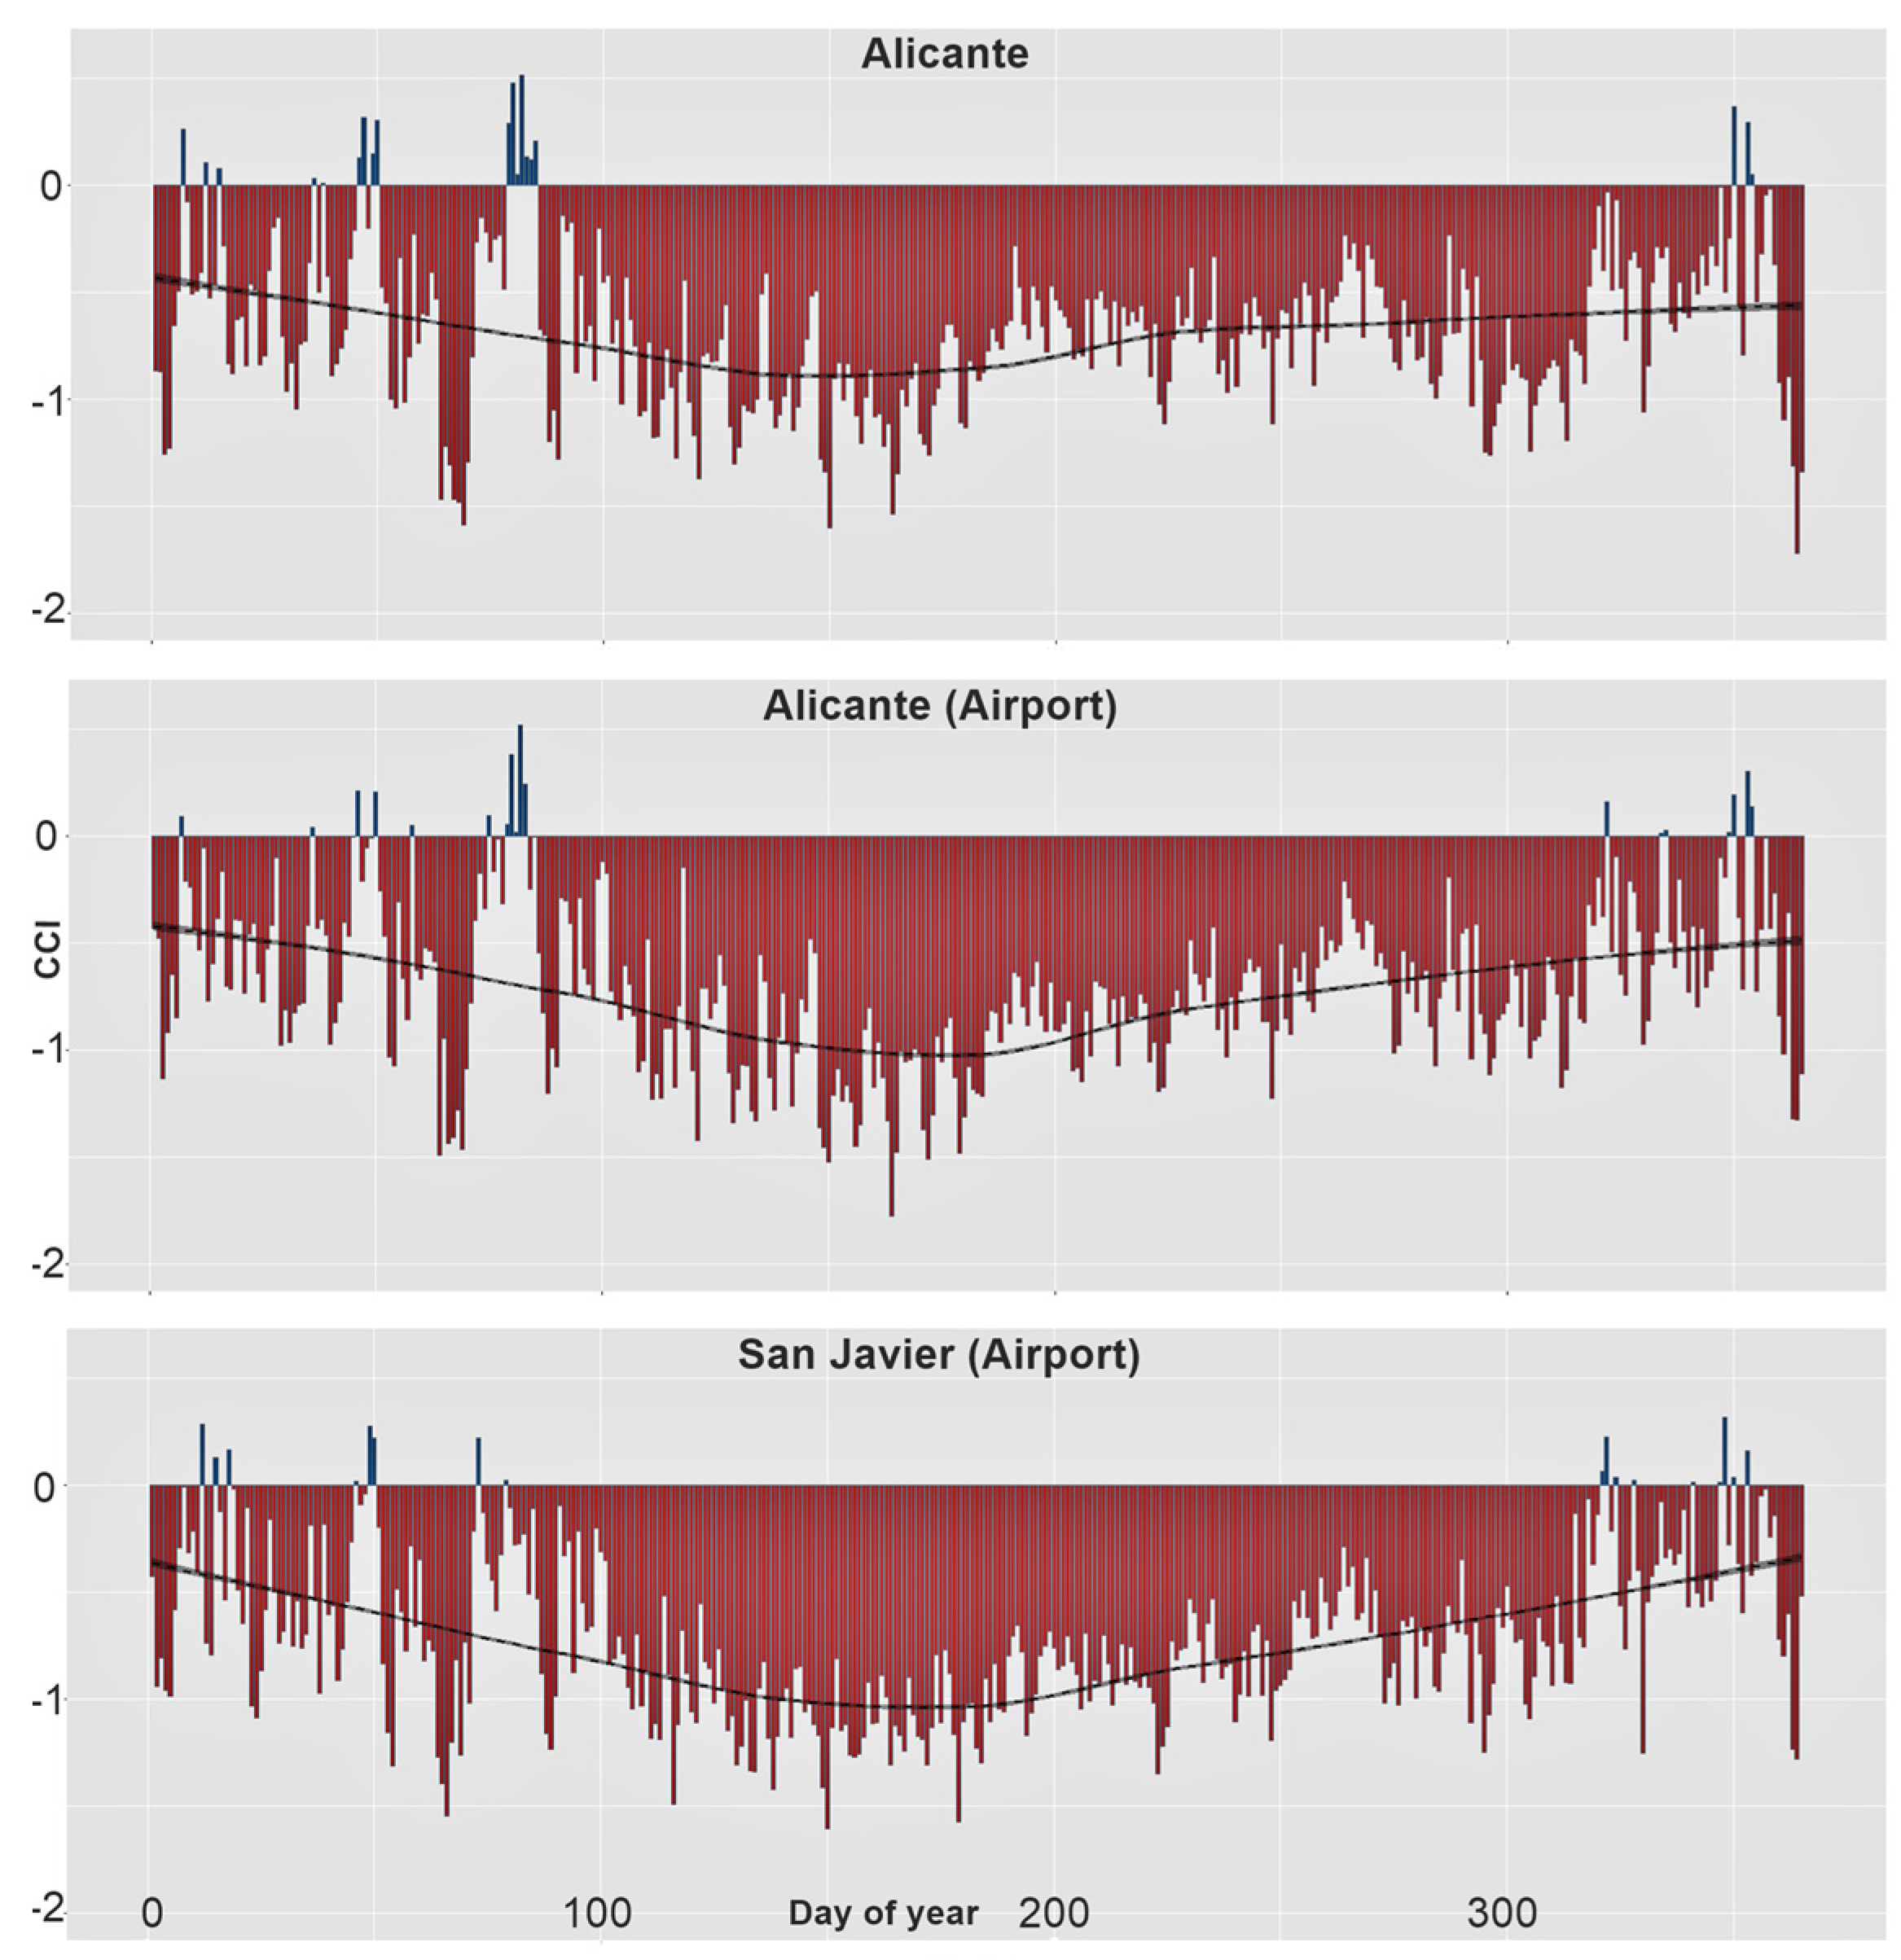
Figure 4.
Time change in the different thresholds of the CCI index for: Alicante Airport (8019), Alicante (8025) and San Javier (7031), according to time windows of 30 years overlapping every 5 years. Legend: red (hot), orange (warm), yellow (comfortable) and green (cool).
Figure 4.
Time change in the different thresholds of the CCI index for: Alicante Airport (8019), Alicante (8025) and San Javier (7031), according to time windows of 30 years overlapping every 5 years. Legend: red (hot), orange (warm), yellow (comfortable) and green (cool).
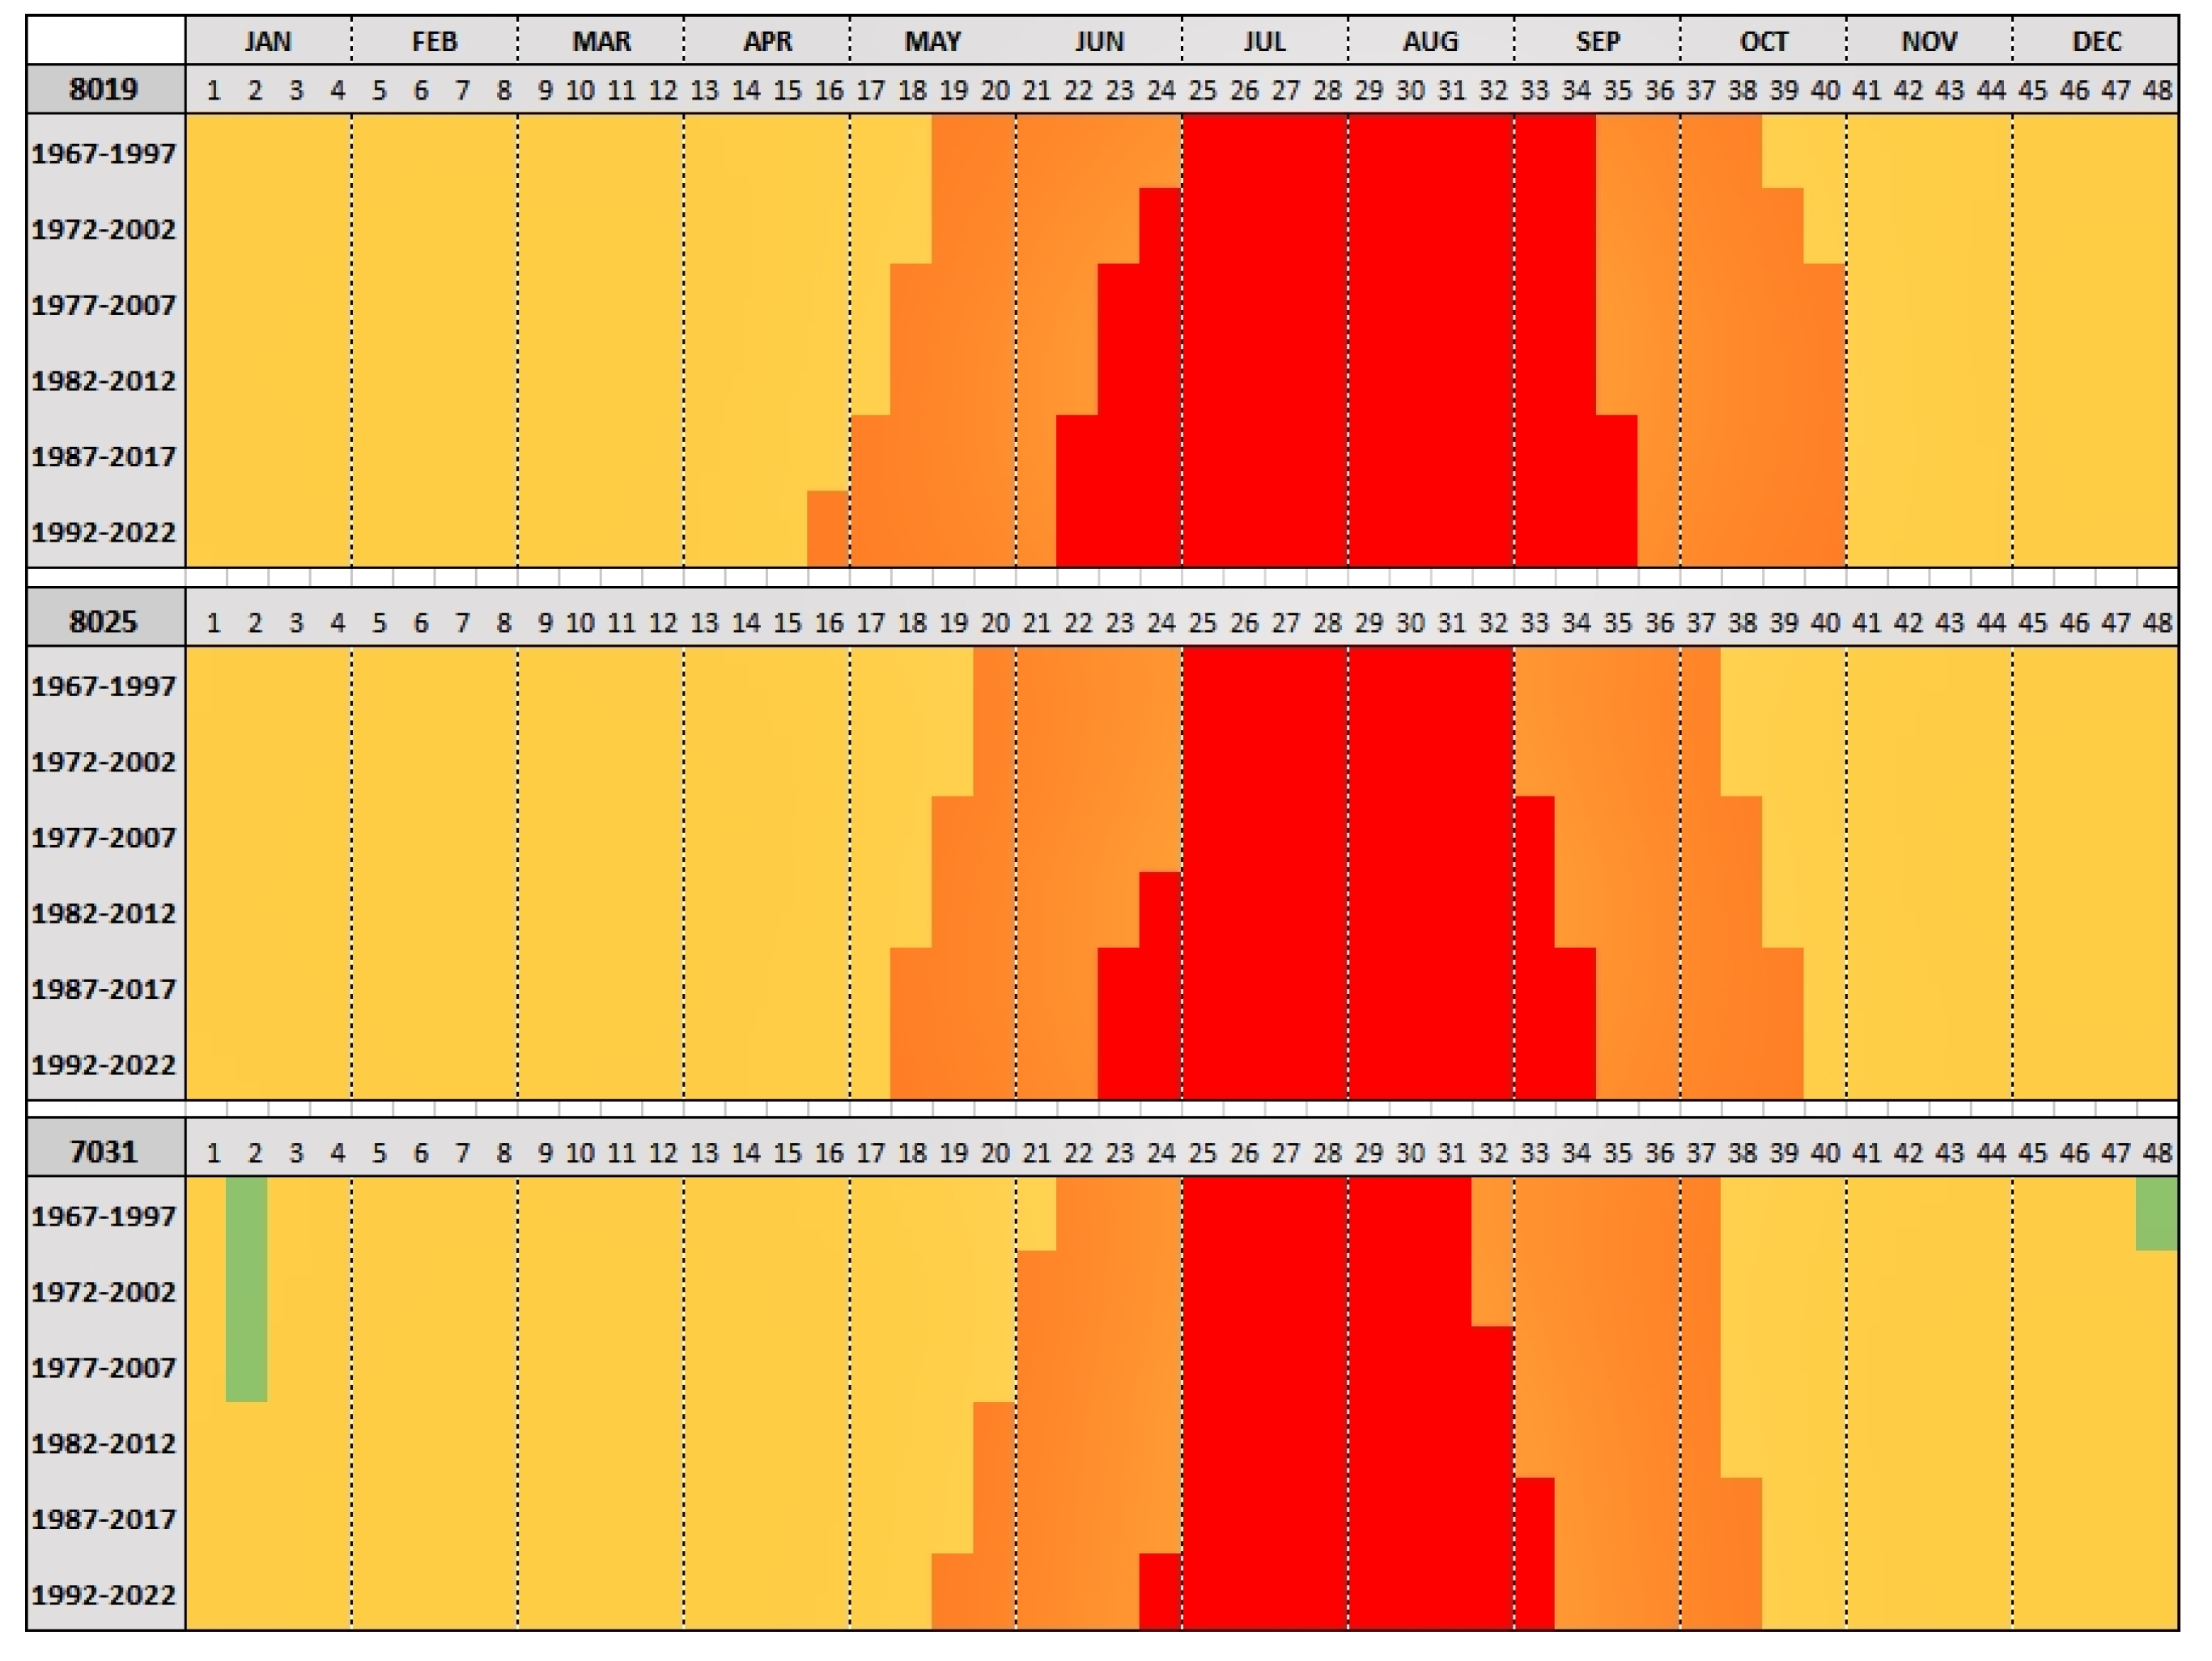
Figure 5.
Time change in the different CCI index thresholds for the whole of Alicante Airport (8019), Alicante (8025) and San Javier (7031), in accordance with time windows of 20 years overlapping each year. Legend: red (hot), orange (warm) and yellow (comfortable).
Figure 5.
Time change in the different CCI index thresholds for the whole of Alicante Airport (8019), Alicante (8025) and San Javier (7031), in accordance with time windows of 20 years overlapping each year. Legend: red (hot), orange (warm) and yellow (comfortable).

Figure 6.
Temporal evolution of the CCI index (1967–2022) in the observatories of Alicante, Alicante (Airport) and San Javier (Airport). The top figures show the summer average (JJA) and the lower the absolute maximum annual index (The black line is a low-pass smoothed trend line).
Figure 6.
Temporal evolution of the CCI index (1967–2022) in the observatories of Alicante, Alicante (Airport) and San Javier (Airport). The top figures show the summer average (JJA) and the lower the absolute maximum annual index (The black line is a low-pass smoothed trend line).

Figure 7.
Evolution of the average CCI throughout the year in the different analysis clusters.

Figure 8.
Change in the CCI between the time periods 2001-2011 and 2012-2022 in the meteorological observatories that provide long series (2000–2022).
Figure 8.
Change in the CCI between the time periods 2001-2011 and 2012-2022 in the meteorological observatories that provide long series (2000–2022).
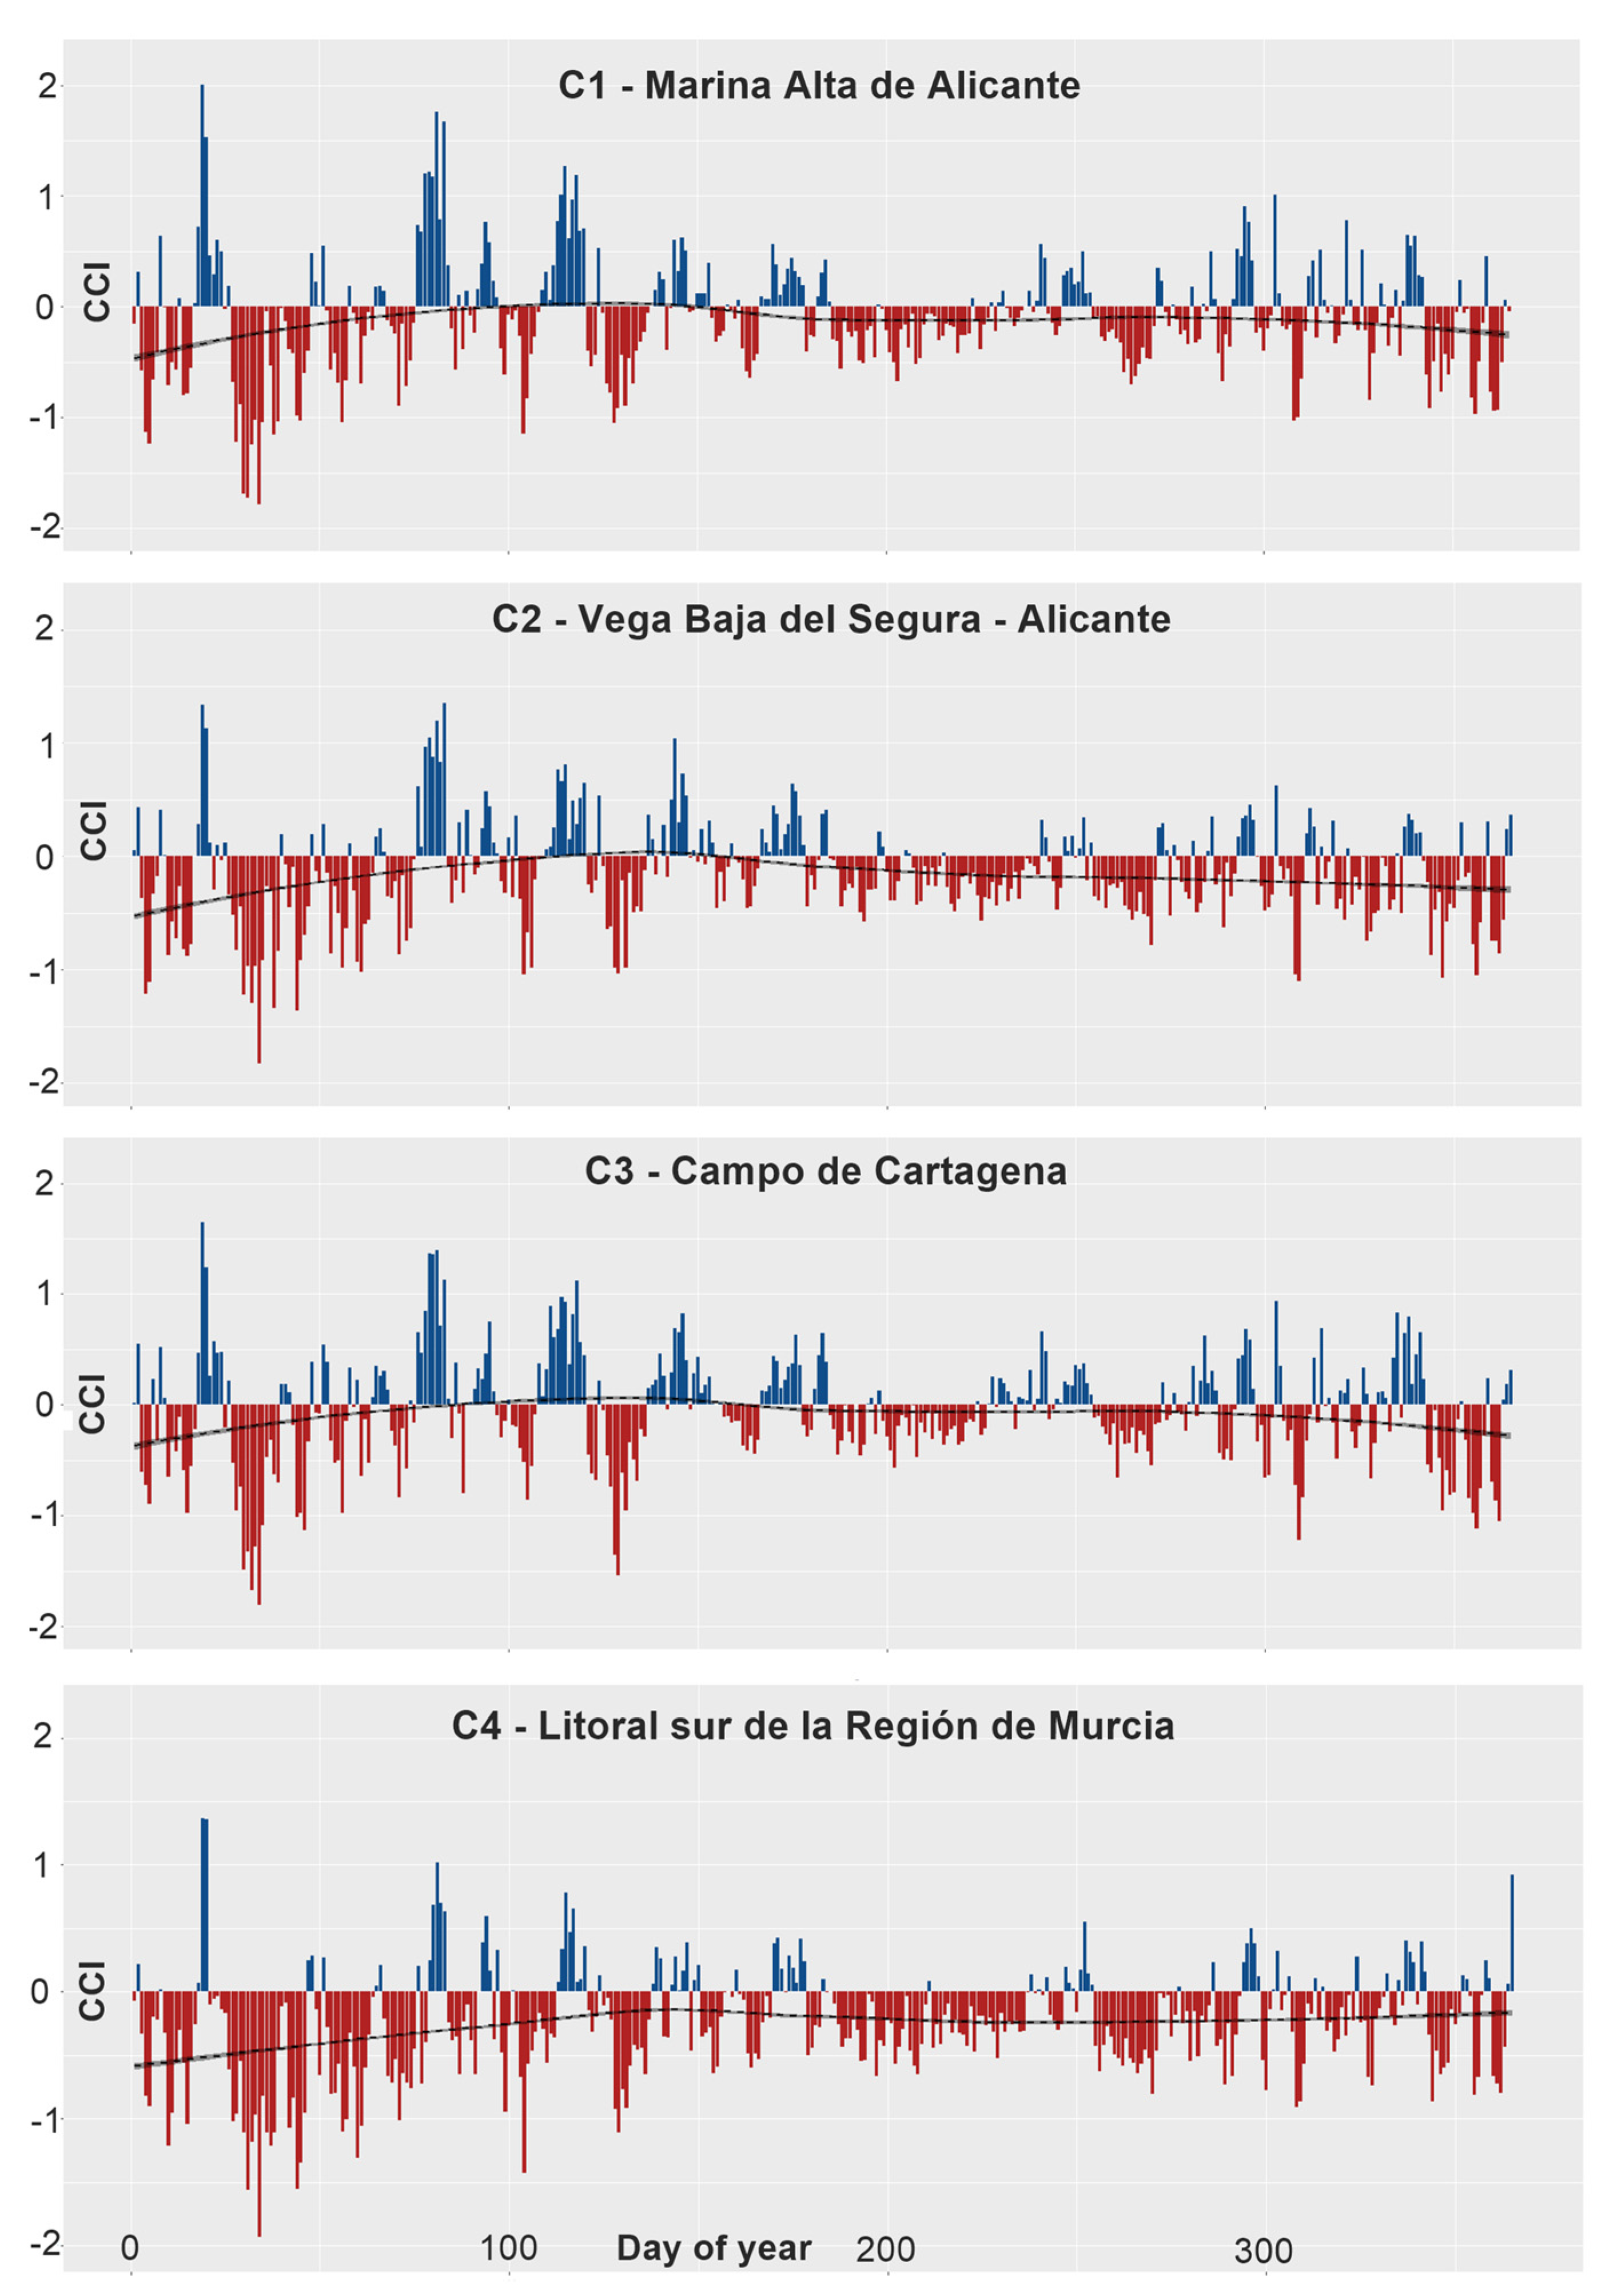
Figure 9.
Time change in the different thresholds of the CCI index for the different clusters analysed, according to 10-year time windows, overlapping every 2 years. Legend: violet (warm), red (hot), orange (warm) and yellow (comfortable).
Figure 9.
Time change in the different thresholds of the CCI index for the different clusters analysed, according to 10-year time windows, overlapping every 2 years. Legend: violet (warm), red (hot), orange (warm) and yellow (comfortable).
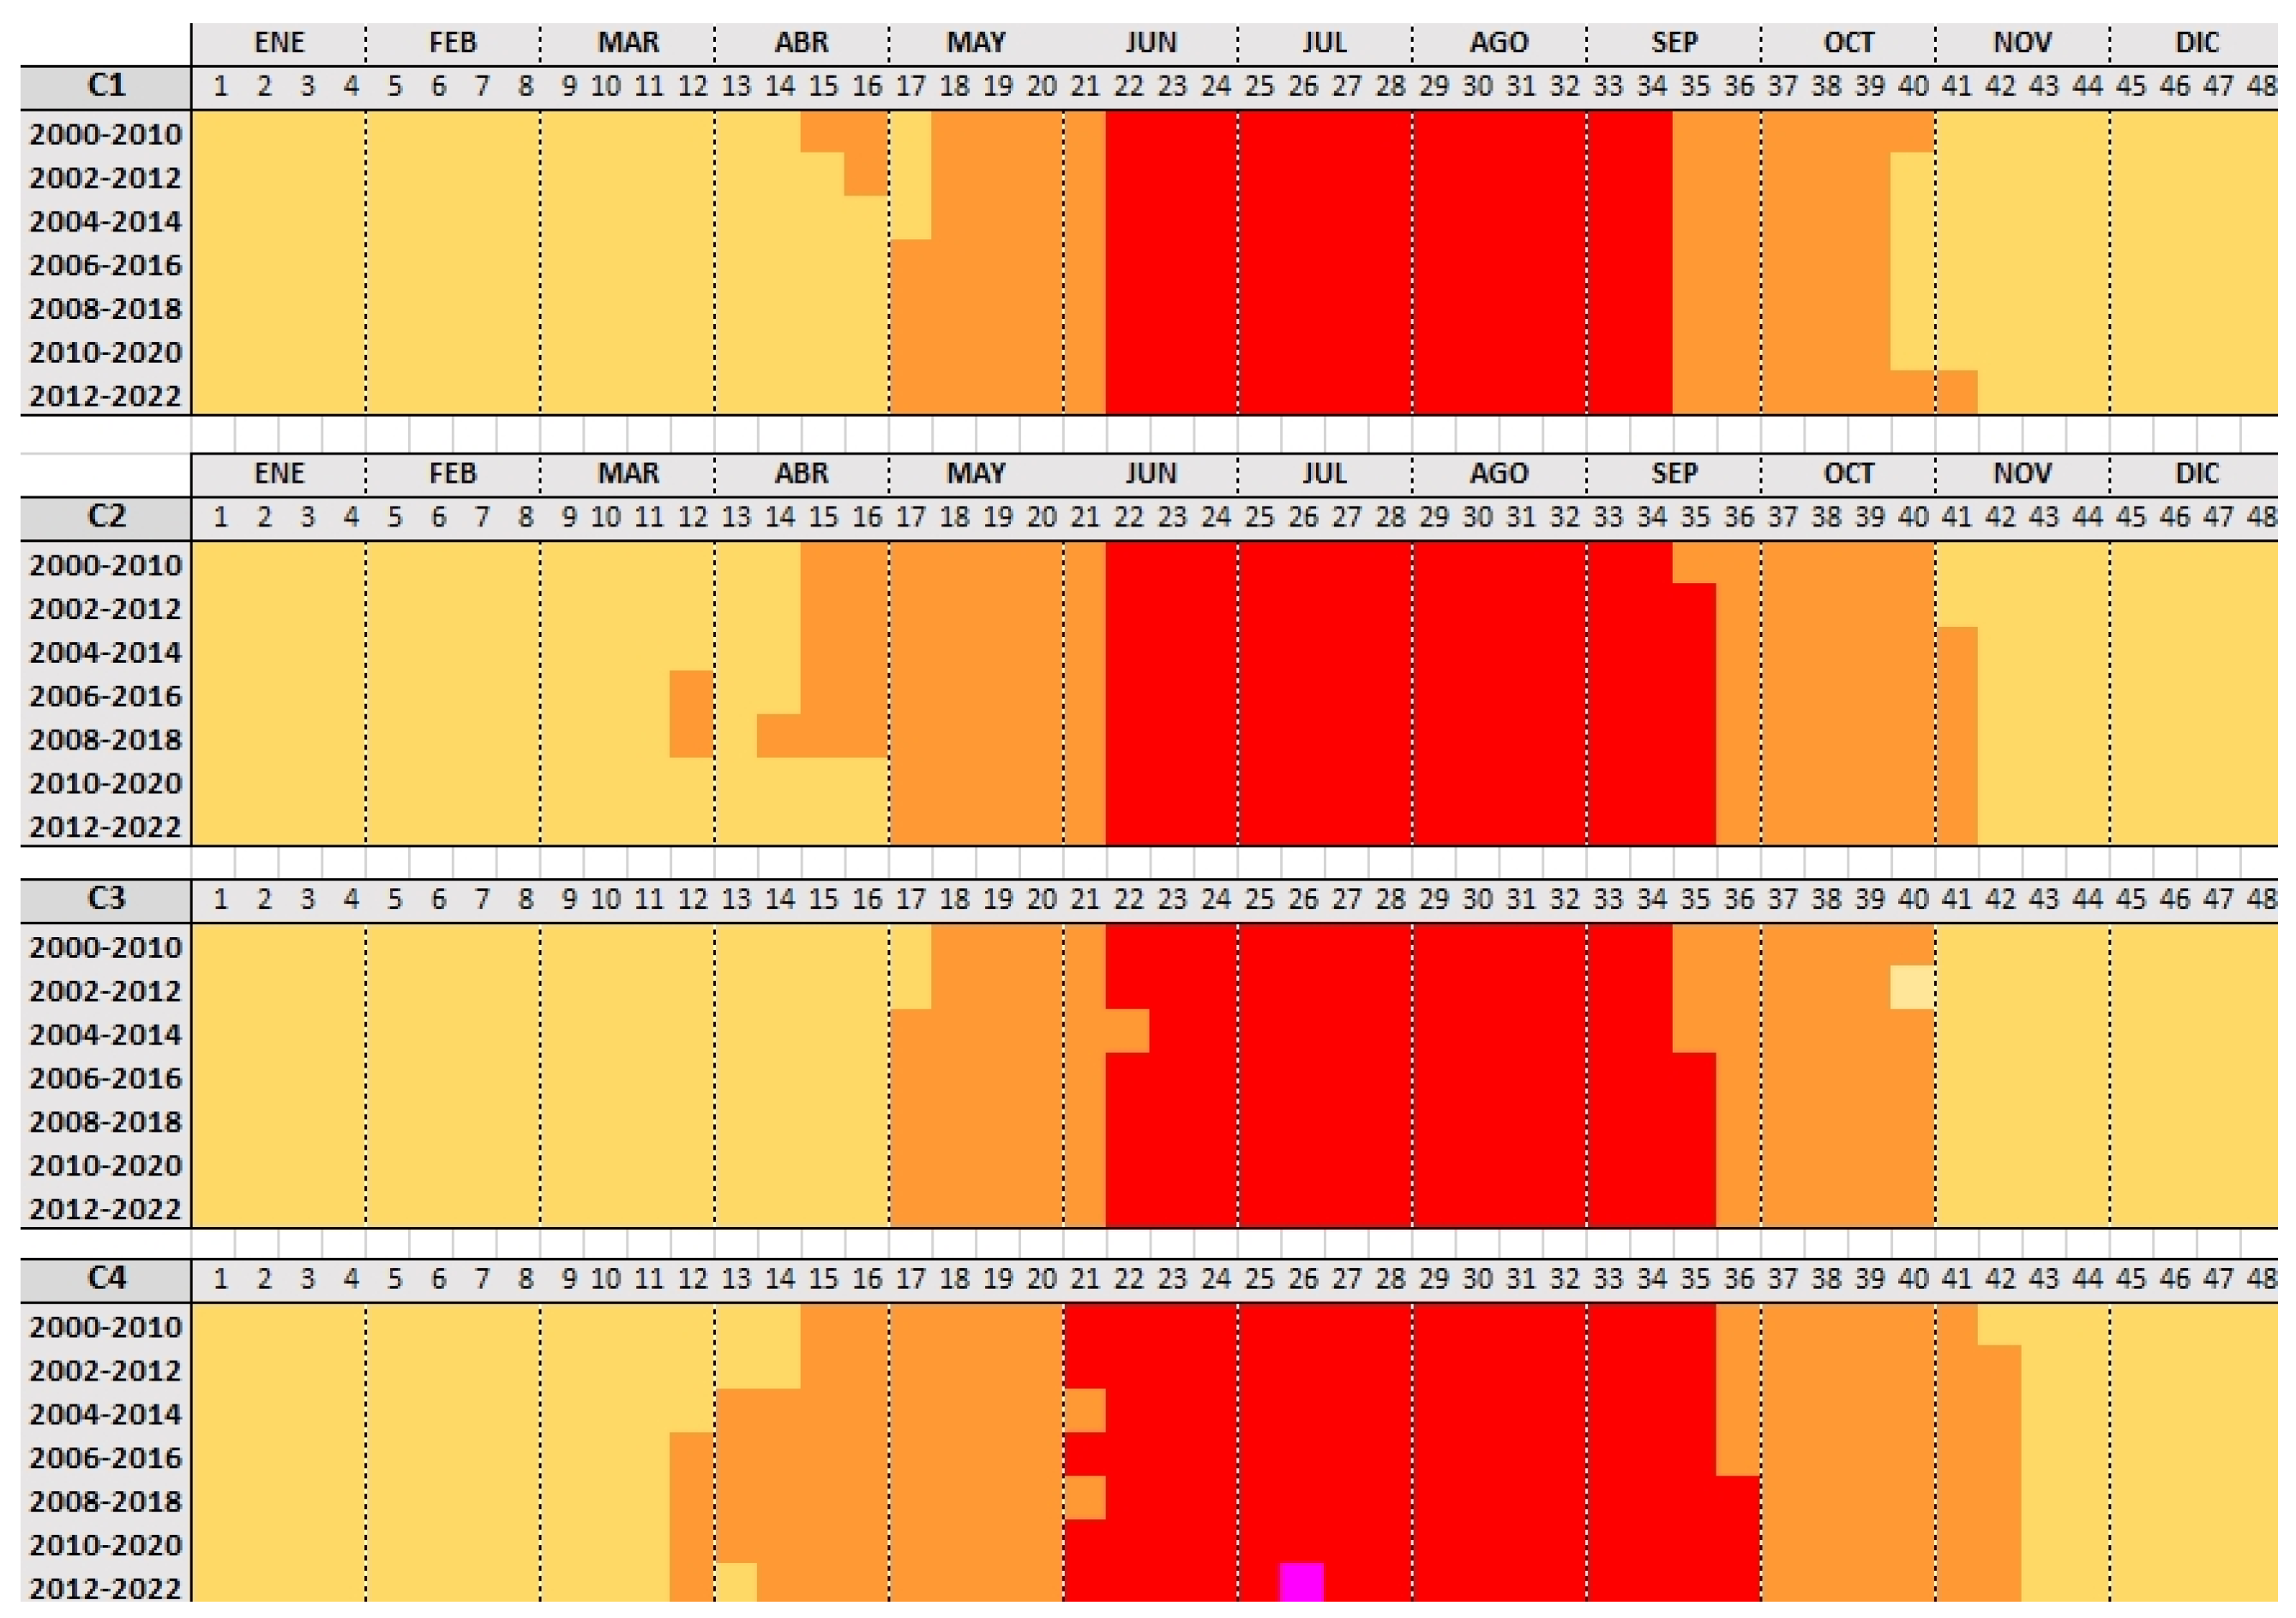
Figure 10.
Temporal evolution of the CCI (2000–2022) in the different clusters analysed. The top figures show the summer average (JJA) and the lower the absolute minimum annual index.
Figure 10.
Temporal evolution of the CCI (2000–2022) in the different clusters analysed. The top figures show the summer average (JJA) and the lower the absolute minimum annual index.


Table 1.
Characteristics of the meteorological observatories used.
| ID | Station Name/Municipality | Province | Altitude (m) | Network | Serie |
|---|---|---|---|---|---|
| 8025 | Alicante | Alicante | 81 | AEMET | 1967–2022 |
| 8019 | Alicante Airport | Alicante | 43 | AEMET | 1967–2022 |
| 7031 | San Javier Airport | Murcia | 2 | AEMET | 1967–2022 |
| AL62 | Cañada Gallego—Mazarrón | Murcia | 94 | SIAR | 2000–2022 |
| TP22 | Santiago de la Ribera—San Javier | Murcia | 7 | SIAR | 2000–2022 |
| CA52 | La Aljorra—Cartagena | Murcia | 84 | SIAR | 2000–2022 |
| LO31 | La Pilica—Águilas | Murcia | 31 | SIAR | 2000–2022 |
| TP42 | Torreblanca—Torre-Pacheco | Murcia | 31 | SIAR | 2000–2022 |
| A04 | Ondara | Alicante | 38 | SIAR | 2000–2022 |
| A15 | Altea | Alicante | 75 | SIAR | 2000–2022 |
| A05 | Gata de Gorgós—Denia | Alicante | 86 | SIAR | 2000–2022 |
| A12 | Pilar de la Horadada | Alicante | 54 | SIAR | 2000–2022 |
| A09 | Crevillente | Alicante | 73 | SIAR | 2000–2022 |
| A10 | Almoradí | Alicante | 58 | SIAR | 2000–2022 |
Table 2.
Clusters established (1967–2022) for climate characterisation and the analysis of time trends.
Table 2.
Clusters established (1967–2022) for climate characterisation and the analysis of time trends.
| Code | Description | Meteorological Observatories |
|---|---|---|
| C1 | Marina Alta de Alicante | A04 (Ondara) |
| A05 (Gata de Gorgós) | ||
| A15 (Altea) | ||
| C2 | Vega Baja del Segura—Alicante | A10 (Almoradí) |
| A09 (Crevillente) | ||
| 8025 (Alicante) | ||
| 8019 (Alicante Aeropuerto) | ||
| C3 | Campo de Cartagena | A12 (Pilar de la Horadada) |
| 7031 (San Javier Aeropuerto) | ||
| CA52 (La Aljorra) | ||
| TP22 (Santiago de la Ribera) | ||
| TP42 (Torreblanca—TorrePacheco) | ||
| C4 | Litoral sur Región de Murcia | AL62 (Cañada Gallego) |
| LO31 (Pilica—Águilas) |
Table 3.
Classification of thermal comfort according to climate comfort indices (CCIs).
| Comfort Thermal Classification | CCI Ranks |
|---|---|
| Excessively hot | 0–3 |
| Hot | 3–5 |
| Warm | 5–7 |
| Comfortable | 7–11 |
| Cool | 11–13 |
| Cold | 13–15 |
| Excessively cold | >15 |
Table 4.
Changes in the annual periods of different comfort thresholds of the CCI. The table shows the beginning and end of the thermal comfort thresholds, and the total number of days in the period for different time intervals. Time periods in windows of 30 years overlapping every 5 years.
Table 4.
Changes in the annual periods of different comfort thresholds of the CCI. The table shows the beginning and end of the thermal comfort thresholds, and the total number of days in the period for different time intervals. Time periods in windows of 30 years overlapping every 5 years.
| Observatory | Description | 67-97 | 72-02 | 77-07 | 82-12 | 87-17 | 92-22 |
|---|---|---|---|---|---|---|---|
| Alicante | Warm | 15 May | 13 May | 28 April | 23 April | 23 April | 23 April |
| 20 October | 25 October | 29 October | 29 October | 3 November | 3 November | ||
| N° days | 159 | 166 | 185 | 190 | 195 | 195 | |
| Heat | 26 June | 16 June | 14 June | 12 June | 11 June | 10 June | |
| 13 September | 16 September | 17 September | 25 September | 25 September | 25 September | ||
| N° days | 80 | 93 | 96 | 106 | 107 | 108 | |
| Alicante | Warm | 23 May | 20 May | 15 May | 15 May | 9 May | 8 May |
| (Airport) | 8 October | 13 October | 13 October | 17 October | 25 October | 25 October | |
| N° days | 139 | 147 | 152 | 156 | 170 | 171 | |
| Heat | 6 July | 1 July | 25 June | 19 June | 14 June | 11 June | |
| 29 August | 3 September | 8 September | 13 September | 14 September | 15 September | ||
| N° days | 55 | 65 | 76 | 87 | 93 | 97 | |
| San Javier | Warm | 7 June | 2 June | 28 May | 24 May | 24 May | 13 May |
| 8 October | 11 October | 13 October | 13 October | 13 October | 14 October | ||
| N° days | 124 | 132 | 139 | 143 | 143 | 155 | |
| Heat | 24 July | 19 July | 18 July | 2 July | 26 June | 26 June | |
| 26 August | 26 August | 29 August | 6 September | 6 September | 13 September | ||
| N° days | 34 | 39 | 43 | 67 | 73 | 80 |
Table 5.
Summary of the time trends (1967–2022) of the different climate elements in the calculation of the comfort indices. In bold are statistically significant with a confidence interval of 95.0%.
Table 5.
Summary of the time trends (1967–2022) of the different climate elements in the calculation of the comfort indices. In bold are statistically significant with a confidence interval of 95.0%.
| CCI Index | Aver. Temp (°C) | Humidity Rel (%) | Wind Vel (km/h) | |||||||||
|---|---|---|---|---|---|---|---|---|---|---|---|---|
| 8052 | 8019 | 7031 | 8052 | 8019 | 7031 | 8052 | 8019 | 7031 | 8052 | 8019 | 7031 | |
| J | −0.16 | −0.16 | −0.14 | 0.08 | 0.09 | 0.13 | −0.89 | −1.06 | −0.89 | −0.43 | −0.24 | −0.18 |
| F | −0.16 | −0.15 | −0.18 | 0.11 | 0.13 | 0.18 | −0.70 | −0.51 | −0.99 | −0.49 | −0.55 | −0.26 |
| M | −0.17 | −0.16 | −0.21 | 0.27 | 0.29 | 0.32 | −0.59 | −0.17 | −0.66 | −0.20 | −0.49 | −0.33 |
| A | −0.23 | −0.22 | −0.23 | 0.39 | 0.41 | 0.48 | −0.70 | −0.32 | −0.19 | −0.19 | −0.58 | −0.37 |
| M | −0.30 | −0.32 | −0.33 | 0.50 | 0.55 | 0.58 | −1.36 | −0.98 | −1.04 | −0.24 | −0.78 | −0.44 |
| J | −0.33 | −0.39 | −0.35 | 0.61 | 0.65 | 0.65 | −1.52 | −2.06 | −1.24 | −0.18 | −0.88 | −0.45 |
| JL | −0.24 | −0.32 | −0.31 | 0.54 | 0.62 | 0.63 | −0.62 | −1.51 | −1.04 | −0.05 | −0.66 | −0.12 |
| A | −0.25 | −0.30 | −0.31 | 0.50 | 0.57 | 0.62 | −1.03 | −1.55 | −1.11 | −0.15 | −0.73 | −0.19 |
| S | −0.21 | −0.23 | −0.25 | 0.40 | 0.41 | 0.48 | −0.69 | −0.98 | −0.88 | −0.24 | −0.55 | −0.05 |
| O | −0.26 | −0.26 | −0.25 | 0.42 | 0.43 | 0.46 | −0.56 | −0.44 | −0.49 | −0.69 | −1.22 | −0.52 |
| N | −0.21 | −0.20 | −0.19 | 0.14 | 0.16 | 0.19 | −1.16 | −1.18 | −1.24 | −0.49 | −0.50 | −0.29 |
| D | −0.21 | −0.21 | −0.18 | 0.25 | 0.25 | 0.27 | 0.35 | −0.65 | −0.52 | −0.81 | −0.63 | −0.42 |
| Year | −0.23 | −0.24 | −0.24 | 0.35 | 0.38 | 0.42 | −0.85 | −0.95 | −0.86 | −0.35 | −0.64 | −0.30 |
Table 6.
Changes in the annual periods of different comfort thresholds of the CCI. The table shows the beginning and end of the thermal comfort thresholds, and the total number of days in the period for different time intervals. Time periods in windows of 30 days overlapping every 5 years.
Table 6.
Changes in the annual periods of different comfort thresholds of the CCI. The table shows the beginning and end of the thermal comfort thresholds, and the total number of days in the period for different time intervals. Time periods in windows of 30 days overlapping every 5 years.
| Cluster | Description | 2001–2011 | 2012–2022 |
|---|---|---|---|
| C1 | Warm | 23 April | 1 May |
| 1 November | 6 November | ||
| N° days | 193 | 190 | |
| Heat | 12 June | e10 June | |
| 14 September | 18 September | ||
| N° days | 95 | 101 | |
| C2 | Warm | 23 April | 1 May |
| 12 November | 16 November | ||
| N° days | 204 | 200 | |
| Heat | 8 June | 10 June | |
| 25 September | 5 October | ||
| N° days | 110 | 118 | |
| C3 | Warm | 4 May | 5 May |
| 1 November | 5 November | ||
| N° days | 182 | 185 | |
| Heat | 13 June | 10 June | |
| 19 September | 25 September | ||
| N° days | 99 | 108 | |
| C4 | Warm | 18 April | 6 April |
| 16 November | 17 November | ||
| N° days | 213 | 226 | |
| Heat | 5 June | 28 May | |
| 4 October | 7 October | ||
| N° days | 122 | 133 |
Table 7.
Summary of the time trends (2000–2022) of the different comfort indices analysed. The figures in bold are statistically significant with a confidence interval of 95.0%.
Table 7.
Summary of the time trends (2000–2022) of the different comfort indices analysed. The figures in bold are statistically significant with a confidence interval of 95.0%.
| CCI Index | Aver. Temp (°C) | Humidity Rel (%) | Wind Vel (km/h) | |||||||||||||
|---|---|---|---|---|---|---|---|---|---|---|---|---|---|---|---|---|
| C1 | C2 | C3 | C4 | C1 | C2 | C3 | C4 | C1 | C2 | C3 | C4 | C1 | C2 | C3 | C4 | |
| J | −0.1 | −0.1 | −0.1 | −0.2 | 0.3 | 0.3 | 0.2 | 0.3 | 0.1 | 0.0 | 0.2 | −0.6 | 0.1 | −0.4 | 0.0 | −0.3 |
| F | −0.2 | −0.2 | −0.2 | −0.4 | 0.5 | 0.5 | 0.5 | 0.6 | 0.3 | −0.3 | 0.3 | −1.9 | 0.1 | 0.1 | −0.1 | 0.1 |
| M | 0.3 | 0.2 | 0.3 | −0.1 | −0.2 | −0.1 | −0.2 | 0.1 | 2.6 | 1.9 | 2.7 | −0.2 | 0.2 | −0.1 | 0.1 | 0.2 |
| A | 0.3 | 0.2 | 0.4 | 0.0 | −0.1 | 0.1 | −0.1 | 0.3 | 4.3 | 3.5 | 4.1 | 1.8 | −0.2 | −0.7 | −0.2 | −0.6 |
| M | −0.1 | −0.1 | −0.1 | −0.2 | 0.4 | 0.3 | 0.3 | 0.5 | 0.4 | 1.1 | 0.7 | −0.1 | −0.3 | −0.9 | −0.1 | −0.7 |
| J | 0.0 | 0.0 | 0.1 | 0.0 | 0.0 | 0.0 | −0.1 | 0.0 | 1.2 | 1.6 | 2.2 | 1.0 | −0.4 | −1.1 | −0.2 | −1.1 |
| JL | −0.2 | −0.2 | −0.1 | −0.3 | 0.6 | 0.6 | 0.5 | 0.7 | −0.1 | 0.9 | 1.0 | −0.1 | −0.4 | −0.8 | −0.3 | −0.8 |
| A | −0.1 | −0.2 | −0.1 | −0.2 | 0.5 | 0.7 | 0.4 | 0.6 | 1.9 | 1.1 | 2.6 | 0.8 | −0.2 | −0.7 | −0.3 | −0.9 |
| S | −0.1 | −0.2 | −0.1 | −0.3 | 0.5 | 0.6 | 0.4 | 0.6 | 1.1 | 0.9 | 1.6 | 0.2 | −0.2 | −0.8 | −0.3 | −0.8 |
| O | 0.0 | −0.1 | 0.1 | −0.1 | 0.3 | 0.3 | 0.1 | 0.3 | 2.5 | 1.8 | 2.9 | 1.2 | −0.5 | −1.0 | −0.1 | −1.1 |
| N | −0.1 | −0.3 | −0.1 | −0.3 | 0.6 | 0.7 | 0.6 | 0.7 | 1.4 | 0.9 | 1.7 | 0.8 | −0.1 | −0.8 | −0.1 | −0.7 |
| D | −0.2 | −0.2 | −0.1 | −0.2 | 0.8 | 0.8 | 0.7 | 0.7 | 1.9 | 1.1 | 2.1 | 1.7 | −0.2 | −0.4 | −0.3 | −0.9 |
| Year | −0.0 | −0.1 | 0.0 | −0.2 | 0.4 | 0.4 | 0.3 | 0.5 | 1.5 | 1.2 | 1.8 | 0.4 | −0.2 | −0.6 | −0.2 | −0.6 |
Disclaimer/Publisher’s Note: The statements, opinions and data contained in all publications are solely those of the individual author(s) and contributor(s) and not of MDPI and/or the editor(s). MDPI and/or the editor(s) disclaim responsibility for any injury to people or property resulting from any ideas, methods, instructions or products referred to in the content. |
© 2023 by the authors. Licensee MDPI, Basel, Switzerland. This article is an open access article distributed under the terms and conditions of the Creative Commons Attribution (CC BY) license (https://creativecommons.org/licenses/by/4.0/).
Share and Cite
MDPI and ACS Style
Espín-Sánchez, D.; Olcina-Cantos, J.; Conesa-García, C. Temporal Changes in Tourists’ Climate-Based Comfort in the Southeastern Coastal Region of Spain. Climate 2023, 11, 230. https://doi.org/10.3390/cli11110230
AMA Style
Espín-Sánchez D, Olcina-Cantos J, Conesa-García C. Temporal Changes in Tourists’ Climate-Based Comfort in the Southeastern Coastal Region of Spain. Climate. 2023; 11(11):230. https://doi.org/10.3390/cli11110230
Chicago/Turabian StyleEspín-Sánchez, David, Jorge Olcina-Cantos, and Carmelo Conesa-García. 2023. "Temporal Changes in Tourists’ Climate-Based Comfort in the Southeastern Coastal Region of Spain" Climate 11, no. 11: 230. https://doi.org/10.3390/cli11110230
Note that from the first issue of 2016, this journal uses article numbers instead of page numbers. See further details here.