
A GIS-Based Assessment of Flood Hazard through Track Records over the 1886–2022 Period in Greece

 ,
, 
 ,
,  ,
, 
Abstract
:1. Introduction
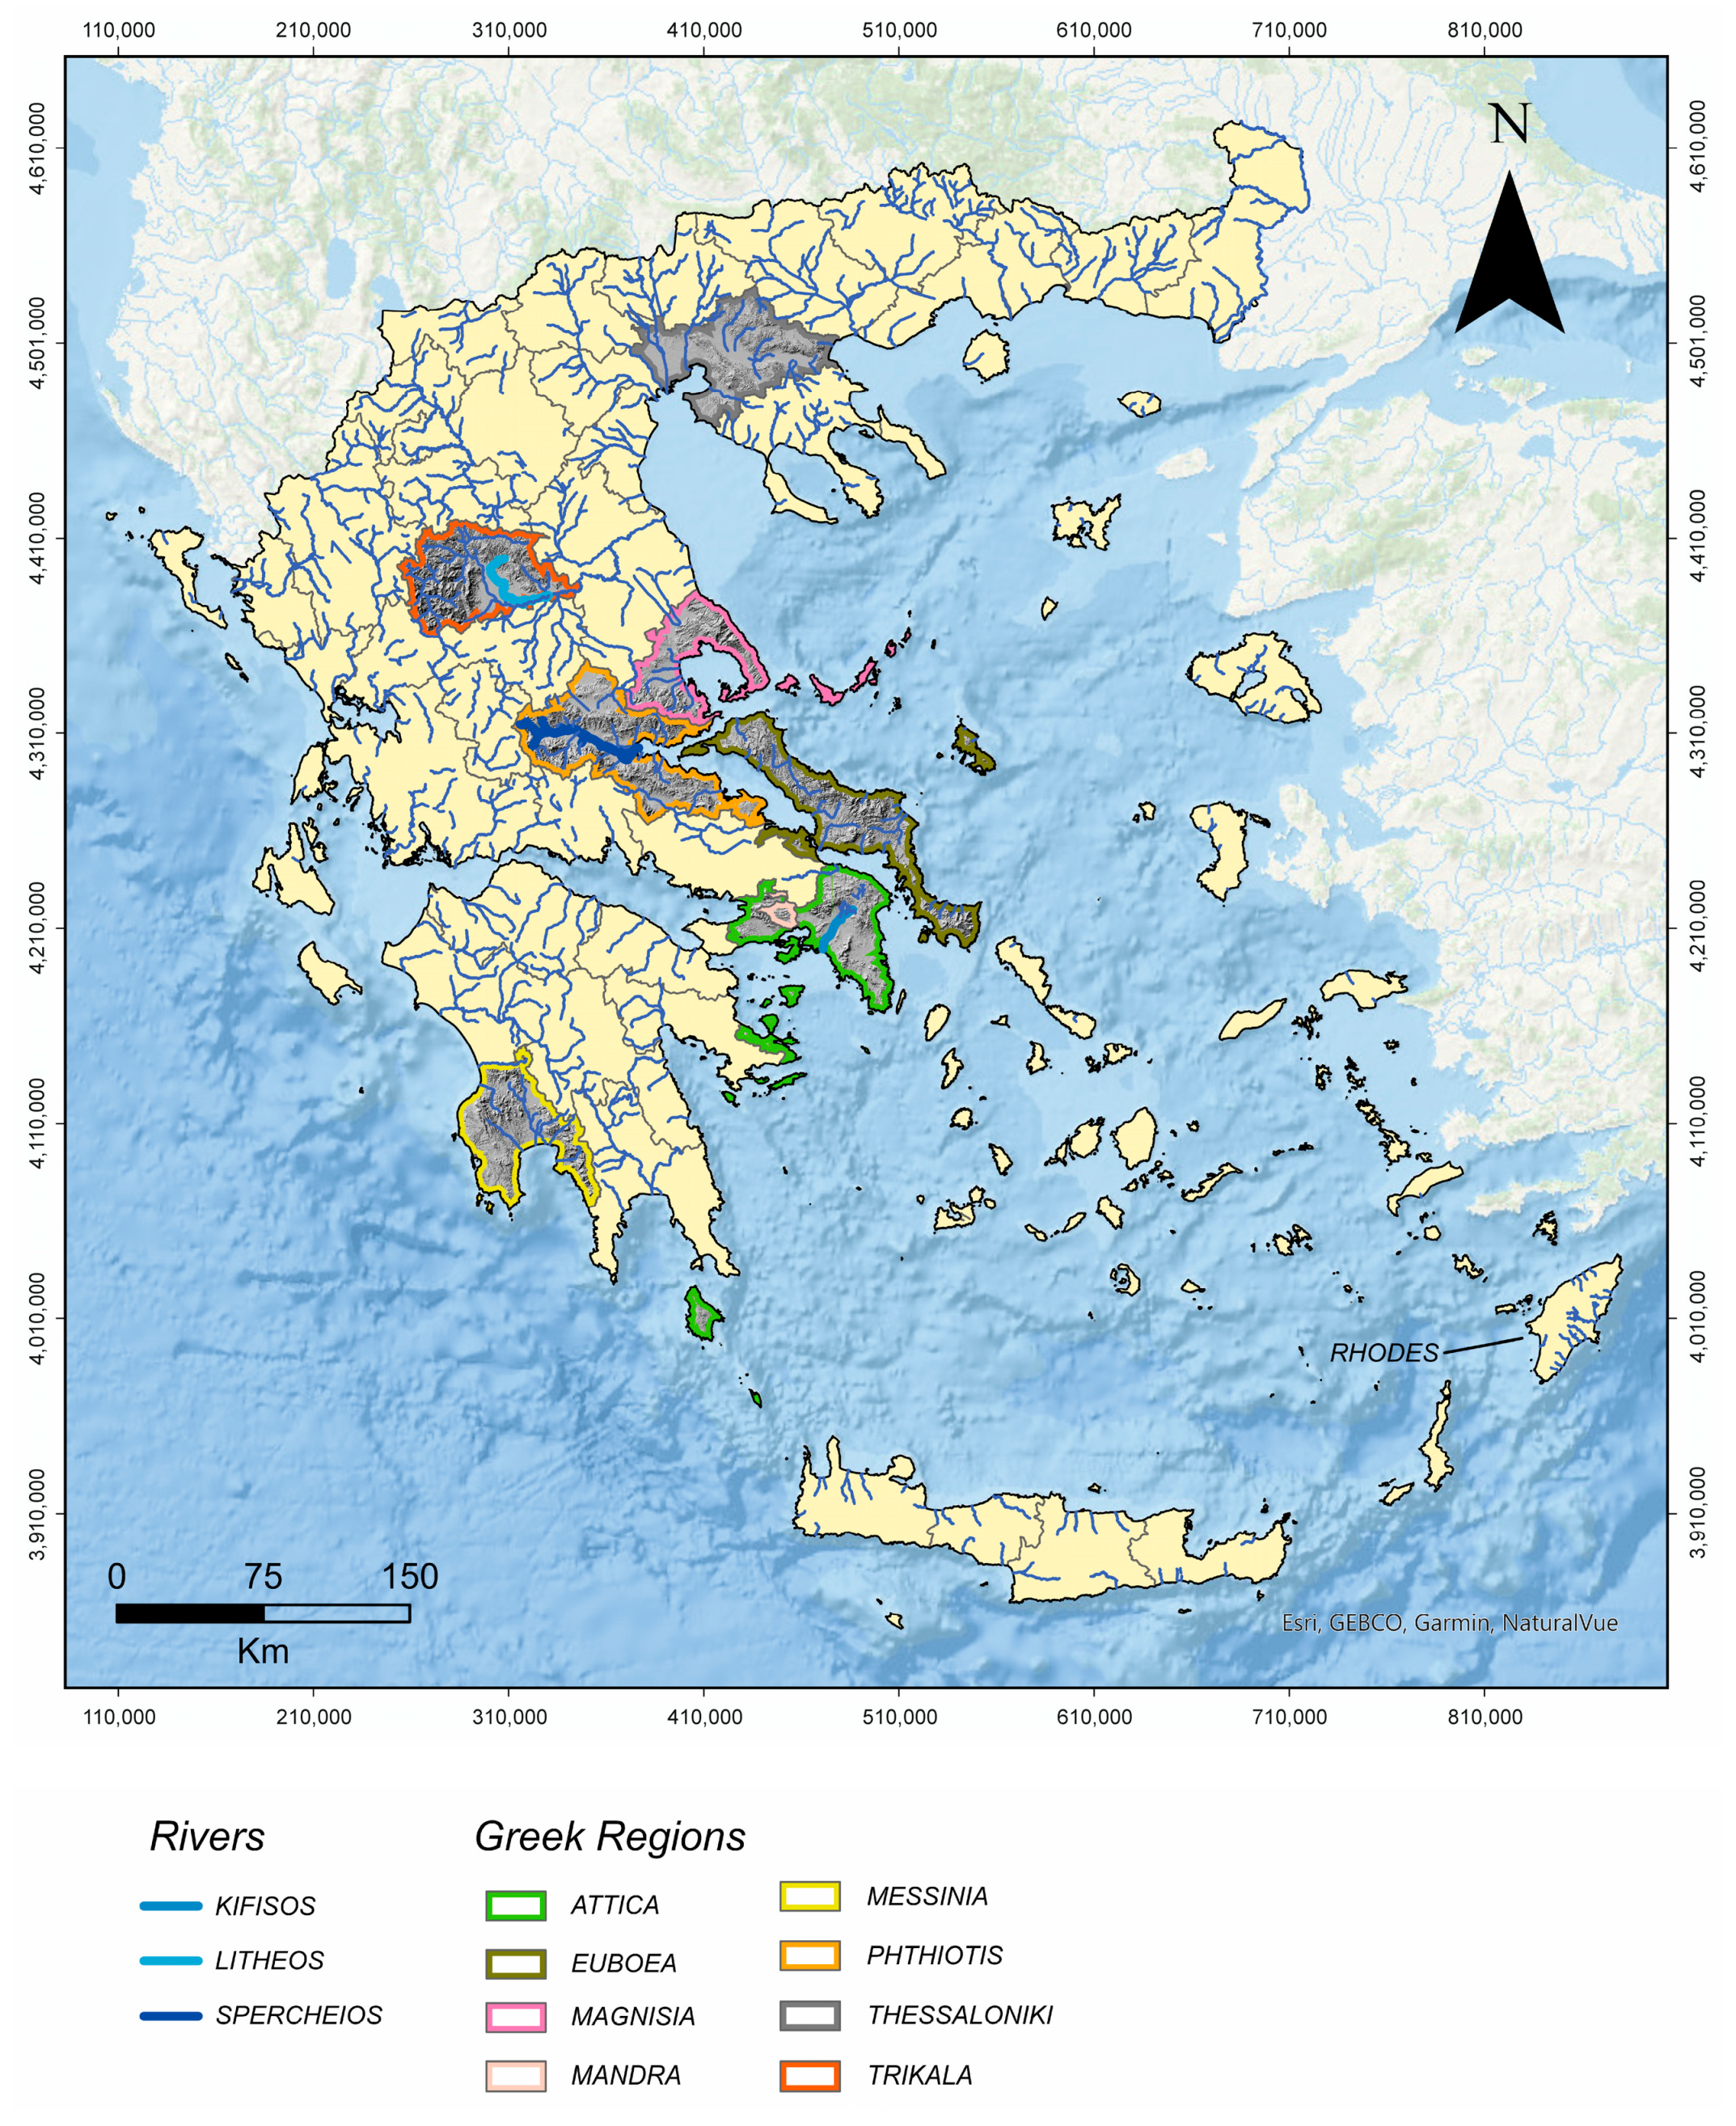
2. Regional Setting
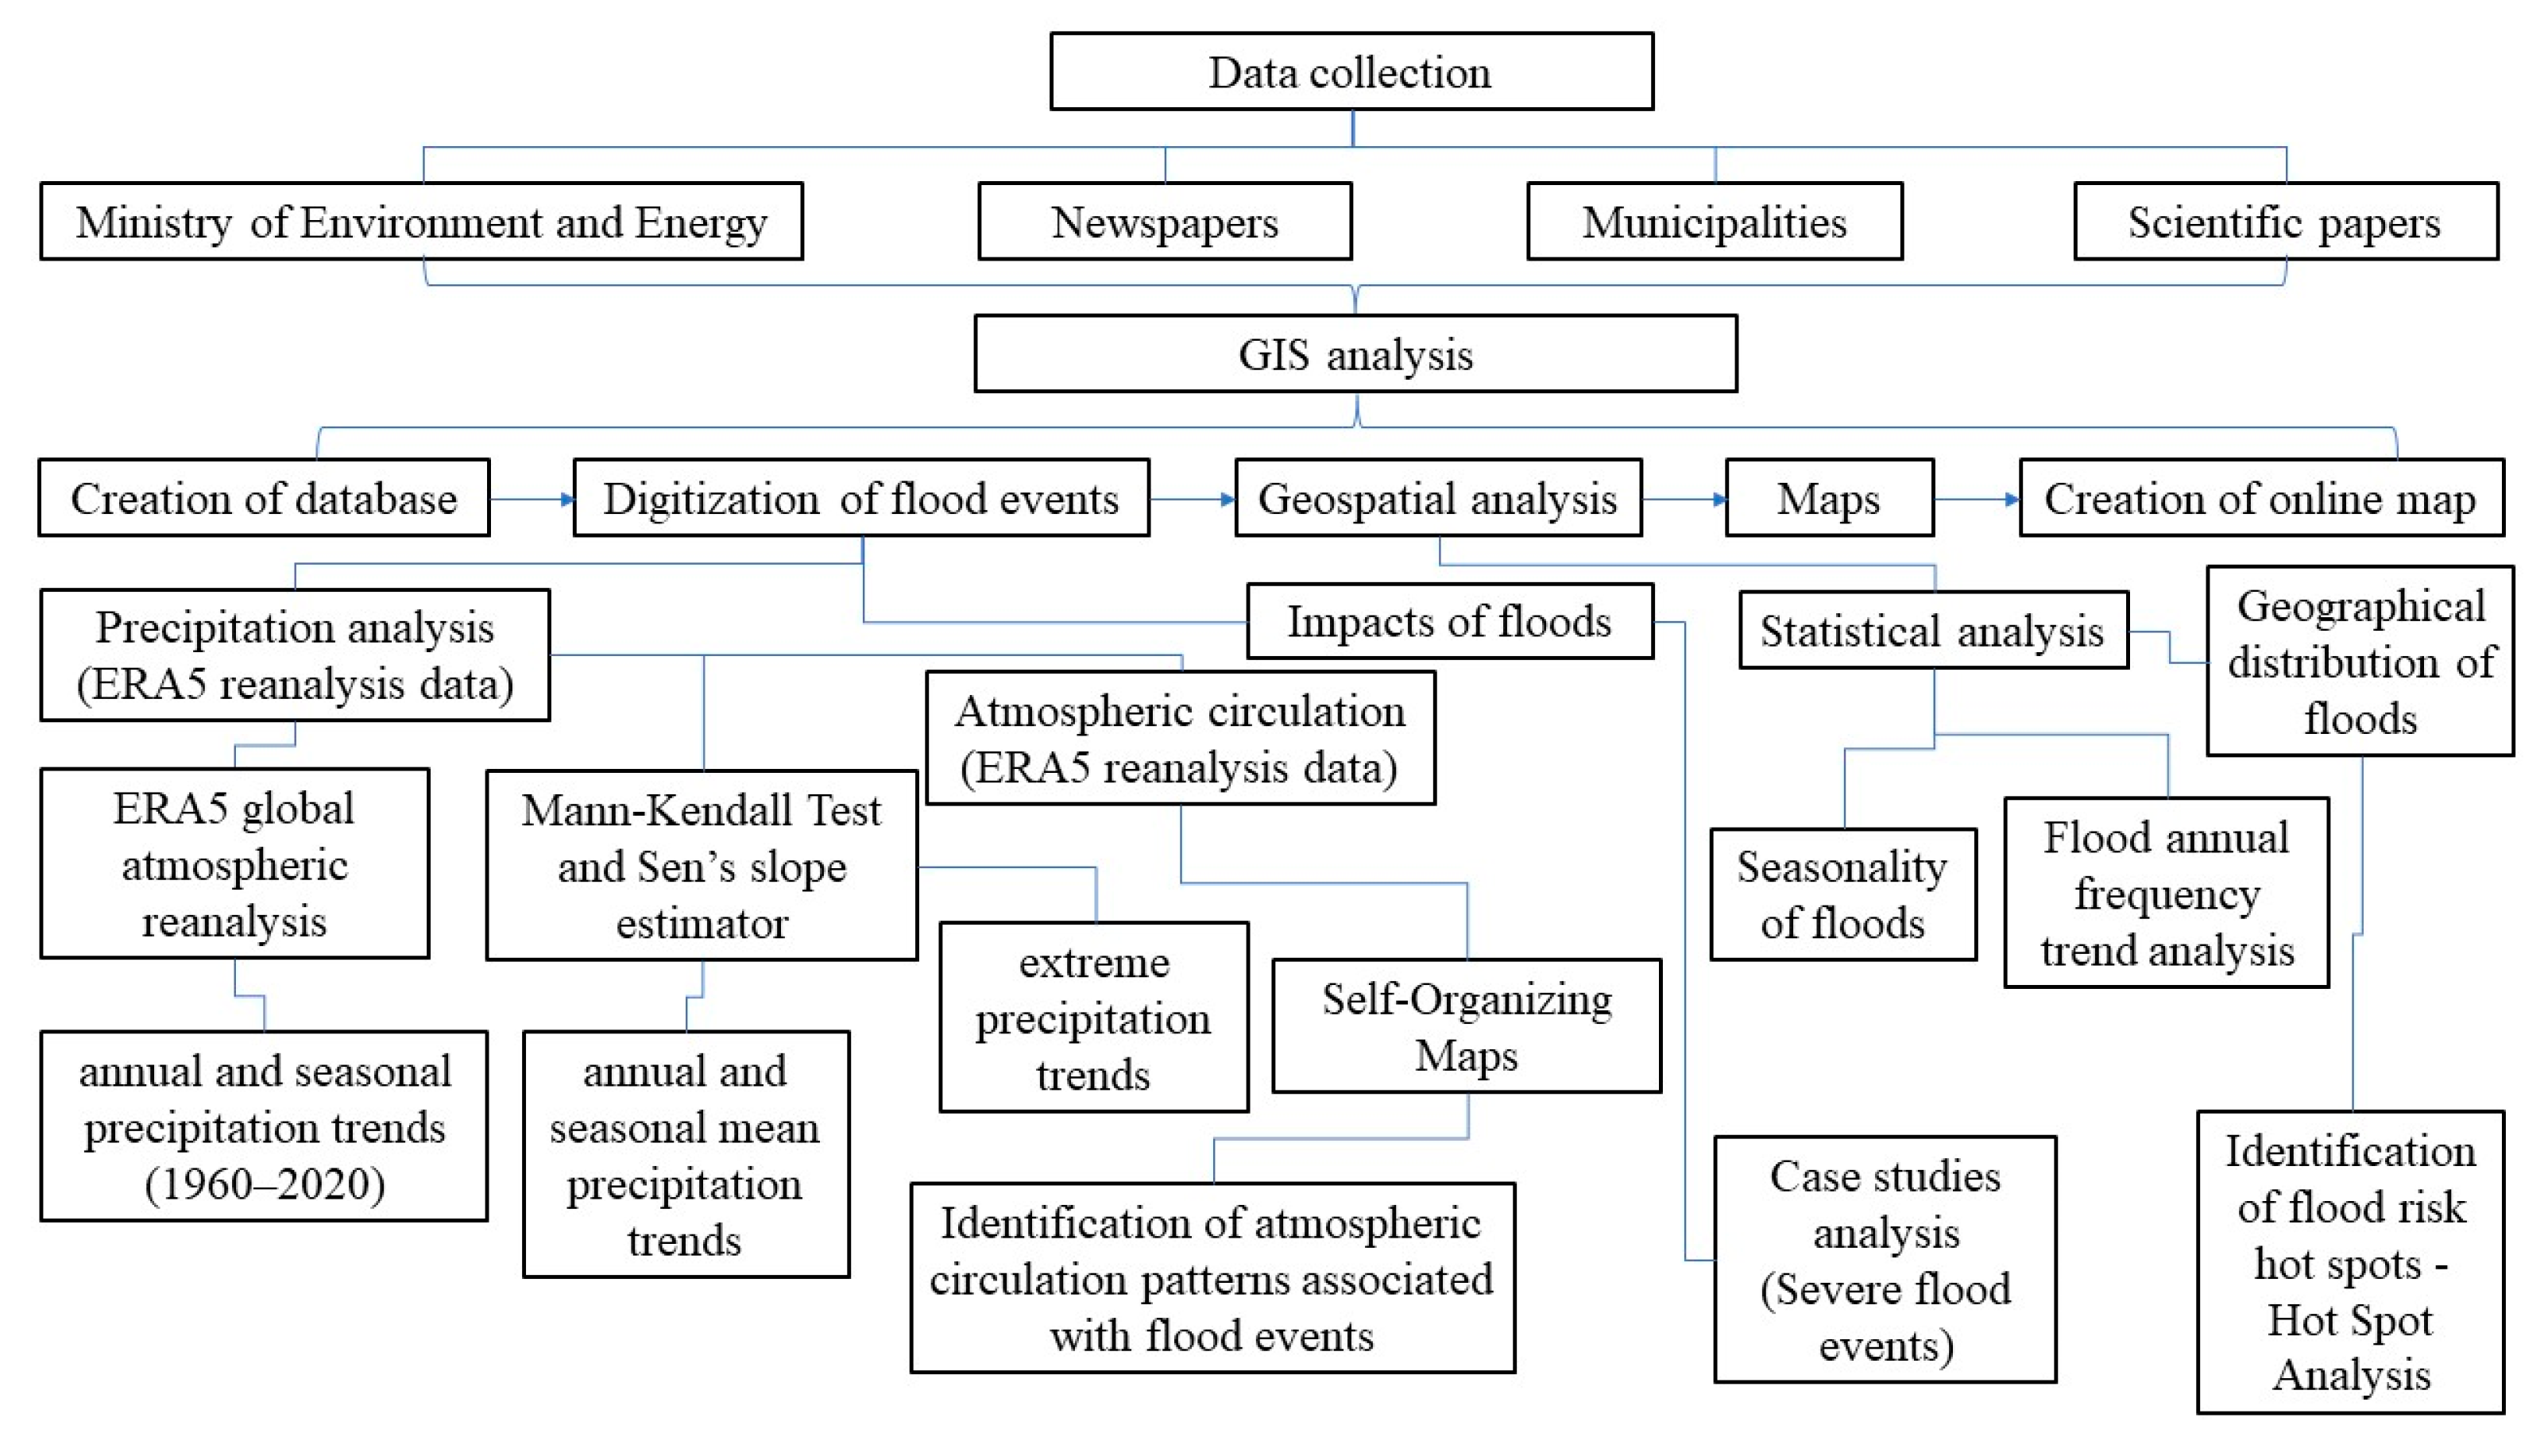
3. Materials and Methods
4. Results
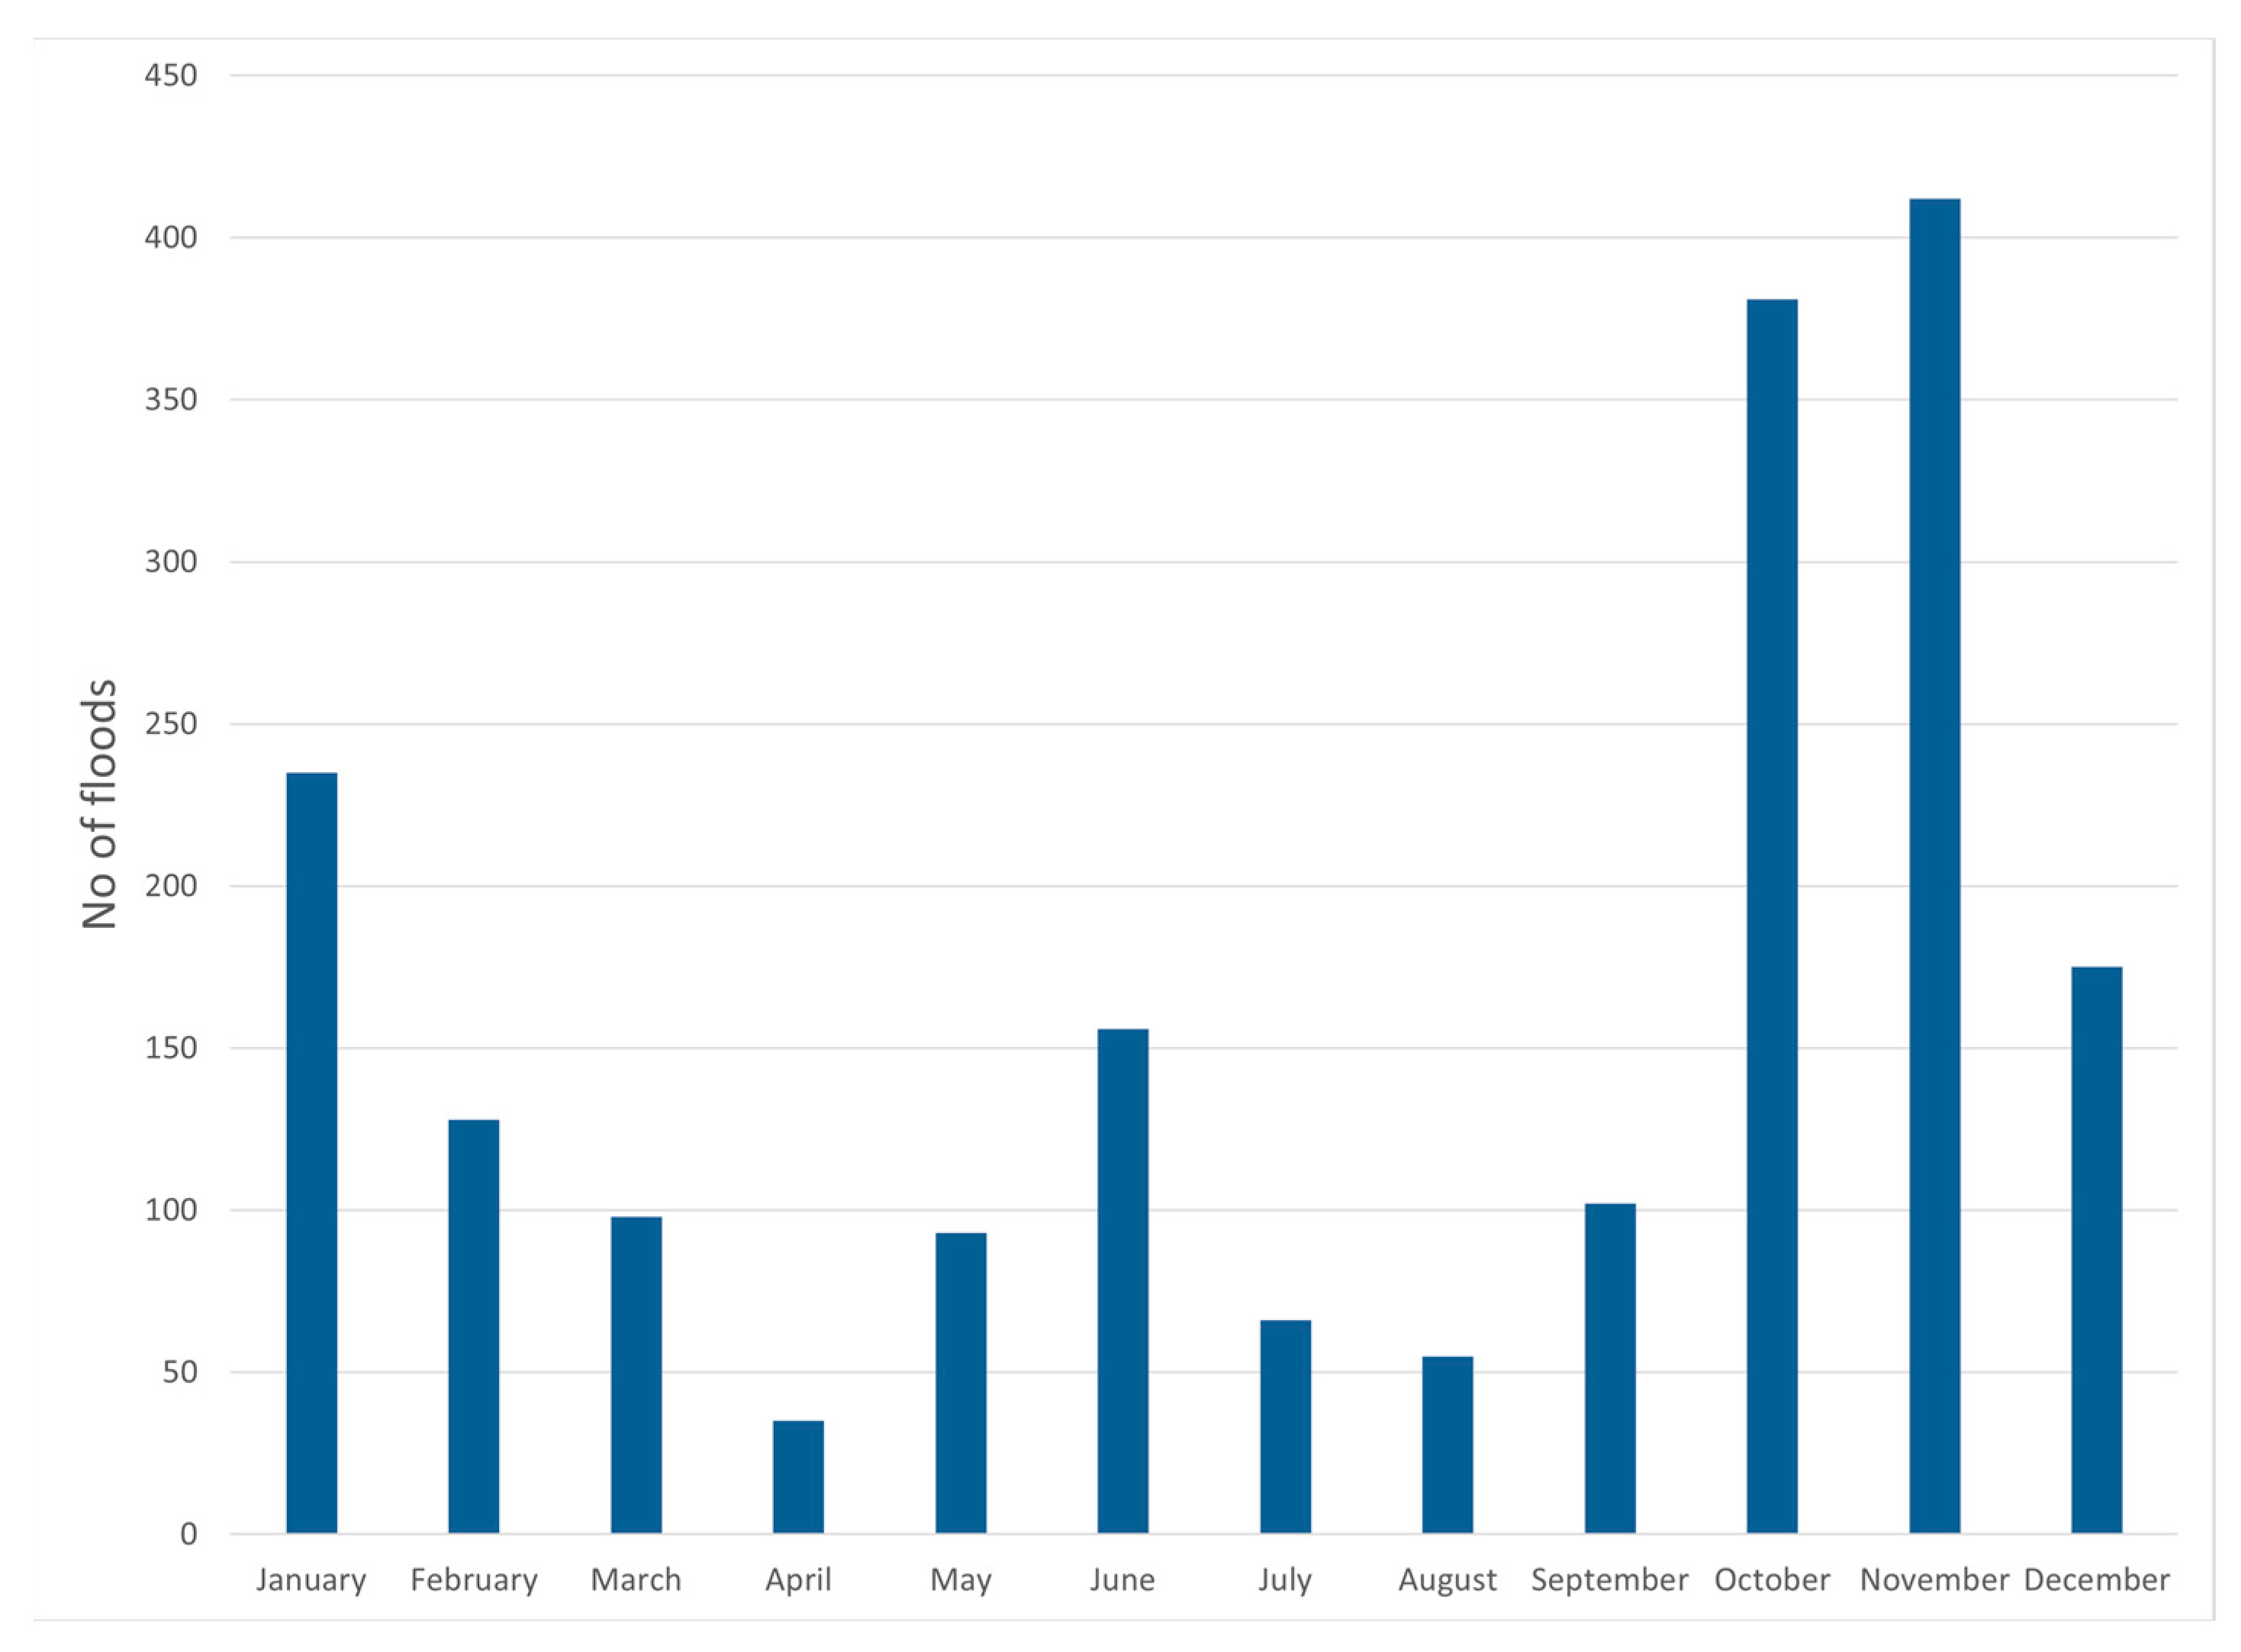
4.1. Seasonality of Flood Events
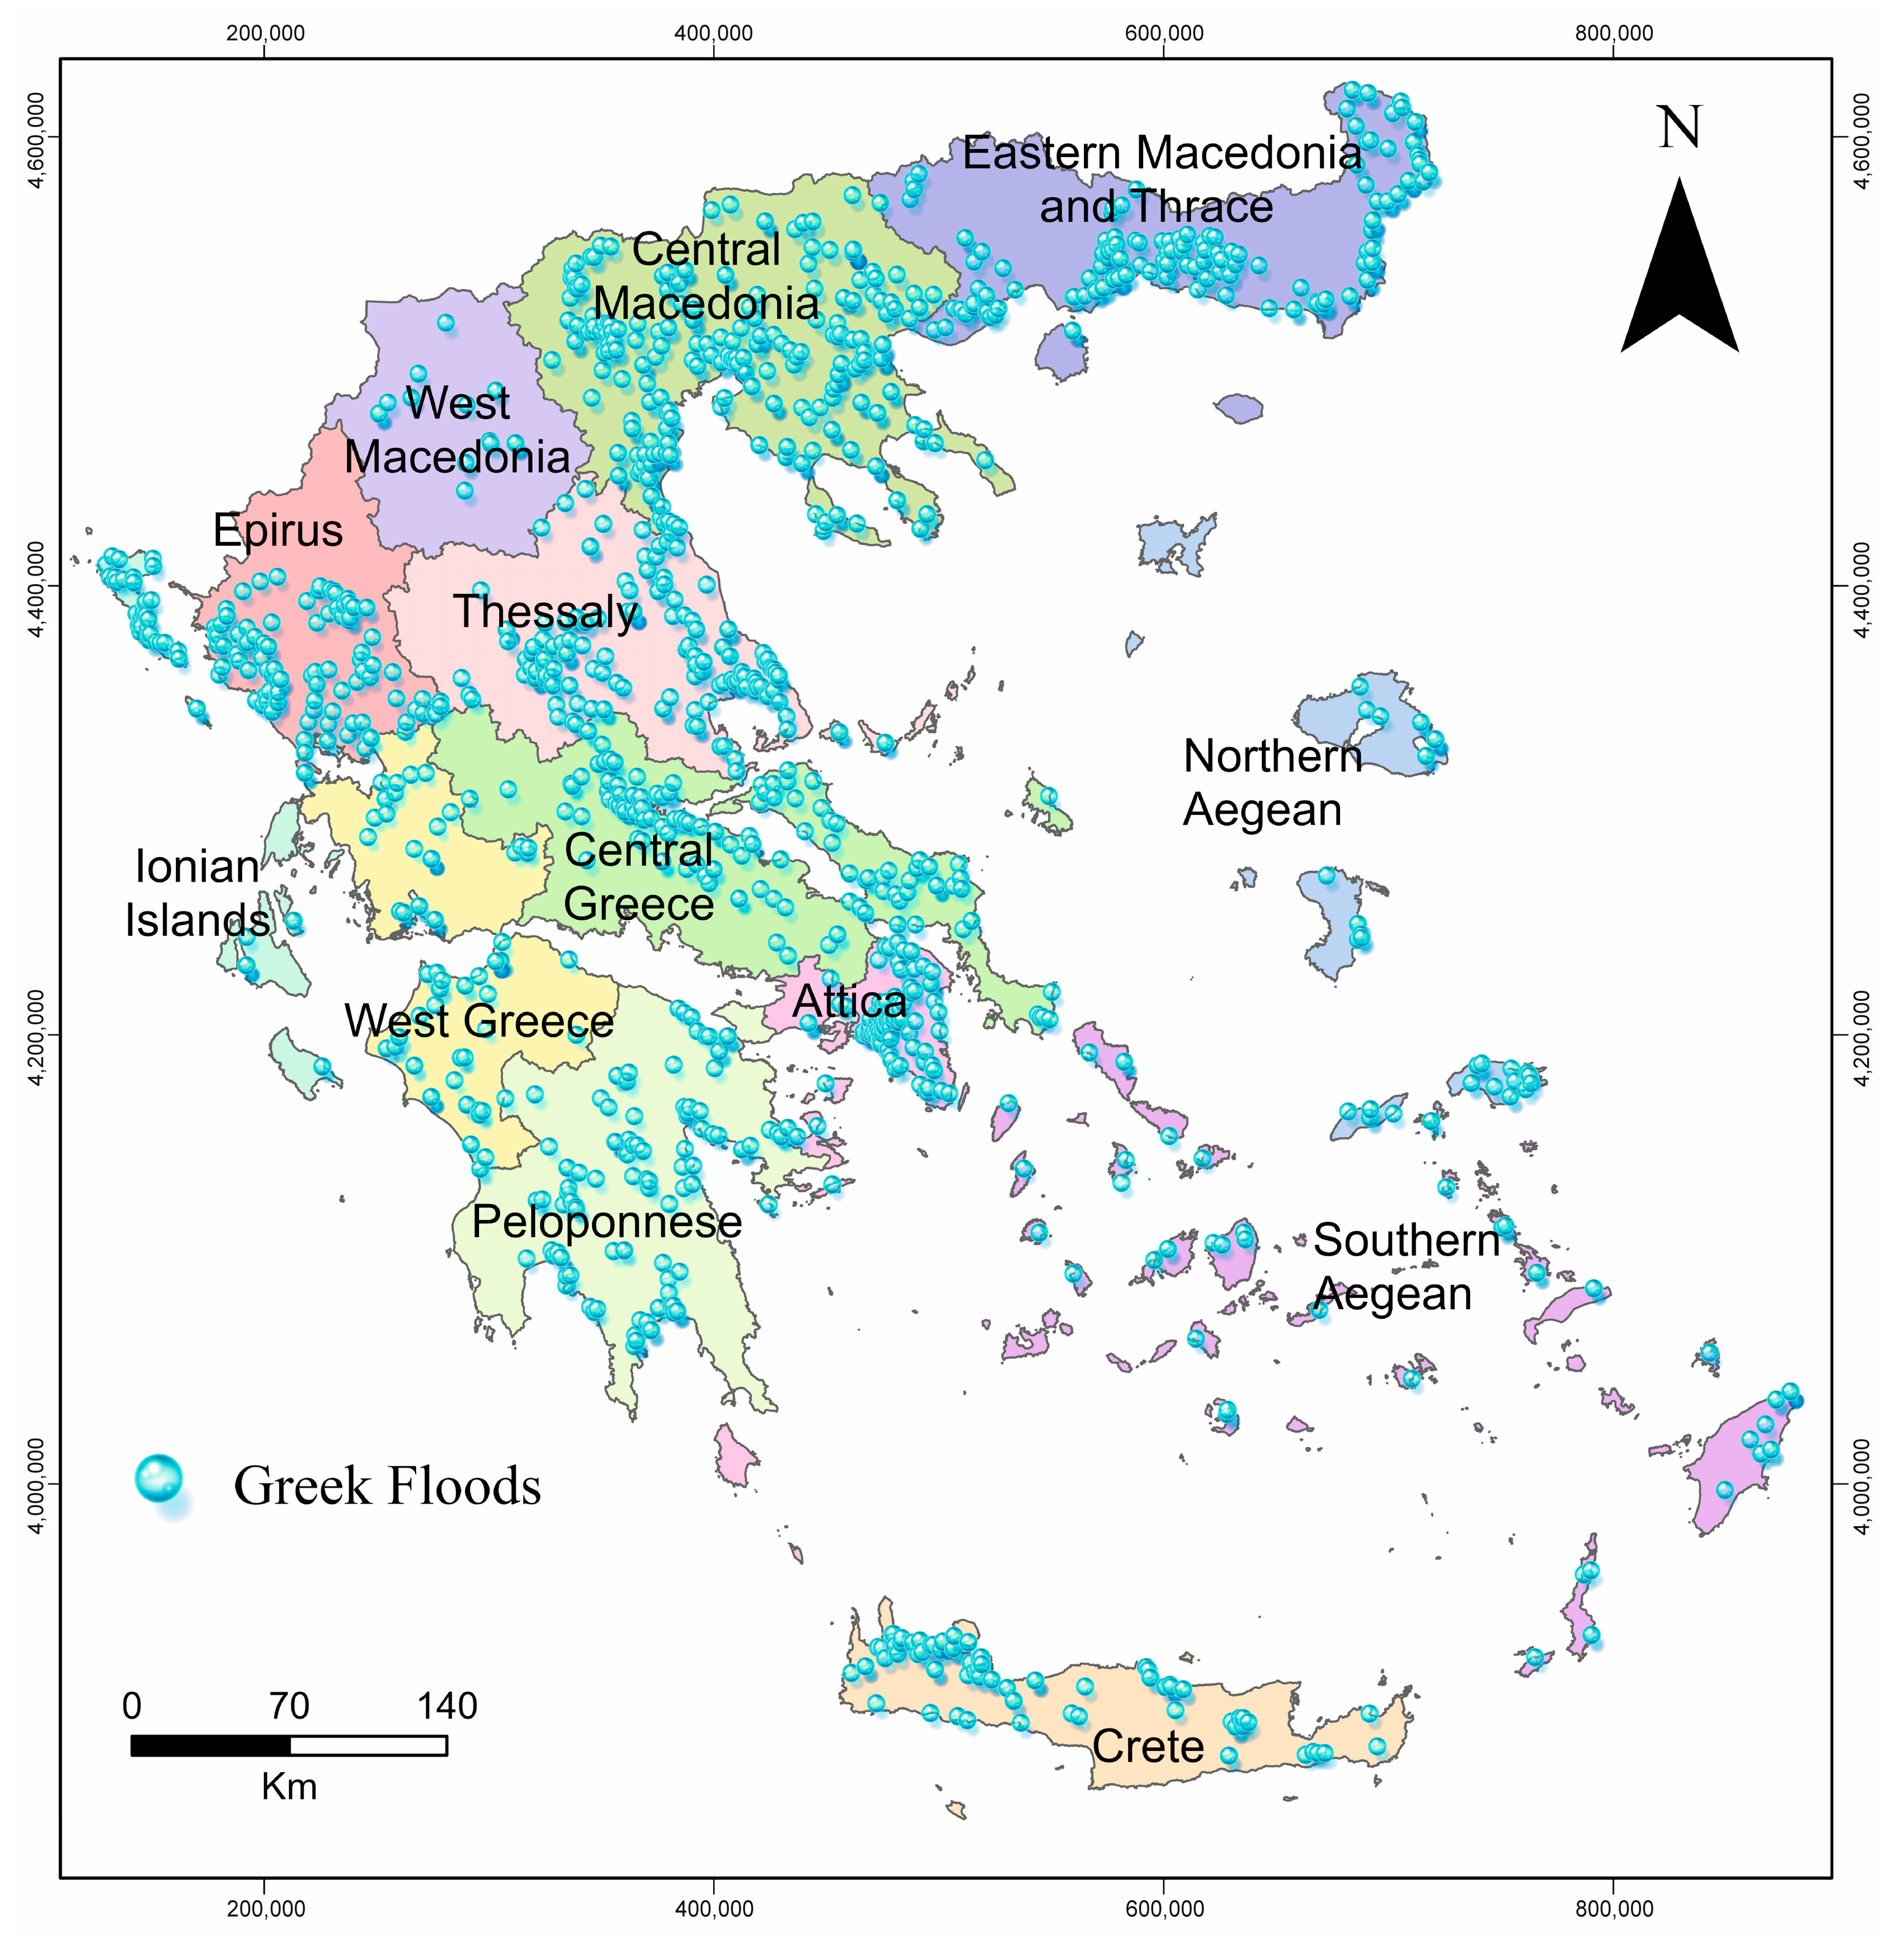
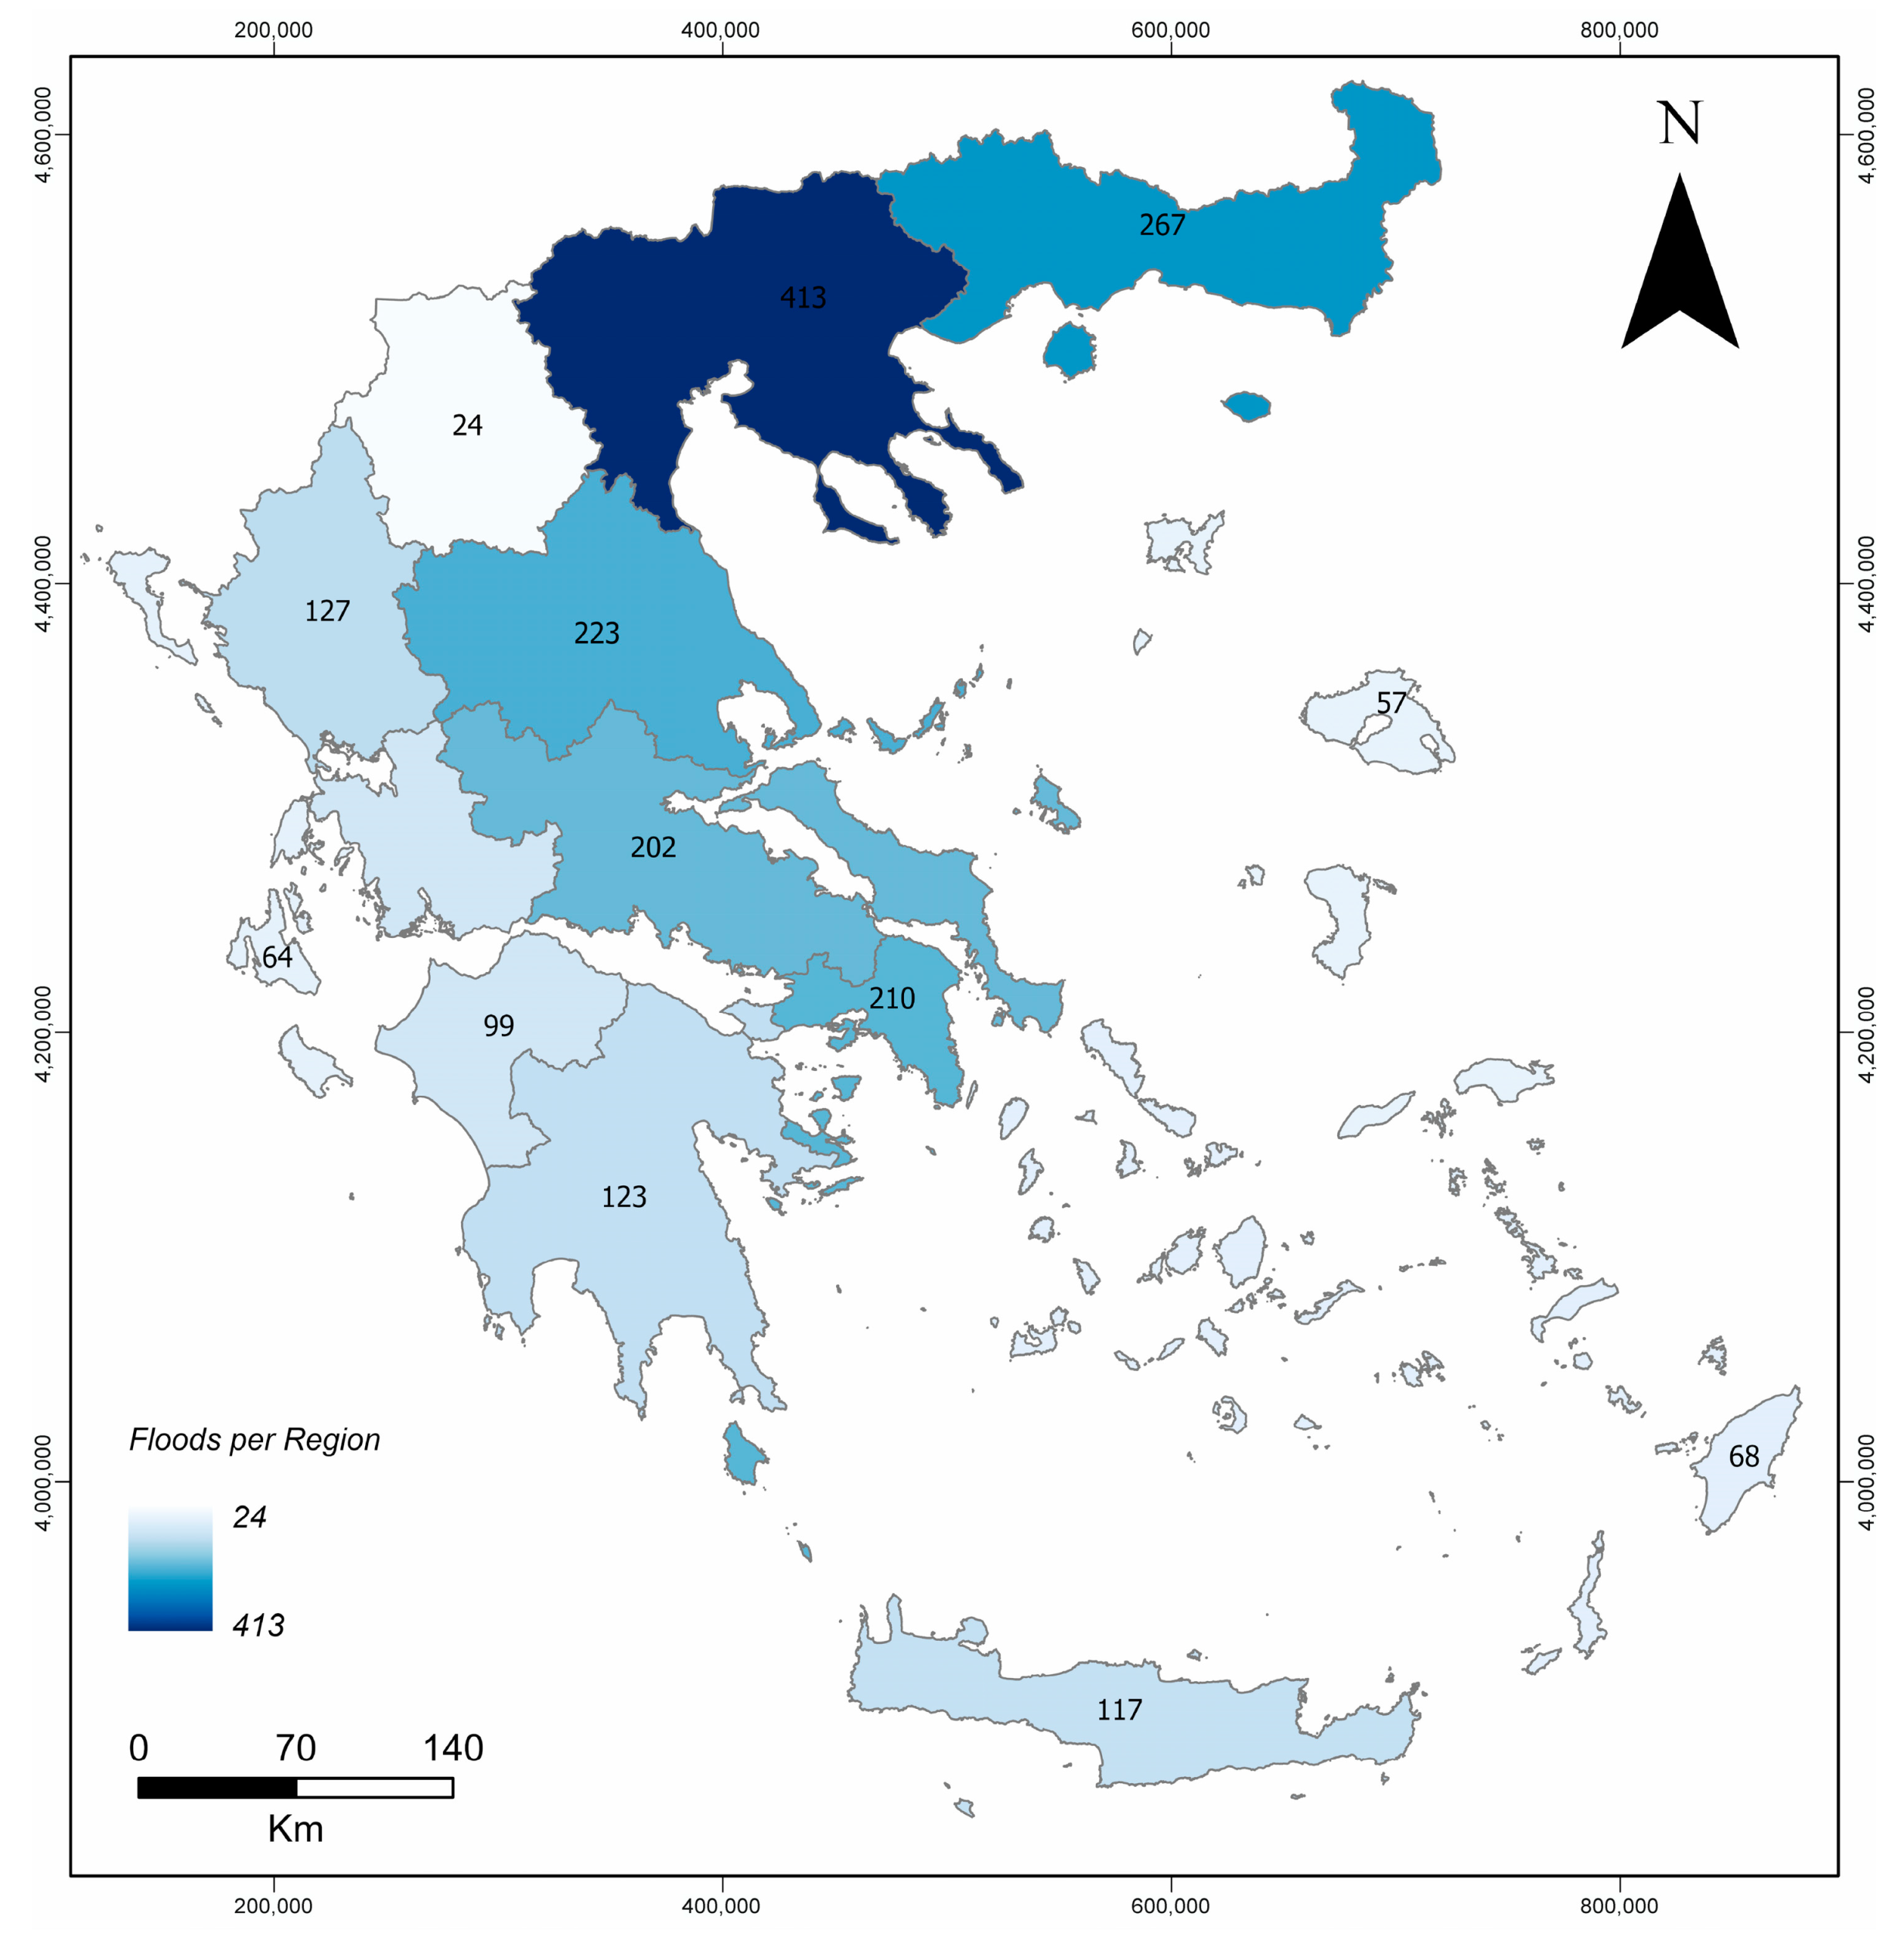
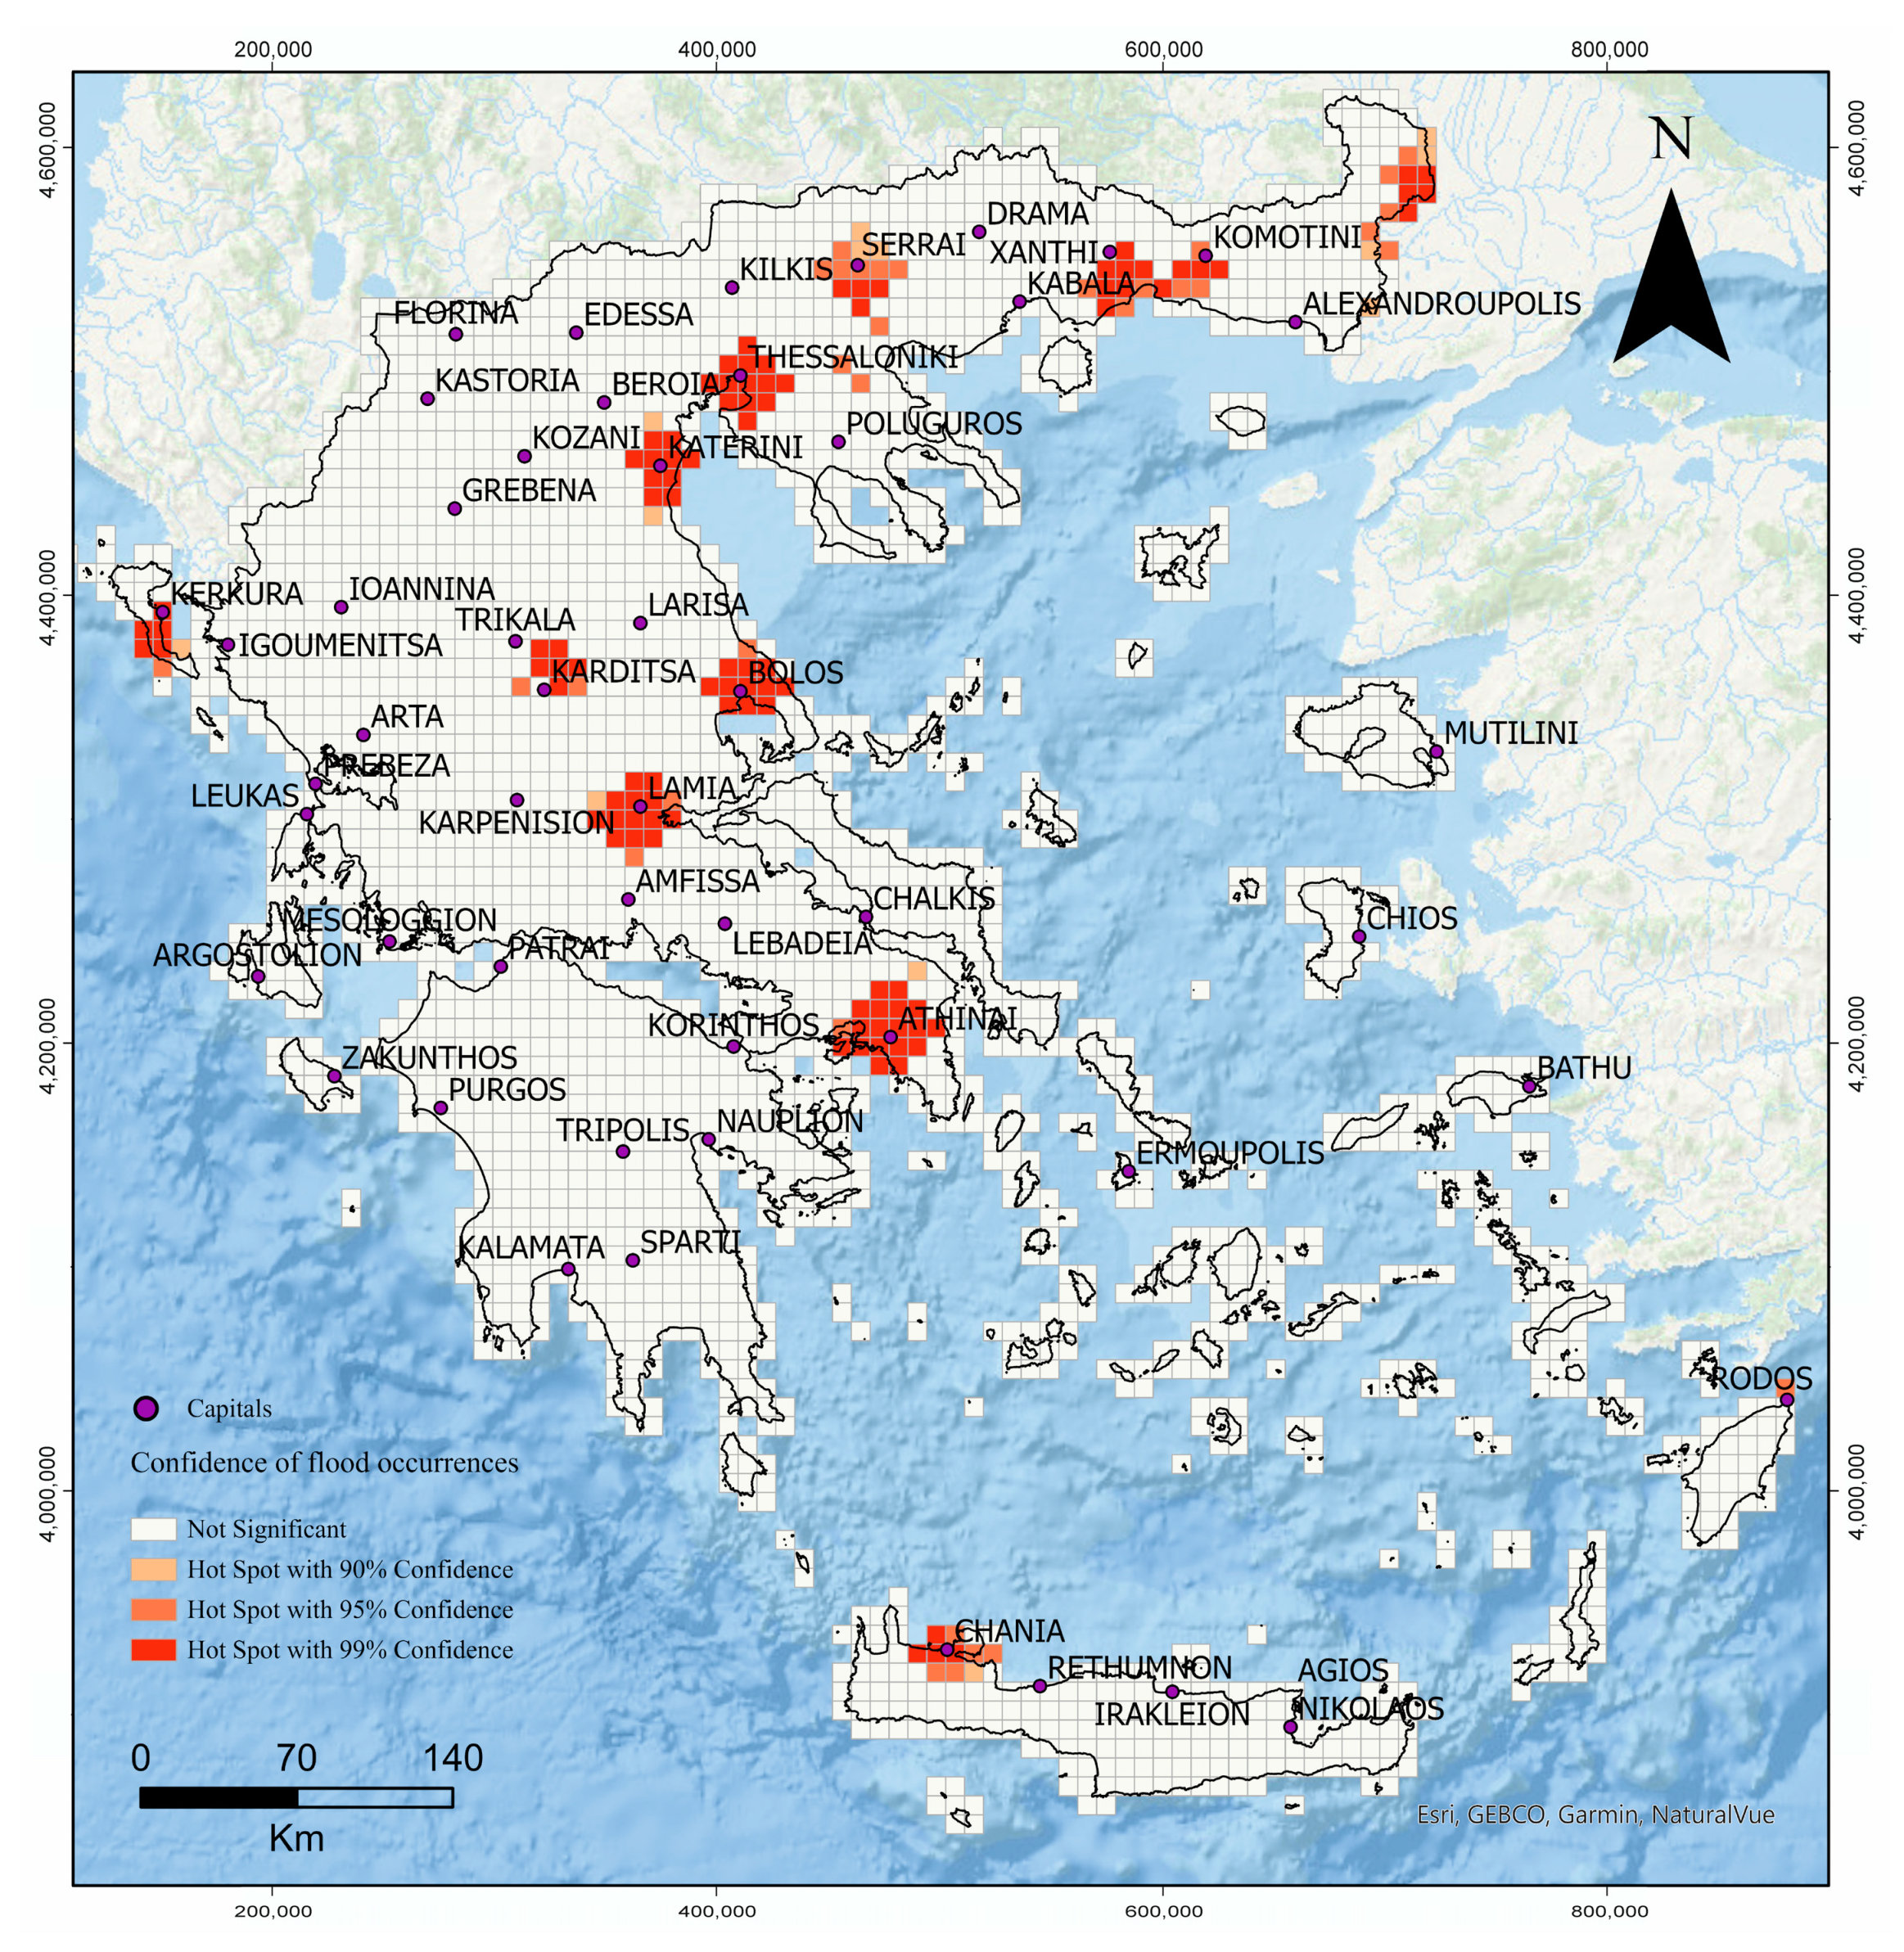
4.2. Geographical Distribution of Flood Events
4.3. The Most Severe Floods in Greece
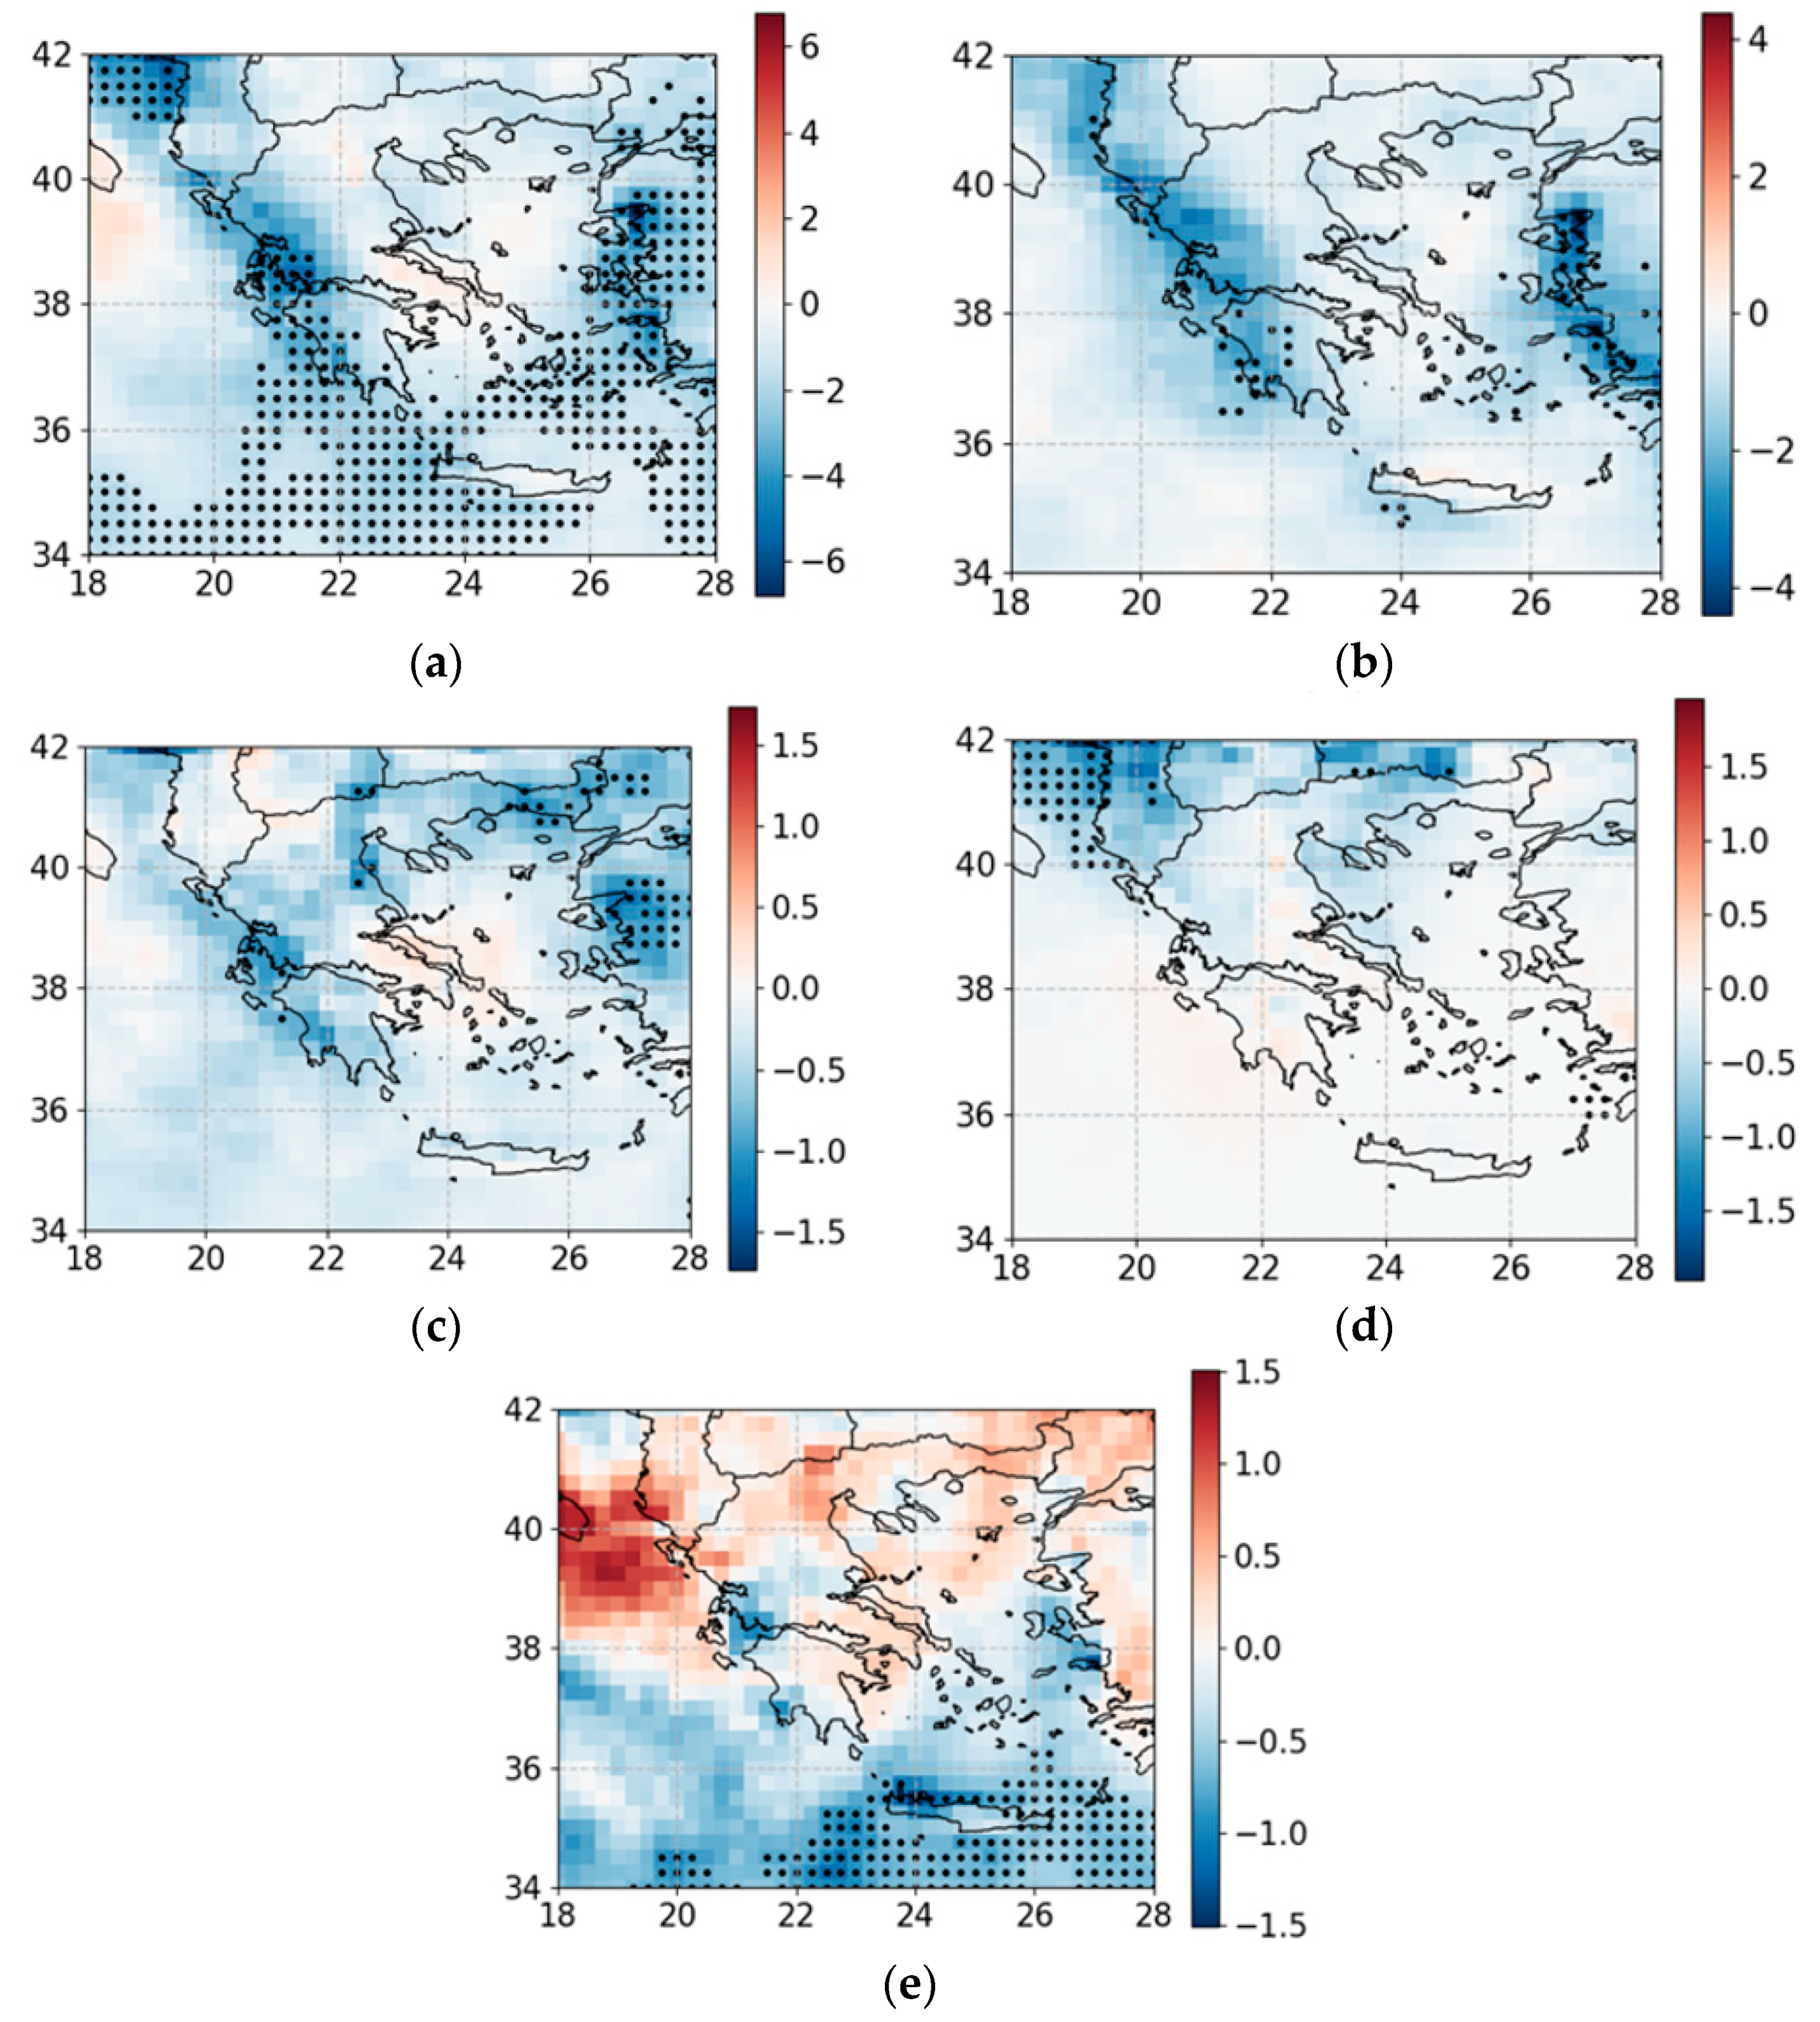
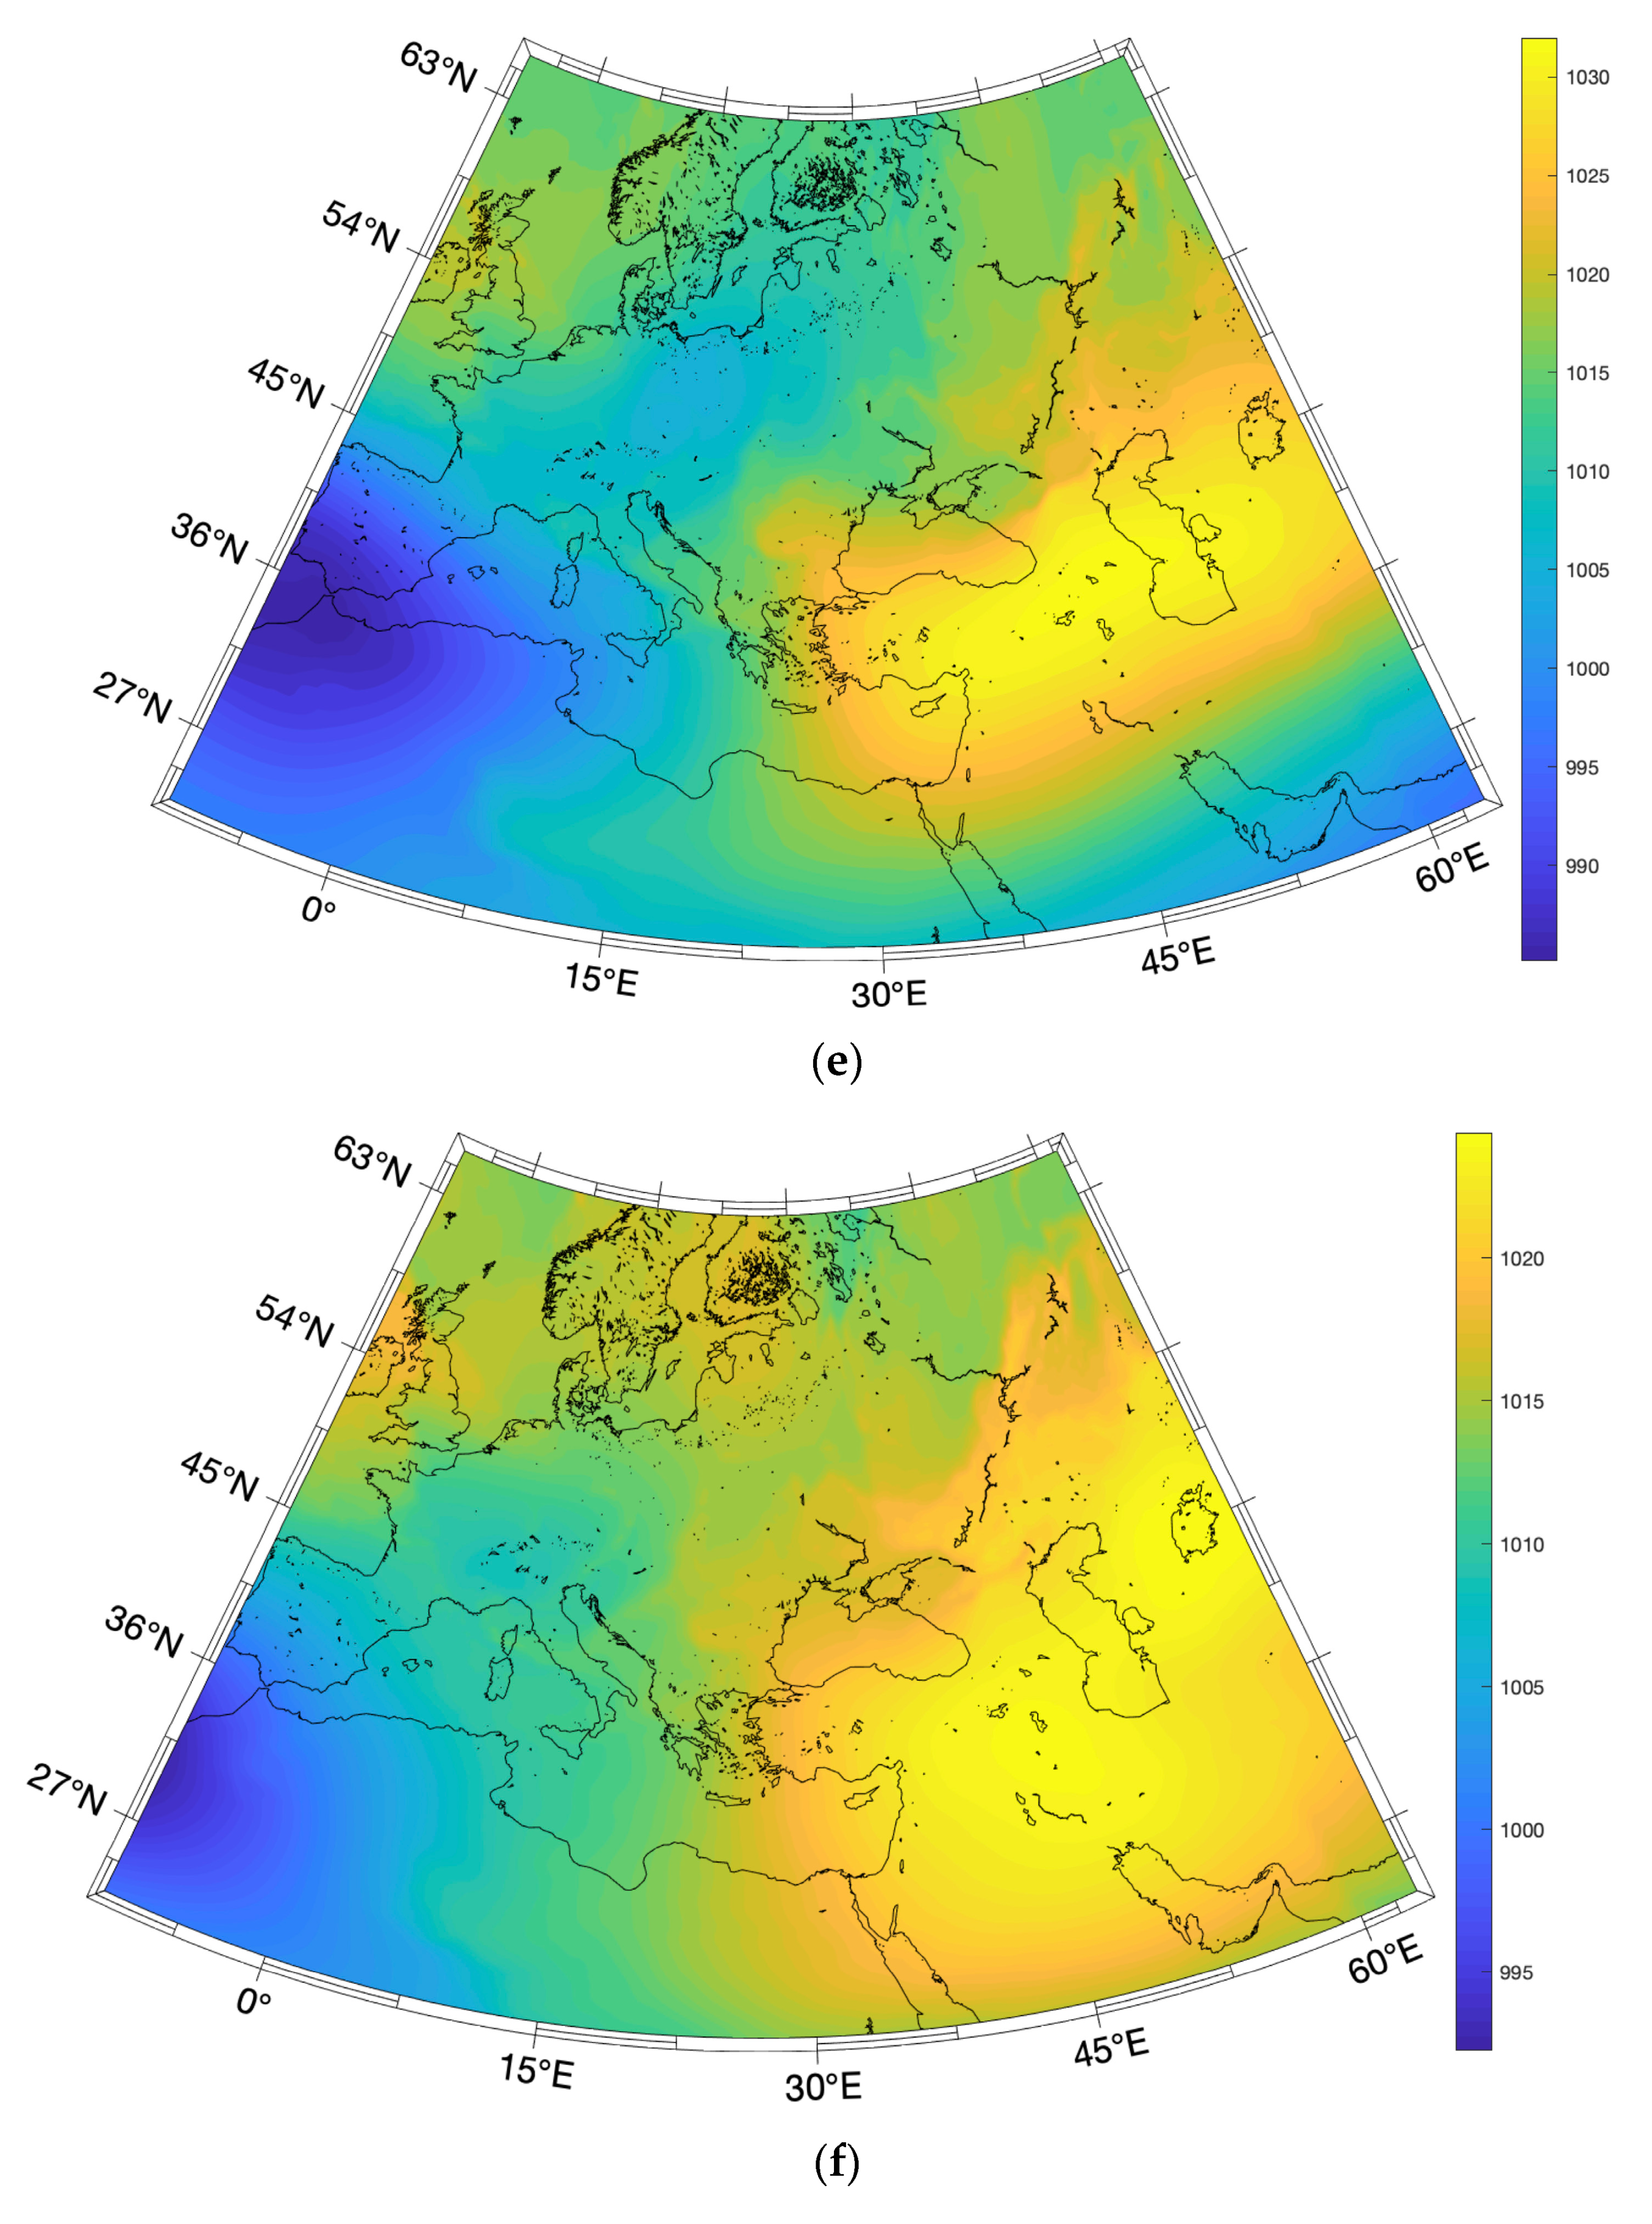
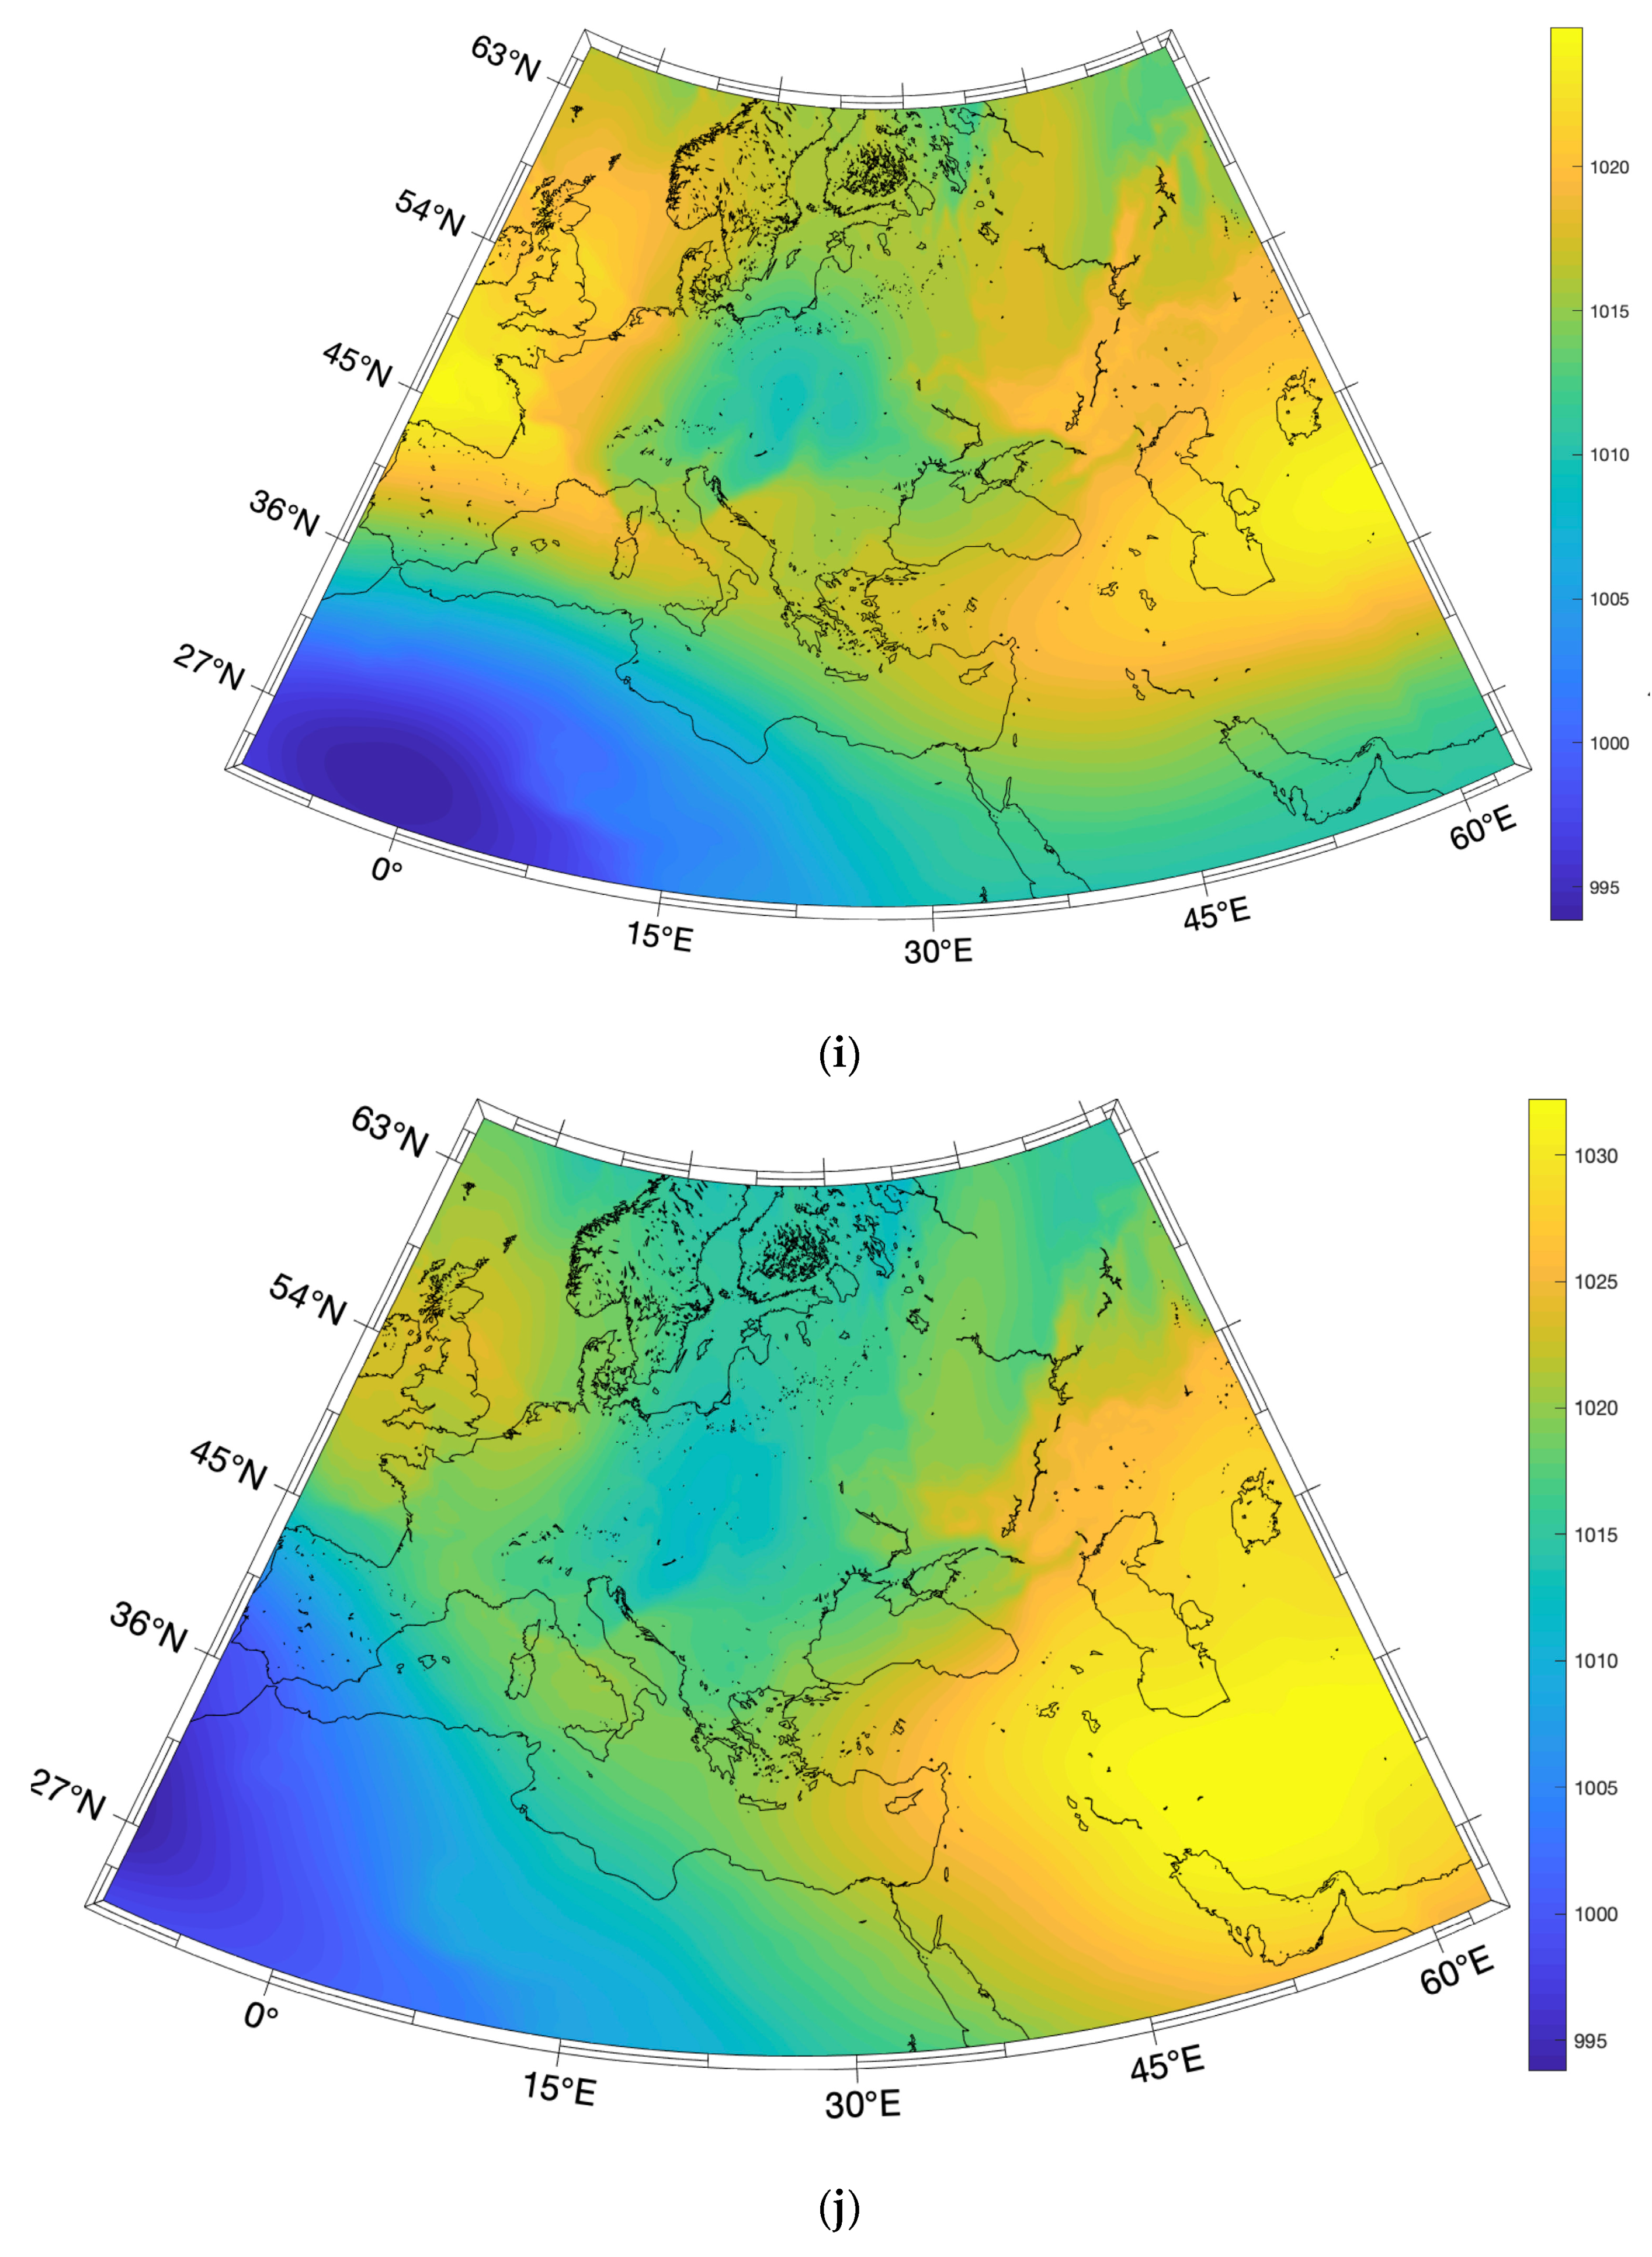
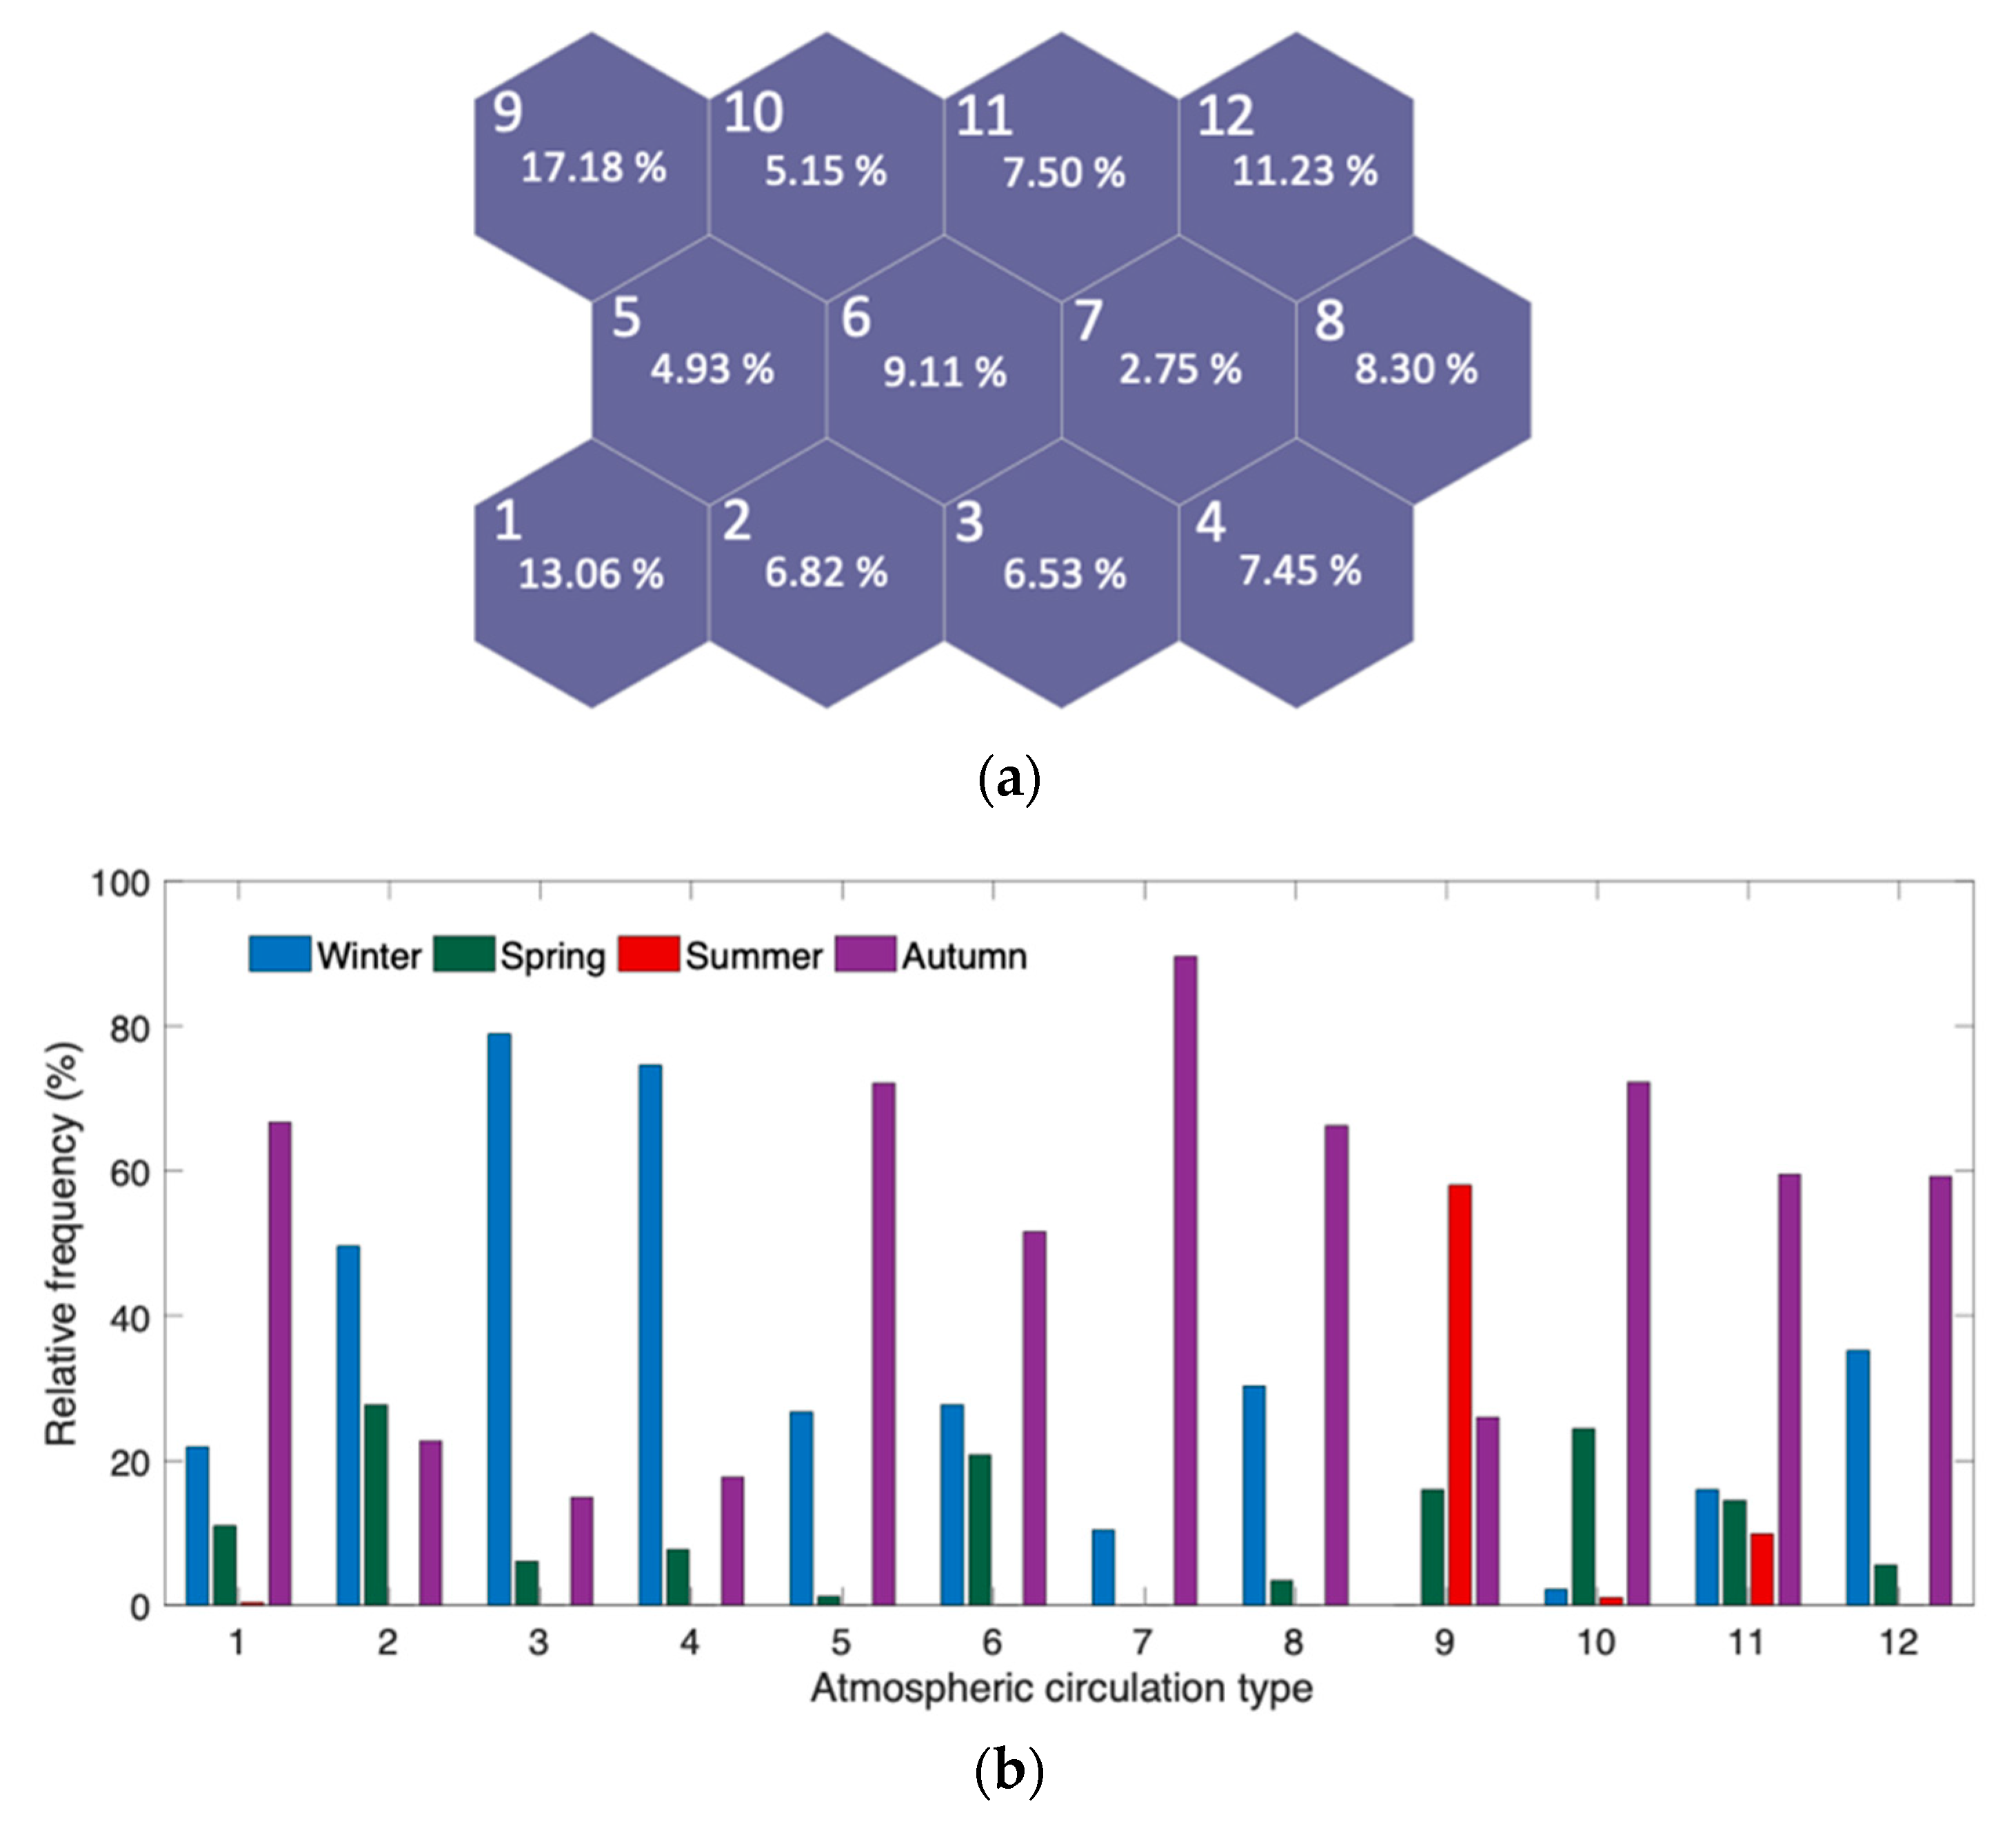
4.4. Climatic Drivers of Floods
5. Discussion
5.1. Urbanization and Land Use Changes and Flood Frequency and Impacts
5.2. Major Factors Causing Flood Events in Greece
5.3. Advantages of a Flood Catalog/Database at National Level
5.4. Major Limitations in the Current Study
6. Conclusions
- There were more records during the 21st century than in previous centuries, due to scarce recording and measuring, which was partly owed to the conflicts and wars.
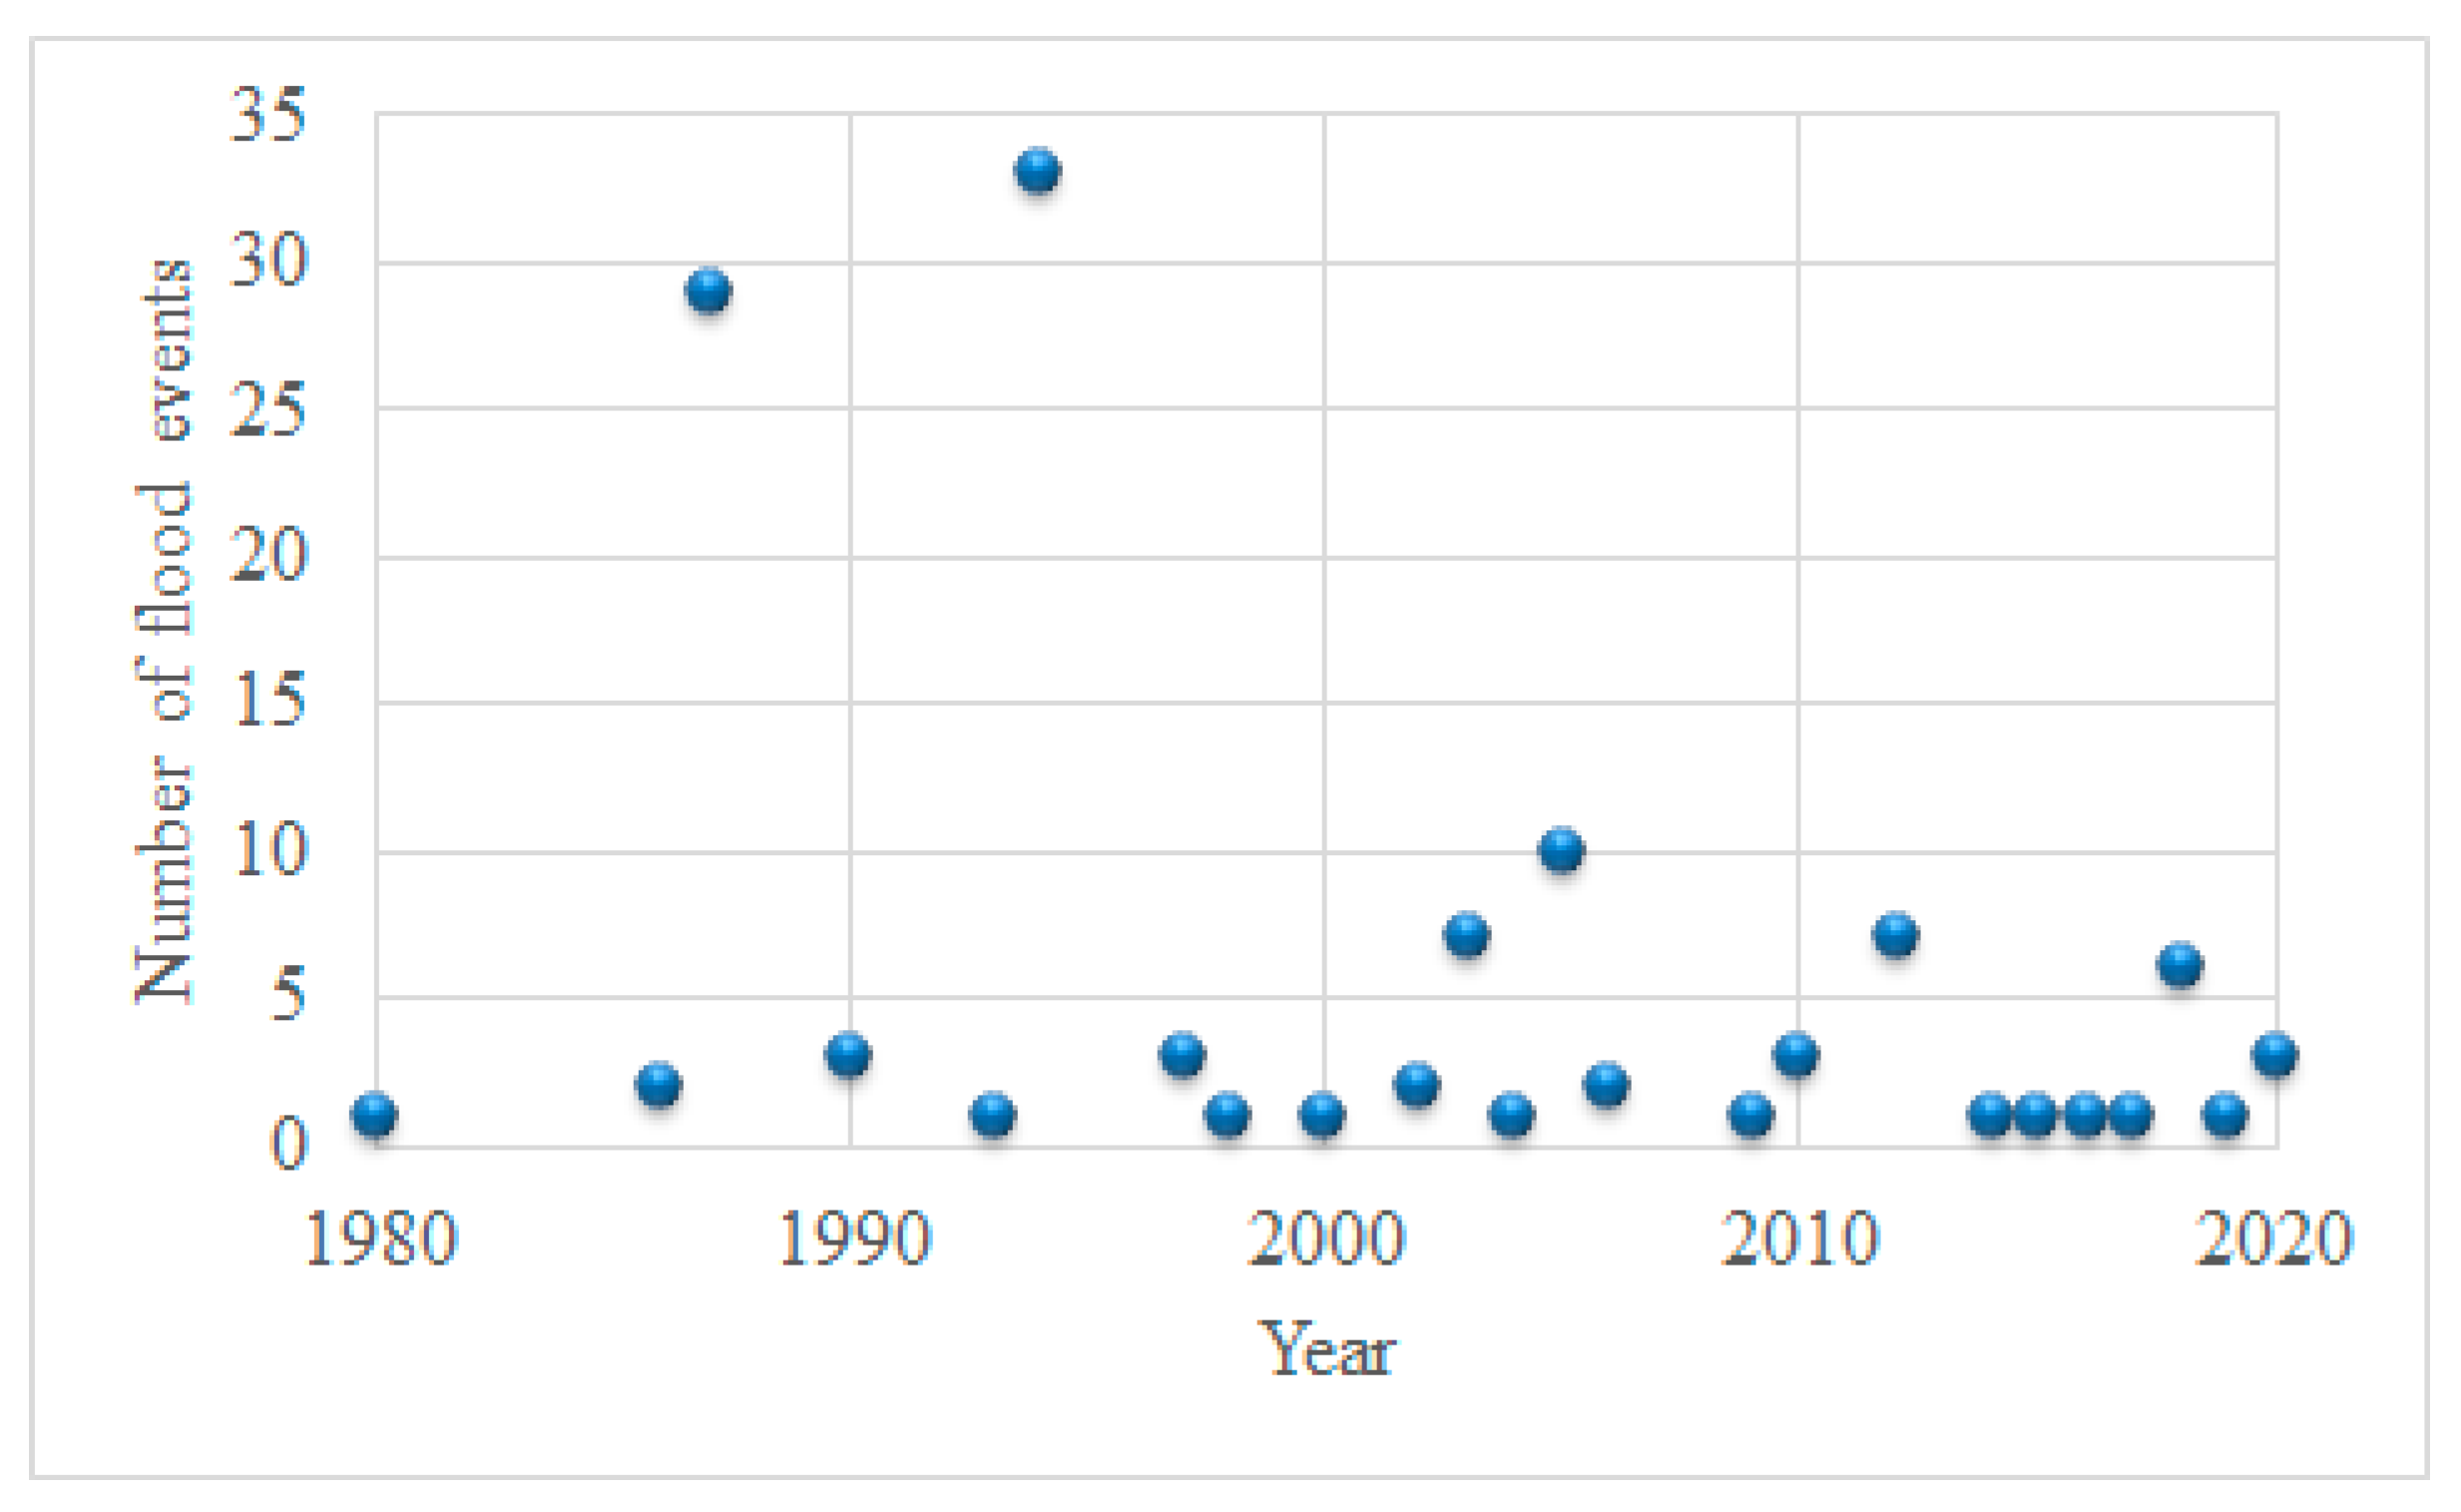
- Taking this into account, the flood number seems to have increased from approximately 1886 to 2010, possibly as a result of climate change (smaller number of rainfalls, but more intense and frequent extreme rainfall/storm events). Between 2000 and 2015, the flood record reached its peak, and between 2015 and 2022, a slight decrease was observed.
- Regarding rural regional units, the eastern part of the Greek mainland and the Aegean islands show a higher flood frequency compared to the western mainland and the Ionian islands, even though western Greece has a higher annual precipitation. This has been attributed to the important role of extreme events, which seem to be more frequent in eastern Greece, generating flash floods.
- Both mountainous areas and regional units drained by major rivers were found to be inundated relatively frequently, which indicates that, in Greece, both flash floods in mountainous catchments and typical floods owed to major rivers are important, and both can potentially cause severe damages.
- Urban floods make up a very large portion of the overall flood record, and they mainly occur in the two large urban centers, Athens and Thessaloniki, due to the continuously increasing urbanization and human interventions, in association with ineffective or inexistent flood protection measures.
- Most floods occurred during the autumn and winter months and predominantly between October and January. November has the most flood events, followed by October. During the spring and summer months, floods are less common, with April bearing the smallest number of events.
- High-resolution analysis of the driving factors of atmospheric phenomena can contribute to the development of early warning systems for civil protection. For instance, a critical factor, especially during winter and autumn, is the location of the low-pressure centers with respect to Greece.
- The mean trends of precipitation at the yearly and seasonal scales for the 1960–2020 period demonstrate a clear statistically significant decrease in the western part of Greece. Mixed trends are recognized for the eastern part (e.g., positive trends for Attica). For the autumn period, when most of the flood events are reported, the spatial distribution of trends exhibit a clear shift towards positive values mainly in northern Greece, the northern Aegean and eastern-central Greece.
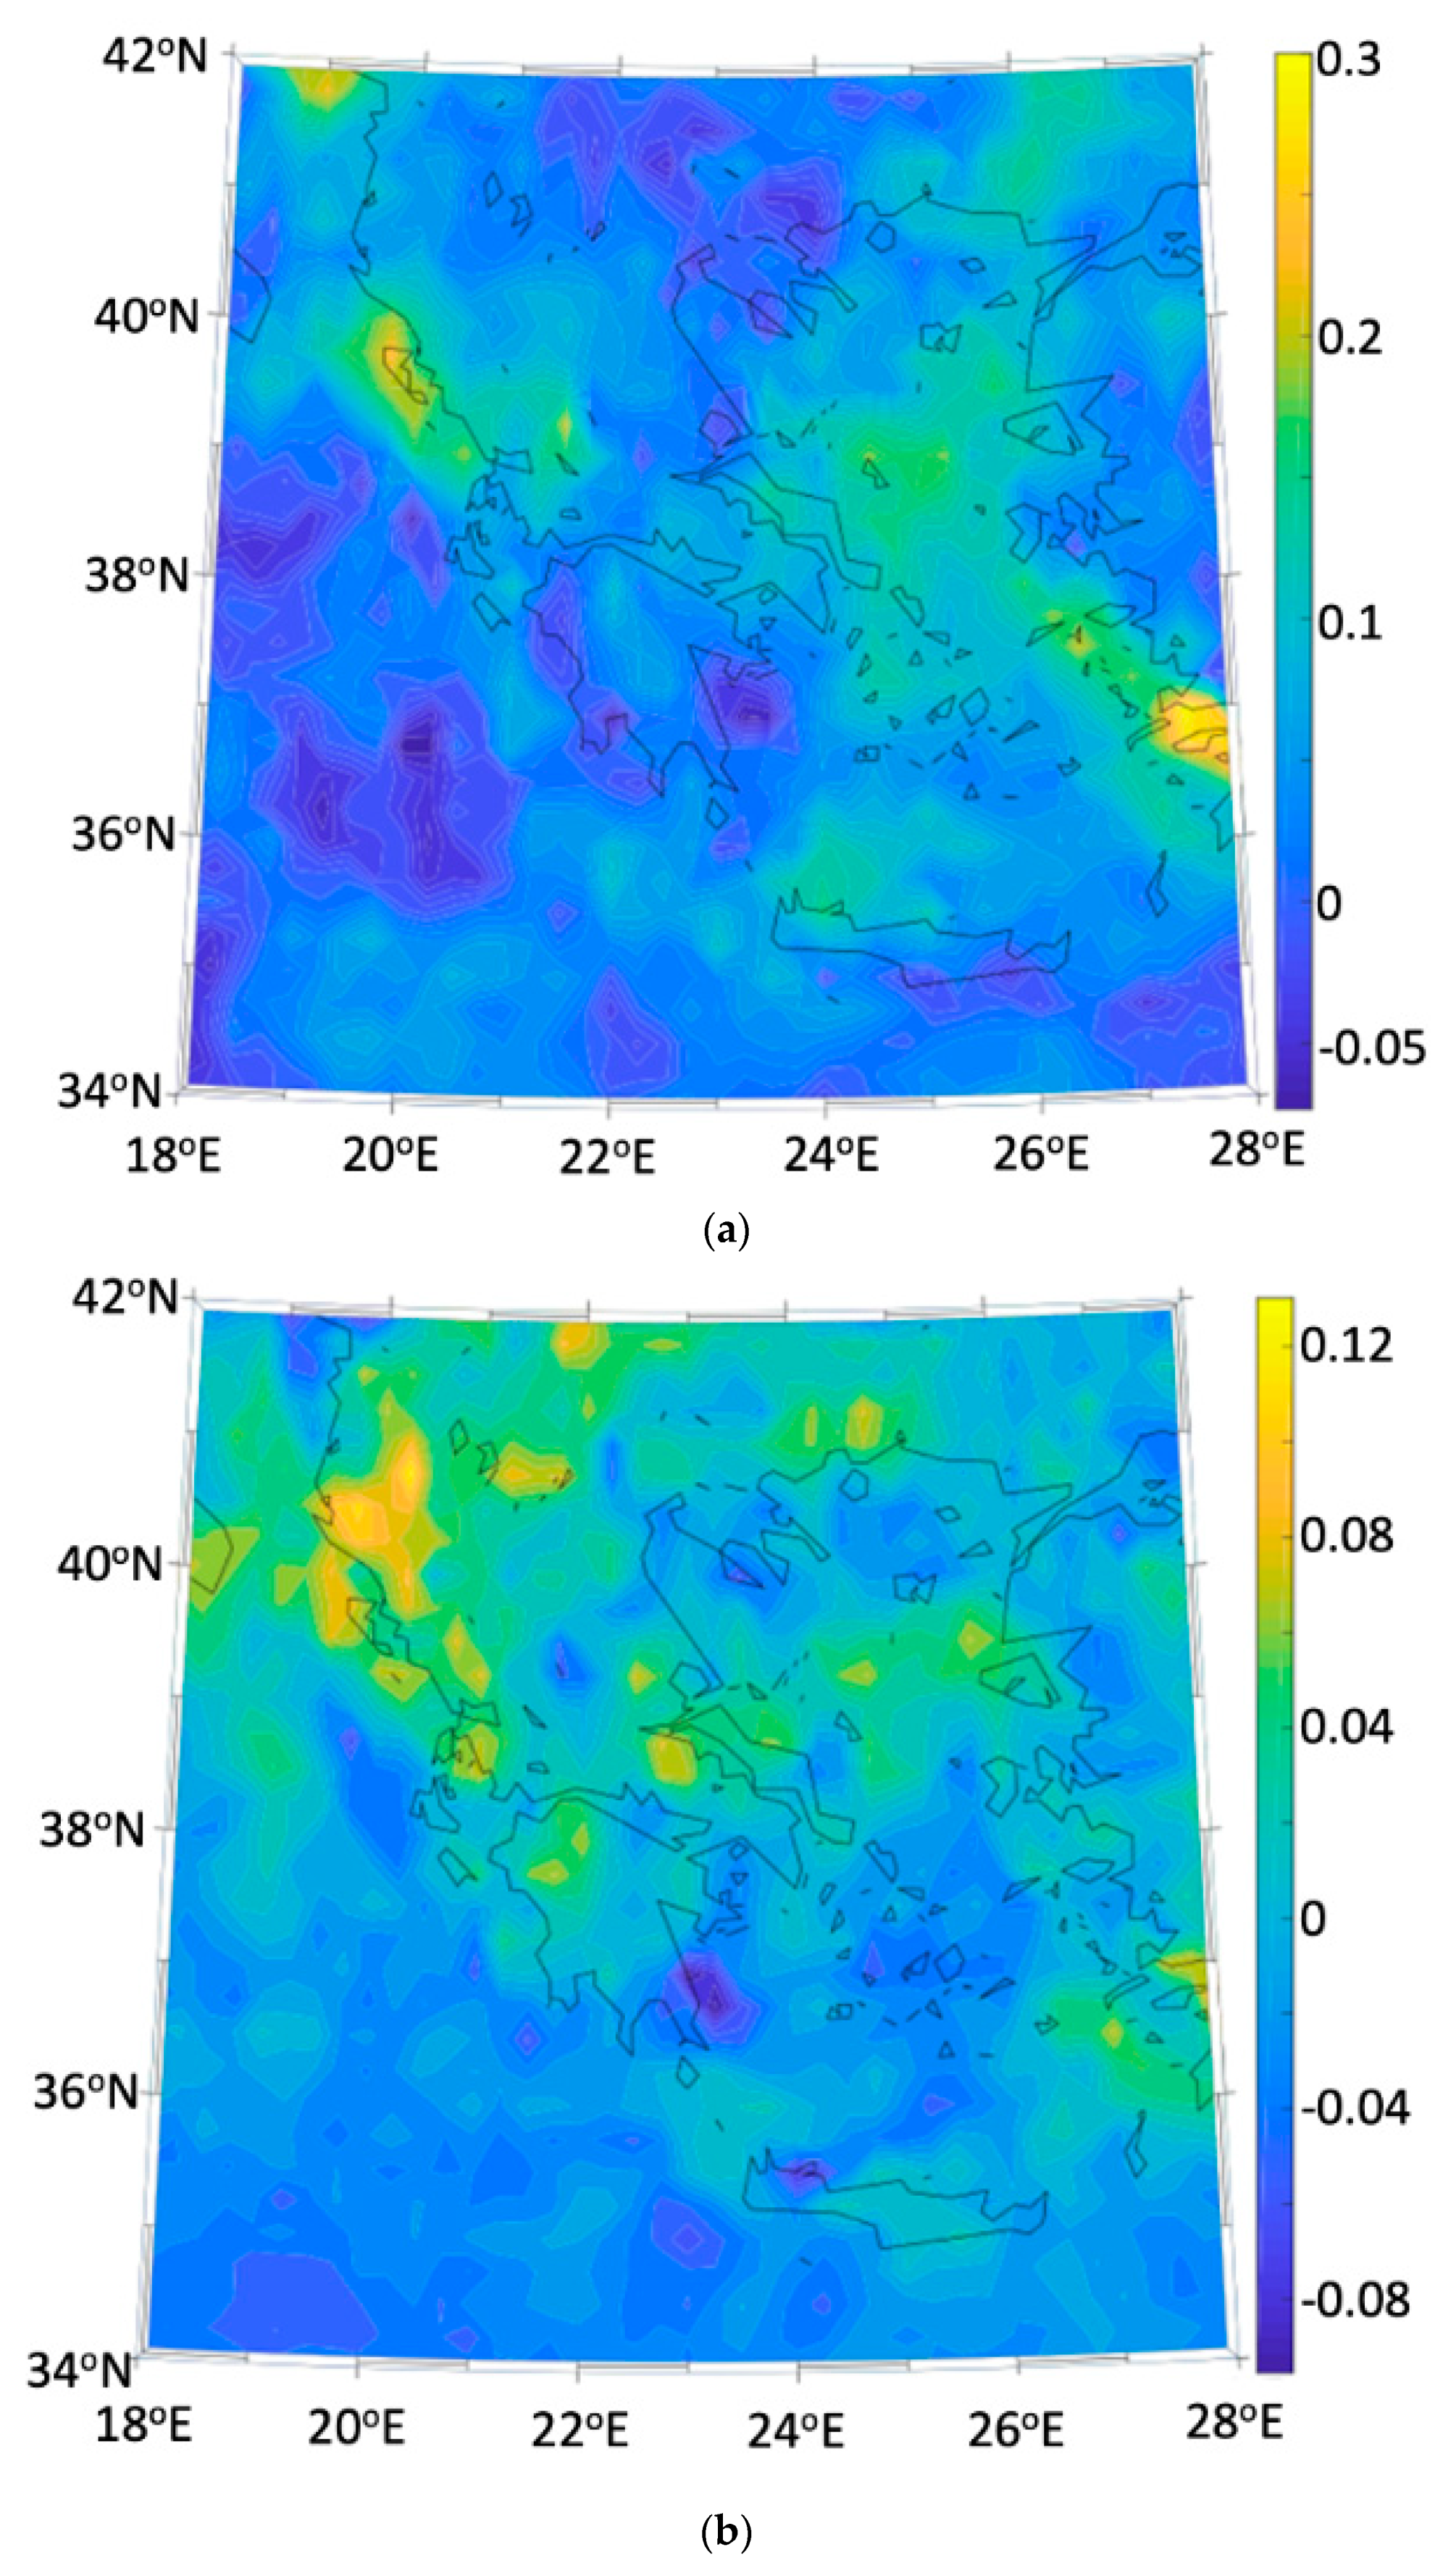
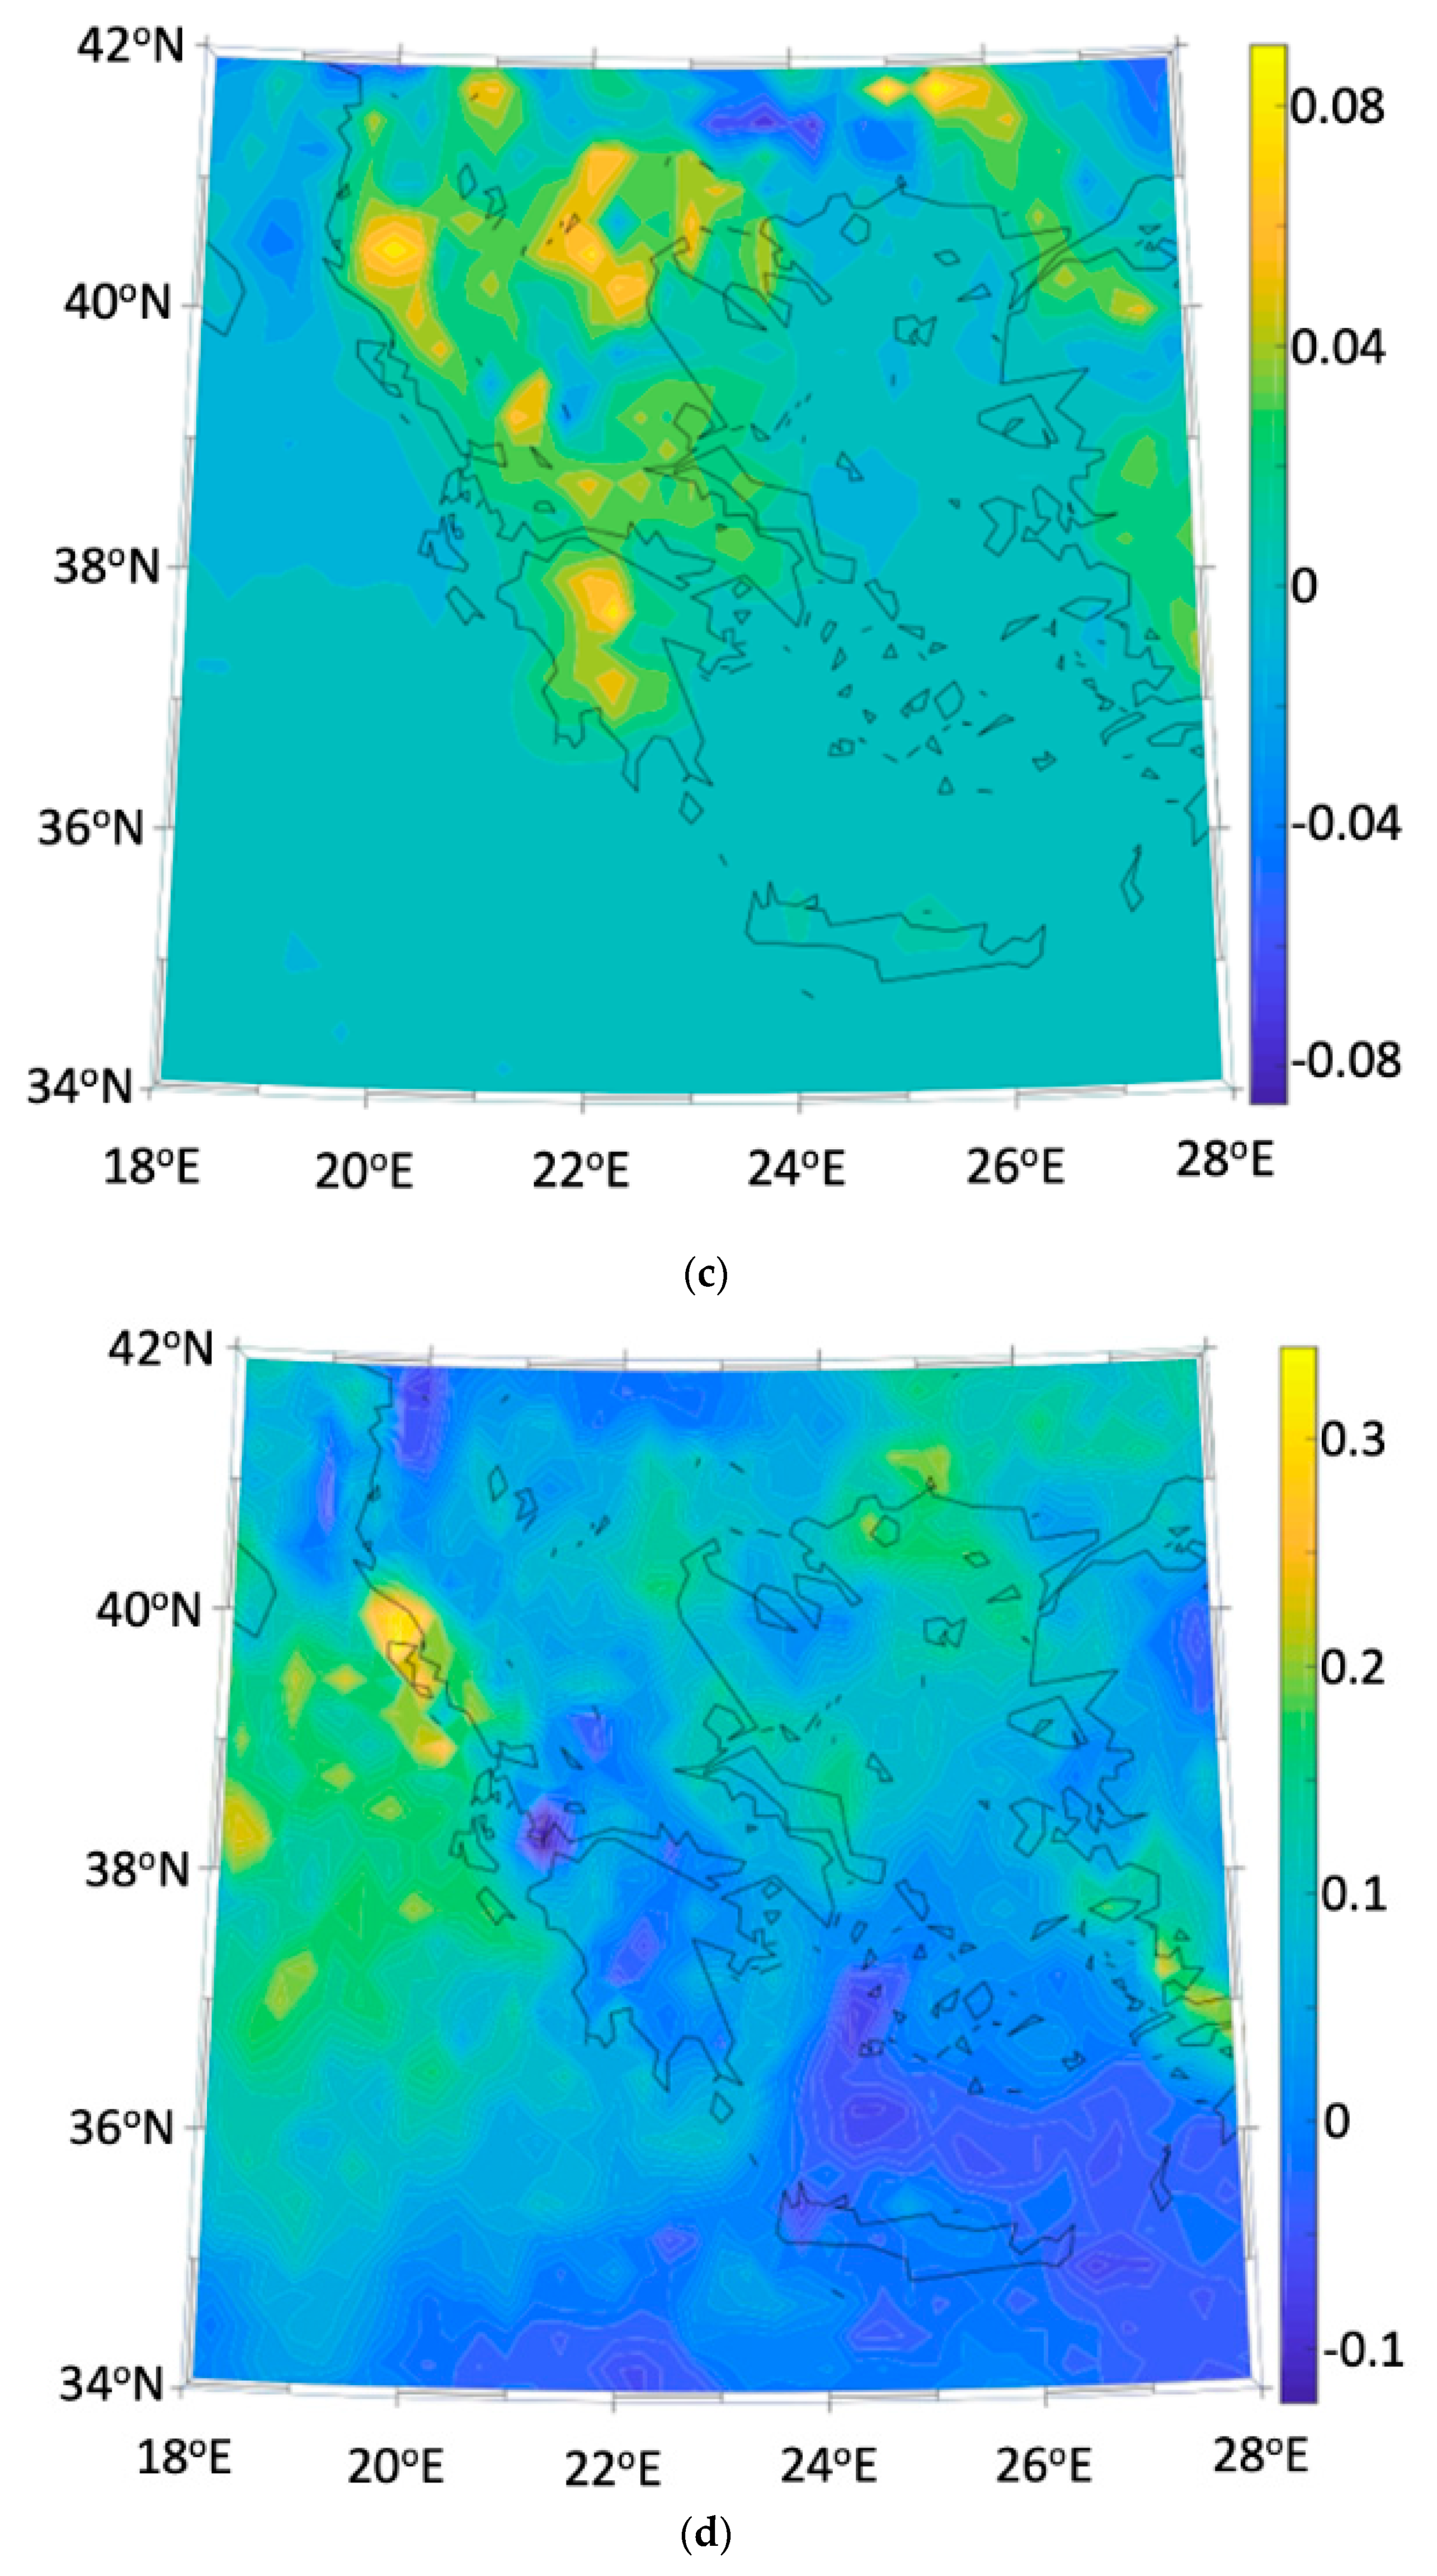
- The trend analysis for the 1981–2020 period of the 95th percentiles—as calculated on a seasonal basis from the daily precipitation records—was performed, showing that the majority of high-risk areas for floods are located in western and central Greece.
Author Contributions
Funding
Data Availability Statement
Conflicts of Interest
References
- Martini, F.; Loat, R. Handbook on Good Practices for Flood Mapping in Europe; Excimap (European Exchange Circle on Flood Mapping): 2007; p. 60. Available online: http://www.pcn.minambiente.it/mattm/wp-content/uploads/2017/03/direttiva_alluvioni/linee_guida_e_specifiche_tecniche/linee_guida_europee/handbook_goodpractice.pdf (accessed on 30 October 2023).
- Smith, K.; Ward, R. Floods: Physical Processes and Human Impacts; John Wiley & Sons Ltd.: London, UK, 1998. [Google Scholar]
- Eleuterio, J. Flood Risk Analysis: Impact of Uncertainty in Hazard Modelling and Vulnerability Assessments. Ph.D. Thesis, University of Strasbourg, Strasbourg, France, 2012. [Google Scholar]
- Jonkman, S.N.; Kelman, I. An Analysis of the Causes and Circumstances of Flood Disaster Deaths. Disasters 2005, 29, 75–97. [Google Scholar] [CrossRef] [PubMed]
- Pulvirenti, L.; Chini, M.; Pierdicca, N.; Guerriero, L.; Ferrazzoli, P. Flood Monitoring Using Multi-Temporal COSMO-Skymed Data: Image Segmentation and Signature Interpretation. Remote Sens. Environ. 2011, 115, 990–1002. [Google Scholar] [CrossRef]
- Ahmadalipour, A.; Moradkhani, H. A Data-Driven Analysis of Flash Flood Hazard, Fatalities, and Damages over the CONUS during 1996–2017. J. Hydrol. 2019, 578, 124106. [Google Scholar] [CrossRef]
- Flack, D.L.A.; Skinner, C.J.; Hawkness-Smith, L.; O’Donnell, G.; Thompson, R.J.; Waller, J.A.; Chen, A.S.; Moloney, J.; Largeron, C.; Xia, X.; et al. Recommendations for Improving Integration in National End-to-End Flood Forecasting Systems: An Overview of the FFIR (Flooding From Intense Rainfall) Programme. Water 2019, 11, 725. [Google Scholar] [CrossRef]
- Hosseinzadehtalaei, P.; Tabari, H.; Willems, P. Satellite-Based Data Driven Quantification of Pluvial Floods over Europe under Future Climatic and Socioeconomic Changes. Sci. Total Environ. 2020, 721, 137688. [Google Scholar] [CrossRef] [PubMed]
- Khajehei, S.; Ahmadalipour, A.; Shao, W.; Moradkhani, H. A Place-Based Assessment of Flash Flood Hazard and Vulnerability in the Contiguous United States. Sci. Rep. 2020, 10, 448. [Google Scholar] [CrossRef] [PubMed]
- Kundzewicz, Z.W.; Kanae, S.; Seneviratne, S.I.; Handmer, J.; Nicholls, N.; Peduzzi, P.; Mechler, R.; Bouwer, L.M.; Arnell, N.; Mach, K.; et al. Le Risque d’inondation et Les Perspectives de Changement Climatique Mondial et Régional. Hydrol. Sci. J. 2014, 59, 1–28. [Google Scholar] [CrossRef]
- Kellermann, P.; Schöbel, A.; Kundela, G.; Thieken, A.H. Estimating Flood Damage to Railway Infrastructure—The Case Study of the March River Flood in 2006 at the Austrian Northern Railway. Nat. Hazards Earth Syst. Sci. 2015, 15, 2485–2496. [Google Scholar] [CrossRef]
- Andjelkovic, I. Guidelines on Non-Structural Measurements in Urban Flood Management; International Hydrological Programme (IHP), United Nations Educational, Scientific and Cultural Organization (UNESCO): Paris, France, 2001. [Google Scholar]
- Stathis, D. Extreme Rain Events and Generation of Floods in Greece. In Proceedings of the 7th Panhellenic Geographical Conference, Mytilene, Greece, 14–17 November 2004; pp. 385–392. (In Greek). [Google Scholar]
- Diakakis, M. Flood Hazard Assessment with the Use of Modeling Techniques. Ph.D. Thesis, Faculty of Geology and Geo-Environment, National and Kapodistrian University of Athens, Athens, Greece, 2013. [Google Scholar]
- Diakakis, M.; Papagiannaki, K.; Fouskaris, M. The Occurrence of Catastrophic Multiple-Fatality Flash Floods in the Eastern Mediterranean Region. Water 2023, 15, 119. [Google Scholar] [CrossRef]
- Diakakis, M.; Deligiannakis, G.; Mavroulis, S. Flooding in Peloponnese, Greece: A Contribution to Flood Hazard Assessment. In Advances in the Research of Aquatic Environment; Lambrakis, N., Stournaras, G., Katsanou, K., Eds.; Springer: Berlin, Germany, 2011; Volume 1, pp. 199–206. [Google Scholar]
- Pereira, S.; Diakakis, M.; Deligiannakis, G.; Zêzere, J.L. Comparing Flood Mortality in Portugal and Greece (Western and Eastern Mediterranean). Int. J. Disaster Risk Reduct. 2017, 22, 147–157. [Google Scholar] [CrossRef]
- Diakakis, M.; Mavroulis, S.; Deligiannakis, G. Floods in Greece, a Statistical and Spatial Approach. Nat. Hazards 2012, 62, 485–500. [Google Scholar] [CrossRef]
- Wilson, E.M. Engineering Hydrology, 4th ed.; MacMillan Press Ltd.: London, UK, 1990. [Google Scholar]
- Ward, R.C.; Robinson, M. Principles of Hydrology, 4th ed.; McGraw-Hill: London, UK, 2000. [Google Scholar]
- Camarasa Belmonte, A.M.; Segura Beltrán, F. Flood Events in Mediterranean Ephemeral Streams (Ramblas) in Valencia Region, Spain. Catena 2001, 45, 229–249. [Google Scholar] [CrossRef]
- Kundzewicz, Z.W.; Pin’skwar, I.; Brakenridge, G.R. Changes in River Flood Hazard in Europe: A Review. Hydrol. Res. 2018, 49, 294–302. [Google Scholar] [CrossRef]
- Lana, X.; Martínez, M.D.; Serra, C.; Burgueno, A. Spatial and Temporal Variability of the Daily Rainfall Regime in Catalonia (Northeastern Spain), 1950–2000. Int. J. Climatol. 2004, 24, 613–641. [Google Scholar] [CrossRef]
- Du, H.; Alexander, L.V.; Donat, M.G.; Lippmann, T.; Srivastava, A.; Salinger, J.; Kruger, A.; Choi, G.; He, H.S.; Fujibe, F.; et al. Precipitation From Persistent Extremes Is Increasing in Most Regions and Globally. Geophys. Res. Lett. 2019, 46, 6041–6049. [Google Scholar] [CrossRef]
- Dunn, R.J.H.; Alexander, L.V.; Donat, M.G.; Zhang, X.; Bador, M.; Herold, N.; Lippmann, T.; Allan, R.; Aguilar, E.; Barry, A.A.; et al. Development of an Updated Global Land In Situ-Based Data Set of Temperature and Precipitation Extremes: HadEX3. J. Geophys. Res. Atmos. 2020, 125, e2019JD032263. [Google Scholar] [CrossRef]
- Seneviratne, S.I.; Zhang, M.X.; Adnan, W.; Badi, C.; Dereczynski, A.; Di Luca, S.; Ghosh, I.; Iskandar, J.; Kossin, S.; Lewis, F.; et al. 2021: Weather and Climate Extreme Events in a Changing Climate. In Climate Change 2021: The Physical Science Basis. Contribution of Working Group I to the Sixth Assessment Report of the Intergovernmental Panel on Climate Change; Masson-Delmotte, V., Zhai, A.P., Pirani, S.L., Connors, C., Péan, S., Berger, N., Caud, Y., Chen, L., Goldfarb, M.I., Gomis, M., Eds.; Cambridge University Press: Cambridge, UK; New York, NY, USA, 2021; pp. 1513–1766. [Google Scholar] [CrossRef]
- Madsen, H.; Lawrence, D.; Lang, M.; Martinkova, M.; Kjeldsen, T.R. Review of Trend Analysis and Climate Change Projections of Extreme Precipitation and Floods in Europe. J. Hydrol. 2014, 519, 3634–3650. [Google Scholar] [CrossRef]
- Gilabert, J.; Llasat, M.C. Circulation Weather Types Associated with Extreme Flood Events in Northwestern Mediterranean. Int. J. Climatol. 2018, 38, 1864–1876. [Google Scholar] [CrossRef]
- Prudhomme, C.; Genevier, M. Can Atmospheric Circulation Be Linked to Flooding in Europe? Hydrol. Process. 2011, 25, 1180–1190. [Google Scholar] [CrossRef]
- Ionita, M.; Nagavciuc, V. Extreme Floods in the Eastern Part of Europe: Large-Scale Drivers and Associated Impacts. Water 2021, 13, 1122. [Google Scholar] [CrossRef]
- Eiras-Barca, J.; Lorenzo, N.; Taboada, J.; Robles, A.; Miguez-Macho, G. On the Relationship between Atmospheric Rivers, Weather Types and Floods in Galicia (NW Spain). Nat. Hazards Earth Syst. Sci. 2018, 18, 1633–1645. [Google Scholar] [CrossRef]
- Schlef, K.E.; Moradkhani, H.; Lall, U. Atmospheric Circulation Patterns Associated with Extreme United States Floods Identified via Machine Learning. Sci. Rep. 2019, 9, 7171. [Google Scholar] [CrossRef] [PubMed]
- Brönnimann, S.; Stucki, P.; Franke, J.; Valler, V.; Brugnara, Y.; Hand, R.; Slivinski, L.C.; Compo, G.P.; Sardeshmukh, P.D.; Lang, M.; et al. Influence of Warming and Atmospheric Circulation Changes on Multidecadal European Flood Variability. Clim. Past 2022, 18, 919–933. [Google Scholar] [CrossRef]
- Richardson, D.; Neal, R.; Dankers, R.; Mylne, K.; Cowling, R.; Clements, H.; Millard, J. Linking Weather Patterns to Regional Extreme Precipitation for Highlighting Potential Flood Events in Medium- to Long-Range Forecasts. Meteorol. Appl. 2020, 27, e1931. [Google Scholar] [CrossRef]
- Van Alphen, J.; Martini, F.; Loat, R.; Slomp, R.; Passchier, R. Flood Risk Mapping in Europe, Experiences and Best Practices. J. Flood Risk Manag. 2009, 2, 285–292. [Google Scholar] [CrossRef]
- Mendez, M.; Calvo-Valverde, L. Development of the HBV-TEC Hydrological Model. Procedia Eng. 2016, 154, 1116–1123. [Google Scholar] [CrossRef]
- Fernández-Lavado, C.; Furdada, G.; Marqués, M.A. Geomorphological Method in the Elaboration of Hazard Maps for Flash-Floods in the Municipality of Jucuarán (El Salvador). Nat. Hazards Earth Syst. Sci. 2007, 7, 455–465. [Google Scholar] [CrossRef]
- Baker, V.R. Paleoflood Hydrology: Origin, Progress, Prospects. Geomorphology 2008, 101, 1–13. [Google Scholar] [CrossRef]
- Golian, S.; Saghafian, B.; Elmi, M.; Maknoon, R. Probabilistic Rainfall Thresholds for Flood Forecasting: Evaluating Different Methodologies for Modelling Rainfall Spatial Correlation (or Dependence). Hydrol. Process. 2011, 25, 2046–2055. [Google Scholar] [CrossRef]
- Qiang, Y. Flood Exposure of Critical Infrastructures in the United States. Int. J. Disaster Risk Reduct. 2019, 39, 101240. [Google Scholar] [CrossRef]
- Qiang, Y. Disparities of Population Exposed to Flood Hazards in the United States. J. Environ. Manag. 2019, 232, 295–304. [Google Scholar] [CrossRef] [PubMed]
- Malamud, B.D.; Turcotte, D.L. The Applicability of Power-Law Frequency Statistics to Floods. J. Hydrol. 2006, 322, 168–180. [Google Scholar] [CrossRef]
- El Adlouni, S.; Bobée, B.; Ouarda, T.B.M.J. On the Tails of Extreme Event Distributions in Hydrology. J. Hydrol. 2008, 355, 16–33. [Google Scholar] [CrossRef]
- Correia, F.N.; Rego, F.C.; Saraiva, M.D.G.; Ramos, I. Coupling GIS with Hydrologic and Hydraulic Flood Modelling. Water Resour. Manag. 1998, 12, 229–249. [Google Scholar] [CrossRef]
- El Alaoui El Fels, A.; Alaa, N.; Bachnou, A.; Rachidi, S. Flood Frequency Analysis and Generation of Flood Hazard Indicator Maps in a Semi-Arid Environment, Case of Ourika Watershed (Western High Atlas, Morocco). J. Afr. Earth Sci. 2018, 141, 94–106. [Google Scholar] [CrossRef]
- Tanaka, T.; Tachikawa, Y.; Iachikawa, Y.; Yorozu, K. Impact Assessment of Upstream Flooding on Extreme Flood Frequency Analysis by Incorporating a Flood-Inundation Model for Flood Risk Assessment. J. Hydrol. 2017, 554, 370–382. [Google Scholar] [CrossRef]
- Quesada-Román, A.; Ballesteros-Cánovas, J.A.; Granados-Bolaños, S.; Birkel, C.; Stoffel, M. Improving Regional Flood Risk Assessment Using Flood Frequency and Dendrogeomorphic Analyses in Mountain Catchments Impacted by Tropical Cyclones. Geomorphology 2022, 396, 108000. [Google Scholar] [CrossRef]
- Ballesteros-Cánovas, J.A.; Sanchez-Silva, M.; Bodoque, J.M.; Díez-Herrero, A. An Integrated Approach to Flood Risk Management: A Case Study of Navaluenga (Central Spain). Water Resour. Manag. 2013, 27, 3051–3069. [Google Scholar] [CrossRef]
- Garrote, J.; Gutiérrez-Pérez, I.; Díez-Herrero, A. Can the Quality of the Potential Flood Risk Maps Be Evaluated? A Case Study of the Social Risks of Floods in Central Spain. Water 2019, 11, 1284. [Google Scholar] [CrossRef]
- St. George, S.; Hefner, A.M.; Avila, J. Paleofloods Stage a Come-Back. Nat. Geosci. 2020, 13, 766–768. [Google Scholar]
- Apel, H.; Thieken, A.H.; Merz, B.; Blöschl, G. A Probabilistic Modelling System for Assessing Flood Risks. Nat. Hazards 2006, 38, 79–100. [Google Scholar] [CrossRef]
- Gain, A.K.; Hoque, M.M. Flood Risk Assessment and Its Application in the Eastern Part of Dhaka City, Bangladesh. J. Flood Risk Manag. 2013, 6, 219–228. [Google Scholar] [CrossRef]
- Ernst, J.; Dewals, B.J.; Detrembleur, S.; Archambeau, P.; Erpicum, S.; Pirotton, M. Micro-Scale Flood Risk Analysis Based on Detailed 2D Hydraulic Modelling and High Resolution Geographic Data. Nat. Hazards 2010, 55, 181–209. [Google Scholar] [CrossRef]
- Benito, G.; Barriendos, M.; Llasat, C.; Machado, M.; Thorndycraft, V.R. Impacts on Natural Hazards of Climatic Origin. A.—Flood Risks. In Preliminary Assessment of Impacts in Spain by Climate Change; Moreno, J.M., Ed.; Ministerio de Medioambiente: Madrid, Spain, 2005; pp. 507–527. [Google Scholar]
- Gaume, E.; Bain, V.; Bernardara, P.; Newinger, O.; Barbuc, M.; Bateman, A.; Blaškovičová, L.; Blöschl, G.; Borga, M.; Dumitrescu, A.; et al. A Compilation of Data on European Flash Floods. J. Hydrol. 2009, 367, 70–78. [Google Scholar] [CrossRef]
- Hall, J.; Arheimer, B.; Aronica, G.T.; Bilibashi, A.; Boháč, M.; Bonacci, O.; Borga, M.; Burlando, P.; Castellarin, A.; Chirico, G.B.; et al. A European Flood Database: Facilitating Comprehensive Flood Research beyond Administrative Boundaries. IAHS-AISH Proc. Rep. 2015, 370, 89–95. [Google Scholar] [CrossRef]
- Gourley, J.J.; Hong, Y.; Flamig, Z.L.; Arthur, A.; Clark, R.; Calianno, M.; Ruin, I.; Ortel, T.; Wieczorek, M.E.; Kirstetter, P.E.; et al. A Unified Flash Flood Database across the United States. Bull. Am. Meteorol. Soc. 2013, 94, 799–805. [Google Scholar] [CrossRef]
- Hilker, N.; Badoux, A.; Hegg, C. The Swiss Flood and Landslide Damage Database 1972–2007. Nat. Hazards Earth Syst. Sci. 2009, 9, 913–925. [Google Scholar] [CrossRef]
- Hall, J.; Arheimer, B.; Borga, M.; Brázdil, R.; Claps, P.; Kiss, A.; Kjeldsen, T.R.; Kriaučiūnienė, J.; Kundzewicz, Z.W.; Lang, M.; et al. Understanding Flood Regime Changes in Europe: A State-of-the-Art Assessment. Hydrol. Earth Syst. Sci. 2014, 18, 2735–2772. [Google Scholar] [CrossRef]
- Zêzere, J.L.; Pereira, S.; Tavares, A.O.; Bateira, C.; Trigo, R.M.; Quaresma, I.; Santos, P.P.; Santos, M.; Verde, J. DISASTER: A GIS Database on Hydro-Geomorphologic Disasters in Portugal. Nat. Hazards 2014, 72, 503–532. [Google Scholar] [CrossRef]
- Santos, M.; Santos, J.A.; Fragoso, M. Historical Damaging Flood Records for 1871-2011 in Northern Portugal and Underlying Atmospheric Forcings. J. Hydrol. 2015, 530, 591–603. [Google Scholar] [CrossRef]
- Corella, J.P.; Benito, G.; Monteoliva, A.P.; Sigro, J.; Calle, M.; Valero-Garcés, B.L.; Stefanova, V.; Rico, E.; Favre, A.C.; Wilhelm, B. A 1400-Years Flood Frequency Reconstruction for the Basque Country (N Spain): Integrating Geological, Historical and Instrumental Datasets. Quat. Sci. Rev. 2021, 262, 106963. [Google Scholar] [CrossRef]
- Barriendos, M.; Coeur, D.; Lang, M.; Llasat, M.C.; Naulet, R.; Lemaitre, F.; Barrera, A. Stationarity Analysis of Historical Flood Series in France and Spain (14th–20th Centuries). Nat. Hazards Earth Syst. Sci. 2003, 3, 583–592. [Google Scholar] [CrossRef]
- Moores, E.M.; Fairbridge, R.W. Encyclopedia of European & Asian Regional Geology; Springer: Berlin/Heidelberg, Germany, 1997. [Google Scholar]
- Papanikolaou, D. Geology of Greece; Pataki: Athens, Greece, 1979; Volume 21. [Google Scholar]
- McKenzie, D. Active Tectonics of the Mediterranean Region. Geophys. J. R. Astron. Soc. 1972, 30, 109–185. [Google Scholar] [CrossRef]
- Dewey, J.F.; Hempton, M.R.; Kidd, W.S.F.; Saroglu, F.; Şengör, A.M.C. Shortening of Continental Lithosphere: The Neotectonics of Eastern Anatolia—A Young Collision Zone. In Collision Tectonics; Coward, M.P., Ries, A.C., Eds.; Geological Society of London Special Publications: London, UK, 1986; p. 336. [Google Scholar]
- Jackson, J. Active Tectonics of the Aegean Region. Annu. Rev. Earth Planet. Sci. 1994, 22, 239–271. [Google Scholar] [CrossRef]
- Shaw, B.; Jackson, J. Earthquake Mechanisms and Active Tectonics of the Hellenic Subduction Zone. Geophys. J. Int. 2010, 181, 966–984. [Google Scholar] [CrossRef]
- Mckenzie, D. Plate Tectonics of the Mediterranean Region. Nature 1970, 226, 239–243. [Google Scholar] [CrossRef] [PubMed]
- Alcántara-Ayala, I. Geomorphology, Natural Hazards, Vulnerability and Prevention of Natural Disasters in Developing Countries. Geomorphology 2002, 47, 107–124. [Google Scholar] [CrossRef]
- Santangelo, N. Geomorphological Contribution to Flash Floods Hazard Evaluation: Examples from Campania (Southern Italy). J. Environ. Sci. Allied Res. 2019, 2, 44–50. [Google Scholar] [CrossRef]
- Borga, M.; Boscolo, P.; Zanon, F.; Sangati, M. Hydrometeorological Analysis of the 29 August 2003 Flash Flood in the Eastern Italian Alps. J. Hydrometeorol. 2007, 8, 1049–1067. [Google Scholar] [CrossRef]
- Geiger, R. Überarbeitete Neuausgabe von Geiger, R. Köppen-Geiger/Klima Der Erde (Wandkarte 1: 16 Mill.); Perthes: Gotha, Germany, 1961; Volume 1. [Google Scholar]
- Köppen, W. Die Wärmezonen der Erde, Nach der Dauer der Heissen, Gemässigten und Kalten Zeit und Nach der Wirkung der Wärme Auf Die Organische Welt Betrachtet. Meteorol. Z. 1884, 1, 215–226. [Google Scholar]
- Hellenic Meteorological Service Climatic Data per Month. Available online: http://www.emy.gr/emy/en/climatology/climatology_month (accessed on 30 October 2023).
- Pavlopoulos, K. Geomorphology: Applications in Geosciences; Ion: Athens, Greece, 2011. [Google Scholar]
- Special Water Secretariat. Historical Floods—National Level; 2019. Available online: https://floods.ypeka.gr/index.php?option=com_content&view=article&id=1035&Itemid=918 (accessed on 30 October 2023).
- National Observatory of Athens. Weather Events with Socio-Economic Impacts in Greece Since 2000; 2023. Available online: https://meteo.gr/weather_cases.cfm (accessed on 30 October 2023).
- Diakakis, M. Flood History Analysis and Its Contribution To Flood Hazard Assessment. The Case of Marathonas, Greece. Bull. Geol. Soc. Greece 2010, 43, 1323–1334. [Google Scholar] [CrossRef]
- Llasat, M.C.; Llasat-Botija, M.; Prat, M.A.; Porcú, F.; Price, C.; Mugnai, A.; Lagouvardos, K.; Kotroni, V.; Katsanos, D.; Michaelides, S.; et al. High-Impact Floods and Flash Floods in Mediterranean Countries: The FLASH Preliminary Database. Adv. Geosci. 2010, 23, 47–55. [Google Scholar] [CrossRef]
- Koutsoyiannis, D.; Mamassis, N.; Efstratiadis, A.; Zarkadoulas, N.; Markonis, I. Floods in Greece. In Changes of Flood Risk in Europe; Kundzewicz, Z.W., Ed.; IAHS Press: Wallingford, UK, 2012; pp. 238–256. [Google Scholar]
- Hersbach, H.; Bell, B.; Berrisford, P.; Hirahara, S.; Horányi, A.; Muñoz-Sabater, J.; Nicolas, J.; Peubey, C.; Radu, R.; Schepers, D.; et al. The ERA5 Global Reanalysis. Q. J. R. Meteorol. Soc. 2020, 146, 1999–2049. [Google Scholar] [CrossRef]
- Khan, A.; Papazoglou, E.G.; Cartalis, C.; Philippopoulos, K.; Vasilakopoulou, K.; Santamouris, M. On the Mitigation Potential and Urban Climate Impact of Increased Green Infrastructures in a Coastal Mediterranean City. Build. Environ. 2022, 221, 109264. [Google Scholar] [CrossRef]
- Tsilogianni, D.; Cartalis, C.; Philippopoulos, K. Climate Change Impact Assessment on Ski Tourism in Greece: Case Study of the Parnassos Ski Resort. Climate 2023, 11, 140. [Google Scholar] [CrossRef]
- Henry, M. Nonparametric Tests Against Trend. Econometrica 1945, 13, 245–259. [Google Scholar]
- Kendall, M.G. Rank Correlation Methods; Griffin: London, UK, 1948. [Google Scholar]
- Sen, P.K. Estimates of the Regression Coefficient Based on Kendall’s Tau. J. Am. Stat. Assoc. 1968, 63, 1379–1389. [Google Scholar] [CrossRef]
- Browell, J.; Drew, D.R.; Philippopoulos, K. Improved Very Short-Term Spatio-Temporal Wind Forecasting Using Atmospheric Regimes. Wind Energy 2018, 21, 968–979. [Google Scholar] [CrossRef]
- Philippopoulos, K.; Deligiorgi, D.; Mavrakou, T.; Cheliotis, J. Winter Atmospheric Circulation Patterns and Their Relationship with the Meteorological Conditions in Greece. Meteorol. Atmos. Phys. 2014, 124, 195–204. [Google Scholar] [CrossRef]
- Davies, D.L.; Bouldin, D.W. A Cluster Separation Measure. IEEE Trans. Pattern Anal. Mach. Intell. 1979, PAMI-1, 224–227. [Google Scholar] [CrossRef]
- Bathrellos, G. Geological, Geomorphological and Geographical Study of the Urban Areas of Trikala Prefecture—Western Thessaly. Ph.D. Thesis, National and Kapodistrian University of Athens, Athens, Greece, 2005. [Google Scholar]
- Mousadis, I. Development and Application of an Integrated Methodology in GIS Environment for the Determination of Flood-Prone Areas “The Case of Attica”. Master’s Thesis, National Technical University of Athens, Athens, Greece, 2018. (In Greek). [Google Scholar]
- Diakakis, M.; Andreadakis, E.; Nikolopoulos, E.I.; Spyrou, N.I.; Gogou, M.E.; Deligiannakis, G.; Katsetsiadou, N.K.; Antoniadis, Z.; Melaki, M.; Georgakopoulos, A.; et al. An Integrated Approach of Ground and Aerial Observations in Flash Flood Disaster Investigations. The Case of the 2017 Mandra Flash Flood in Greece. Int. J. Disaster Risk Reduct. 2019, 33, 290–309. [Google Scholar] [CrossRef]
- Soulios, G.; Stournaras, G.; Nikas, K.; Mattas, C. The Floods in Greece: The Case of Mandra in Attica. Bull. Geol. Soc. Greece 2018, 52, 131. [Google Scholar] [CrossRef]
- Lekkas, E.; Spyrou, N.-I.; Kotsi, E.; Filis, C.; Diakakis, M.; Lagouvardos, K.; Cartalis, C.; Kotroni, V.; Dafis, S.; Vassilakis, E.; et al. The August 9, 2020 Evia (Central Greece) Flood. Newsl. Environ. Disaster Cris. Manag. Strateg. 2020, 19, 1–68. [Google Scholar]
- Andreadakis, E.; Fountoulis, I. Flood Hazard Assessment in Tectonically Active Areas. In Proceedings of the Symposium of the Committee for Structural Geology of the Hellenic Geological Society in Honor of the Emeritus Ilias Mariolakos, Athens, Greece, 7 December 2007; pp. 1–17. [Google Scholar]
- Papanikolaou, D.; Diakakis, M. Changes in the Intensity and Distribution of Natural Disasters; Climate Change Impacts Study Committee, Bank of Greece: Athens, Greece, 2011. [Google Scholar]
- Fischer, E.M.; Knutti, R. Anthropogenic Contribution to Global Occurrence of Heavy-Precipitation and High-Temperature Extremes. Nat. Clim. Chang. 2015, 5, 560–564. [Google Scholar] [CrossRef]
- Donat, M.G.; Lowry, A.L.; Alexander, L.V.; O’Gorman, P.A.; Maher, N. More Extreme Precipitation in the World’s Dry and Wet Regions. Nat. Clim. Chang. 2016, 6, 508–513. [Google Scholar] [CrossRef]
- Prein, A.F.; Rasmussen, R.M.; Ikeda, K.; Liu, C.; Clark, M.P.; Holland, G.J. The Future Intensification of Hourly Precipitation Extremes. Nat. Clim. Chang. 2017, 7, 48–52. [Google Scholar] [CrossRef]
- Tasoulas, G. Natural and Anthropogenic Disasters: The Case of Floods. Bachelor’s Thesis, University of Thessaly, Volos, Greece, 2020. [Google Scholar]
- Skias, S.; Kallioras, A. Cross Border Co-Operation and the Problem of Flooding in the Evros Delta; Many Rivers to Cross Cross Bord. Co-Operation River Manag: Eburon, Delft, 2007; Volume 119. [Google Scholar]
- Spyrou, C.; Loupis, M.; Charizopoulos, N.; Apostolidou, I.; Mentzafou, A.; Varlas, G.; Papadopoulos, A.; Dimitriou, E.; Panga, D.; Gkeka, L.; et al. Evaluating Nature-Based Solution for Flood Reduction in Spercheios River Basin under Current and Future Climate Conditions. Sustainability 2021, 13, 3885. [Google Scholar] [CrossRef]
- Stathopoulos, N.; Rozos, D.; Vasileiou, E. Water Resources Management in Sperchios River Basin, Using SWOT Analysis. Bull. Geol. Soc. Greece 2017, 47, 779. [Google Scholar] [CrossRef]
- Domakinis, C.; Mouratidis, A.; Voudouris, K.; Astaras, T.; Karypidou, M.C. Flood Susceptibility Mapping in Erythropotamos River Basin with the Aid of Remote Sensing and GIS. Acta Univ. Carol. Geogr. 2020, 55, 149–164. [Google Scholar] [CrossRef]
- Refice, A.; D’Addabbo, A.; Lovergine, F.P.; Tijani, K.; Morea, A.; Nutricato, R.; Bovenga, F.; Nitti, D.O. Monitoring Flood Extent and Area through Multisensor, Multi-Temporal Remote Sensing: The Strymonas (Greece) River Flood. In Flood Monitoring through Remote Sensing; Refice, A., D’Addabbo, A., Capolongo, D., Eds.; Springer: Cham, Switzerland, 2018; pp. 101–113. [Google Scholar]
- Beurton, S.; Thieken, A.H. Seasonality of Floods in Germany. Hydrol. Sci. J. 2009, 54, 62–76. [Google Scholar] [CrossRef]
- Villarini, G. On the Seasonality of Flooding across the Continental United States. Adv. Water Resour. 2016, 87, 80–91. [Google Scholar] [CrossRef]
- Ganoulis, J. The 1994 Flood of the Giofyros on the Crete Island: A Case Study of Risk-Based Floodplain Management. In Proceedings of the US-Italy Research Workshop on the Hydrometeorology, Impacts, and Management of Extreme Floods, Perugia, Italy, 13–17 November 1995; Available online: https://www.engr.colostate.edu/ce/facultystaff/salas/us-italy/abstract/16.htm (accessed on 16 September 2023).
- Markonis, Y.; Angelakis, A.; Christy, J.; Koutsoyiannis, D. Climatic Variability and the Evolution of Water Technologies in Crete, Hellas. Water Hist. 2016, 8, 137–157. [Google Scholar] [CrossRef]
- Smith, M.W.; Carrivick, J.L.; Hooke, J.; Kirkby, M.J. Reconstructing Flash Flood Magnitudes Using “Structure-from-Motion”: A Rapid Assessment Tool. J. Hydrol. 2014, 519, 1914–1927. [Google Scholar] [CrossRef]
- Angelakis, A.N.; Antoniou, G.; Voudouris, K.; Kazakis, N.; Dalezios, N.; Dercas, N. History of Floods in Greece: Causes and Measures for Protection. Nat. Hazards 2020, 101, 833–852. [Google Scholar] [CrossRef]
- Steele, M.K.; Heffernan, J.B.; Bettez, N.; Cavender-Bares, J.; Groffman, P.M.; Grove, J.M.; Hall, S.; Hobbie, S.E.; Larson, K.; Morse, J.L.; et al. Convergent Surface Water Distributions in U.S. Cities. Ecosystems 2014, 17, 685–697. [Google Scholar] [CrossRef]
- Kaupert, J.A. Übersichtskarte vo Attika; Dietrich Reimer (Ernst Vohsen): Berlin, Germany, 1892. [Google Scholar]
- Copernicus Land Monitoring Service. CLC 2018. Available online: https://land.copernicus.eu/pan-european/corine-land-cover/clc2018 (accessed on 20 May 2023).
- Soldatos, V. Urbanization in Post-Revolutionary Athens: The Residence in the Transformation of the Place. Available online: https://dspace.lib.ntua.gr/xmlui/handle/123456789/50876 (accessed on 30 October 2023).
- Megaloudi, F. Plants and Diet in Greece from Neolithic to Classic Periods: The Archaeobotanical Remains; BAR Publishing: Oxford, UK, 2006; Volume 1516. [Google Scholar]
- Garnsey, P.; Gallant, T.; Rathbone, D. Thessaly and the Grain Supply of Rome during the Second Century B.C. J. Rom. Stud. 1984, 74, 30–44. [Google Scholar] [CrossRef]
- Forbes, H. The Identification of Pastoralist Sites Within the Context of Estatebased Agriculture in Ancient Greece: Beyond the ‘Transhumance versus Agropastoralism’ Debate. Annu. Br. Sch. Athens 1995, 90, 325–338. [Google Scholar] [CrossRef]
- Alexakis, D.; Sarris, A.; Astaras, T.; Albanakis, K. Contribution of Satellite Imagery and DEMs to the Detection of Neolithic Settlements in Thessaly, Greece. In Proceedings of the 1st International EARSeL Workshop on Advances on Remote Sensing for Archaeology and Cultural Heritage Management, Rome, Italy, 30 September–4 October 2008; Lasaponara, R., Masini, N., Eds.; CNR, Aracne editrice S.r.l.: Rome, Italy, 2008; pp. 325–328. [Google Scholar]
- Danalatos, N.G. Quantified Analysis of Selected Land Use Systems in the Larissa Region, Greece; CIP-DATA Koninklijke Bibliotheek: Hague, The Netherlands, 1993; ISBN 9054850639. [Google Scholar]
- Hellenic Society for Local Development and Self-Government Population Census Tables (1879–2011). Available online: https://www.eetaa.gr/metavoles-stin-t-a/fek-apografon-plithysmou-1879-2011/ (accessed on 30 October 2023).
- Bard, A.; Renard, B.; Lang, M. Floods in the Alpine Areas of Europe. In Changes in Flood Risk in Europe; Kundzewicz, Z.W., Ed.; CRC Press: London, UK, 2019; pp. 362–371. [Google Scholar]
- Calianno, M.; Ruin, I.; Gourley, J.J. Supplementing Flash Flood Reports with Impact Classifications. J. Hydrol. 2013, 477, 1–16. [Google Scholar] [CrossRef]
- Llasat, M.C.; Marcos, R.; Turco, M.; Gilabert, J.; Llasat-Botija, M. Trends in Flash Flood Events versus Convective Precipitation in the Mediterranean Region: The Case of Catalonia. J. Hydrol. 2016, 541, 24–37. [Google Scholar] [CrossRef]
- Morss, R.E.; Mulder, K.J.; Lazo, J.K.; Demuth, J.L. How Do People Perceive, Understand, and Anticipate Responding to Flash Flood Risks and Warnings? Results from a Public Survey in Boulder, Colorado, USA. J. Hydrol. 2016, 541, 649–664. [Google Scholar] [CrossRef]
- Di Baldassarre, G.; Uhlenbrook, S. Is the Current Flood of Data Enough? A Treatise on Research Needs for the Improvement of Flood Modelling. Hydrol. Process. 2012, 26, 153–158. [Google Scholar] [CrossRef]
- Gaume, E.; Borga, M. Post-Flood Field Investigations in Upland Catchments after Major Flash Floods: Proposal of a Methodology and Illustrations. J. Flood Risk Manag. 2008, 1, 175–189. [Google Scholar] [CrossRef]
- Anagnostou, E.N.; Grecu, M.; Anagnostou, M.N. X-Band Polarimetric Radar Rainfall Measurements in Keys Area Microphysics Project. J. Atmos. Sci. 2006, 63, 187–203. [Google Scholar] [CrossRef]
- Ruiz-Villanueva, V.; Díez-Herrero, A.; Stoffel, M.; Bollschweiler, M.; Bodoque, J.M.; Ballesteros, J.A. Dendrogeomorphic Analysis of Flash Floods in a Small Ungauged Mountain Catchment (Central Spain). Geomorphology 2010, 118, 383–392. [Google Scholar] [CrossRef]
- Castellarin, A.; Di Baldassarre, G.; Bates, P.D.; Brath, A. Optimal Cross-Sectional Spacing in Preissmann Scheme 1D Hydrodynamic Models. J. Hydraul. Eng. 2009, 135, 96–105. [Google Scholar] [CrossRef]
- Bates, P.D. Remote Sensing and Flood Inundation Modelling. Hydrol. Process. 2004, 18, 2593–2597. [Google Scholar] [CrossRef]
- Chormanski, J.; Okruszko, T.; Ignar, S.; Batelaan, O.; Rebel, K.T.; Wassen, M.J. Flood Mapping with Remote Sensing and Hydrochemistry: A New Method to Distinguish the Origin of Flood Water during Floods. Ecol. Eng. 2011, 37, 1334–1349. [Google Scholar] [CrossRef]
- Domeneghetti, A.; Schumann, G.J.P.; Tarpanelli, A. Preface: Remote Sensing for Flood Mapping and Monitoring of Flood Dynamics. Remote Sens. 2019, 11, 943. [Google Scholar] [CrossRef]
- Notti, D.; Giordan, D.; Caló, F.; Pepe, A.; Zucca, F.; Galve, J.P. Potential and Limitations of Open Satellite Data for Flood Mapping. Remote Sens. 2018, 10, 1673. [Google Scholar] [CrossRef]
- Wilhelm, B.; Cánovas, J.A.B.; Macdonald, N.; Toonen, W.H.J.; Baker, V.; Barriendos, M.; Benito, G.; Brauer, A.; Corella, J.P.; Denniston, R.; et al. Interpreting Historical, Botanical, and Geological Evidence to Aid Preparations for Future Floods. Water 2019, 6, e1318. [Google Scholar] [CrossRef]
- Potter, H.R. The Use of Historic Records for the Augmentation of Hydrological Data; Institute of Hydrology: Roorkee, India, 1978; ISBN 9789004310087. [Google Scholar]
- Bayliss, A.C.; Reed, D.W. The Use of Historical Data in Flood Frequency Estimation; Report to MAFF; Centre for Ecology & Hydrology, Natural Environment Research Council: Oxfordshire, UK, 2001. [Google Scholar]
- Benito, G.; Lang, M.; Barriendos, M.; Llasat, M.C.; Francés, F.; Ouarda, T.; Thorndycraft, V.R.; Enzel, Y.; Bardossy, A.; Coeur, D.; et al. Use of Systematic, Palaeoflood and Historical Data for the Improvement of Flood Risk Estimation. Review of Scientific Method. Nat. Hazards 2004, 31, 623–643. [Google Scholar] [CrossRef]
- Salvati, P.; Bianchi, C.; Rossi, M.; Guzzetti, F. Societal Landslide and Flood Risk in Italy. Nat. Hazards Earth Syst. Sci. 2010, 10, 465–483. [Google Scholar] [CrossRef]
- Sharif, H.O.; Jackson, T.L.; Hossain, M.M.; Zane, D. Analysis of Flood Fatalities in Texas. Nat. Hazards Rev. 2015, 16, 04014016. [Google Scholar] [CrossRef]
- Ashley, S.T.; Ashley, W.S. Flood Fatalities in the United States. J. Appl. Meteorol. Climatol. 2008, 47, 805–818. [Google Scholar] [CrossRef]
- Ruin, I.; Gaillard, J.C.; Lutoff, C. How to Get There? Assessing Motorists’ Flash Flood Risk Perception on Daily Itineraries. Environ. Hazards 2007, 7, 235–244. [Google Scholar] [CrossRef]
- Gruntfest, E.; Carsell, K.; Plush, T. An Evaluation of the Boulder Creek Local Flood Warning System an Evaluation of the Boulder Creek Local Flood Warning System; Report Prepared for Urban Drainage and Flood Control District and Boulder City; County Office of Emergency Management: Springs, CO, USA, 2002. [Google Scholar]
- Haynes, K.; Coates, L.; Leigh, R.; Handmer, J.; Whittaker, J.; Gissing, A.; McAneney, J.; Opper, S. “Shelter-in-Place” vs. Evacuation in Flash Floods. Environ. Hazards 2009, 8, 291–303. [Google Scholar] [CrossRef]
- Papagiannaki, K.; Kotroni, V.; Lagouvardos, K.; Ruin, I.; Bezes, A. Urban Area Response to Flash Flood-Triggering Rainfall, Featuring Human Behavioral Factors: The Case of 22 October 2015 in Attica, Greece. Weather Clim. Soc. 2017, 9, 621–638. [Google Scholar] [CrossRef]
- Diakakis, M.; Priskos, G.; Skordoulis, M. Public Perception of Flood Risk in Flash Flood Prone Areas of Eastern Mediterranean: The Case of Attica Region in Greece. Int. J. Disaster Risk Reduct. 2018, 28, 404–413. [Google Scholar] [CrossRef]
- Mereli, A.; Niki, E.; Psycharis, S.; Drinia, H.; Antonarakou, A.; Mereli, M.; Maria, T. Education of Students from Greek Schools Regarding Natural Disasters through STEAM. Eurasia J. Math. Sci. Technol. Educ. 2023, 19, em2314. [Google Scholar] [CrossRef]
- Mereli, A.; Evelpidou, N.; Antonarakou, A.; Drinia, H.; Mereli, M.; Touxanioti, M. Investigation of the Beliefs and Assessment of the Security Feeling in Primary Education in Greece in Relationship to Rapid Onset Natural Disasters. Int. J. Educ. Res. Rev. 2021, 7, 56–70. [Google Scholar] [CrossRef]
- Anogeiannaki, A. Research on Social Perceptions of Extreme Weather Phenomena (Impacts of Climate Change on the Greek Coastal Zone). Research Area: Hersonisos, Heraklion, Crete. Master’s Thesis, Faculty of Marine Sciences, Aegean University, Rhodes, Greece, 2013. [Google Scholar]
- Papakonstantinou, K. Environmental Psychology: Natural Disasters and Their Impact on People’s Psychology. Master’s Thesis, Faculty of Preschool Education Sciences, Aegean University, Rhodes, Greece, 2015. (In Greek). [Google Scholar]
- Hoyois, P.; Scheuren, J.-M.; Below, R.; Guha-Sapir, D. Annual Disaster Statistical Review: Numbers and Trends 2006; Centre for Research on the Epidimiology of Disasters: Brussels, Belgium, 2007. [Google Scholar]
- Lee, G.; Jun, K.S.; Chung, E.S. Integrated Multi-Criteria Flood Vulnerability Approach Using Fuzzy TOPSIS and Delphi Technique. Nat. Hazards Earth Syst. Sci. 2013, 13, 1293–1312. [Google Scholar] [CrossRef]
- Patrikaki, O.; Kazakis, N.; Kougias, I.; Patsialis, T.; Theodossiou, N.; Voudouris, K. Assessing Flood Hazard at River Basin Scale with an Index-Based Approach: The Case of Mouriki, Greece. Geosciences 2018, 8, 50. [Google Scholar] [CrossRef]
- Guzzetti, F.; Tonelli, G. Information System on Hydrological and Geomorphological Catastrophes in Italy (SICI): A Tool for Managing Landslide and Flood Hazards. Nat. Hazards Earth Syst. Sci. 2004, 4, 213–232. [Google Scholar] [CrossRef]
- Seidel, J.; Imbery, F.; Dostal, P.; Sudhaus, D.; Bürger, K. Potential of Historical Meteorological and Hydrological Data for the Reconstruction of Historical Flood Events-the Example of the 1882 Flood in Southwest Germany. Nat. Hazards Earth Syst. Sci. 2009, 9, 175–183. [Google Scholar] [CrossRef]
- Ban, N.; Schmidli, J.; Schär, C. Heavy Precipitation in a Changing Climate: Does Short-Term Summer Precipitation Increase Faster? Geophys. Res. Lett. 2015, 42, 1165–1172. [Google Scholar] [CrossRef]
- Schulte, L.; Wetter, O.; Wilhelm, B.; Peña, J.C.; Amann, B.; Wirth, S.B.; Carvalho, F.; Gómez-Bolea, A. Integration of Multi-Archive Datasets for the Development of a Four-Dimensional Paleoflood Model of Alpine Catchments. Glob. Planet. Chang. 2019, 180, 66–88. [Google Scholar] [CrossRef]
- Barriendos, M.; Martin-Vide, J. Secular Climatic Oscillations as Indicated by Catastrophic Floods in the Spanish Mediterranean Coastal Area (14th–19th Centuries). Clim. Chang. Kluwer Acad. Publ. 1998, 38, 473–491. [Google Scholar]
- Pfister, C. Klimageschichte der Schweiz 1525–1860, das Klima der Schweiz von 1525–1860 und Seine Bedeutung in der Geschichte von Bevölkerung und Landwirtschaft; Academica Helvetica 6; Verlag Paul Haupt: Bern, Switzerland, 1988. [Google Scholar]
- Alexandre, P. Le Climat en Europe Au Moyen Age. Contribution a L’histoire des Variations Climatiques de 1000 a 1425 Dapres les Sources Narratives de L’europe Occidentale; Ecole des Hautes Etudes en Sciences Sociales: Paris, France, 1987. [Google Scholar]
- Le Roy Ladurie, E. Histoire du Climat Depuis l’an Mil; Flammarion: Paris, France, 1967. [Google Scholar]
- Brázdil, R.; Glaser, R.; Pfister, C.; Dobrovolný, P.; Antoine, J.M.; Barriendos, M.; Camuffo, D.; Deutsch, M.; Enzi, S.; Guidoboni, E.; et al. Flood Events of Selected European Rivers in the Sixteenth Century. Clim. Chang. 1999, 43, 239–285. [Google Scholar] [CrossRef]


| Frequency | 1980–2007 | 2008–2022 |
|---|---|---|
| Annual | 2.89 | −4.17 |
| Winter | 0.55 | −1.50 |
| Spring | 0.25 | −0.17 |
| Summer | 0.25 | 0.00 |
| Autumn | 1.25 | −1.67 |
| Region | Number of Floods | Annual Flood Frequency |
|---|---|---|
| West Macedonia | 24 | 0.18 |
| Northern Aegean | 57 | 0.42 |
| Ionian islands | 64 | 0.47 |
| Southern Aegean | 68 | 0.50 |
| West Greece | 99 | 0.73 |
| Peloponnese | 123 | 0.90 |
| Crete | 117 | 0.86 |
| Epirus | 127 | 0.93 |
| Central Greece | 202 | 1.49 |
| Attica | 210 | 1.54 |
| Thessaly | 223 | 1.64 |
| East Macedonia and Thrace | 267 | 1.96 |
| Central Macedonia | 413 | 3.04 |
| Total | 1994 | 14,66 |
Disclaimer/Publisher’s Note: The statements, opinions and data contained in all publications are solely those of the individual author(s) and contributor(s) and not of MDPI and/or the editor(s). MDPI and/or the editor(s) disclaim responsibility for any injury to people or property resulting from any ideas, methods, instructions or products referred to in the content. |
© 2023 by the authors. Licensee MDPI, Basel, Switzerland. This article is an open access article distributed under the terms and conditions of the Creative Commons Attribution (CC BY) license (https://creativecommons.org/licenses/by/4.0/).
Share and Cite
Evelpidou, N.; Cartalis, C.; Karkani, A.; Saitis, G.; Philippopoulos, K.; Spyrou, E. A GIS-Based Assessment of Flood Hazard through Track Records over the 1886–2022 Period in Greece. Climate 2023, 11, 226. https://doi.org/10.3390/cli11110226
Evelpidou N, Cartalis C, Karkani A, Saitis G, Philippopoulos K, Spyrou E. A GIS-Based Assessment of Flood Hazard through Track Records over the 1886–2022 Period in Greece. Climate. 2023; 11(11):226. https://doi.org/10.3390/cli11110226
Chicago/Turabian StyleEvelpidou, Niki, Constantinos Cartalis, Anna Karkani, Giannis Saitis, Kostas Philippopoulos, and Evangelos Spyrou. 2023. "A GIS-Based Assessment of Flood Hazard through Track Records over the 1886–2022 Period in Greece" Climate 11, no. 11: 226. https://doi.org/10.3390/cli11110226